小米Max 3智能手机评测


| Networking | |
| iperf3 transmit AX12 | |
| Sony Xperia XA2 Plus | |
| Asus Zenfone 5 ZE620KL | |
| Xiaomi Mi Max 3 | |
| JVC J20 | |
| Honor Play | |
| iperf3 receive AX12 | |
| Xiaomi Mi Max 3 | |
| Asus Zenfone 5 ZE620KL | |
| Sony Xperia XA2 Plus | |
| JVC J20 | |
| Honor Play | |


| |||||||||||||||||||||||||
Brightness Distribution: 91 %
Center on Battery: 508 cd/m²
Contrast: 1814:1 (Black: 0.28 cd/m²)
ΔE ColorChecker Calman: 2.85 | ∀{0.5-29.43 Ø4.73}
ΔE Greyscale Calman: 1.7 | ∀{0.09-98 Ø4.97}
99.7% sRGB (Calman 2D)
Gamma: 2.226
CCT: 6860 K
| Xiaomi Mi Max 3 IPS, 2160x1080, 6.9" | Sony Xperia XA2 Plus IPS, 2160x1080, 6" | Honor Play IPS, 2340x1080, 6.3" | JVC J20 IPS, 2160x1080, 5.7" | Asus Zenfone 5 ZE620KL IPS, 2246x1080, 6.2" | |
|---|---|---|---|---|---|
| Screen | -6% | -31% | -134% | -41% | |
| Brightness middle (cd/m²) | 508 | 597 18% | 435 -14% | 411 -19% | 595 17% |
| Brightness (cd/m²) | 505 | 592 17% | 426 -16% | 426 -16% | 561 11% |
| Brightness Distribution (%) | 91 | 92 1% | 89 -2% | 82 -10% | 87 -4% |
| Black Level * (cd/m²) | 0.28 | 0.32 -14% | 0.39 -39% | 0.53 -89% | 0.54 -93% |
| Contrast (:1) | 1814 | 1866 3% | 1115 -39% | 775 -57% | 1102 -39% |
| Colorchecker dE 2000 * | 2.85 | 2.4 16% | 2.89 -1% | 8.84 -210% | 4.2 -47% |
| Colorchecker dE 2000 max. * | 6.21 | 5.3 15% | 6.03 3% | 15.08 -143% | 6 3% |
| Greyscale dE 2000 * | 1.7 | 3.4 -100% | 4.1 -141% | 10.7 -529% | 4.7 -176% |
| Gamma | 2.226 99% | 2.2 100% | 2.251 98% | 2.433 90% | 2.12 104% |
| CCT | 6860 95% | 7172 91% | 7408 88% | 10717 61% | 7577 86% |
* ... smaller is better
Screen Flickering / PWM (Pulse-Width Modulation)
| Screen flickering / PWM detected | 2358 Hz | ≤ 10 % brightness setting | 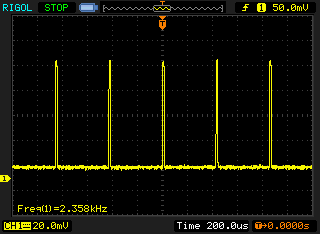 |
The display backlight flickers at 2358 Hz (worst case, e.g., utilizing PWM) Flickering detected at a brightness setting of 10 % and below. There should be no flickering or PWM above this brightness setting. The frequency of 2358 Hz is quite high, so most users sensitive to PWM should not notice any flickering. In comparison: 52 % of all tested devices do not use PWM to dim the display. If PWM was detected, an average of 7798 (minimum: 5 - maximum: 343500) Hz was measured. | |||
Display Response Times
| ↔ Response Time Black to White | ||
|---|---|---|
| 22 ms ... rise ↗ and fall ↘ combined | ↗ 9 ms rise | 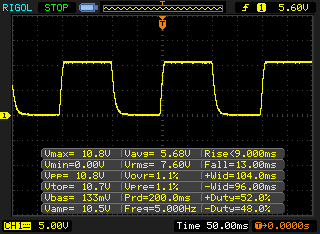 |
| ↘ 13 ms fall | ||
| The screen shows good response rates in our tests, but may be too slow for competitive gamers. In comparison, all tested devices range from 0.1 (minimum) to 240 (maximum) ms. » 48 % of all devices are better. This means that the measured response time is worse than the average of all tested devices (19.9 ms). | ||
| ↔ Response Time 50% Grey to 80% Grey | ||
| 45 ms ... rise ↗ and fall ↘ combined | ↗ 22 ms rise | 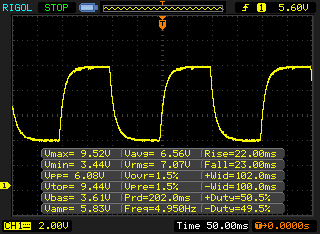 |
| ↘ 23 ms fall | ||
| The screen shows slow response rates in our tests and will be unsatisfactory for gamers. In comparison, all tested devices range from 0.165 (minimum) to 636 (maximum) ms. » 77 % of all devices are better. This means that the measured response time is worse than the average of all tested devices (31.1 ms). | ||
| AnTuTu v6 - Total Score (sort by value) | |
| Xiaomi Mi Max 3 | |
| Sony Xperia XA2 Plus | |
| Honor Play | |
| JVC J20 | |
| Asus Zenfone 5 ZE620KL | |
| Average Qualcomm Snapdragon 636 (92015 - 125213, n=10) | |
| AnTuTu v7 - Total Score (sort by value) | |
| Xiaomi Mi Max 3 | |
| Sony Xperia XA2 Plus | |
| Honor Play | |
| JVC J20 | |
| Asus Zenfone 5 ZE620KL | |
| Average Qualcomm Snapdragon 636 (115565 - 138661, n=11) | |
| PCMark for Android - Work performance score (sort by value) | |
| Xiaomi Mi Max 3 | |
| Sony Xperia XA2 Plus | |
| Honor Play | |
| JVC J20 | |
| Asus Zenfone 5 ZE620KL | |
| Average Qualcomm Snapdragon 636 (6040 - 7618, n=11) | |
| GFXBench (DX / GLBenchmark) 2.7 | |
| T-Rex Onscreen (sort by value) | |
| Xiaomi Mi Max 3 | |
| Sony Xperia XA2 Plus | |
| Honor Play | |
| JVC J20 | |
| Asus Zenfone 5 ZE620KL | |
| Average Qualcomm Snapdragon 636 (30 - 40, n=12) | |
| Average of class Smartphone (12 - 166, n=128, last 2 years) | |
| 1920x1080 T-Rex Offscreen (sort by value) | |
| Xiaomi Mi Max 3 | |
| Sony Xperia XA2 Plus | |
| Honor Play | |
| JVC J20 | |
| Asus Zenfone 5 ZE620KL | |
| Average Qualcomm Snapdragon 636 (35 - 36, n=12) | |
| Average of class Smartphone (22 - 954, n=128, last 2 years) | |
| GFXBench 3.0 | |
| on screen Manhattan Onscreen OGL (sort by value) | |
| Xiaomi Mi Max 3 | |
| Sony Xperia XA2 Plus | |
| Honor Play | |
| JVC J20 | |
| Asus Zenfone 5 ZE620KL | |
| Average Qualcomm Snapdragon 636 (13 - 18, n=12) | |
| Average of class Smartphone (18 - 166, n=129, last 2 years) | |
| 1920x1080 1080p Manhattan Offscreen (sort by value) | |
| Xiaomi Mi Max 3 | |
| Sony Xperia XA2 Plus | |
| Honor Play | |
| JVC J20 | |
| Asus Zenfone 5 ZE620KL | |
| Average Qualcomm Snapdragon 636 (16 - 16, n=12) | |
| Average of class Smartphone (14 - 606, n=128, last 2 years) | |
| GFXBench 3.1 | |
| on screen Manhattan ES 3.1 Onscreen (sort by value) | |
| Xiaomi Mi Max 3 | |
| Sony Xperia XA2 Plus | |
| Honor Play | |
| JVC J20 | |
| Asus Zenfone 5 ZE620KL | |
| Average Qualcomm Snapdragon 636 (5.7 - 12, n=12) | |
| Average of class Smartphone (11 - 166, n=129, last 2 years) | |
| 1920x1080 Manhattan ES 3.1 Offscreen (sort by value) | |
| Xiaomi Mi Max 3 | |
| Sony Xperia XA2 Plus | |
| Honor Play | |
| JVC J20 | |
| Asus Zenfone 5 ZE620KL | |
| Average Qualcomm Snapdragon 636 (6.3 - 10, n=12) | |
| Average of class Smartphone (8.6 - 413, n=128, last 2 years) | |
| GFXBench | |
| on screen Car Chase Onscreen (sort by value) | |
| Xiaomi Mi Max 3 | |
| Sony Xperia XA2 Plus | |
| Honor Play | |
| JVC J20 | |
| Asus Zenfone 5 ZE620KL | |
| Average Qualcomm Snapdragon 636 (5.1 - 7.4, n=12) | |
| Average of class Smartphone (6.7 - 154, n=133, last 2 years) | |
| 1920x1080 Car Chase Offscreen (sort by value) | |
| Xiaomi Mi Max 3 | |
| Sony Xperia XA2 Plus | |
| Honor Play | |
| JVC J20 | |
| Asus Zenfone 5 ZE620KL | |
| Average Qualcomm Snapdragon 636 (6.3 - 6.3, n=12) | |
| Average of class Smartphone (5.3 - 241, n=133, last 2 years) | |
| JetStream 1.1 - 1.1 Total | |
| Asus Zenfone 5 ZE620KL (Chrome 67) | |
| Average Qualcomm Snapdragon 636 (44.2 - 51.5, n=11) | |
| Xiaomi Mi Max 3 (Chrome 69) | |
| Honor Play (Chrome 68) | |
| JVC J20 (Chrome 68) | |
| Sony Xperia XA2 Plus (Chrome 67) | |
| Octane V2 - Total Score | |
| Average of class Smartphone (2800 - 126661, n=157, last 2 years) | |
| Asus Zenfone 5 ZE620KL (Chrome 67) | |
| Average Qualcomm Snapdragon 636 (8163 - 9746, n=12) | |
| Xiaomi Mi Max 3 (Chrome 69) | |
| Honor Play (Chrome 68) | |
| JVC J20 (Chrome 68) | |
| Sony Xperia XA2 Plus (Chrome 67) | |
| Mozilla Kraken 1.1 - Total | |
| Sony Xperia XA2 Plus (Chrome 67) | |
| JVC J20 (Chrome 68) | |
| Honor Play (Chrome 68) | |
| Average Qualcomm Snapdragon 636 (4105 - 5066, n=12) | |
| Xiaomi Mi Max 3 (Chrome 69) | |
| Asus Zenfone 5 ZE620KL (Chrome 67) | |
| Average of class Smartphone (257 - 28190, n=135, last 2 years) | |
| WebXPRT 2015 - Overall | |
| Average Qualcomm Snapdragon 636 (147 - 184, n=8) | |
| Xiaomi Mi Max 3 (Chrome 69) | |
| Honor Play (Chrome 68) | |
| Sony Xperia XA2 Plus (Chrome 67) | |
* ... smaller is better
| Xiaomi Mi Max 3 | Sony Xperia XA2 Plus | Honor Play | JVC J20 | Asus Zenfone 5 ZE620KL | Average 64 GB eMMC Flash | Average of class Smartphone | |
|---|---|---|---|---|---|---|---|
| AndroBench 3-5 | -15% | 70% | -17% | 3% | -15% | 576% | |
| Sequential Read 256KB (MB/s) | 274.6 | 281.1 2% | 895 226% | 270.6 -1% | 286.6 4% | 278 ? 1% | 2251 ? 720% |
| Sequential Write 256KB (MB/s) | 185.4 | 146.2 -21% | 188.3 2% | 199.7 8% | 201.8 9% | 178.6 ? -4% | 1932 ? 942% |
| Random Read 4KB (MB/s) | 72.9 | 77.4 6% | 142.4 95% | 58.3 -20% | 71.2 -2% | 60.9 ? -16% | 310 ? 325% |
| Random Write 4KB (MB/s) | 87.1 | 10.5 -88% | 155.5 79% | 6.3 -93% | 83.5 -4% | 34.2 ? -61% | 362 ? 316% |
| Sequential Read 256KB SDCard (MB/s) | 83.8 ? | 86 ? 3% | 82.8 ? -1% | 82.8 ? -1% | 85.8 ? 2% | 77.4 ? -8% | |
| Sequential Write 256KB SDCard (MB/s) | 60.3 ? | 67 ? 11% | 71.9 ? 19% | 63 ? 4% | 65.2 ? 8% | 58.3 ? -3% |
(+) The maximum temperature on the upper side is 32.3 °C / 90 F, compared to the average of 35.3 °C / 96 F, ranging from 21.9 to 247 °C for the class Smartphone.
(+) The bottom heats up to a maximum of 30.5 °C / 87 F, compared to the average of 34 °C / 93 F
(+) In idle usage, the average temperature for the upper side is 27.3 °C / 81 F, compared to the device average of 32.9 °C / 91 F.
Xiaomi Mi Max 3 audio analysis
(±) | speaker loudness is average but good (78.6 dB)
Bass 100 - 315 Hz
(-) | nearly no bass - on average 24.7% lower than median
(±) | linearity of bass is average (12.4% delta to prev. frequency)
Mids 400 - 2000 Hz
(±) | higher mids - on average 5.9% higher than median
(+) | mids are linear (5.9% delta to prev. frequency)
Highs 2 - 16 kHz
(+) | balanced highs - only 3.3% away from median
(+) | highs are linear (3.4% delta to prev. frequency)
Overall 100 - 16.000 Hz
(±) | linearity of overall sound is average (24.3% difference to median)
Compared to same class
» 58% of all tested devices in this class were better, 7% similar, 35% worse
» The best had a delta of 11%, average was 34%, worst was 134%
Compared to all devices tested
» 74% of all tested devices were better, 6% similar, 21% worse
» The best had a delta of 4%, average was 24%, worst was 134%
Sony Xperia XA2 Plus audio analysis
(+) | speakers can play relatively loud (84.7 dB)
Bass 100 - 315 Hz
(-) | nearly no bass - on average 30.7% lower than median
(±) | linearity of bass is average (10.6% delta to prev. frequency)
Mids 400 - 2000 Hz
(+) | balanced mids - only 4.8% away from median
(+) | mids are linear (5.7% delta to prev. frequency)
Highs 2 - 16 kHz
(±) | higher highs - on average 6.6% higher than median
(+) | highs are linear (2.2% delta to prev. frequency)
Overall 100 - 16.000 Hz
(±) | linearity of overall sound is average (24.5% difference to median)
Compared to same class
» 59% of all tested devices in this class were better, 7% similar, 34% worse
» The best had a delta of 11%, average was 34%, worst was 134%
Compared to all devices tested
» 74% of all tested devices were better, 6% similar, 20% worse
» The best had a delta of 4%, average was 24%, worst was 134%
| Off / Standby | |
| Idle | |
| Load |
|
Key:
min: | |
| Xiaomi Mi Max 3 5500 mAh | Sony Xperia XA2 Plus 3580 mAh | Honor Play 3750 mAh | JVC J20 3400 mAh | Asus Zenfone 5 ZE620KL 3300 mAh | Average Qualcomm Snapdragon 636 | Average of class Smartphone | |
|---|---|---|---|---|---|---|---|
| Power Consumption | 17% | -73% | -15% | -134% | -26% | -30% | |
| Idle Minimum * (Watt) | 0.7 | 0.35 50% | 1.4 -100% | 1 -43% | 1.75 -150% | 0.944 ? -35% | 0.875 ? -25% |
| Idle Average * (Watt) | 1.5 | 1.81 -21% | 2.6 -73% | 1.6 -7% | 4.48 -199% | 2.22 ? -48% | 1.47 ? 2% |
| Idle Maximum * (Watt) | 2.2 | 1.83 17% | 4.3 -95% | 2.8 -27% | 4.5 -105% | 2.54 ? -15% | 1.659 ? 25% |
| Load Average * (Watt) | 3.8 | 3.31 13% | 6.5 -71% | 4 -5% | 7.92 -108% | 4.51 ? -19% | 6.8 ? -79% |
| Load Maximum * (Watt) | 6.5 | 4.97 24% | 8.2 -26% | 5.9 9% | 13.62 -110% | 7.37 ? -13% | 11.3 ? -74% |
* ... smaller is better
| Xiaomi Mi Max 3 5500 mAh | Sony Xperia XA2 Plus 3580 mAh | Honor Play 3750 mAh | JVC J20 3400 mAh | Asus Zenfone 5 ZE620KL 3300 mAh | |
|---|---|---|---|---|---|
| Battery runtime | |||||
| WiFi v1.3 (h) | 21.8 | 14 -36% | 11.8 -46% | 12.1 -44% | 8.3 -62% |
Pros
Cons

在我们的测试中,小米Max 3在一个方面远超竞争对手:它的尺寸。而在其他方面来看,这也是一款拥有性能良好的的中端设备,这使得它在同类智能手机中有着稳固的地位。凭借其可圈可点的相机,蓝牙5.0以及优秀的WLAN传输速度,这台安卓平板手机在各方面都表现得很均衡。
“小米Max 3是一台以超大屏幕来说服消费者的高性能手机。”
在用户友好程度上,感兴趣的买家不仅仅需要在意6.9英寸的巨大屏幕,同时对于一些海外用户来说,谷歌市场并没有被包括在MIUI中,而是需要进行单独的安装。
Xiaomi Mi Max 3
- 10/16/2018 v6 (old)
Mike Wobker
Price comparison
