联想ThinkPad X1 Carbon 2019 WQHD笔记本电脑评测:仍然是商务本标杆?
| |||||||||||||||||||||||||
Brightness Distribution: 88 %
Center on Battery: 337 cd/m²
Contrast: 786:1 (Black: 0.43 cd/m²)
ΔE ColorChecker Calman: 4 | ∀{0.5-29.43 Ø4.71}
calibrated: 1.7
ΔE Greyscale Calman: 6.2 | ∀{0.09-98 Ø4.96}
97.8% sRGB (Argyll 1.6.3 3D)
68.1% AdobeRGB 1998 (Argyll 1.6.3 3D)
73.8% AdobeRGB 1998 (Argyll 3D)
97.8% sRGB (Argyll 3D)
72.5% Display P3 (Argyll 3D)
Gamma: 2.13
CCT: 6787 K
| Lenovo ThinkPad X1 Carbon 2019-20QE000VGE LP140QH2-SPD1, , 2560x1440, 14" | Lenovo ThinkPad X1 Carbon 2018-20KGS5DU00 LP140QH2-SPB1, , 2560x1440, 14" | Lenovo ThinkPad X1 Carbon G6-20KG0025UK Lenovo LEN40A9 / AUO B140HAK02.3, , 1920x1080, 14" | Lenovo ThinkPad X1 Carbon 2018-20KGS03900 B140QAN02.0, , 2560x1440, 14" | Lenovo ThinkPad T490s-20NYS02A00 B140HAN05.7, , 1920x1080, 14" | HP Elitebook x360 1040 G5 AU Optronics AUO533D, , 1920x1080, 14" | Dell Latitude 7490 AUO503D (D04YD_B140HAN), , 1920x1080, 14" | |
|---|---|---|---|---|---|---|---|
| Display | 0% | -5% | 19% | -5% | -9% | -6% | |
| Display P3 Coverage (%) | 72.5 | 72.7 0% | 68.3 -6% | 87.7 21% | 67.1 -7% | 64.3 -11% | 66.6 -8% |
| sRGB Coverage (%) | 97.8 | 97.9 0% | 94.9 -3% | 100 2% | 97.6 0% | 94.1 -4% | 96.8 -1% |
| AdobeRGB 1998 Coverage (%) | 73.8 | 74.6 1% | 69.3 -6% | 99.9 35% | 68.5 -7% | 65.5 -11% | 67.9 -8% |
| Response Times | -11% | -12% | -60% | -73% | -77% | -29% | |
| Response Time Grey 50% / Grey 80% * (ms) | 33.6 ? | 38 ? -13% | 40 ? -19% | 59.2 ? -76% | 61.6 ? -83% | 70.8 ? -111% | 41.6 ? -24% |
| Response Time Black / White * (ms) | 24 ? | 26 ? -8% | 25 ? -4% | 34.4 ? -43% | 38.8 ? -62% | 34.4 ? -43% | 32 ? -33% |
| PWM Frequency (Hz) | 735 ? | ||||||
| Screen | -4% | 25% | 44% | 29% | 23% | -1% | |
| Brightness middle (cd/m²) | 338 | 316 -7% | 298 -12% | 578 71% | 391 16% | 416.3 23% | 308.6 -9% |
| Brightness (cd/m²) | 315 | 311 -1% | 287 -9% | 533 69% | 389 23% | 400 27% | 294 -7% |
| Brightness Distribution (%) | 88 | 84 -5% | 91 3% | 84 -5% | 87 -1% | 89 1% | 89 1% |
| Black Level * (cd/m²) | 0.43 | 0.35 19% | 0.2 53% | 0.38 12% | 0.23 47% | 0.29 33% | 0.23 47% |
| Contrast (:1) | 786 | 903 15% | 1490 90% | 1521 94% | 1700 116% | 1436 83% | 1342 71% |
| Colorchecker dE 2000 * | 4 | 4.5 -13% | 2.19 45% | 1.9 52% | 3.4 15% | 2.69 33% | 6.07 -52% |
| Colorchecker dE 2000 max. * | 7.9 | 10.3 -30% | 4.39 44% | 3.8 52% | 4.7 41% | 4.95 37% | 10.58 -34% |
| Colorchecker dE 2000 calibrated * | 1.7 | 1.6 6% | 1.67 2% | 0.8 53% | 1.1 35% | 2.13 -25% | 1.67 2% |
| Greyscale dE 2000 * | 6.2 | 7.7 -24% | 1.97 68% | 3 52% | 4 35% | 2.9 53% | 7.3 -18% |
| Gamma | 2.13 103% | 2.2 100% | 2.43 91% | 2.14 103% | 2.49 88% | 2.4 92% | 2.061 107% |
| CCT | 6787 96% | 6639 98% | 6571 99% | 6377 102% | 6809 95% | 6623 98% | 7269 89% |
| Color Space (Percent of AdobeRGB 1998) (%) | 68.1 | 68.6 1% | 62 -9% | 88.8 30% | 62.4 -8% | 60.1 -12% | 62 -9% |
| Color Space (Percent of sRGB) (%) | 97.8 | 97.9 0% | 95 -3% | 100 2% | 97.4 0% | 94.5 -3% | 97 -1% |
| Total Average (Program / Settings) | -5% /
-4% | 3% /
15% | 1% /
26% | -16% /
10% | -21% /
4% | -12% /
-5% |
* ... smaller is better
Display Response Times
| ↔ Response Time Black to White | ||
|---|---|---|
| 24 ms ... rise ↗ and fall ↘ combined | ↗ 12.4 ms rise | 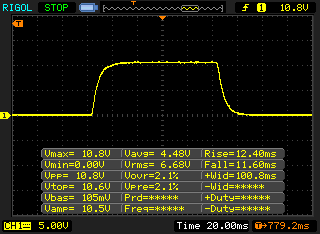 |
| ↘ 11.6 ms fall | ||
| The screen shows good response rates in our tests, but may be too slow for competitive gamers. In comparison, all tested devices range from 0.1 (minimum) to 240 (maximum) ms. » 54 % of all devices are better. This means that the measured response time is worse than the average of all tested devices (19.8 ms). | ||
| ↔ Response Time 50% Grey to 80% Grey | ||
| 33.6 ms ... rise ↗ and fall ↘ combined | ↗ 16.4 ms rise | 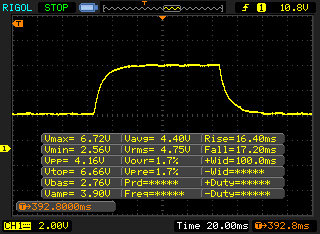 |
| ↘ 17.2 ms fall | ||
| The screen shows slow response rates in our tests and will be unsatisfactory for gamers. In comparison, all tested devices range from 0.165 (minimum) to 636 (maximum) ms. » 46 % of all devices are better. This means that the measured response time is similar to the average of all tested devices (31 ms). | ||
Screen Flickering / PWM (Pulse-Width Modulation)
| Screen flickering / PWM not detected | 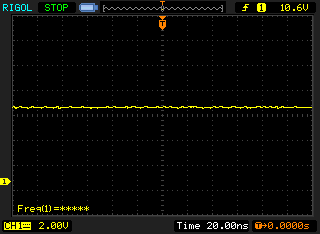 | ||
In comparison: 52 % of all tested devices do not use PWM to dim the display. If PWM was detected, an average of 7757 (minimum: 5 - maximum: 343500) Hz was measured. | |||
| Cinebench R15 | |
| CPU Single 64Bit | |
| Average of class Office (99.5 - 316, n=77, last 2 years) | |
| Lenovo ThinkPad X1 Carbon 2019-20QE000VGE | |
| Average Intel Core i7-8665U (143 - 199, n=7) | |
| HP Elitebook x360 1040 G5 | |
| Lenovo ThinkPad X1 Carbon 2018-20KGS03900 | |
| Lenovo ThinkPad X1 Carbon 2018-20KGS5DU00 | |
| Lenovo ThinkPad T490s-20NYS02A00 | |
| Dell Latitude 7490 | |
| Lenovo ThinkPad X1 Carbon G6-20KG0025UK | |
| CPU Multi 64Bit | |
| Average of class Office (250 - 3380, n=77, last 2 years) | |
| Lenovo ThinkPad X1 Carbon 2018-20KGS03900 (undervolted) | |
| Lenovo ThinkPad X1 Carbon 2018-20KGS03900 | |
| Lenovo ThinkPad X1 Carbon 2019-20QE000VGE | |
| Lenovo ThinkPad T490s-20NYS02A00 | |
| Lenovo ThinkPad X1 Carbon 2018-20KGS5DU00 | |
| Lenovo ThinkPad X1 Carbon G6-20KG0025UK | |
| Average Intel Core i7-8665U (458 - 701, n=7) | |
| Dell Latitude 7490 | |
| HP Elitebook x360 1040 G5 | |
| PCMark 8 | |
| Home Score Accelerated v2 | |
| Average of class Office (n=1last 2 years) | |
| Lenovo ThinkPad T490s-20NYS02A00 | |
| Lenovo ThinkPad X1 Carbon 2019-20QE000VGE | |
| Average Intel Core i7-8665U, Intel UHD Graphics 620 (3547 - 4211, n=6) | |
| Lenovo ThinkPad X1 Carbon 2018-20KGS5DU00 | |
| Lenovo ThinkPad X1 Carbon 2018-20KGS03900 | |
| Dell Latitude 7490 | |
| Lenovo ThinkPad X1 Carbon G6-20KG0025UK | |
| HP Elitebook x360 1040 G5 | |
| Work Score Accelerated v2 | |
| Average of class Office (n=1last 2 years) | |
| Lenovo ThinkPad T490s-20NYS02A00 | |
| Dell Latitude 7490 | |
| Average Intel Core i7-8665U, Intel UHD Graphics 620 (4696 - 5195, n=5) | |
| Lenovo ThinkPad X1 Carbon 2019-20QE000VGE | |
| Lenovo ThinkPad X1 Carbon 2018-20KGS03900 | |
| Lenovo ThinkPad X1 Carbon G6-20KG0025UK | |
| HP Elitebook x360 1040 G5 | |
| Lenovo ThinkPad X1 Carbon 2018-20KGS5DU00 | |
| PCMark 8 Home Score Accelerated v2 | 3823 points | |
| PCMark 8 Creative Score Accelerated v2 | 5120 points | |
| PCMark 8 Work Score Accelerated v2 | 4696 points | |
| PCMark 10 Score | 4005 points | |
Help | ||
Noise level
| Idle |
| 28.4 / 28.4 / 28.6 dB(A) |
| Load |
| 31.5 / 33.1 dB(A) |
 | ||
30 dB silent 40 dB(A) audible 50 dB(A) loud |
||
min: | ||
| Lenovo ThinkPad X1 Carbon 2019-20QE000VGE UHD Graphics 620, i7-8665U, WDC PC SN720 SDAQNTW-512G | Lenovo ThinkPad X1 Carbon G6-20KG0025UK UHD Graphics 620, i5-8350U, Lenovo LENSE20256GMSP34MEAT2TA | Lenovo ThinkPad X1 Carbon 2018-20KGS03900 UHD Graphics 620, i5-8550U, Samsung SSD PM981 MZVLB512HAJQ | Lenovo ThinkPad T490s-20NYS02A00 UHD Graphics 620, i5-8265U, Intel SSD Pro 7600p SSDPEKKF512G8L | HP Elitebook x360 1040 G5 UHD Graphics 620, i7-8650U, Samsung SSD PM981 MZVLB512HAJQ | Dell Latitude 7490 UHD Graphics 620, i5-8350U, Toshiba KSG60ZMV256G | |
|---|---|---|---|---|---|---|
| Noise | -4% | -6% | -5% | -2% | -2% | |
| off / environment * (dB) | 28.4 | 30.25 -7% | 28.9 -2% | 29.4 -4% | 28.3 -0% | 28.2 1% |
| Idle Minimum * (dB) | 28.4 | 30.25 -7% | 28.9 -2% | 29.4 -4% | 28.3 -0% | 28.2 1% |
| Idle Average * (dB) | 28.4 | 30.25 -7% | 28.9 -2% | 29.4 -4% | 28.3 -0% | 28.2 1% |
| Idle Maximum * (dB) | 28.6 | 30.25 -6% | 32.5 -14% | 30.9 -8% | 28.3 1% | 28.7 -0% |
| Load Average * (dB) | 31.5 | 31.3 1% | 35.1 -11% | 33.3 -6% | 32.6 -3% | 29.9 5% |
| Load Maximum * (dB) | 33.1 | 31.3 5% | 35.1 -6% | 33.3 -1% | 36.6 -11% | 40.2 -21% |
* ... smaller is better
(-) The maximum temperature on the upper side is 47.9 °C / 118 F, compared to the average of 34.3 °C / 94 F, ranging from 21.2 to 62.5 °C for the class Office.
(-) The bottom heats up to a maximum of 45.9 °C / 115 F, compared to the average of 36.8 °C / 98 F
(+) In idle usage, the average temperature for the upper side is 23.9 °C / 75 F, compared to the device average of 29.5 °C / 85 F.
(+) The palmrests and touchpad are cooler than skin temperature with a maximum of 30.7 °C / 87.3 F and are therefore cool to the touch.
(-) The average temperature of the palmrest area of similar devices was 27.5 °C / 81.5 F (-3.2 °C / -5.8 F).
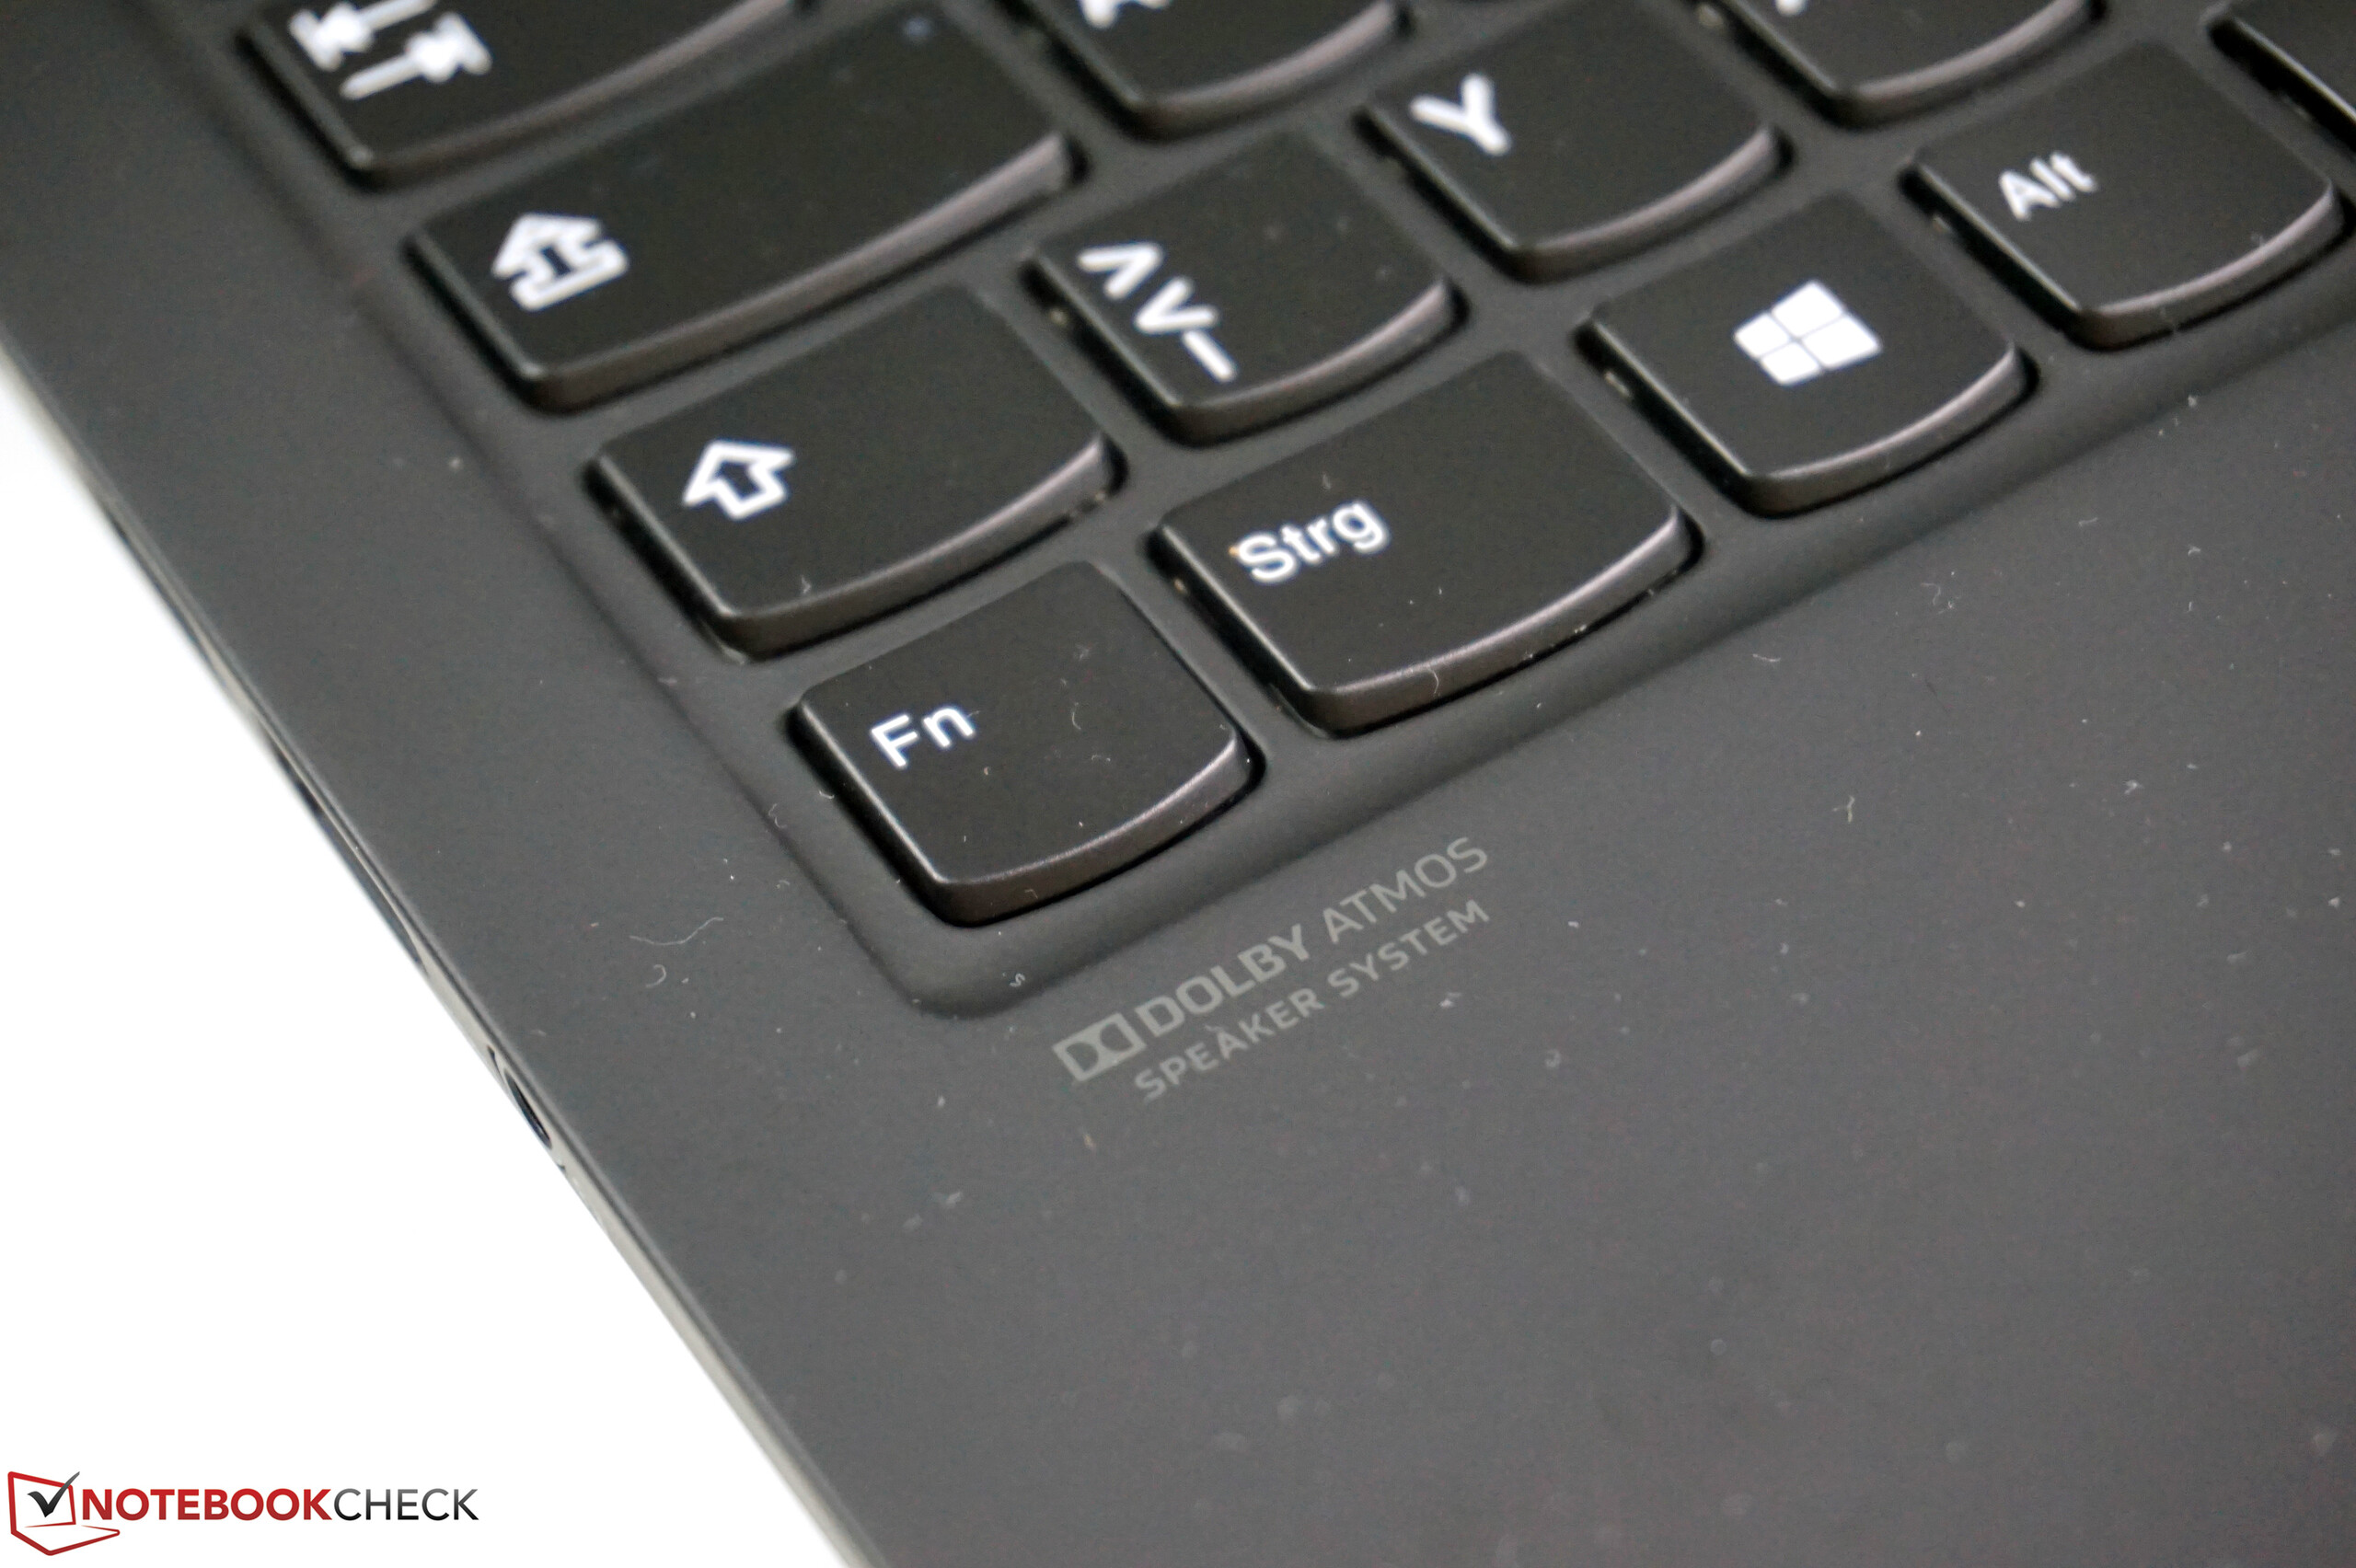
Lenovo ThinkPad X1 Carbon 2019-20QE000VGE audio analysis
(±) | speaker loudness is average but good (76.8 dB)
Bass 100 - 315 Hz
(±) | reduced bass - on average 11.2% lower than median
(±) | linearity of bass is average (7.1% delta to prev. frequency)
Mids 400 - 2000 Hz
(±) | higher mids - on average 5.1% higher than median
(+) | mids are linear (5.4% delta to prev. frequency)
Highs 2 - 16 kHz
(+) | balanced highs - only 2.9% away from median
(±) | linearity of highs is average (9.1% delta to prev. frequency)
Overall 100 - 16.000 Hz
(±) | linearity of overall sound is average (16.7% difference to median)
Compared to same class
» 22% of all tested devices in this class were better, 7% similar, 71% worse
» The best had a delta of 7%, average was 21%, worst was 53%
Compared to all devices tested
» 29% of all tested devices were better, 7% similar, 64% worse
» The best had a delta of 4%, average was 23%, worst was 134%
Lenovo ThinkPad X1 Carbon 2018-20KGS03900 audio analysis
(+) | speakers can play relatively loud (83.6 dB)
Bass 100 - 315 Hz
(-) | nearly no bass - on average 25.9% lower than median
(±) | linearity of bass is average (9.8% delta to prev. frequency)
Mids 400 - 2000 Hz
(+) | balanced mids - only 3.8% away from median
(±) | linearity of mids is average (9% delta to prev. frequency)
Highs 2 - 16 kHz
(+) | balanced highs - only 2.1% away from median
(+) | highs are linear (4% delta to prev. frequency)
Overall 100 - 16.000 Hz
(±) | linearity of overall sound is average (18.7% difference to median)
Compared to same class
» 35% of all tested devices in this class were better, 6% similar, 59% worse
» The best had a delta of 7%, average was 21%, worst was 53%
Compared to all devices tested
» 43% of all tested devices were better, 8% similar, 49% worse
» The best had a delta of 4%, average was 23%, worst was 134%
| Lenovo ThinkPad X1 Carbon 2019-20QE000VGE i7-8665U, UHD Graphics 620, 51 Wh, 2560x1440 | Lenovo ThinkPad X1 Carbon 2018-20KGS5DU00 i5-8550U, UHD Graphics 620, 57 Wh, 2560x1440 | Lenovo ThinkPad X1 Carbon G6-20KG0025UK i5-8350U, UHD Graphics 620, 57 Wh, 1920x1080 | Lenovo ThinkPad X1 Carbon 2018-20KGS03900 i5-8550U, UHD Graphics 620, 57 Wh, 2560x1440 | Lenovo ThinkPad T490s-20NYS02A00 i5-8265U, UHD Graphics 620, 57 Wh, 1920x1080 | HP Elitebook x360 1040 G5 i7-8650U, UHD Graphics 620, 56 Wh, 1920x1080 | Dell Latitude 7490 i5-8350U, UHD Graphics 620, 60 Wh, 1920x1080 | Average of class Office | |
|---|---|---|---|---|---|---|---|---|
| Battery runtime | 10% | 25% | 10% | 29% | 74% | 11% | 49% | |
| H.264 (h) | 9.8 | 11 12% | 9.4 -4% | 13.9 42% | 15.5 ? 58% | |||
| WiFi v1.3 (h) | 8.2 | 9 10% | 10.4 27% | 8.7 6% | 10.1 23% | 10.4 27% | 9.1 11% | 13.2 ? 61% |
| Load (h) | 1.4 | 1.9 36% | 1.8 29% | 1.7 21% | 3.1 121% | 1.808 ? 29% |
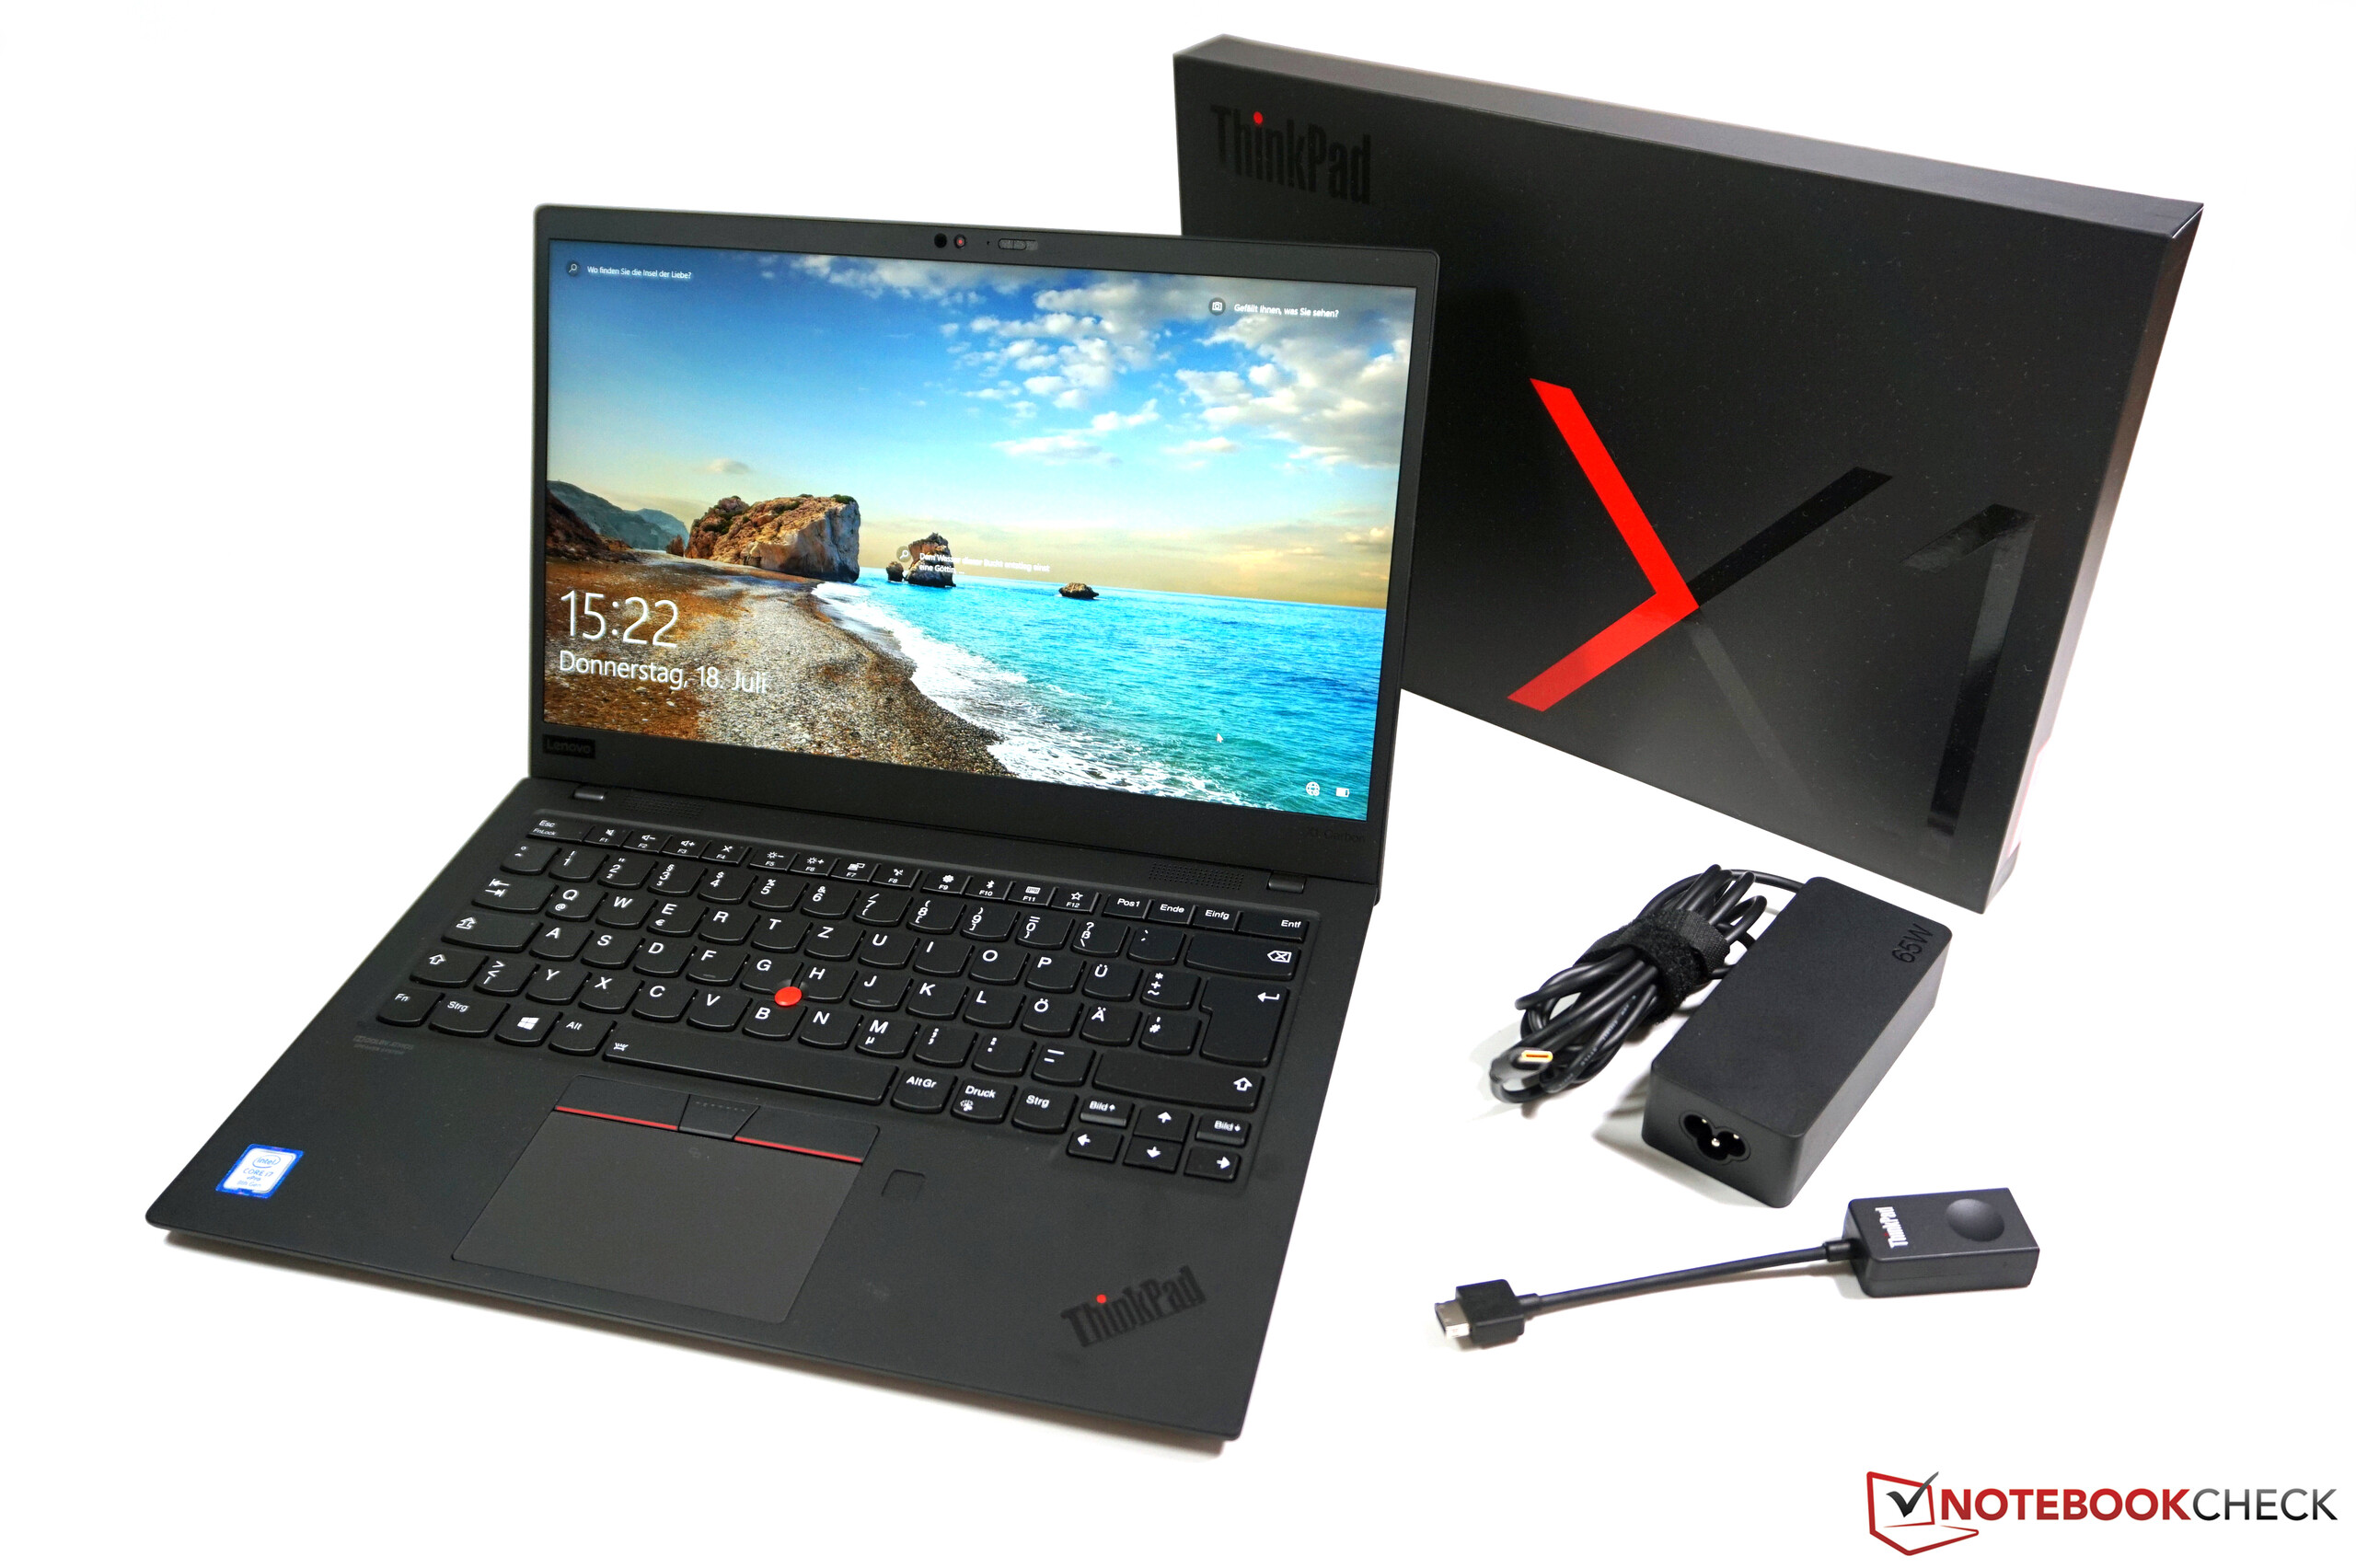
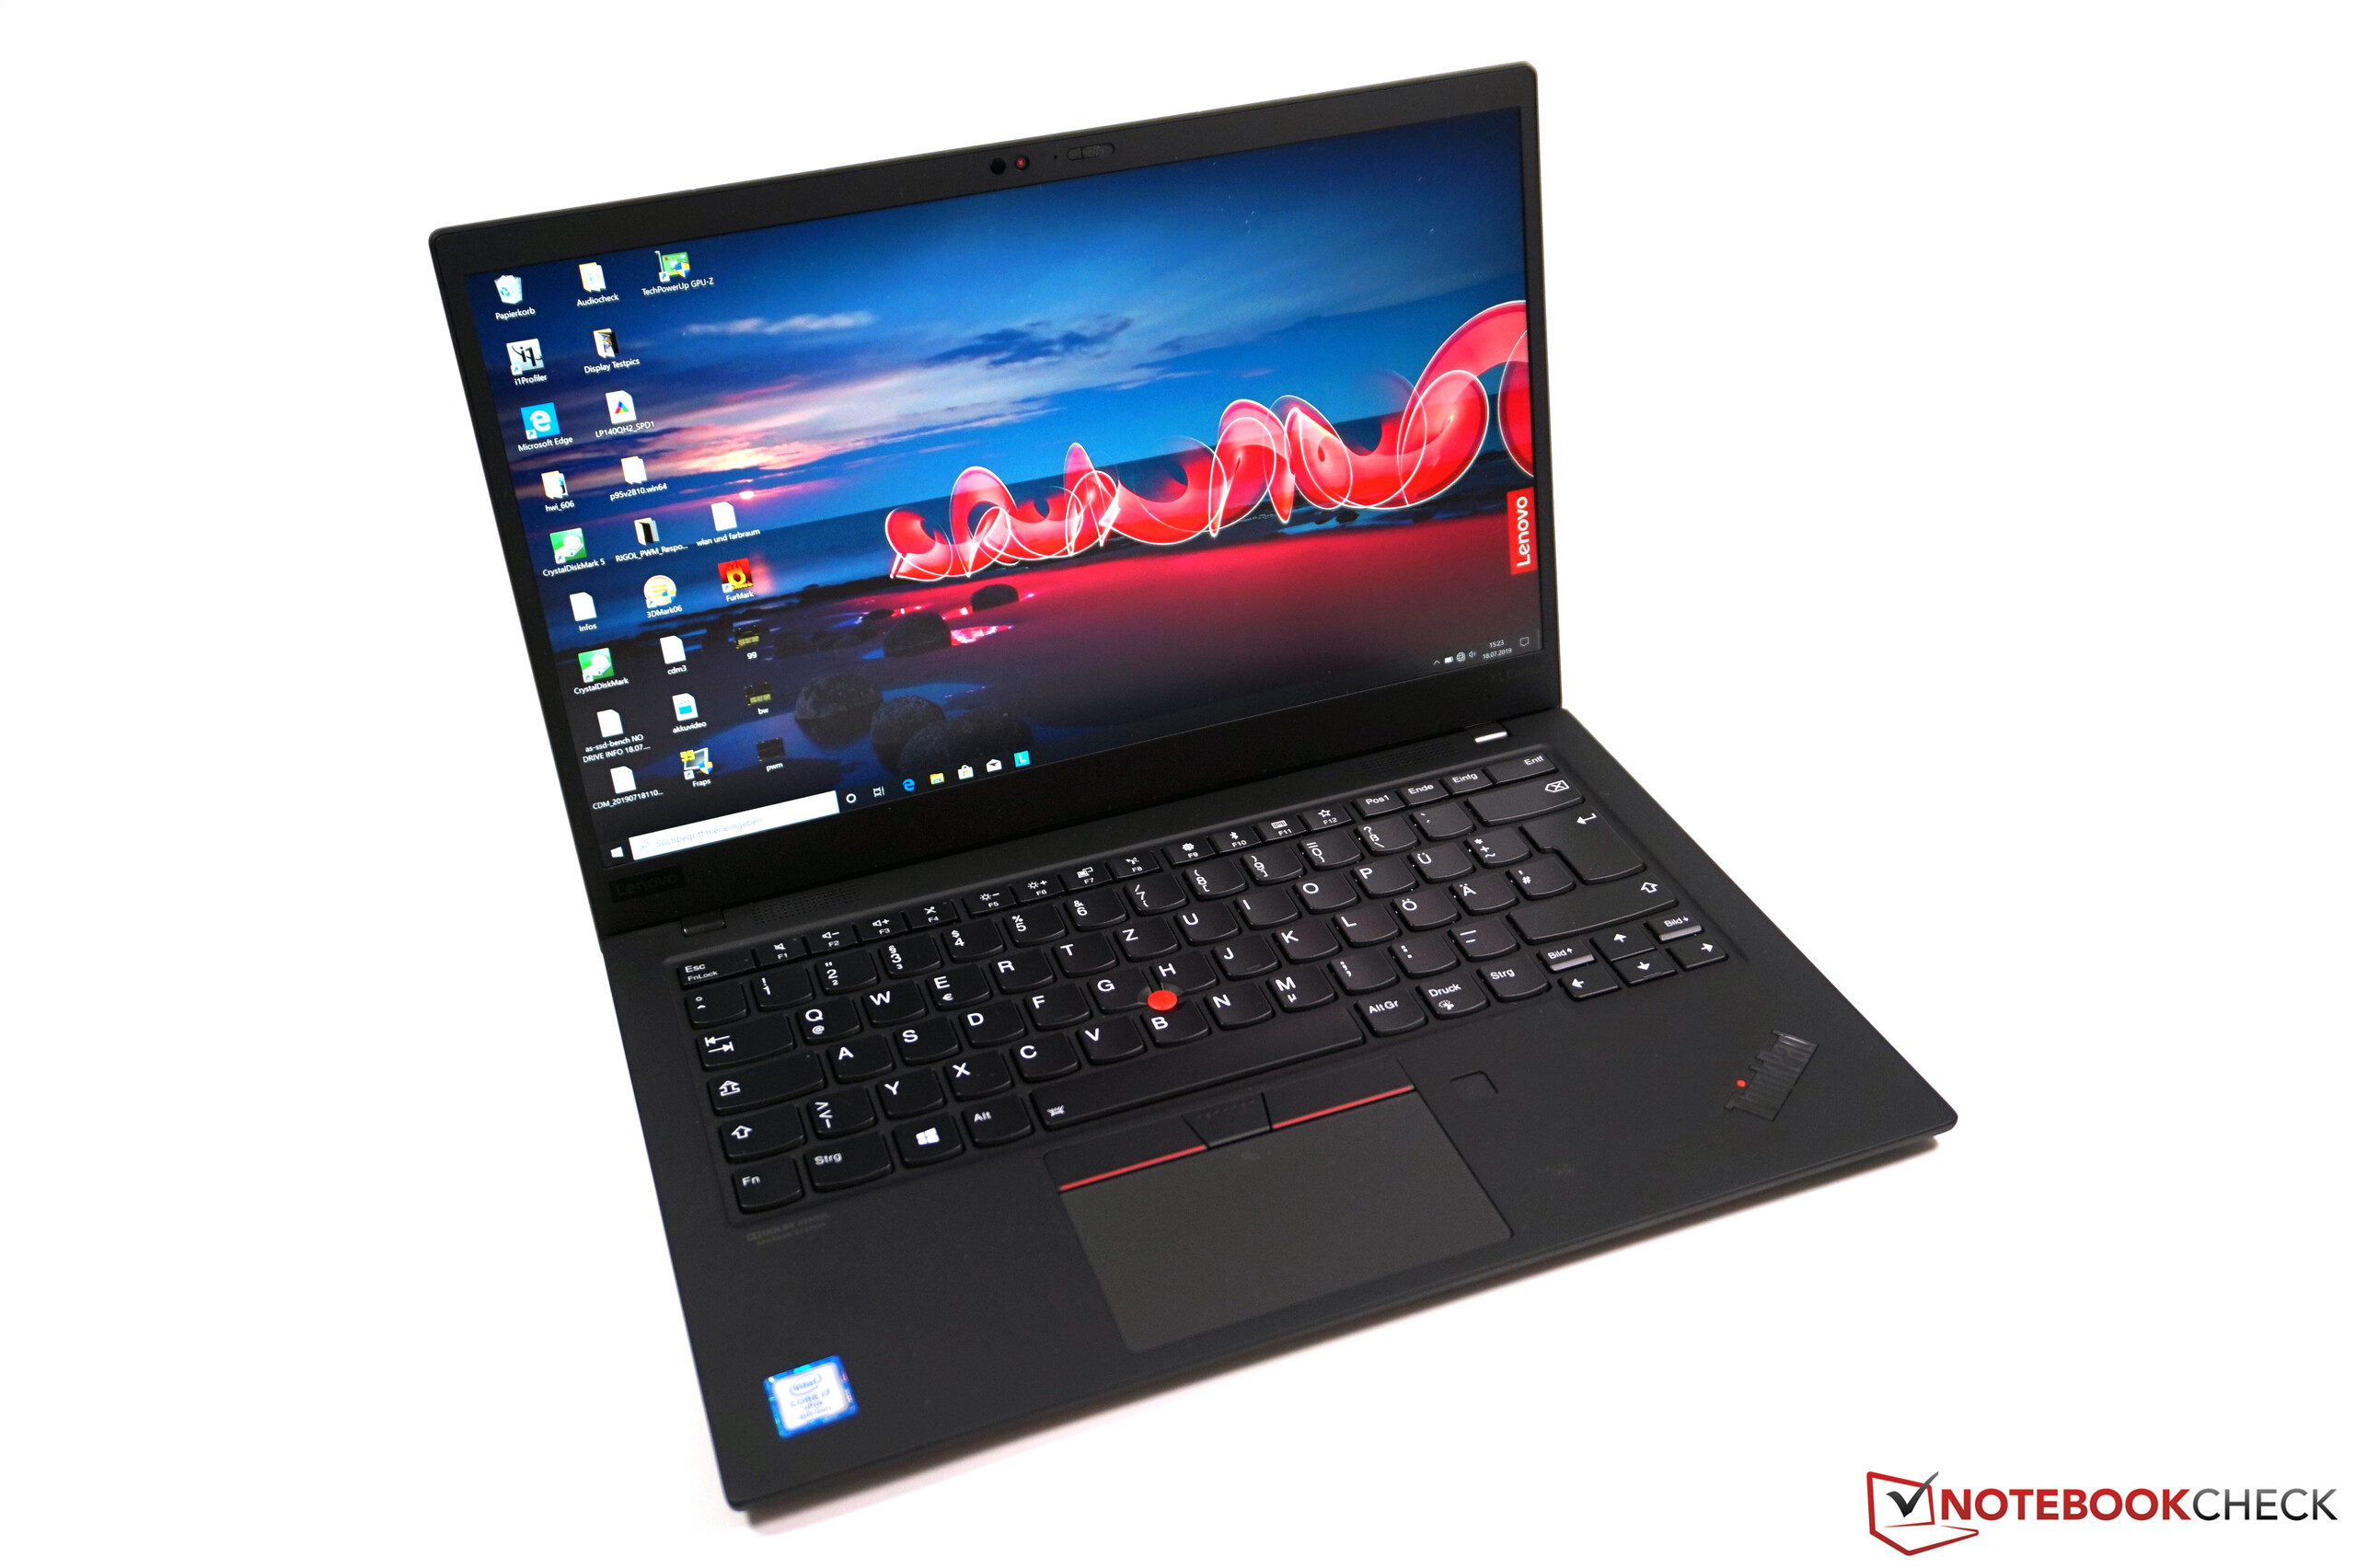
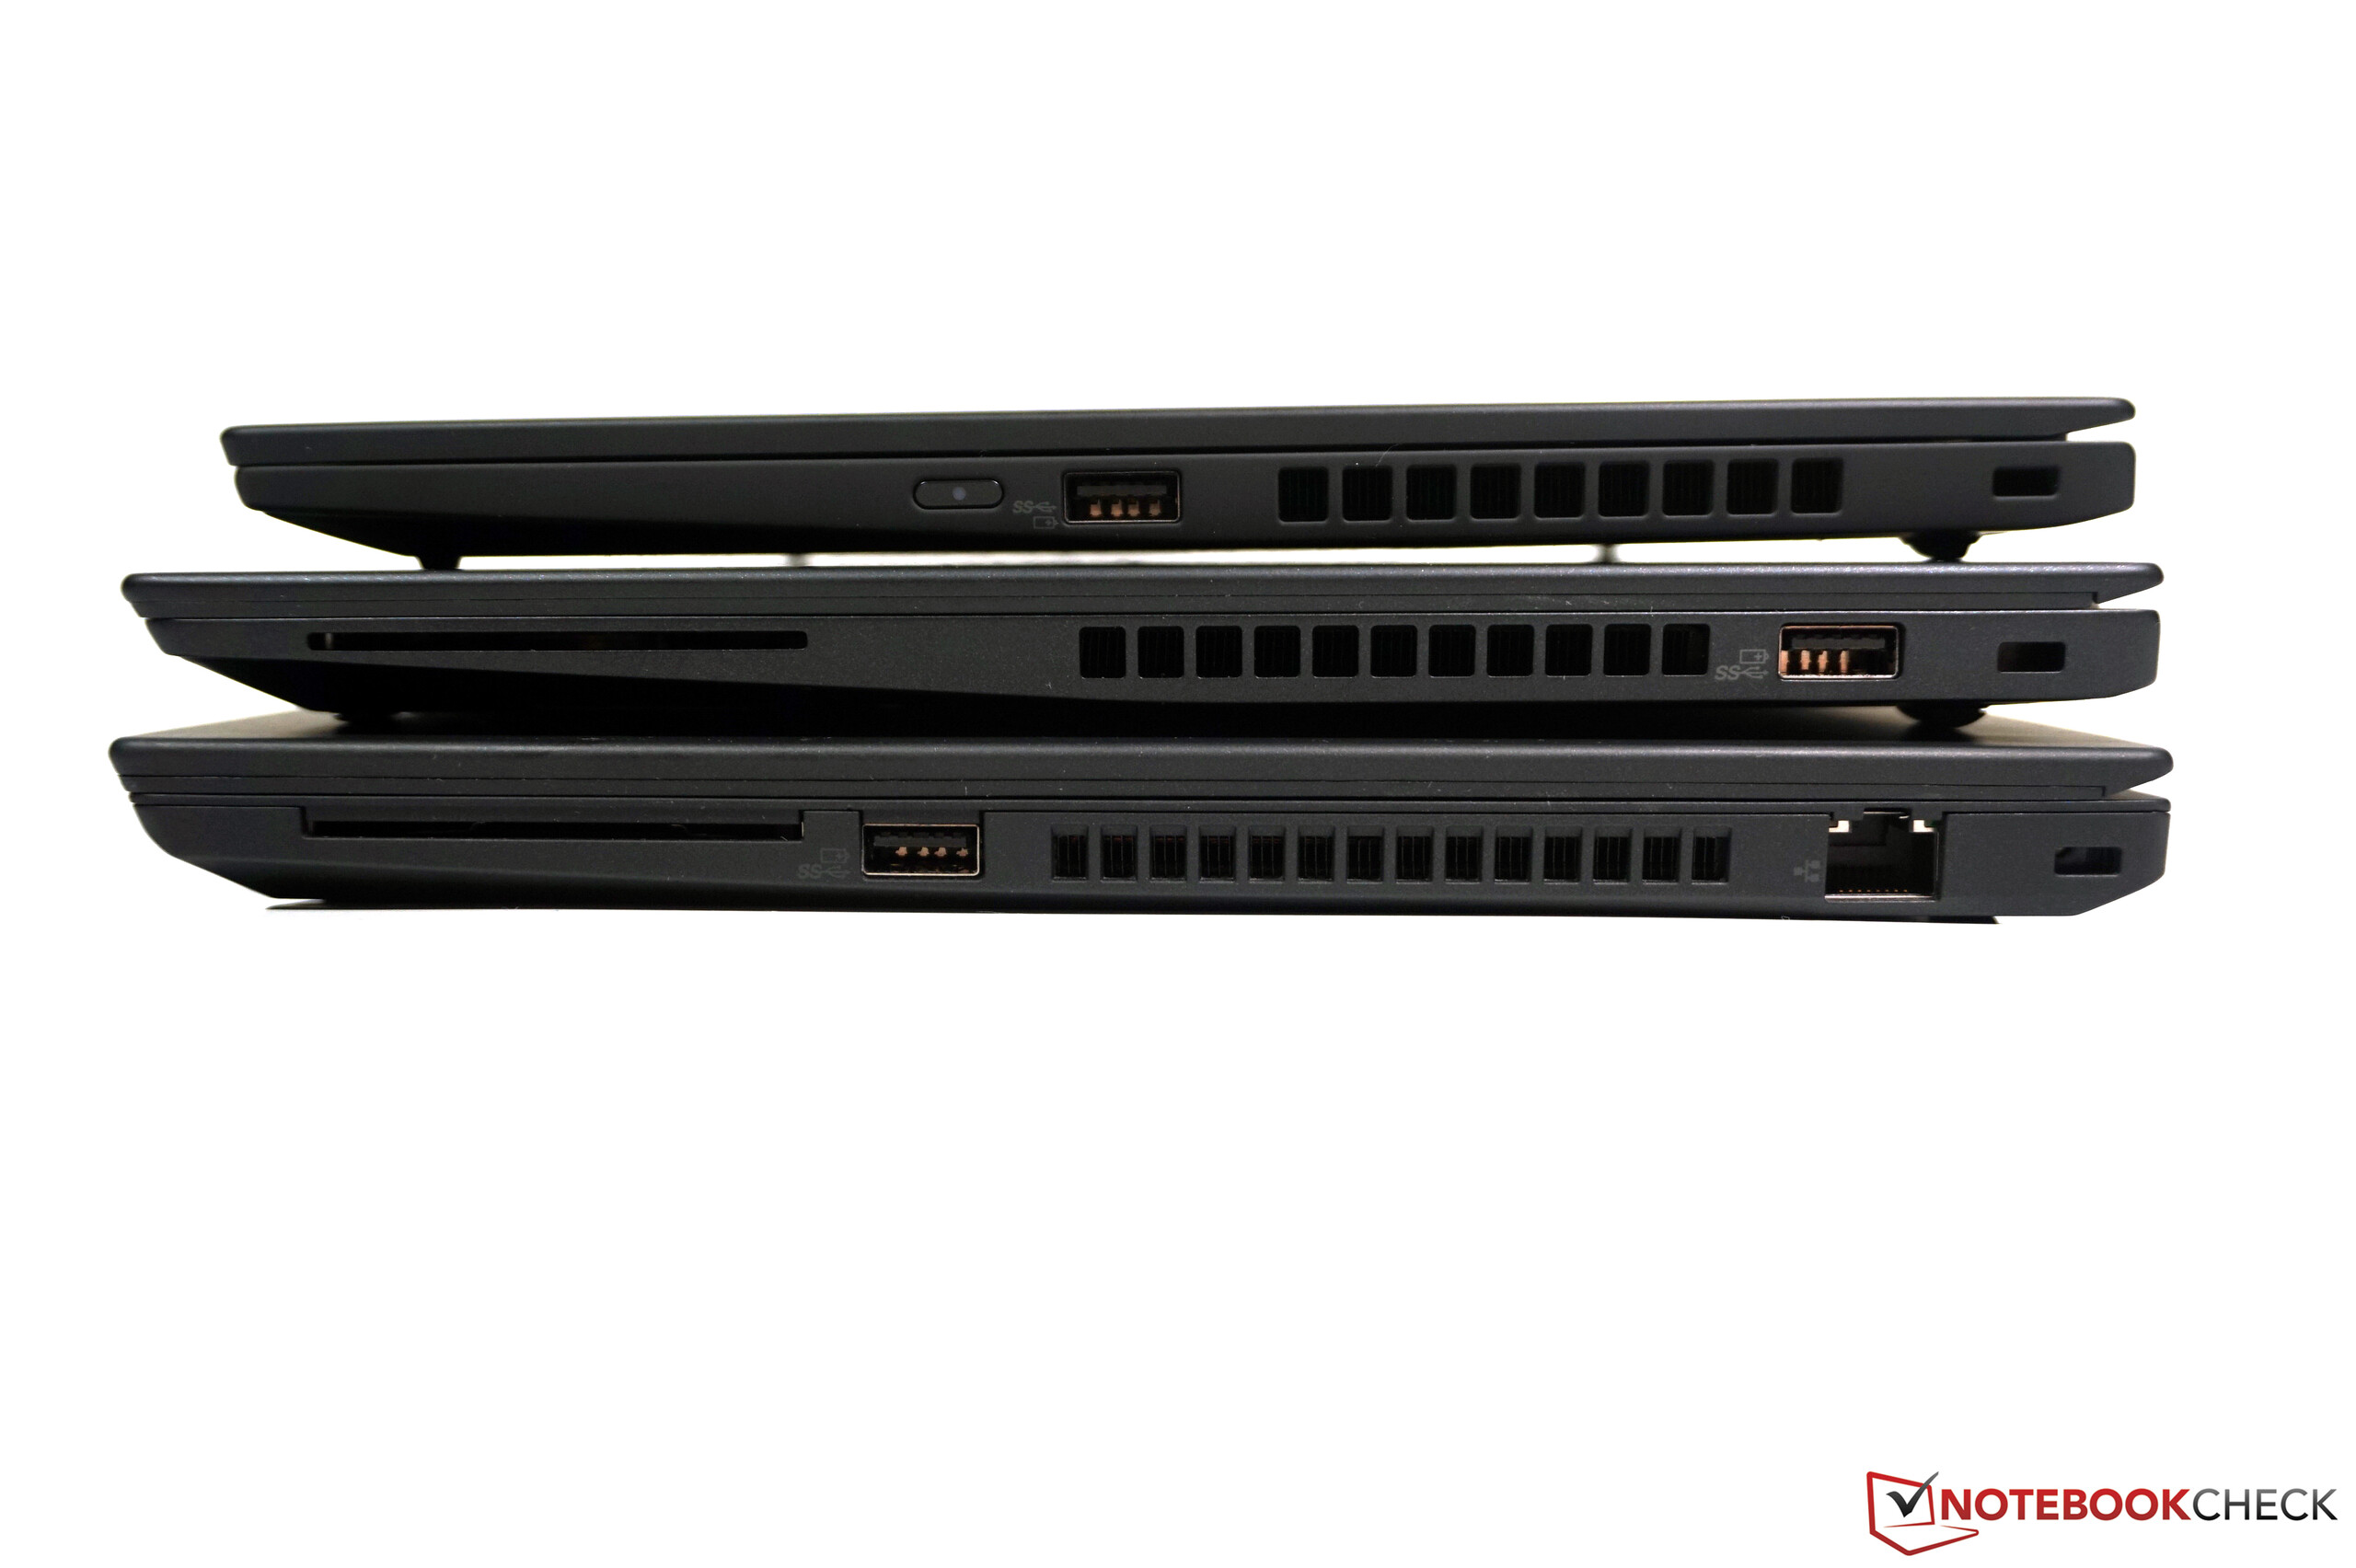
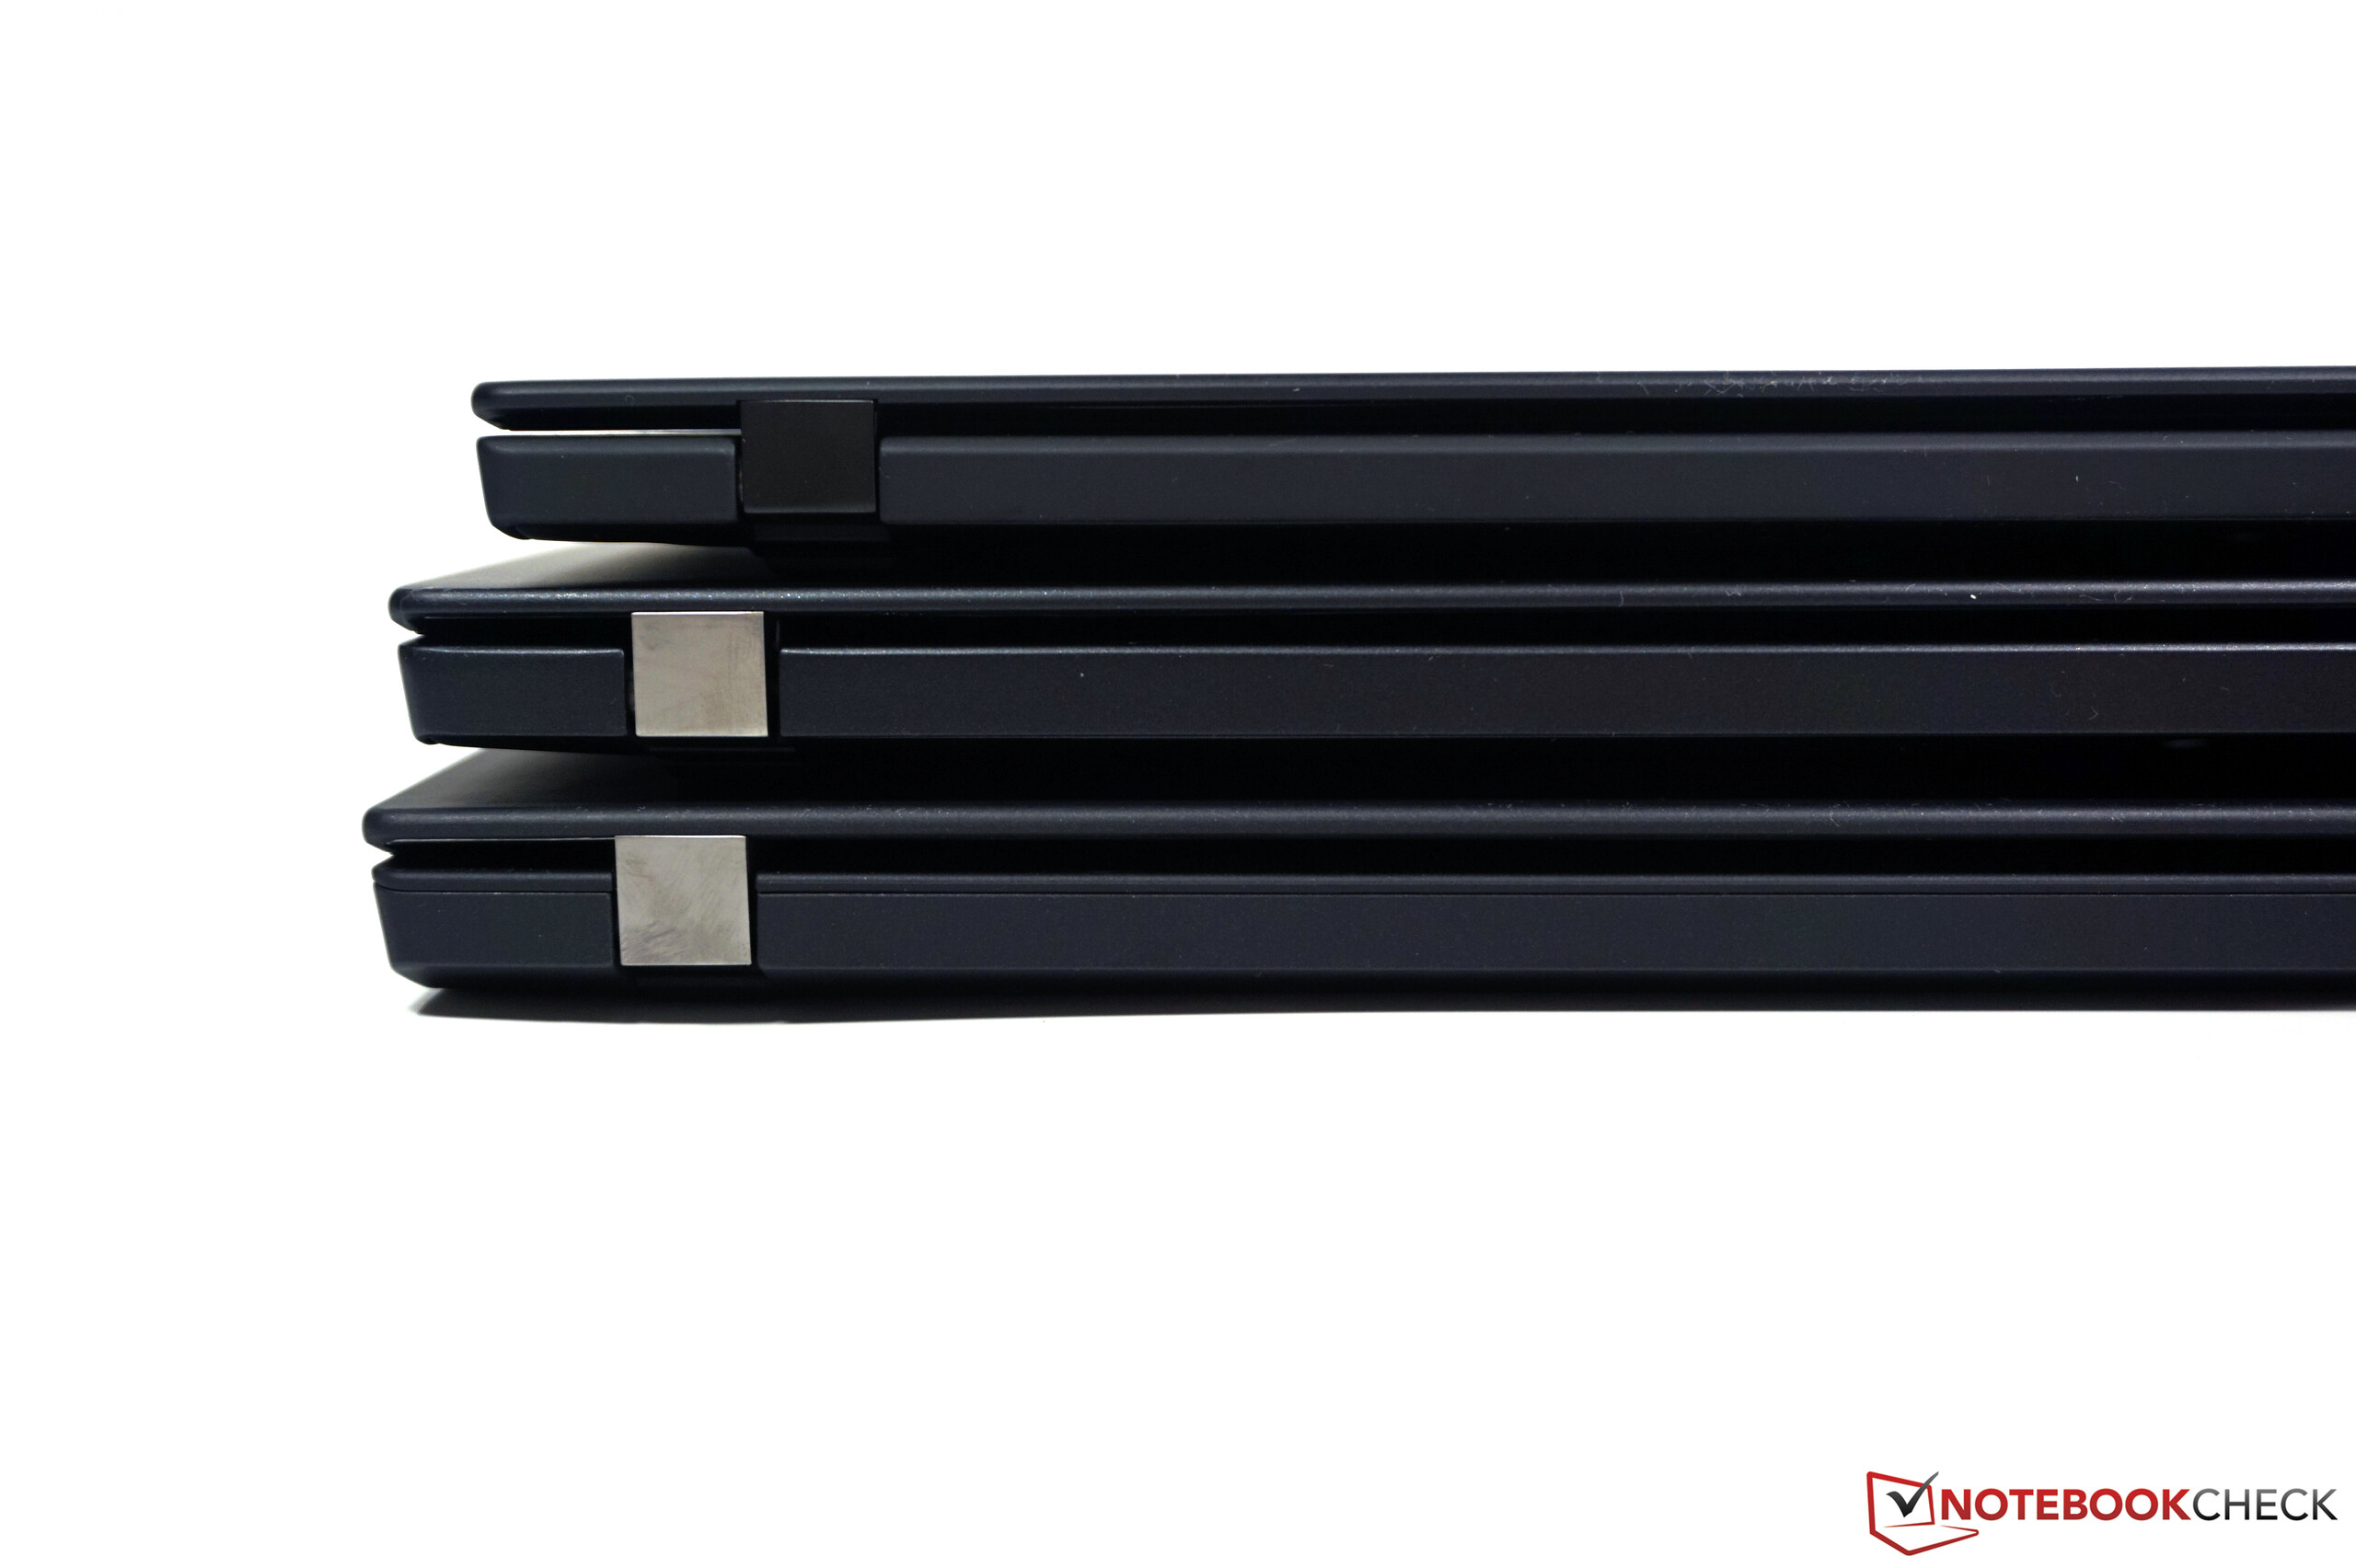
First Impressions

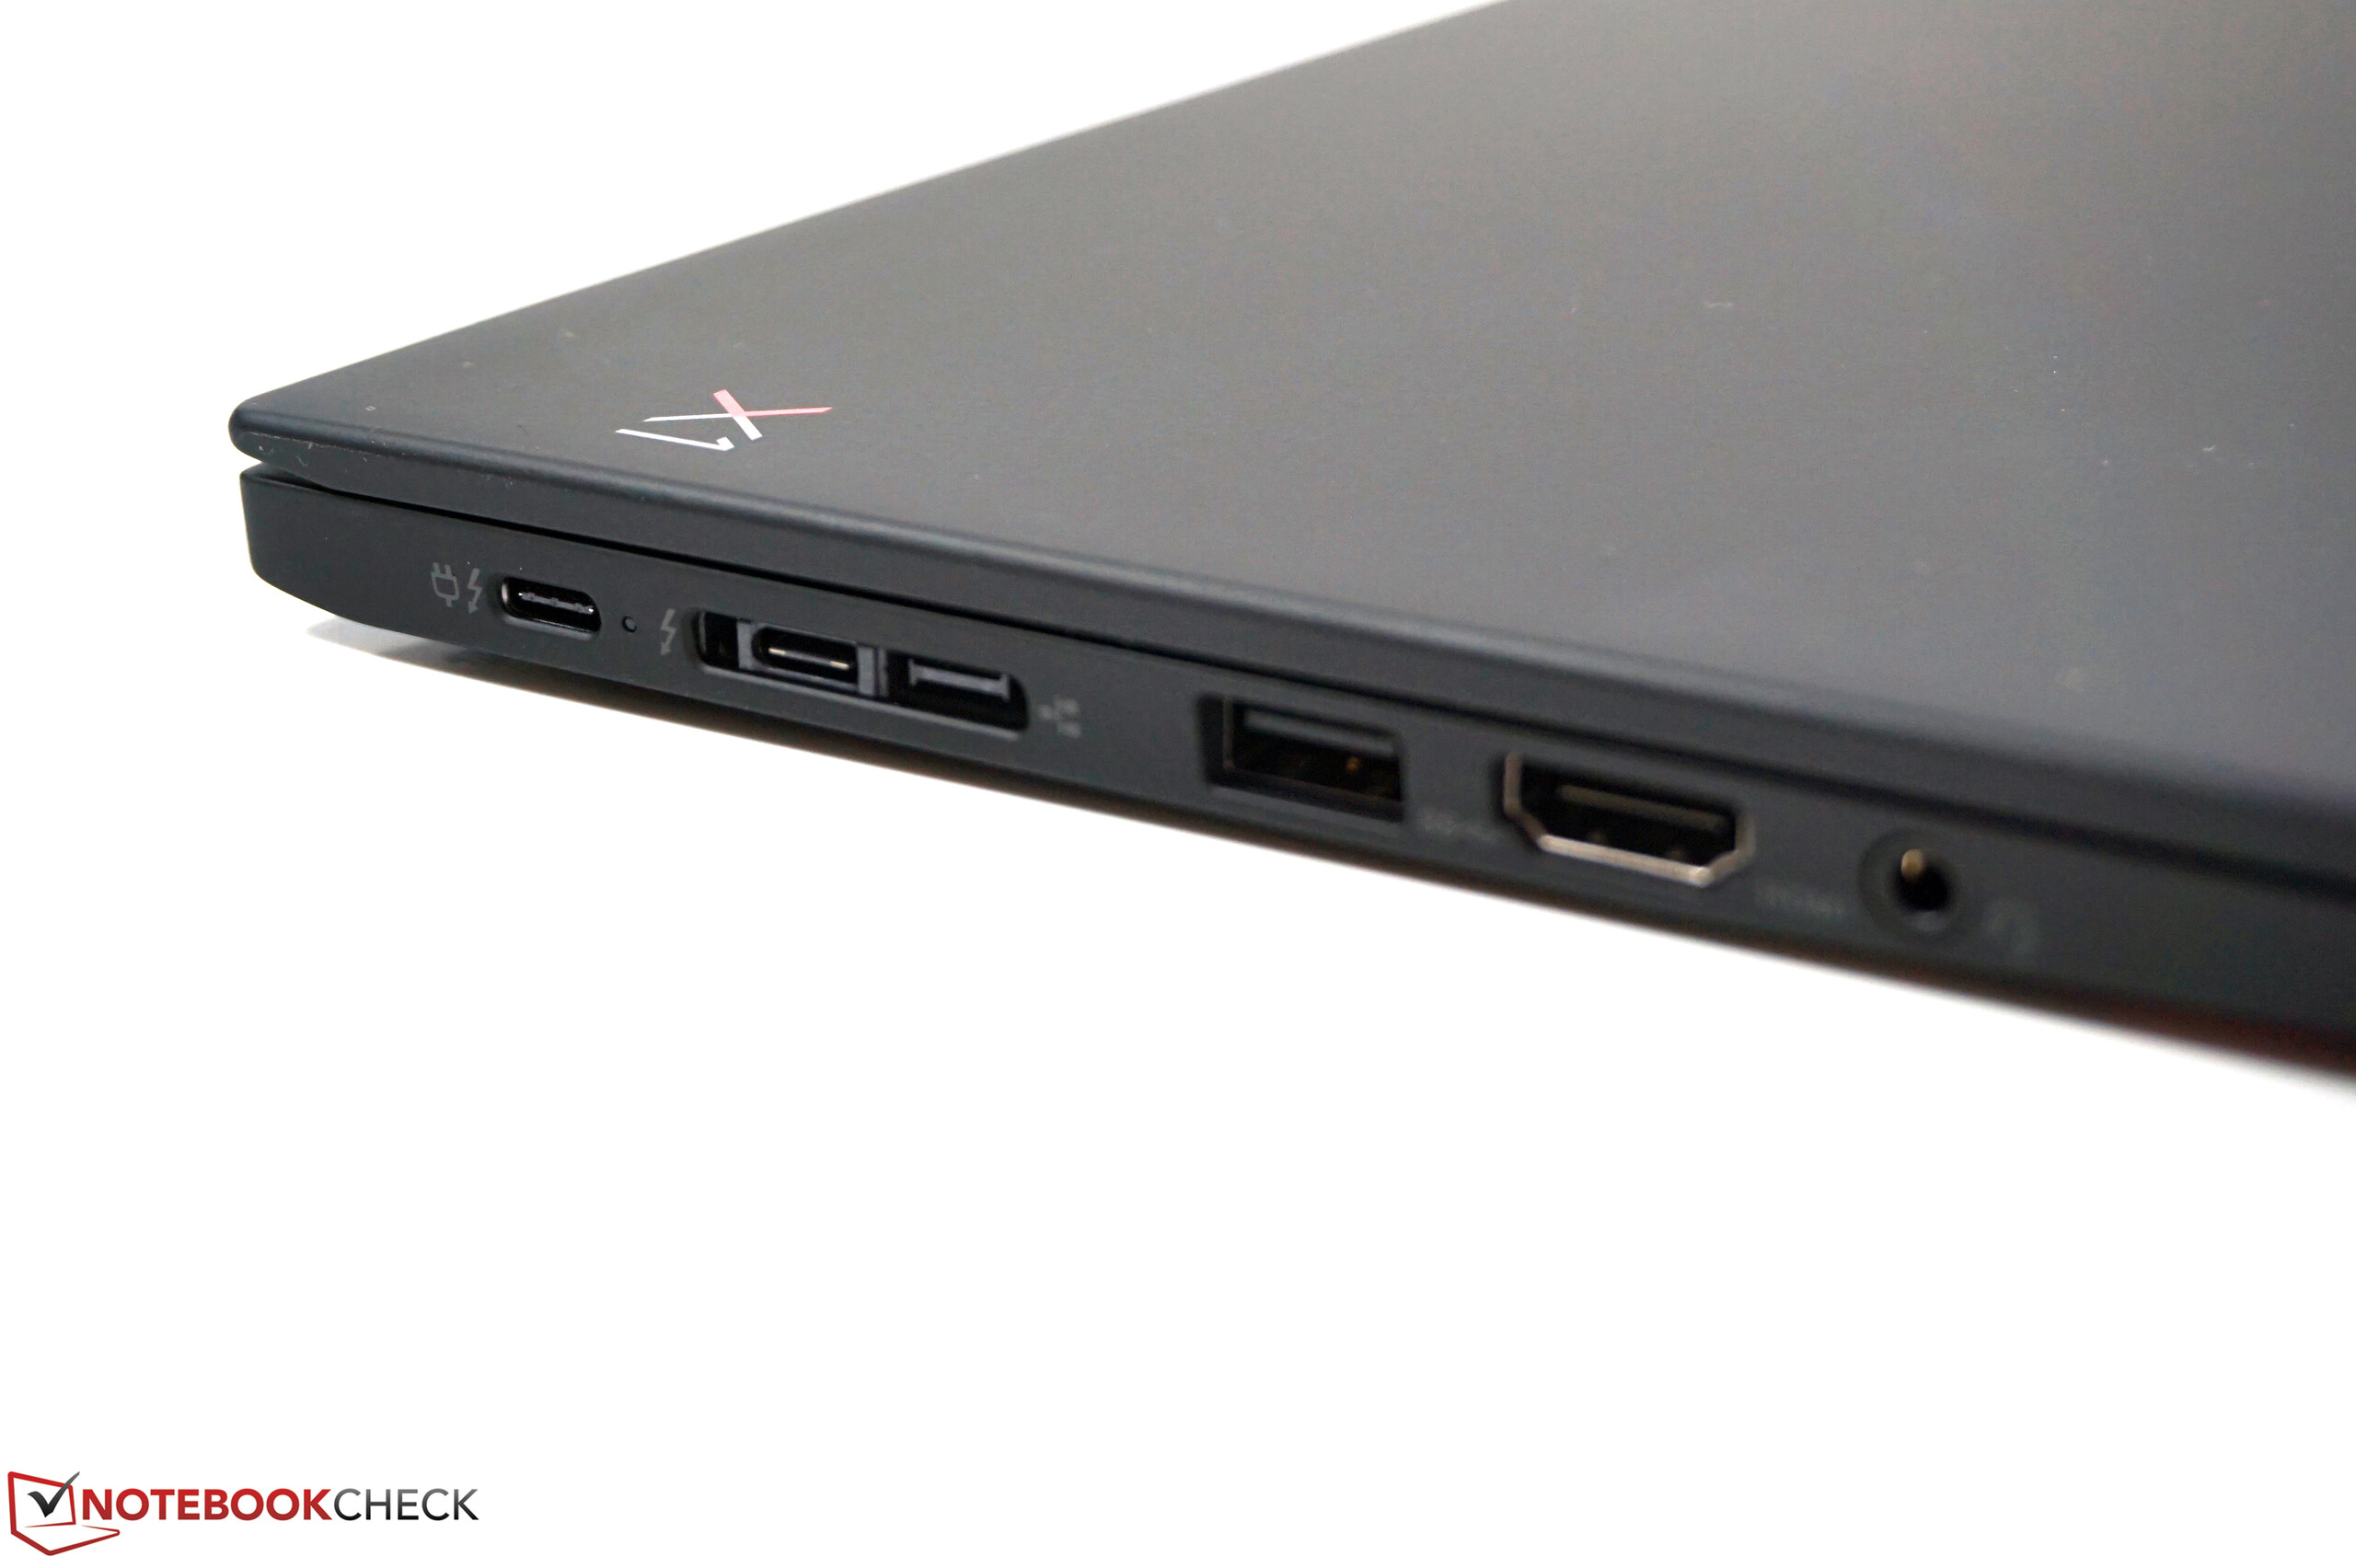
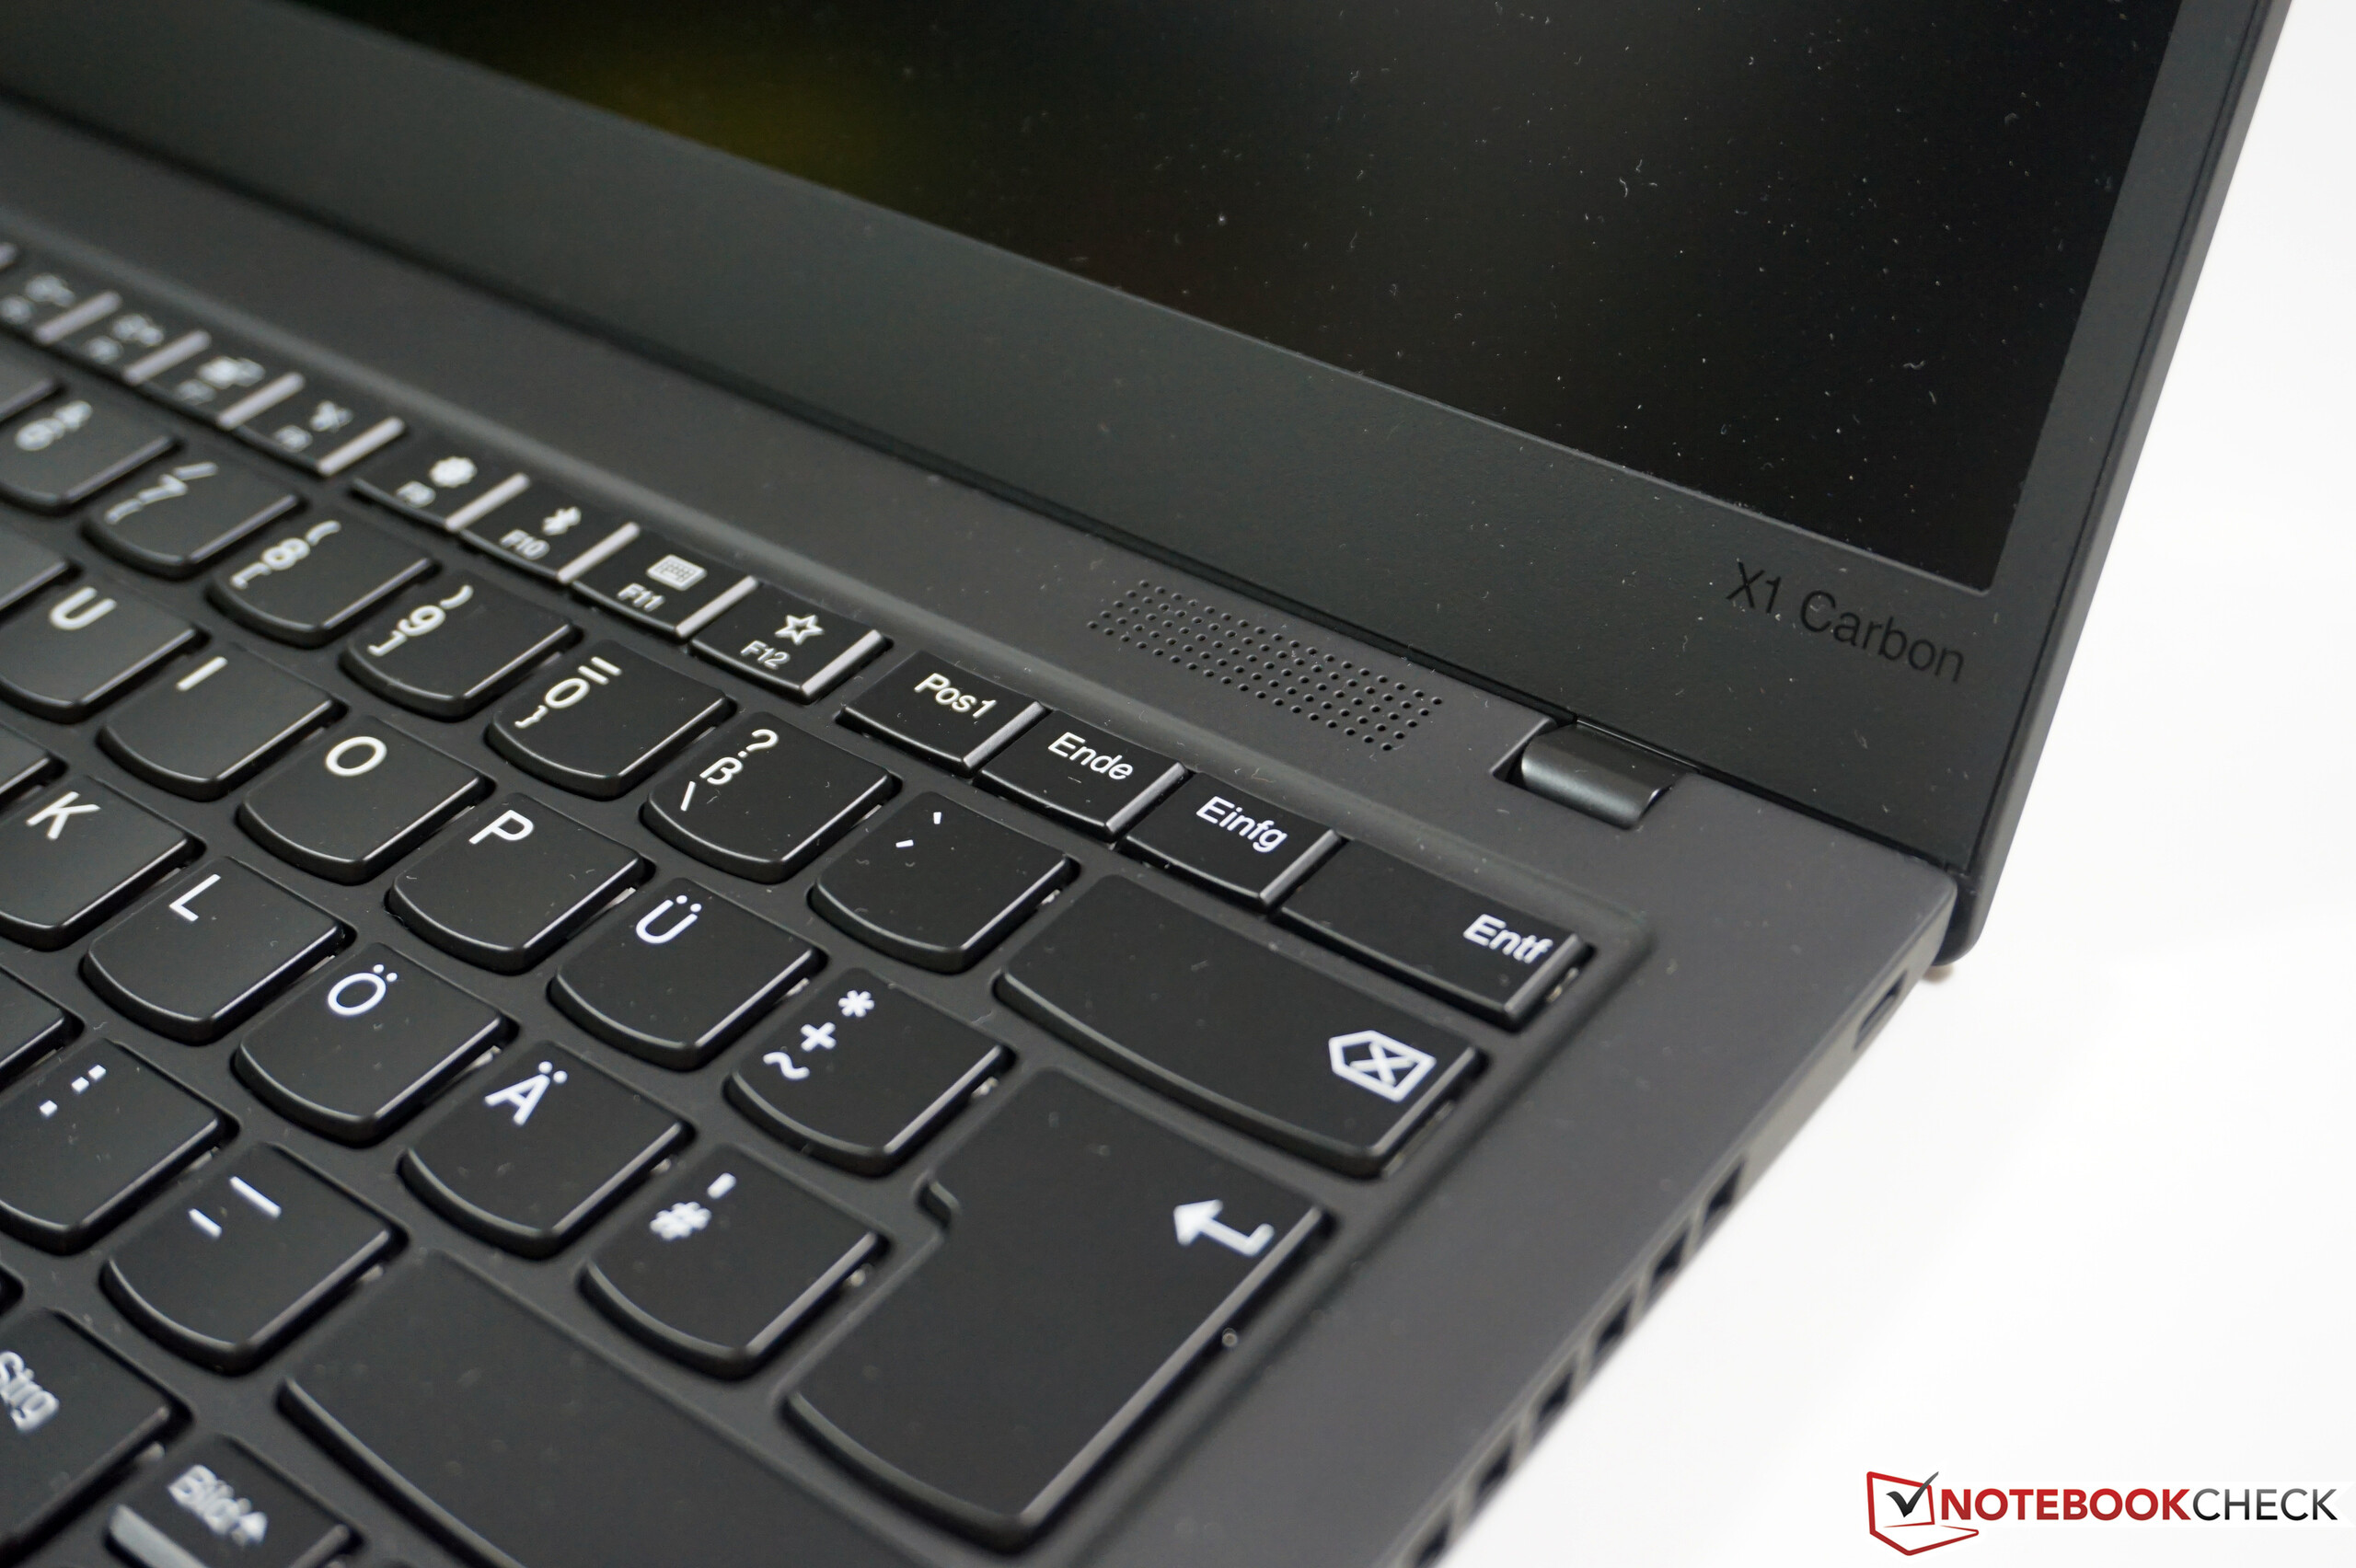
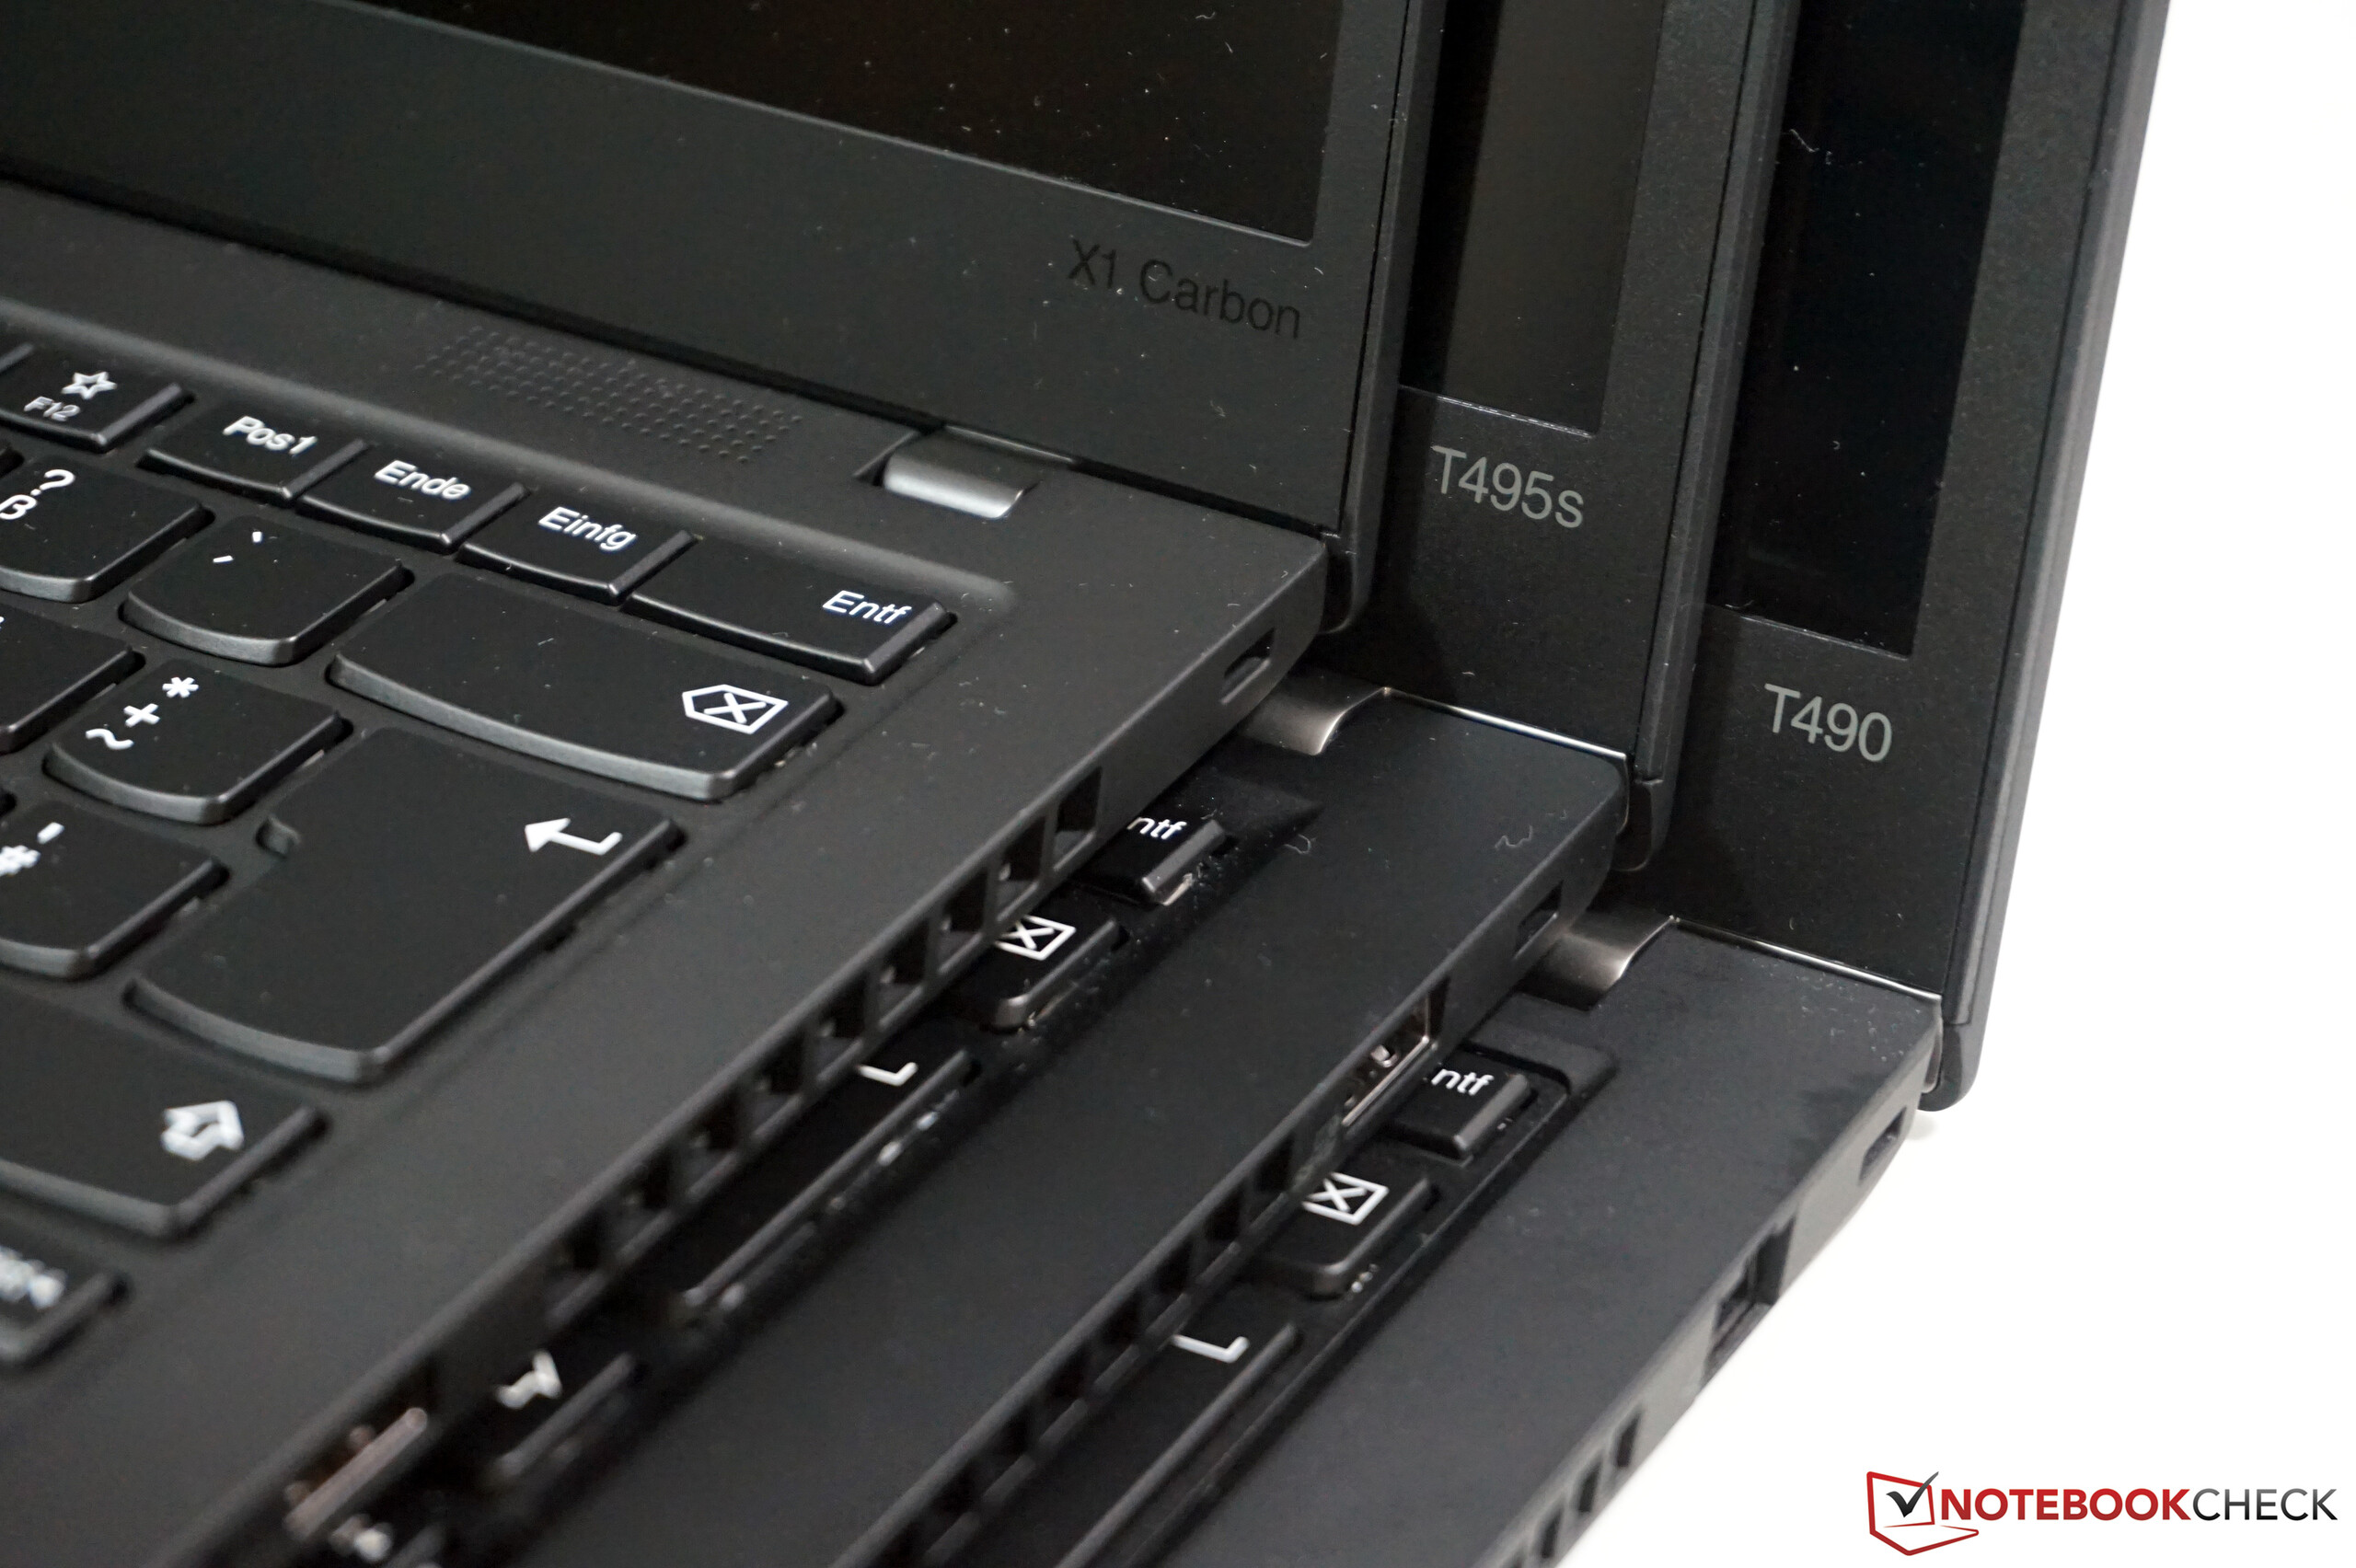
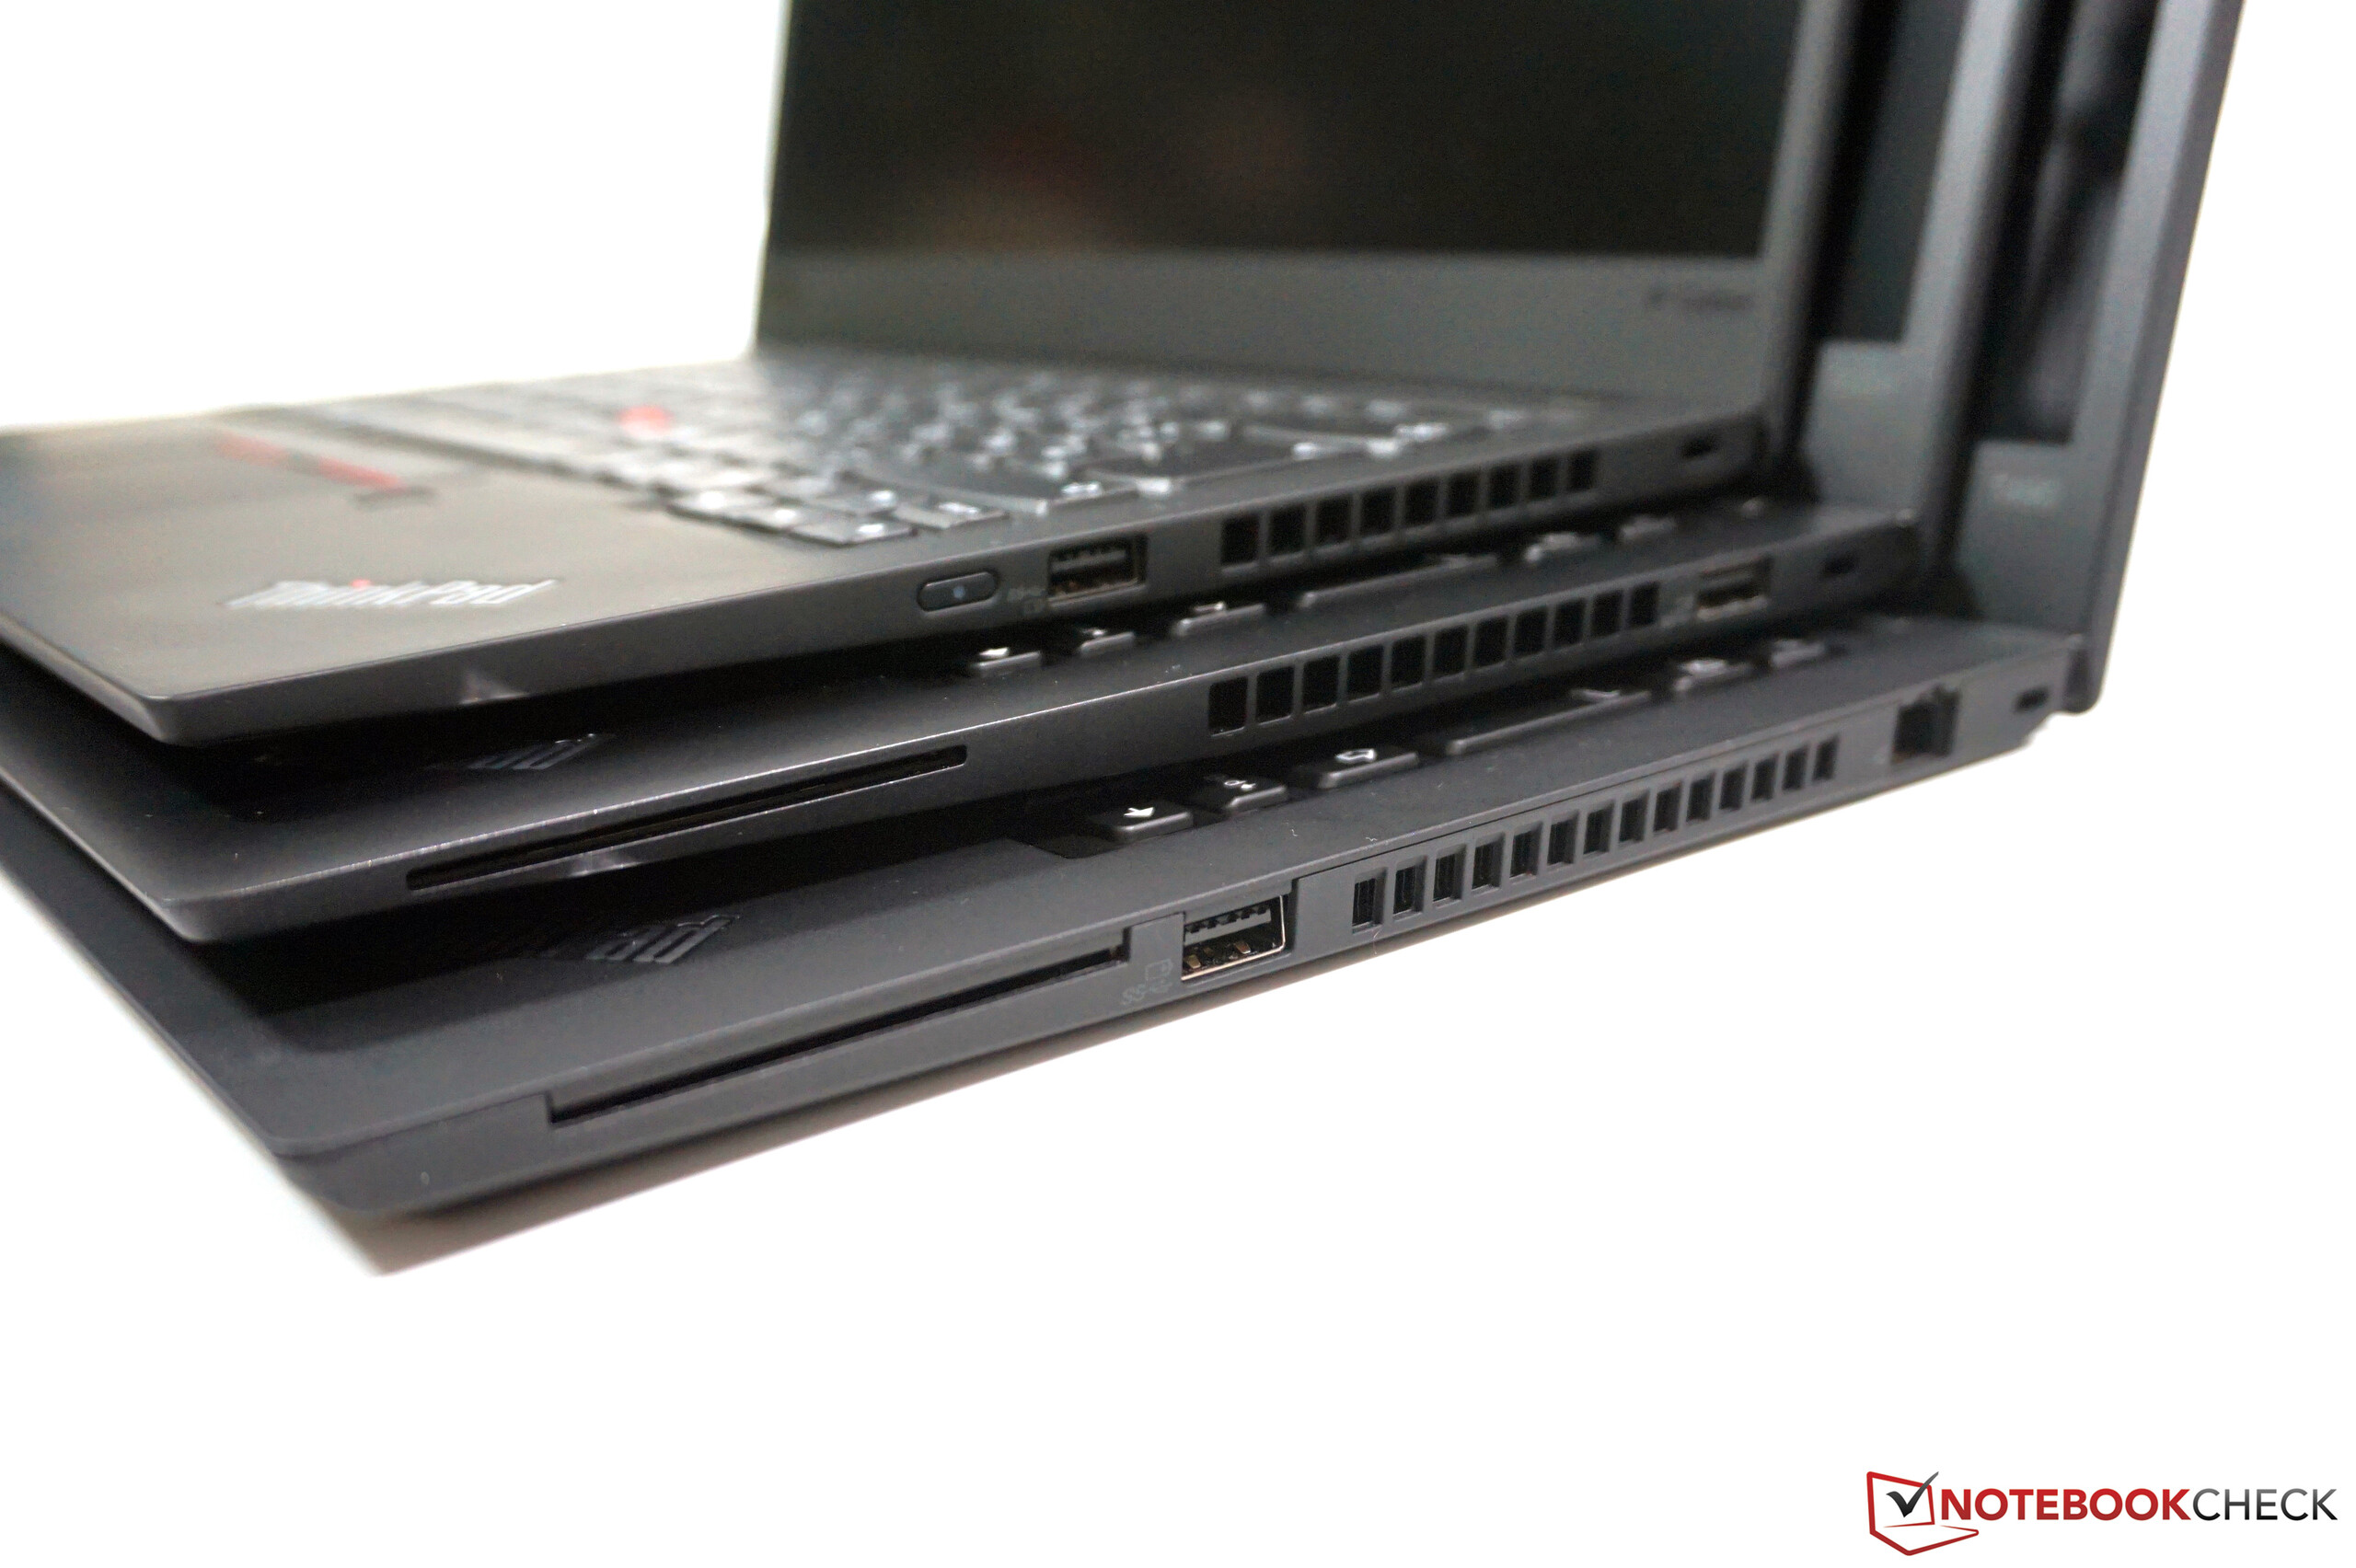
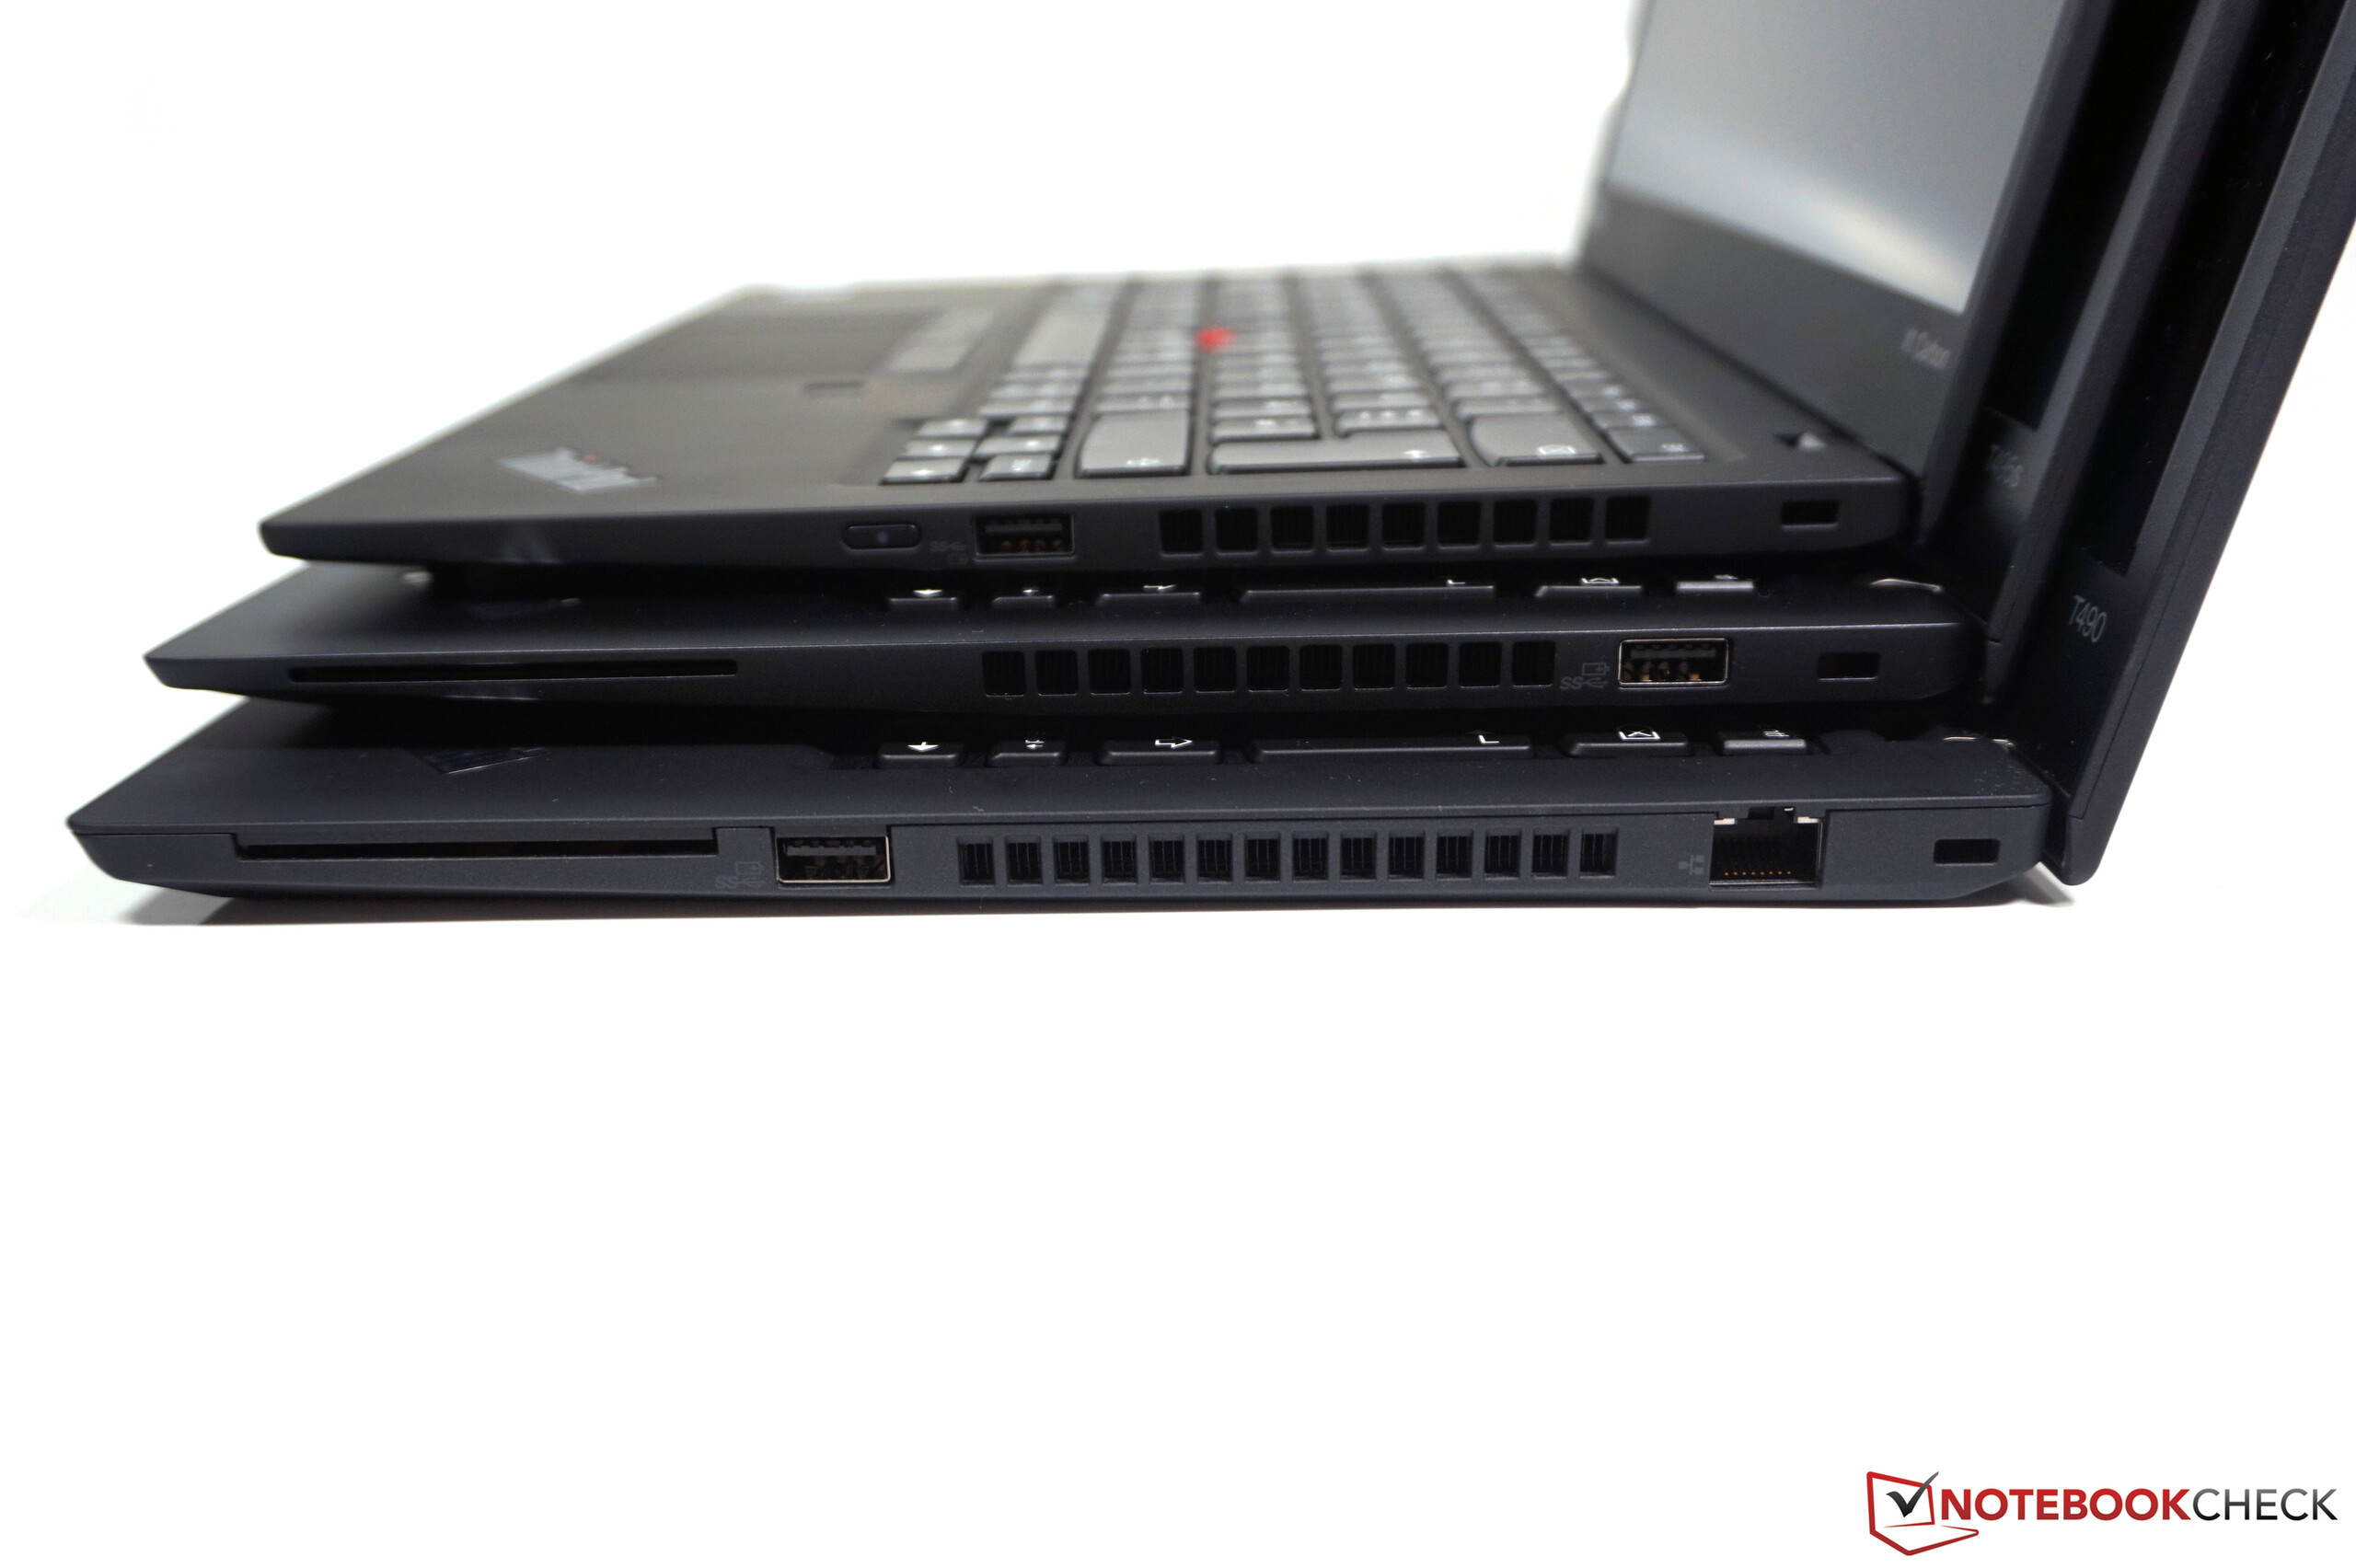
如果没有与2018型号的直接比较,你很难注意到第7代ThinkPad X1 Carbon的尺寸和重量上的优势。新机身的稳定性和构建质量都很好,但旧机型的键盘更好。
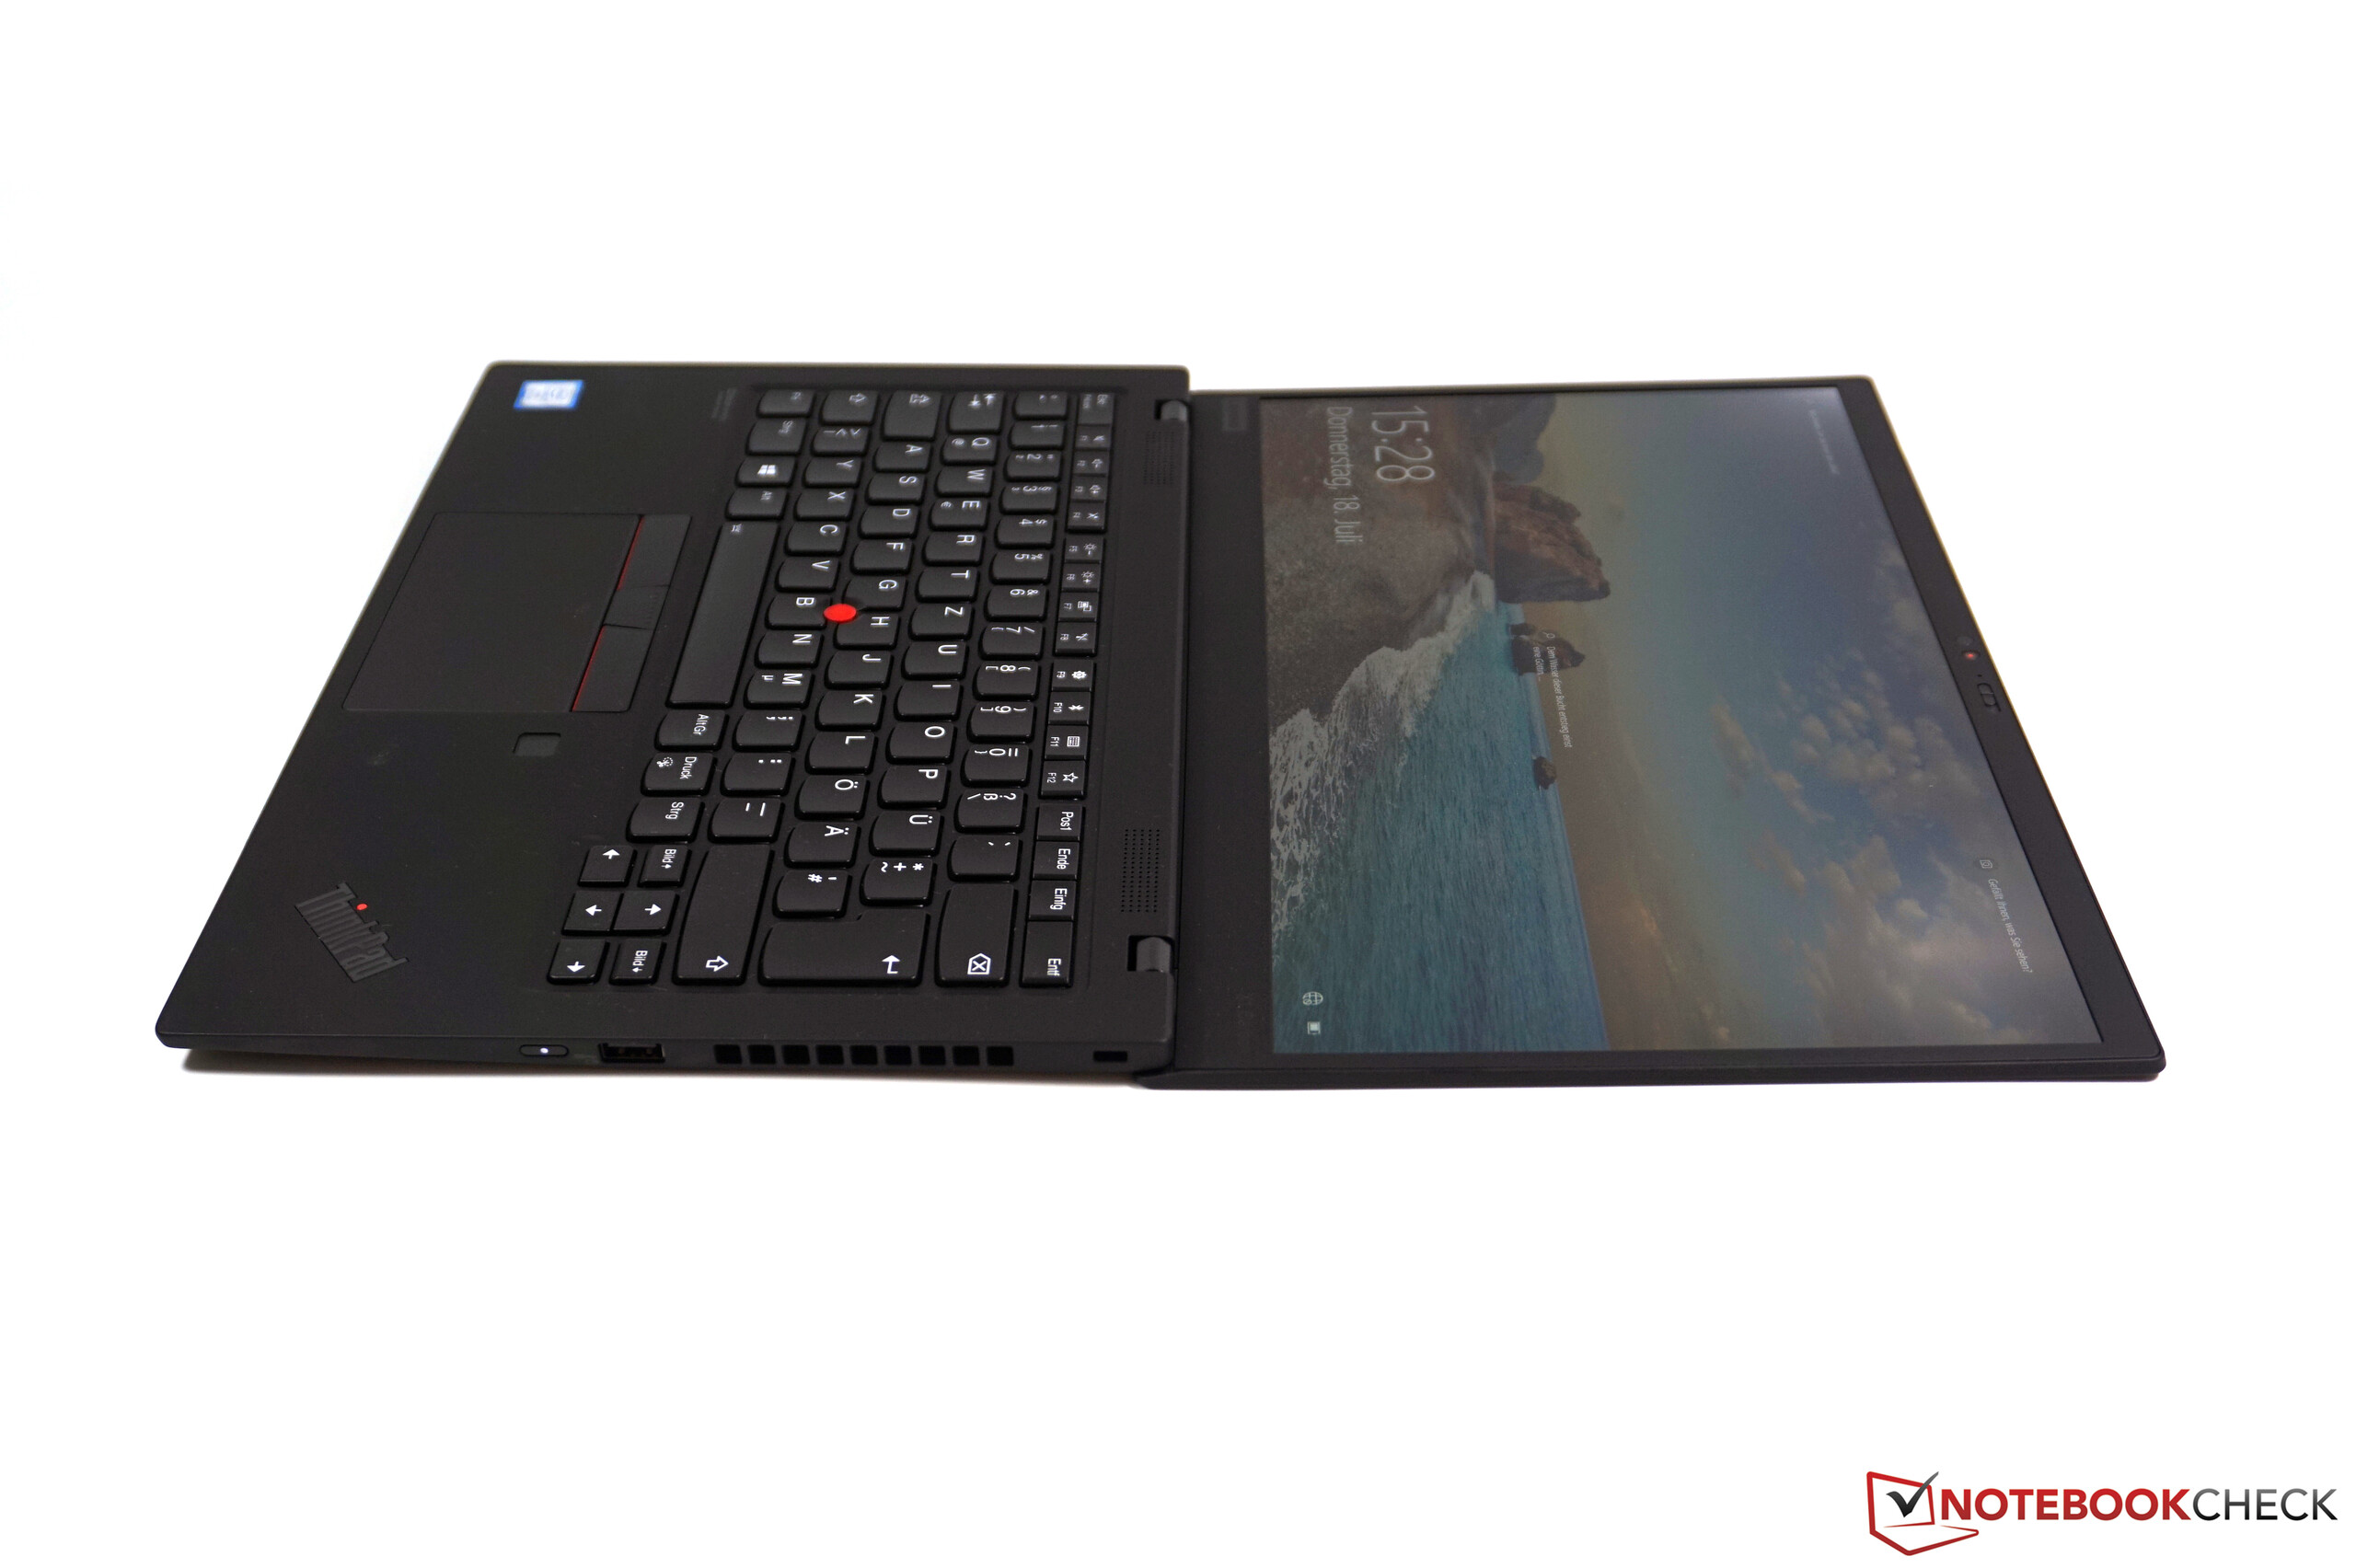
我们已经熟悉去年的屏幕并且质量仍然很好(即使需要校准),但考虑到入门级FHD面板的亮度很高,我们本来希望看到更昂贵的WQHD选项有更亮的背光。
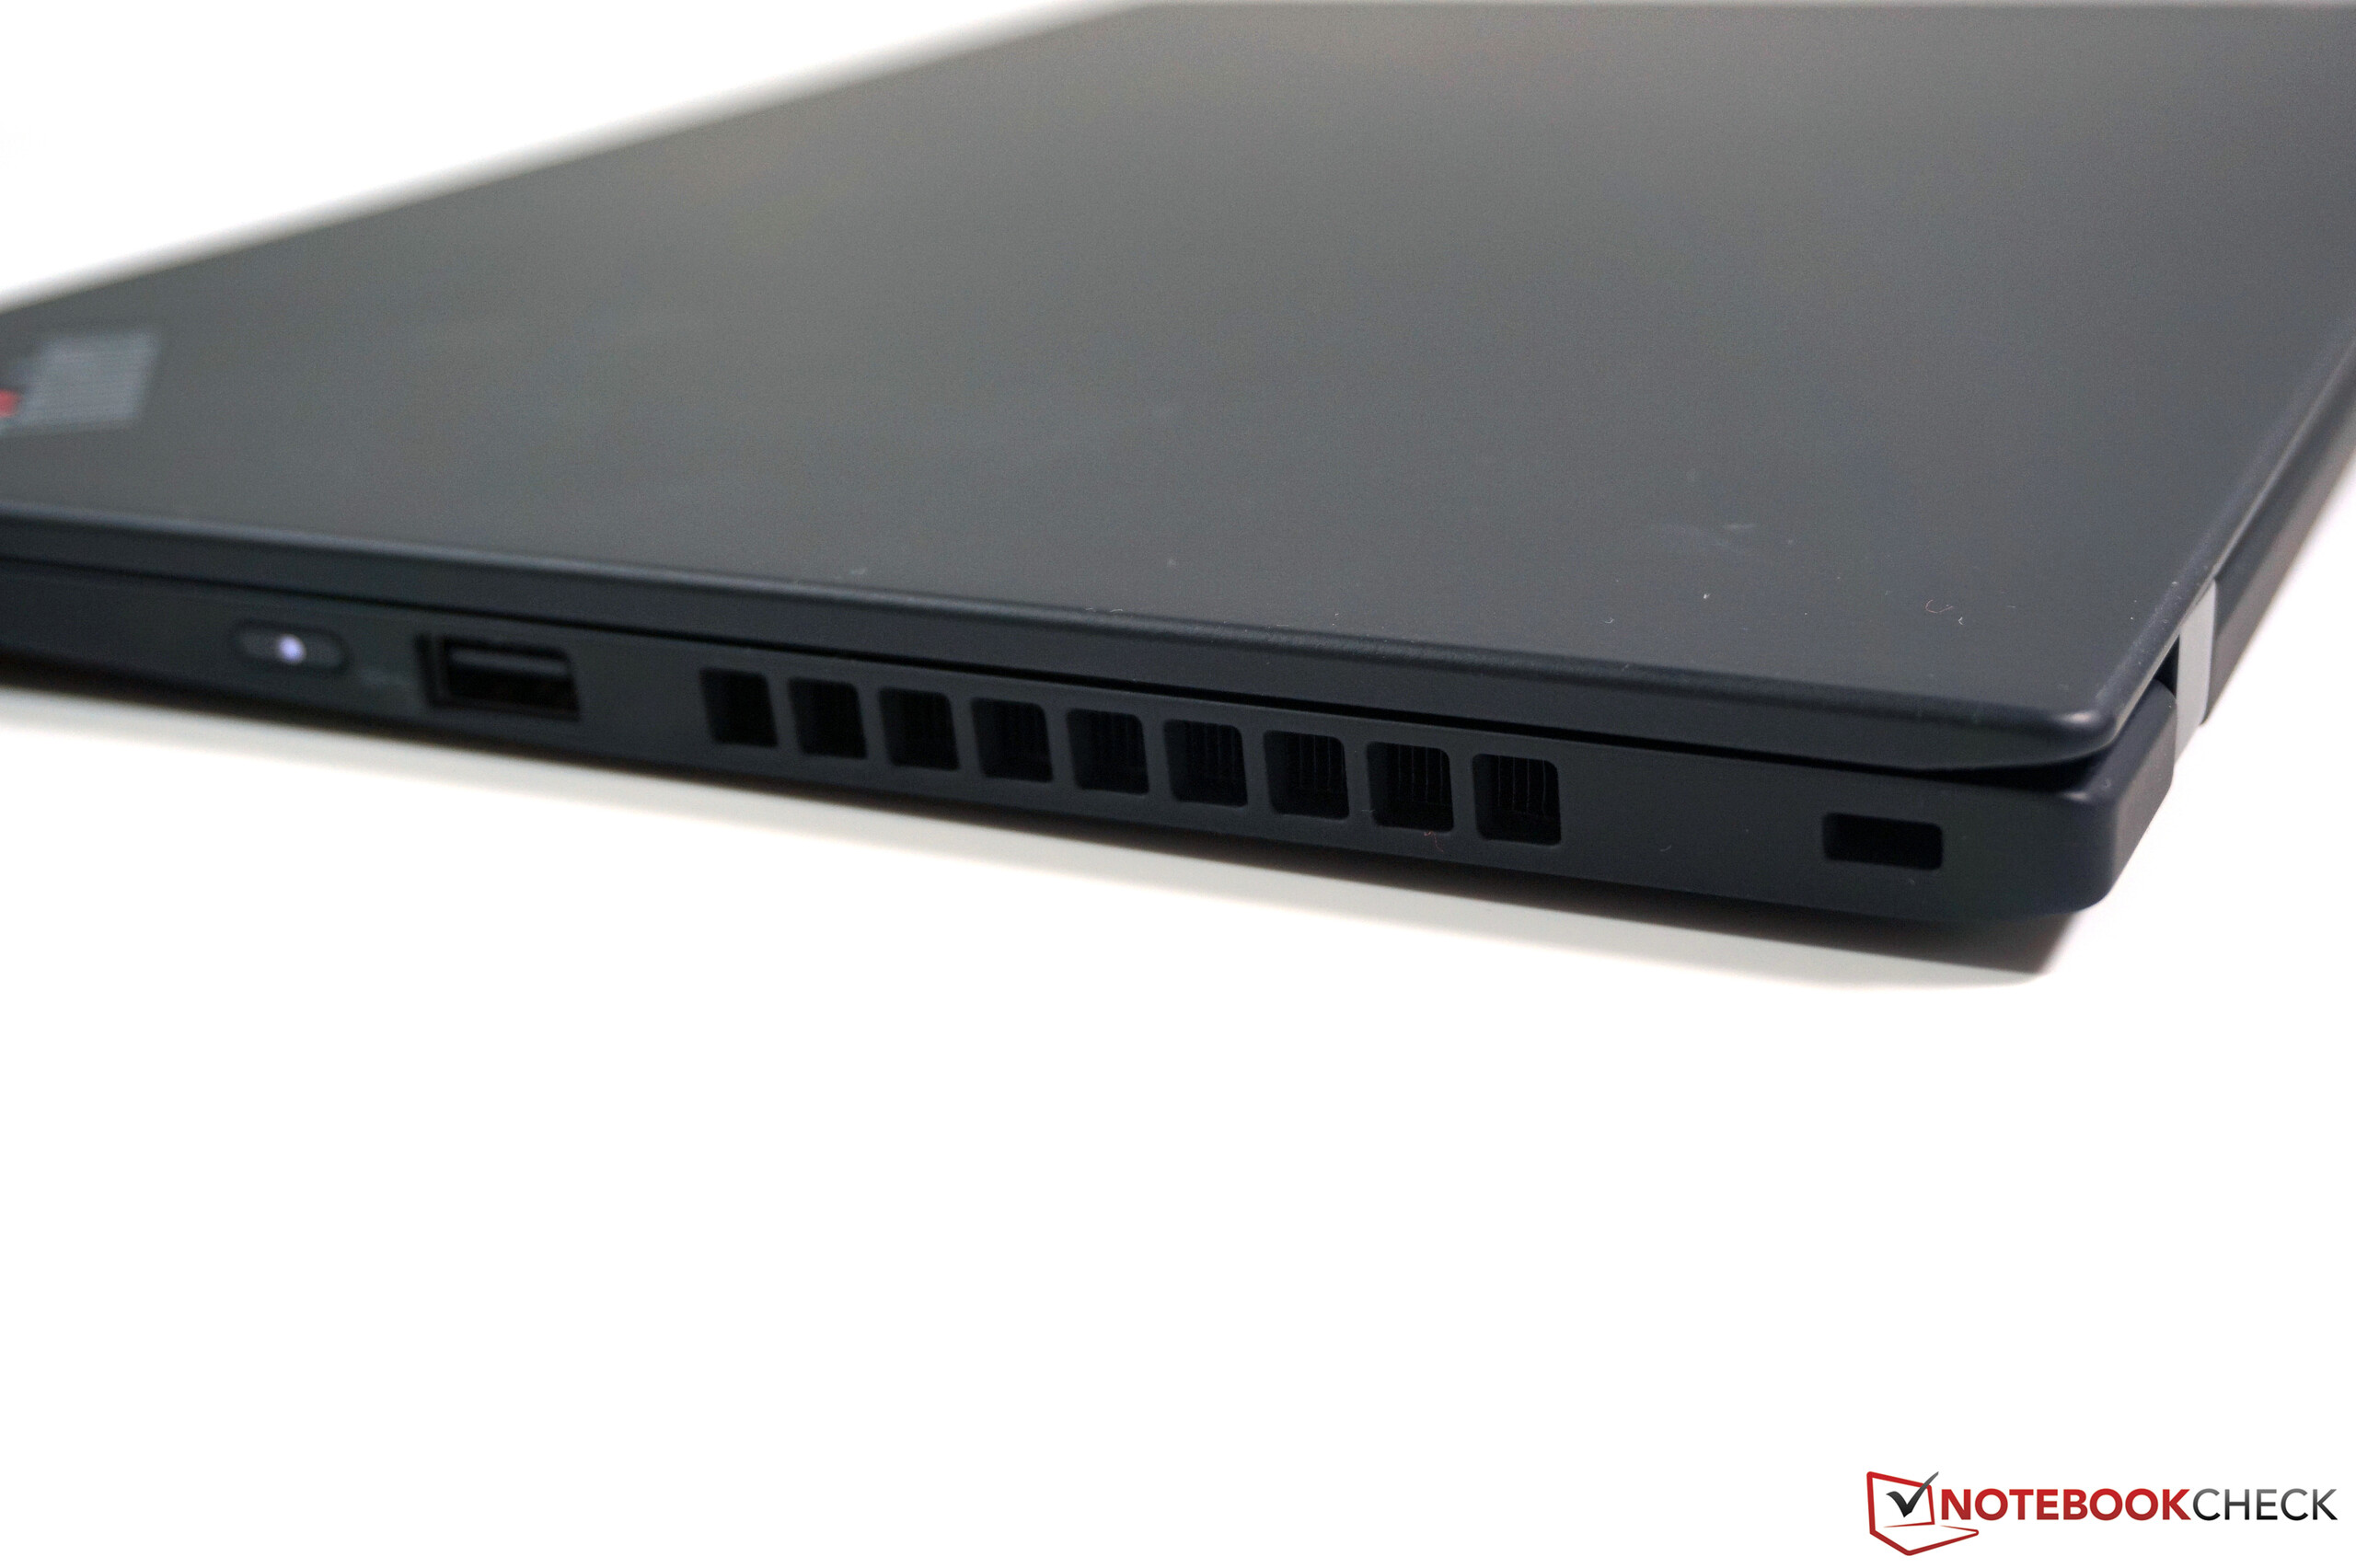
到目前为止,噪音也很好; 风扇并不烦人,扬声器也得到了改进。
不幸的是,续航时间受到较小电池的影响。 我们已经迫切希望了解低功耗1080p屏幕在这方面的表现。
Price comparison

