微星PS63(i7-8565U, GTX 1050 Max-Q)笔记本电脑评测

| SD Card Reader | |
| average JPG Copy Test (av. of 3 runs) | |
| Gigabyte Aero 15X v8 (Toshiba Exceria Pro SDXC 64 GB UHS-II) | |
| Lenovo ThinkPad X1 Extreme-20MF000RGE (Toshiba Exceria Pro SDXC 64 GB UHS-II) | |
| Schenker Key 15 Coffee Lake (Toshiba Exceria Pro SDXC 64 GB UHS-II) | |
| Microsoft Surface Book 2 (Toshiba Exceria Pro SDXC 64 GB UHS-II) | |
| Dell XPS 15 2018 i5 FHD 97Wh | |
| Average of class Multimedia (23 - 531, n=43, last 2 years) | |
| Lenovo Ideapad 720S-15IKB 81AC001AGE (Toshiba Exceria Pro M501) | |
| Schenker XMG Neo 15 (Toshiba Exceria Pro SDXC 64 GB UHS-II) | |
| MSI PS63 Modern 8RC (Toshiba Exceria Pro SDXC 64 GB UHS-II) | |
| MSI Prestige PS42 8RB-059 (Toshiba Exceria Pro SDXC 64 GB UHS-II) | |
| maximum AS SSD Seq Read Test (1GB) | |
| Gigabyte Aero 15X v8 (Toshiba Exceria Pro SDXC 64 GB UHS-II) | |
| Microsoft Surface Book 2 (Toshiba Exceria Pro SDXC 64 GB UHS-II) | |
| Lenovo ThinkPad X1 Extreme-20MF000RGE (Toshiba Exceria Pro SDXC 64 GB UHS-II) | |
| Schenker Key 15 Coffee Lake (Toshiba Exceria Pro SDXC 64 GB UHS-II) | |
| Dell XPS 15 2018 i5 FHD 97Wh | |
| Average of class Multimedia (27.9 - 1455, n=42, last 2 years) | |
| Lenovo Ideapad 720S-15IKB 81AC001AGE (Toshiba Exceria Pro M501) | |
| Schenker XMG Neo 15 (Toshiba Exceria Pro SDXC 64 GB UHS-II) | |
| MSI PS63 Modern 8RC (Toshiba Exceria Pro SDXC 64 GB UHS-II) | |
| MSI Prestige PS42 8RB-059 (Toshiba Exceria Pro SDXC 64 GB UHS-II) | |
| |||||||||||||||||||||||||
Brightness Distribution: 75 %
Center on Battery: 289 cd/m²
Contrast: 1112:1 (Black: 0.26 cd/m²)
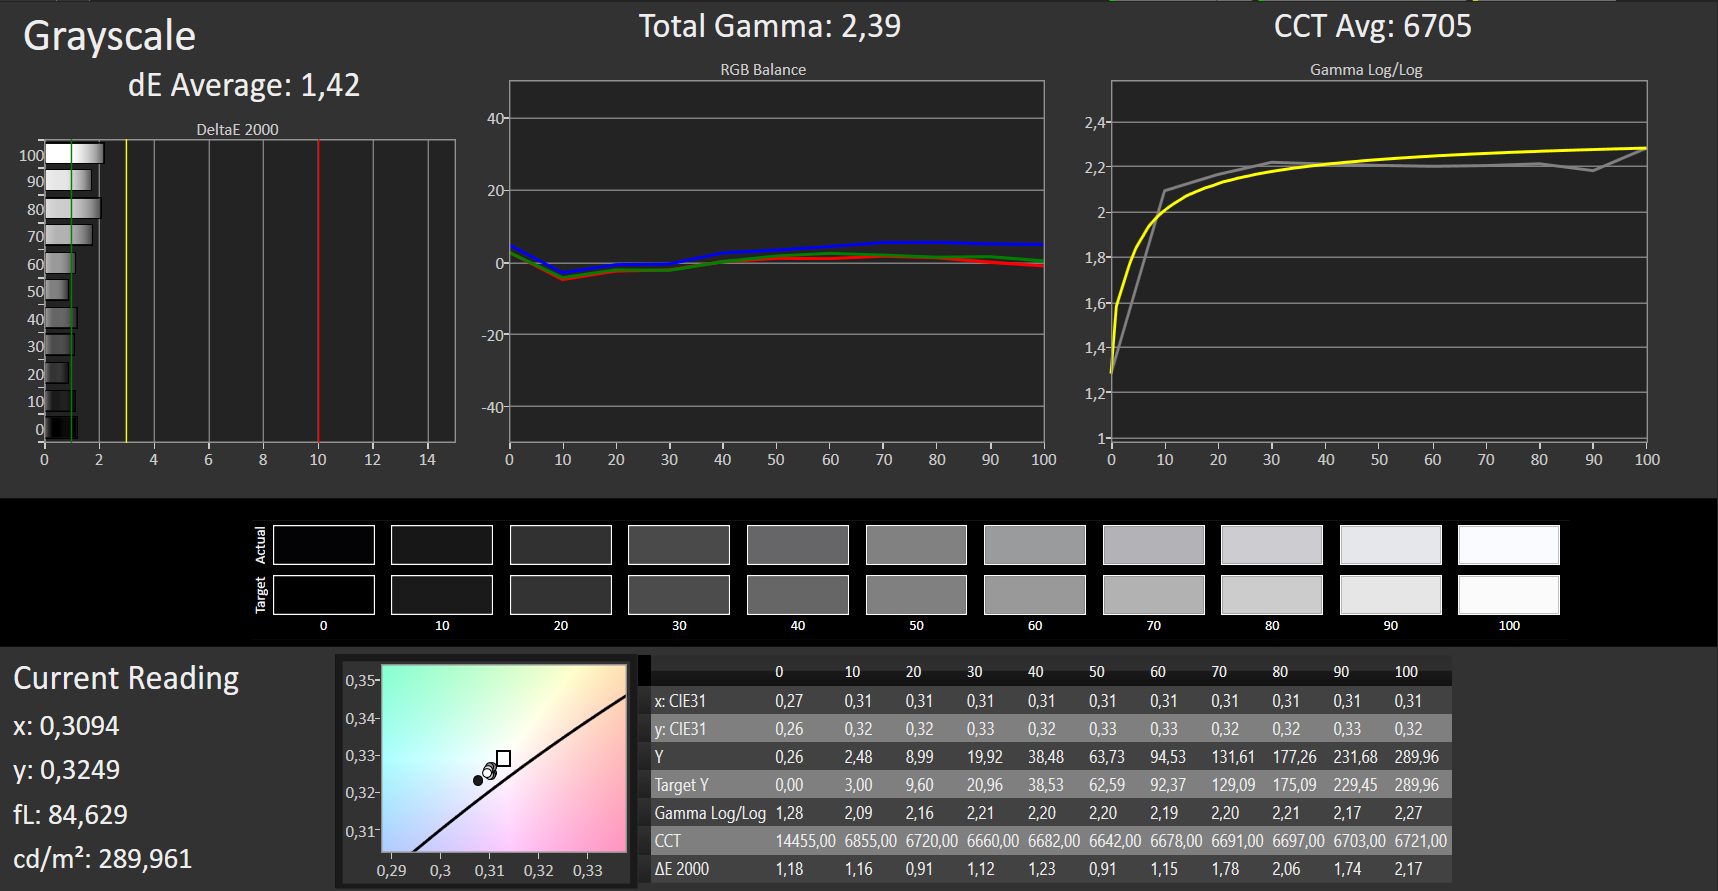
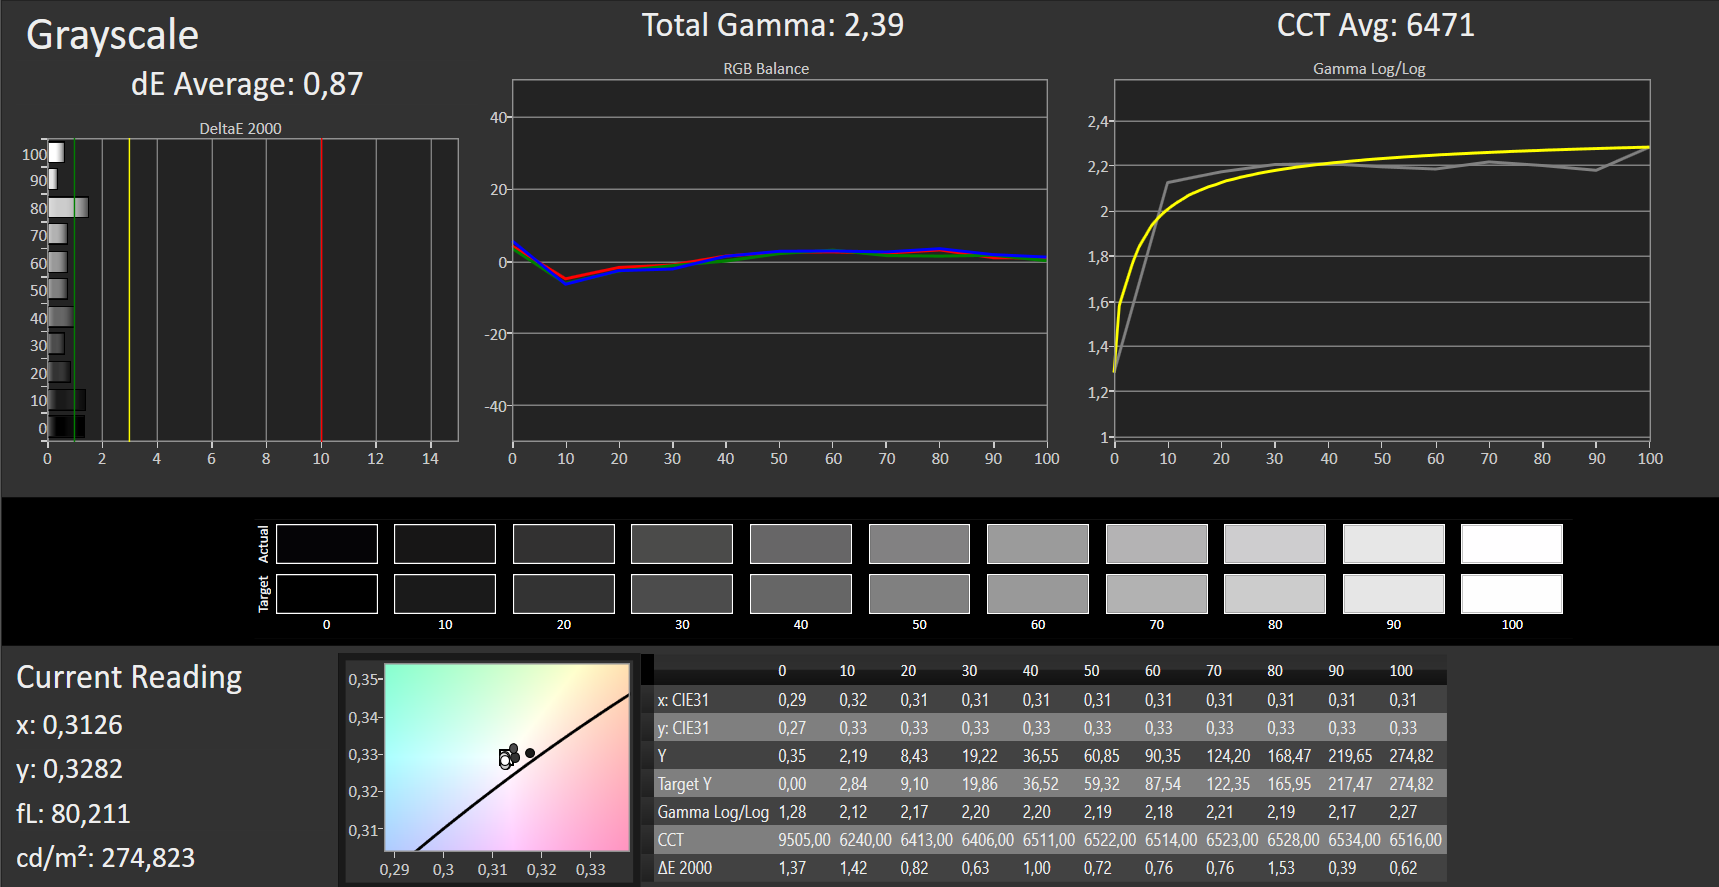
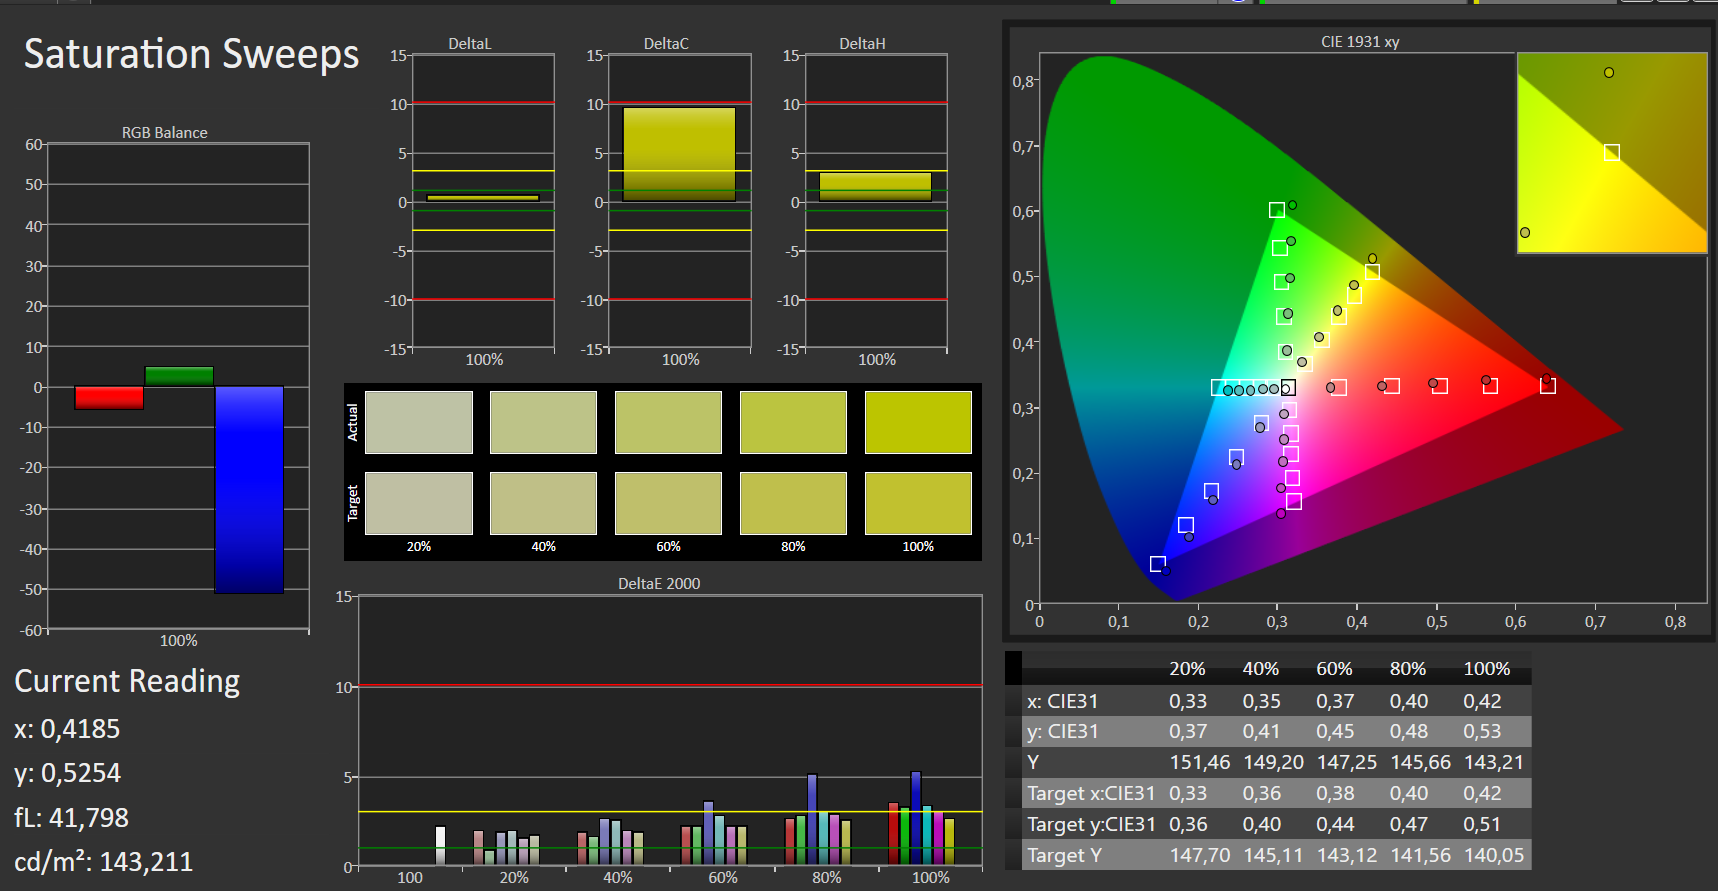
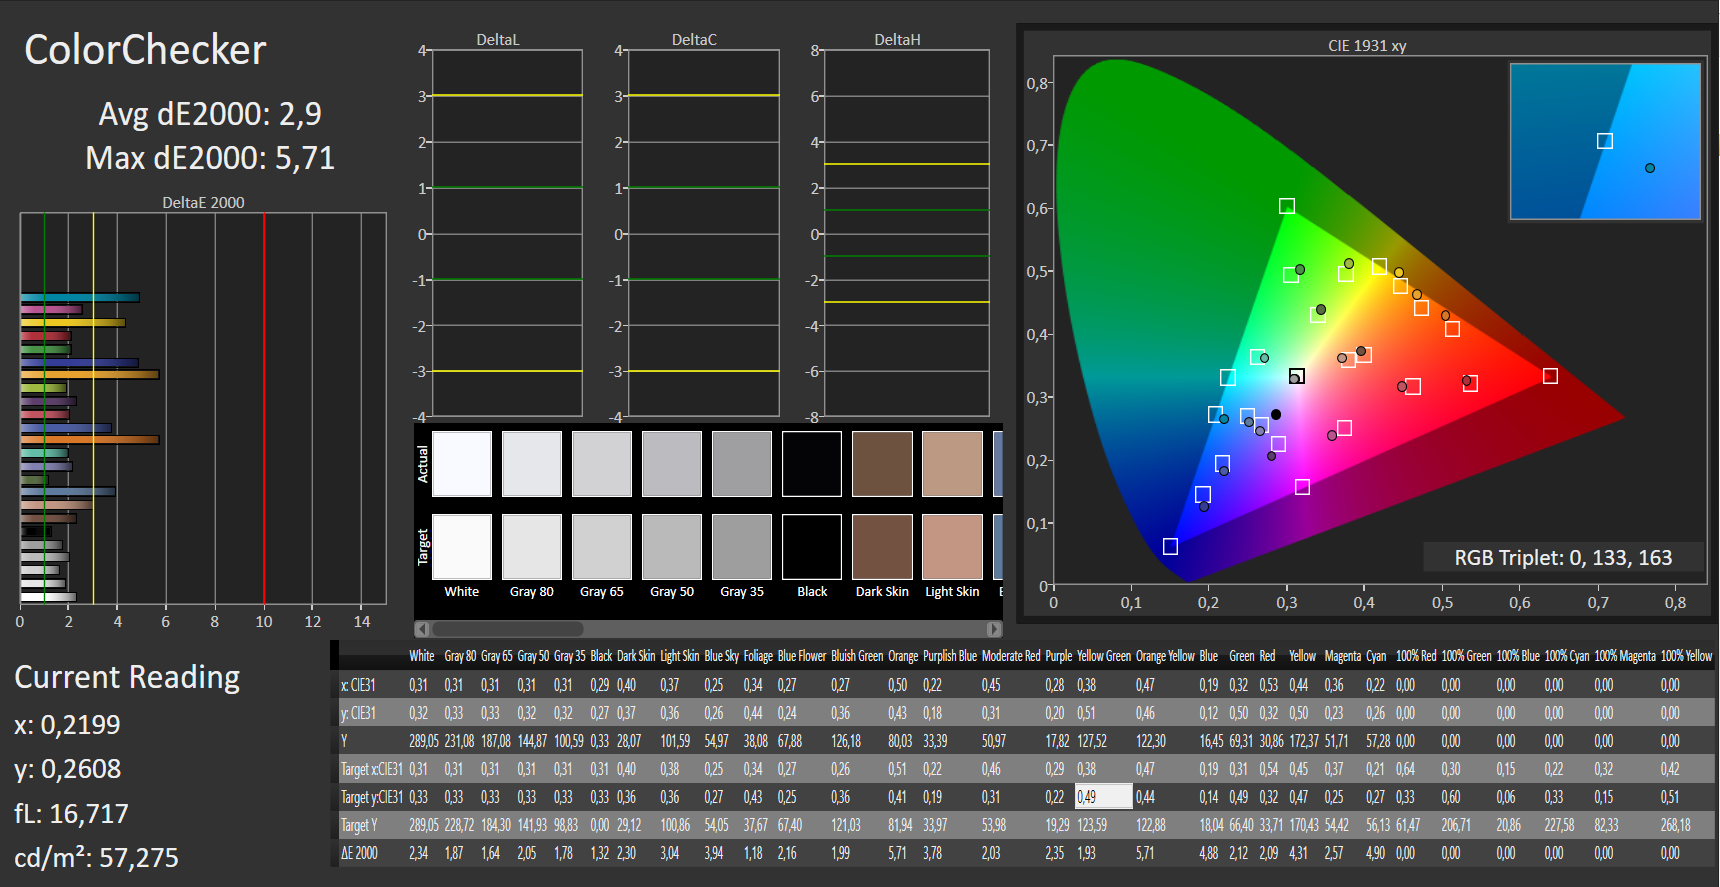
ΔE ColorChecker Calman: 2.9 | ∀{0.5-29.43 Ø4.72}
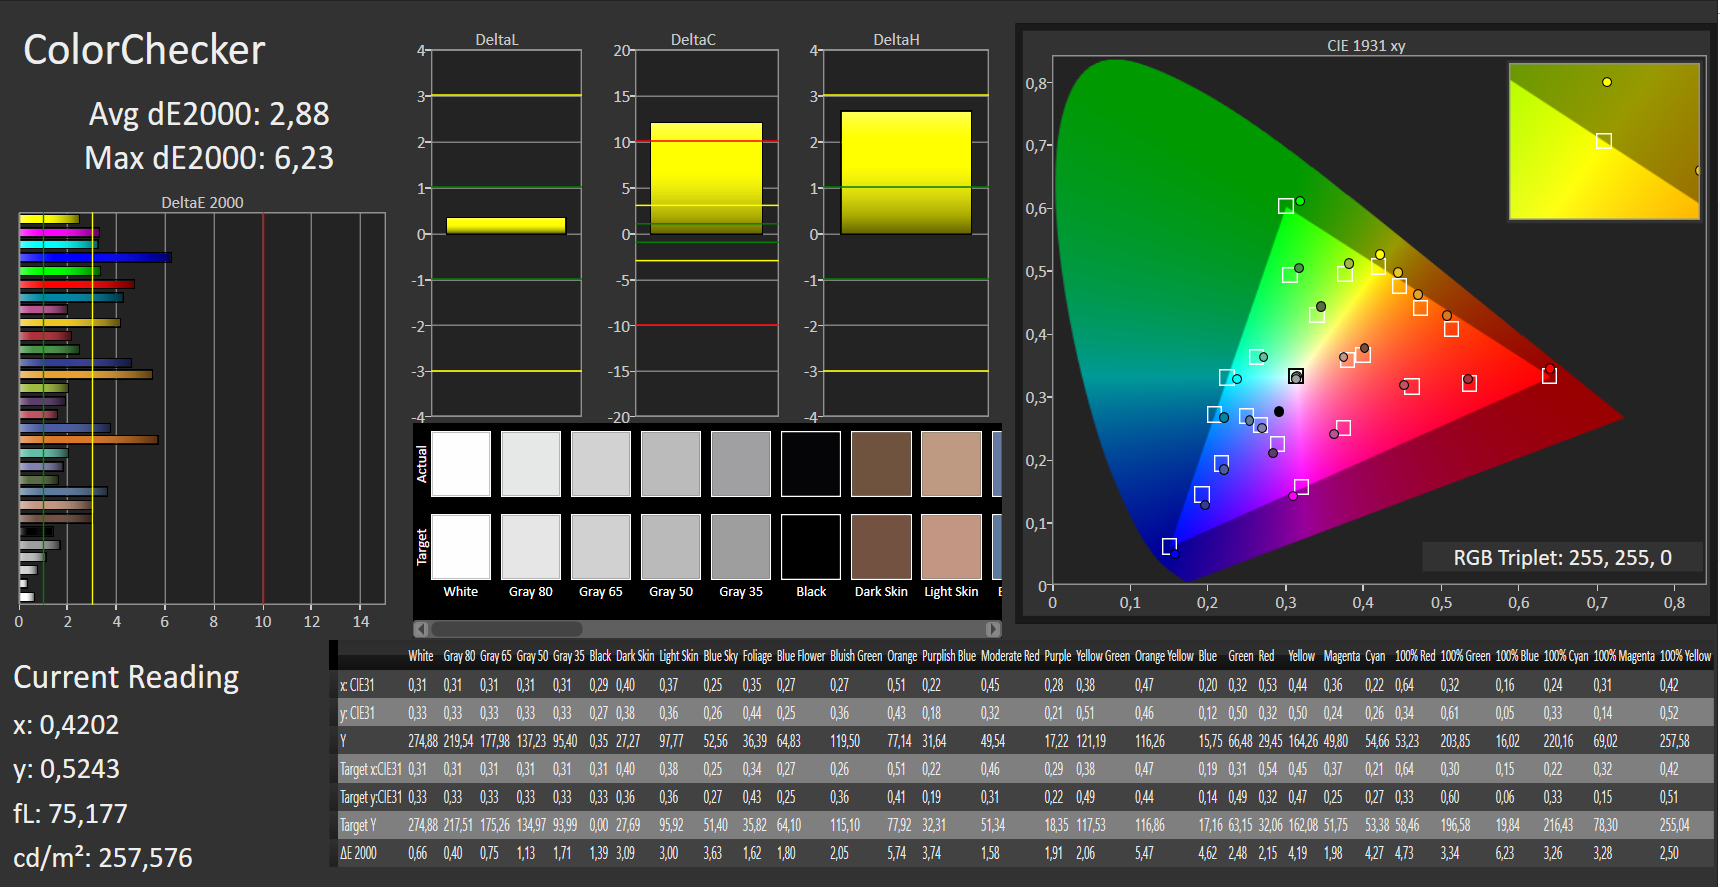
calibrated: 2.88
ΔE Greyscale Calman: 1.42 | ∀{0.09-98 Ø4.97}
87% sRGB (Argyll 1.6.3 3D)
57% AdobeRGB 1998 (Argyll 1.6.3 3D)
63.9% AdobeRGB 1998 (Argyll 3D)
87.9% sRGB (Argyll 3D)
63.5% Display P3 (Argyll 3D)
Gamma: 2.39
CCT: 6705 K
| MSI PS63 Modern 8RC Chi Mei CMN15E8 N156HCE/EN1, , 1920x1080, 15.6" | MSI Prestige PS42 8RB-059 CMN N140HCE-EN2, , 1920x1080, 14" | Schenker XMG Neo 15 LGD05C0, , 1920x1080, 15.6" | Gigabyte Aero 15X v8 LGD05C0, , 1920x1080, 15.6" | Schenker Key 15 Coffee Lake LGD05C0, , 1920x1080, 15.6" | Microsoft Surface Book 2 Panasonic MEI96A2 , , 3000x2000, 13.5" | Dell XPS 15 2018 i5 FHD 97Wh Sharp SHP149A LQ156M1, , 1920x1080, 15.6" | Lenovo ThinkPad X1 Extreme-20MF000RGE NV156FHM-N61, , 1920x1080, 15.6" | Apple MacBook Pro 15 2018 (2.6 GHz, 560X) APPA040, , 2880x1800, 15.4" | Lenovo Ideapad 720S-15IKB 81AC001AGE Chi Mei CMN15E8 / N156HCE-EN1 CMN, , 1920x1080, 15.6" | |
|---|---|---|---|---|---|---|---|---|---|---|
| Display | 9% | 3% | 3% | 2% | 8% | 6% | 3% | 35% | 1% | |
| Display P3 Coverage (%) | 63.5 | 67.5 6% | 64.3 1% | 63.6 0% | 63.4 0% | 67.9 7% | 66 4% | 68.6 8% | 98.7 55% | 63.6 0% |
| sRGB Coverage (%) | 87.9 | 98.6 12% | 94.1 7% | 93.8 7% | 93.3 6% | 95.7 9% | 96.5 10% | 88.7 1% | 99.9 14% | 89.4 2% |
| AdobeRGB 1998 Coverage (%) | 63.9 | 69.6 9% | 65.3 2% | 64.9 2% | 64.5 1% | 69.4 9% | 66.7 4% | 64.8 1% | 86.6 36% | 64.3 1% |
| Response Times | 20% | 66% | 63% | 65% | -10% | -6% | -20% | -1% | 21% | |
| Response Time Grey 50% / Grey 80% * (ms) | 42 ? | 34.4 ? 18% | 16 ? 62% | 16.8 ? 60% | 15.2 ? 64% | 52.8 ? -26% | 49 ? -17% | 52.8 ? -26% | 43.2 ? -3% | 34 ? 19% |
| Response Time Black / White * (ms) | 32 ? | 24.8 ? 22% | 9.6 ? 70% | 11.2 ? 65% | 11.2 ? 65% | 30 ? 6% | 30 ? 6% | 36 ? -13% | 31.2 ? 2% | 25 ? 22% |
| PWM Frequency (Hz) | 25000 ? | 25000 ? | 961 ? | 21370 ? | 117000 ? | 25000 ? | ||||
| Screen | 16% | 3% | 17% | -2% | 26% | 10% | -40% | 35% | -14% | |
| Brightness middle (cd/m²) | 289 | 285.4 -1% | 325 12% | 313 8% | 309 7% | 385 33% | 413 43% | 331 15% | 520 80% | 332 15% |
| Brightness (cd/m²) | 262 | 269 3% | 303 16% | 300 15% | 291 11% | 372 42% | 378 44% | 305 16% | 492 88% | 301 15% |
| Brightness Distribution (%) | 75 | 86 15% | 90 20% | 78 4% | 91 21% | 89 19% | 86 15% | 84 12% | 88 17% | 83 11% |
| Black Level * (cd/m²) | 0.26 | 0.31 -19% | 0.33 -27% | 0.33 -27% | 0.31 -19% | 0.21 19% | 0.29 -12% | 0.24 8% | 0.39 -50% | 0.29 -12% |
| Contrast (:1) | 1112 | 921 -17% | 985 -11% | 948 -15% | 997 -10% | 1833 65% | 1424 28% | 1379 24% | 1333 20% | 1145 3% |
| Colorchecker dE 2000 * | 2.9 | 1 66% | 2.69 7% | 1.29 56% | 2.96 -2% | 1.6 45% | 2.44 16% | 5.6 -93% | 1.2 59% | 3.73 -29% |
| Colorchecker dE 2000 max. * | 5.71 | 3.65 36% | 4.91 14% | 2.04 64% | 5.14 10% | 4.5 21% | 4.46 22% | 9.9 -73% | 2.3 60% | 6.6 -16% |
| Colorchecker dE 2000 calibrated * | 2.88 | 0.98 66% | 1.27 56% | 1.41 51% | 2.48 14% | 3 -4% | 2 31% | |||
| Greyscale dE 2000 * | 1.42 | 1.4 1% | 2.34 -65% | 0.69 51% | 2.88 -103% | 1.5 -6% | 2.48 -75% | 6.3 -344% | 1.3 8% | 3.96 -179% |
| Gamma | 2.39 92% | 2.25 98% | 2.38 92% | 2.43 91% | 2.33 94% | 2.22 99% | 2.43 91% | 2.33 94% | 2.18 101% | 2.4 92% |
| CCT | 6705 97% | 6699 97% | 6872 95% | 6550 99% | 6725 97% | 6502 100% | 7006 93% | 7152 91% | 6738 96% | 6921 94% |
| Color Space (Percent of AdobeRGB 1998) (%) | 57 | 63.82 12% | 60 5% | 60 5% | 60 5% | 64 12% | 62 9% | 58 2% | 58 2% | |
| Color Space (Percent of sRGB) (%) | 87 | 98.91 14% | 94 8% | 94 8% | 93 7% | 95.9 10% | 96 10% | 88.6 2% | 89 2% | |
| Total Average (Program / Settings) | 15% /
15% | 24% /
11% | 28% /
20% | 22% /
7% | 8% /
18% | 3% /
8% | -19% /
-29% | 23% /
30% | 3% /
-7% |
* ... smaller is better

Display Response Times
| ↔ Response Time Black to White | ||
|---|---|---|
| 32 ms ... rise ↗ and fall ↘ combined | ↗ 20 ms rise | 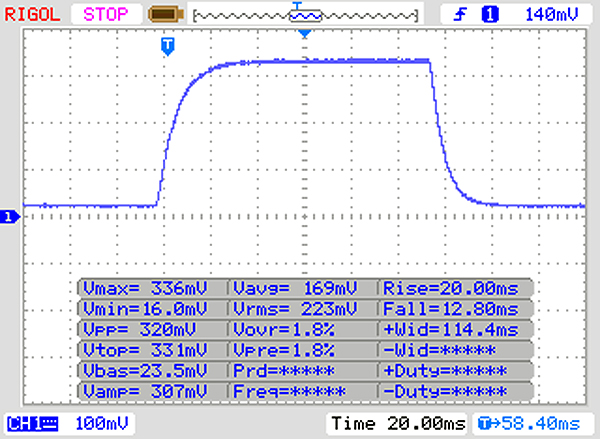 |
| ↘ 12 ms fall | ||
| The screen shows slow response rates in our tests and will be unsatisfactory for gamers. In comparison, all tested devices range from 0.1 (minimum) to 240 (maximum) ms. » 86 % of all devices are better. This means that the measured response time is worse than the average of all tested devices (19.8 ms). | ||
| ↔ Response Time 50% Grey to 80% Grey | ||
| 42 ms ... rise ↗ and fall ↘ combined | ↗ 23 ms rise | 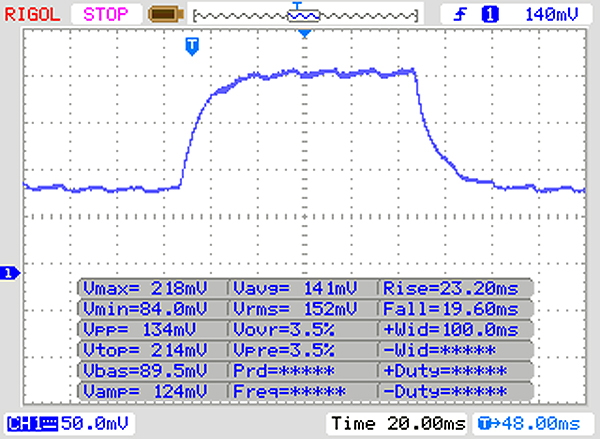 |
| ↘ 19 ms fall | ||
| The screen shows slow response rates in our tests and will be unsatisfactory for gamers. In comparison, all tested devices range from 0.165 (minimum) to 636 (maximum) ms. » 67 % of all devices are better. This means that the measured response time is worse than the average of all tested devices (31 ms). | ||
Screen Flickering / PWM (Pulse-Width Modulation)
| Screen flickering / PWM detected | 25000 Hz | ≤ 20 % brightness setting | 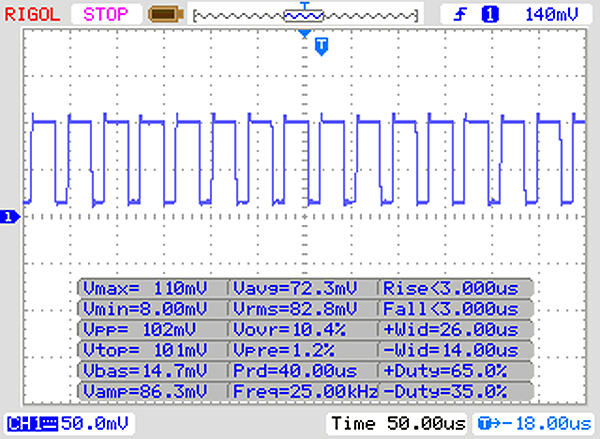 |
The display backlight flickers at 25000 Hz (worst case, e.g., utilizing PWM) Flickering detected at a brightness setting of 20 % and below. There should be no flickering or PWM above this brightness setting. The frequency of 25000 Hz is quite high, so most users sensitive to PWM should not notice any flickering. In comparison: 52 % of all tested devices do not use PWM to dim the display. If PWM was detected, an average of 7763 (minimum: 5 - maximum: 343500) Hz was measured. | |||
| PCMark 8 Home Score Accelerated v2 | 3801 points | |
| PCMark 8 Creative Score Accelerated v2 | 4844 points | |
| PCMark 8 Work Score Accelerated v2 | 4905 points | |
| PCMark 10 Score | 4020 points | |
Help | ||
| MSI PS63 Modern 8RC WDC PC SN520 SDAPNUW-512G | Gigabyte Aero 15X v8 Toshiba NVMe THNSN5512GPU7 | Schenker Key 15 Coffee Lake Samsung SSD 970 EVO 500GB | Microsoft Surface Book 2 Samsung PM961 MZVLW256HEHP | Dell XPS 15 2018 i5 FHD 97Wh Lite-On CA3-8D256-Q11 | Lenovo ThinkPad X1 Extreme-20MF000RGE Samsung SSD PM981 MZVLB256HAHQ | Apple MacBook Pro 15 2018 (2.6 GHz, 560X) Apple SSD AP0512 | Lenovo Ideapad 720S-15IKB 81AC001AGE Samsung SSD PM981 MZVLB512HAJQ | Average WDC PC SN520 SDAPNUW-512G | |
|---|---|---|---|---|---|---|---|---|---|
| CrystalDiskMark 5.2 / 6 | 7% | 29% | 4% | 4% | 20% | 3% | 46% | 15% | |
| Write 4K (MB/s) | 121.3 | 94.4 -22% | 113.5 -6% | 140.6 16% | 89.4 -26% | 109.4 -10% | 43.59 -64% 35.92 -70% | 139.3 15% | 138.5 ? 14% |
| Read 4K (MB/s) | 44.07 | 37.65 -15% | 43.49 -1% | 43.62 -1% | 44.64 1% | 41.5 -6% | 12.68 -71% 11.67 -74% | 46.78 6% | 44.2 ? 0% |
| Write Seq (MB/s) | 1176 | 1335 14% | 1466 25% | 343.3 -71% | 830 -29% | 1460 24% | 1605 36% 1522 29% | 2125 81% | 1265 ? 8% |
| Read Seq (MB/s) | 1139 | 1404 23% | 1200 5% | 1452 27% | 1774 56% | 1561 37% | 1595 40% 1528 34% | 2354 107% | 1237 ? 9% |
| Write 4K Q32T1 (MB/s) | 257.8 | 268.6 4% | 295.4 15% | 344.4 34% | 310.6 20% | 278.4 8% | 232.7 -10% 204.5 -21% | 298.4 16% | 404 ? 57% |
| Read 4K Q32T1 (MB/s) | 325.9 | 332.8 2% | 376.8 16% | 457.2 40% | 266.4 -18% | 354.9 9% | 404 24% 393.3 21% | 355.8 9% | 421 ? 29% |
| Write Seq Q32T1 (MB/s) | 1455 | 1375 -5% | 2498 72% | 344.3 -76% | 831 -43% | 1461 0% | 1770 22% 1756 21% | 2128 46% | 1491 ? 2% |
| Read Seq Q32T1 (MB/s) | 1741 | 2627 51% | 3549 104% | 2885 66% | 2962 70% | 3452 98% | 2993 72% 2805 61% | 3324 91% | 1741 ? 0% |
| Write 4K Q8T8 (MB/s) | 1415 | 715 ? | |||||||
| Read 4K Q8T8 (MB/s) | 572 | 1027 ? | |||||||
| AS SSD | -32% | 38% | -385% | 4% | -56% | 29% | -13% | ||
| Seq Read (MB/s) | 1372 | 2213 61% | 2685 96% | 1574 15% | 2612 90% | 2239 63% | 2469 80% | 1363 ? -1% | |
| Seq Write (MB/s) | 1244 | 1163 -7% | 2325 87% | 340.3 -73% | 1386 11% | 1644 32% | 1991 60% | 1227 ? -1% | |
| 4K Read (MB/s) | 43.34 | 23.36 -46% | 53.6 24% | 32.5 -25% | 53 22% | 9.46 -78% | 54.3 25% | 40.8 ? -6% | |
| 4K Write (MB/s) | 162.2 | 80.4 -50% | 131.9 -19% | 5.12 -97% | 119.4 -26% | 18.78 -88% | 99.8 -38% | 127.3 ? -22% | |
| 4K-64 Read (MB/s) | 1044 | 847 -19% | 1339 28% | 301.8 -71% | 764 -27% | 965 -8% | 1823 75% | 957 ? -8% | |
| 4K-64 Write (MB/s) | 1111 | 742 -33% | 1836 65% | 19.19 -98% | 1270 14% | 163.5 -85% | 1282 15% | 1081 ? -3% | |
| Access Time Read * (ms) | 0.058 | 0.119 -105% | 0.045 22% | 0.086 -48% | 0.062 -7% | 0.225 -288% | 0.042 28% | 0.07744 ? -34% | |
| Access Time Write * (ms) | 0.024 | 0.046 -92% | 0.029 -21% | 0.889 -3604% | 0.031 -29% | 0.039 -63% | 0.03671 ? -53% | ||
| Score Read (Points) | 1224 | 1092 -11% | 1661 36% | 492 -60% | 1078 -12% | 1199 -2% | 2125 74% | 1134 ? -7% | |
| Score Write (Points) | 1398 | 939 -33% | 2200 57% | 58 -96% | 1528 9% | 347 -75% | 1581 13% | 1331 ? -5% | |
| Score Total (Points) | 3249 | 2536 -22% | 4701 45% | 750 -77% | 3111 -4% | 2119 -35% | 4771 47% | 3046 ? -6% | |
| Copy ISO MB/s (MB/s) | 632 | 1637 | 1169 ? | ||||||
| Copy Program MB/s (MB/s) | 117.2 | 466.8 | 446 ? | ||||||
| Copy Game MB/s (MB/s) | 465.9 | 960 | 874 ? | ||||||
| Total Average (Program / Settings) | -13% /
-16% | 34% /
34% | 4% /
4% | -191% /
-221% | 12% /
11% | -27% /
-20% | 38% /
36% | 1% /
-1% |
* ... smaller is better

| 3DMark 11 - 1280x720 Performance GPU | |
| Average of class Multimedia (3749 - 60002, n=61, last 2 years) | |
| Gigabyte Aero 15X v8 | |
| MSI P65 8RF-451 - Creator | |
| Schenker Key 15 Coffee Lake | |
| MSI GS65 Stealth Thin 8RE-051US | |
| Schenker XMG Neo 15 | |
| Lenovo ThinkPad X1 Extreme-20MF000RGE | |
| Lenovo Ideapad 720S-15IKB 81AC001AGE | |
| Dell XPS 15 2018 i5 FHD 97Wh | |
| Apple MacBook Pro 15 2018 (2.6 GHz, 560X) | |
| Microsoft Surface Book 2 | |
| MSI PS63 Modern 8RC | |
| Average NVIDIA GeForce GTX 1050 Max-Q (6874 - 7385, n=4) | |
| MSI Prestige PS42 8RB-059 | |
| 3DMark 11 Performance | 7299 points | |
| 3DMark Cloud Gate Standard Score | 18526 points | |
| 3DMark Fire Strike Score | 5292 points | |
Help | ||
| Thief - 1920x1080 Very High Preset AA:FXAA & High SS AF:8x | |
| MSI PS63 Modern 8RC | |
| Average NVIDIA GeForce GTX 1050 Max-Q (38 - 38.8, n=2) | |
| Rise of the Tomb Raider - 1920x1080 High Preset AA:FX AF:4x | |
| MSI P65 8RF-451 - Creator | |
| MSI GS65 Stealth Thin 8RE-051US | |
| Dell XPS 15 2018 i5 FHD 97Wh | |
| Lenovo Ideapad 720S-15IKB 81AC001AGE | |
| Microsoft Surface Book 2 | |
| Average NVIDIA GeForce GTX 1050 Max-Q (33.9 - 36, n=3) | |
| MSI PS63 Modern 8RC | |
| Apple MacBook Pro 15 2018 (2.6 GHz, 560X) | |
| MSI Prestige PS42 8RB-059 | |
| Shadow of the Tomb Raider - 1920x1080 Medium Preset | |
| Average of class Multimedia (28 - 167, n=8, last 2 years) | |
| MSI P65 8RF-451 - Creator | |
| MSI PS63 Modern 8RC | |
| Apple MacBook Pro 15 2018 (2.6 GHz, 560X) | |
| Average NVIDIA GeForce GTX 1050 Max-Q (27 - 33, n=2) | |
| Battlefield V - 1920x1080 Ultra Preset | |
| MSI PS63 Modern 8RC | |
| Average NVIDIA GeForce GTX 1050 Max-Q (n=1) | |
| Apple MacBook Pro 15 2018 (2.6 GHz, 560X) | |
| Darksiders III - 1920x1080 High | |
| MSI PS63 Modern 8RC | |
| Average NVIDIA GeForce GTX 1050 Max-Q (n=1) | |
| Apple MacBook Pro 15 2018 (2.6 GHz, 560X) | |
| low | med. | high | ultra | |
|---|---|---|---|---|
| BioShock Infinite (2013) | 147.7 | 62.1 | ||
| Thief (2014) | 56.5 | 57.2 | 38.8 | |
| Rise of the Tomb Raider (2016) | 41.4 | 34.6 | 28.7 | |
| Shadow of the Tomb Raider (2018) | 57 | 33 | 26 | 22 |
| FIFA 19 (2018) | 96.5 | 100.8 | ||
| Battlefield V (2018) | 46.1 | 39.7 | 36.5 | |
| Darksiders III (2018) | 33.6 | 37.2 | 31.5 |
Noise level
| Idle |
| 30.7 / 30.7 / 30.7 dB(A) |
| Load |
| 34 / 33.7 dB(A) |
 | ||
30 dB silent 40 dB(A) audible 50 dB(A) loud |
||
min: | ||
(-) The maximum temperature on the upper side is 58.6 °C / 137 F, compared to the average of 36.8 °C / 98 F, ranging from 21 to 71 °C for the class Multimedia.
(-) The bottom heats up to a maximum of 60 °C / 140 F, compared to the average of 39.1 °C / 102 F
(+) In idle usage, the average temperature for the upper side is 24.3 °C / 76 F, compared to the device average of 31.3 °C / 88 F.
(+) The palmrests and touchpad are reaching skin temperature as a maximum (33 °C / 91.4 F) and are therefore not hot.
(-) The average temperature of the palmrest area of similar devices was 28.7 °C / 83.7 F (-4.3 °C / -7.7 F).
MSI PS63 Modern 8RC audio analysis
(±) | speaker loudness is average but good (72 dB)
Bass 100 - 315 Hz
(-) | nearly no bass - on average 24.4% lower than median
(±) | linearity of bass is average (10.3% delta to prev. frequency)
Mids 400 - 2000 Hz
(±) | higher mids - on average 6% higher than median
(±) | linearity of mids is average (10.9% delta to prev. frequency)
Highs 2 - 16 kHz
(+) | balanced highs - only 3.2% away from median
(±) | linearity of highs is average (7.8% delta to prev. frequency)
Overall 100 - 16.000 Hz
(±) | linearity of overall sound is average (26.5% difference to median)
Compared to same class
» 92% of all tested devices in this class were better, 1% similar, 6% worse
» The best had a delta of 5%, average was 17%, worst was 45%
Compared to all devices tested
» 81% of all tested devices were better, 4% similar, 15% worse
» The best had a delta of 4%, average was 23%, worst was 134%
Dell XPS 15 2018 i5 FHD 97Wh audio analysis
(±) | speaker loudness is average but good (73 dB)
Bass 100 - 315 Hz
(±) | reduced bass - on average 10.9% lower than median
(+) | bass is linear (4.9% delta to prev. frequency)
Mids 400 - 2000 Hz
(±) | higher mids - on average 6.8% higher than median
(+) | mids are linear (6.8% delta to prev. frequency)
Highs 2 - 16 kHz
(+) | balanced highs - only 3.7% away from median
(+) | highs are linear (6.9% delta to prev. frequency)
Overall 100 - 16.000 Hz
(±) | linearity of overall sound is average (16.6% difference to median)
Compared to same class
» 44% of all tested devices in this class were better, 7% similar, 50% worse
» The best had a delta of 5%, average was 17%, worst was 45%
Compared to all devices tested
» 29% of all tested devices were better, 6% similar, 65% worse
» The best had a delta of 4%, average was 23%, worst was 134%
Microsoft Surface Book 2 audio analysis
(±) | speaker loudness is average but good (74.2 dB)
Bass 100 - 315 Hz
(±) | reduced bass - on average 12.4% lower than median
(±) | linearity of bass is average (12.3% delta to prev. frequency)
Mids 400 - 2000 Hz
(+) | balanced mids - only 1.9% away from median
(+) | mids are linear (3.6% delta to prev. frequency)
Highs 2 - 16 kHz
(+) | balanced highs - only 4.8% away from median
(±) | linearity of highs is average (9.3% delta to prev. frequency)
Overall 100 - 16.000 Hz
(±) | linearity of overall sound is average (18.2% difference to median)
Compared to same class
» 40% of all tested devices in this class were better, 7% similar, 53% worse
» The best had a delta of 6%, average was 20%, worst was 57%
Compared to all devices tested
» 39% of all tested devices were better, 8% similar, 53% worse
» The best had a delta of 4%, average was 23%, worst was 134%
| Off / Standby | |
| Idle | |
| Load |
|
Key:
min: | |
| MSI PS63 Modern 8RC i7-8565U, GeForce GTX 1050 Max-Q, WDC PC SN520 SDAPNUW-512G, IPS, 1920x1080, 15.6" | Schenker XMG Neo 15 i7-8750H, GeForce GTX 1060 Mobile, Samsung SSD 970 Pro 1TB, IPS, 1920x1080, 15.6" | Gigabyte Aero 15X v8 i7-8750H, GeForce GTX 1070 Max-Q, Toshiba NVMe THNSN5512GPU7, IPS, 1920x1080, 15.6" | Schenker Key 15 Coffee Lake i7-8750H, GeForce GTX 1070 Max-Q, Samsung SSD 970 EVO 500GB, IPS, 1920x1080, 15.6" | Microsoft Surface Book 2 i7-8650U, GeForce GTX 1050 Mobile, Samsung PM961 MZVLW256HEHP, IPS, 3000x2000, 13.5" | Dell XPS 15 2018 i5 FHD 97Wh i5-8300H, GeForce GTX 1050 Mobile, Lite-On CA3-8D256-Q11, LED IGZO IPS InfinityEdge, 1920x1080, 15.6" | Lenovo ThinkPad X1 Extreme-20MF000RGE i5-8300H, GeForce GTX 1050 Ti Max-Q, Samsung SSD PM981 MZVLB256HAHQ, IPS LED, 1920x1080, 15.6" | Average NVIDIA GeForce GTX 1050 Max-Q | Average of class Multimedia | |
|---|---|---|---|---|---|---|---|---|---|
| Power Consumption | -51% | -78% | -75% | 0% | 23% | 7% | 4% | 0% | |
| Idle Minimum * (Watt) | 6.8 | 10 -47% | 14 -106% | 14 -106% | 4.7 31% | 2.9 57% | 4.14 39% | 4.48 ? 34% | 5.65 ? 17% |
| Idle Average * (Watt) | 9.8 | 13 -33% | 18 -84% | 17 -73% | 10.6 -8% | 5.8 41% | 7.3 26% | 9.58 ? 2% | 10 ? -2% |
| Idle Maximum * (Watt) | 11.4 | 18 -58% | 22 -93% | 22 -93% | 12.3 -8% | 7.5 34% | 11.5 -1% | 11.6 ? -2% | 12.3 ? -8% |
| Load Average * (Watt) | 76 | 95 -25% | 91 -20% | 102 -34% | 81 -7% | 77.5 -2% | 78.8 -4% | 77.3 ? -2% | 65.1 ? 14% |
| Load Maximum * (Watt) | 93 | 179 -92% | 173 -86% | 157 -69% | 100.3 -8% | 107 -15% | 118 -27% | 105.5 ? -13% | 112.5 ? -21% |
| Witcher 3 ultra * (Watt) | 114 | 142 | 130 | 97 | 84 | 82 |
* ... smaller is better
| MSI PS63 Modern 8RC i7-8565U, GeForce GTX 1050 Max-Q, 82 Wh | MSI P65 8RF-451 - Creator i7-8750H, GeForce GTX 1070 Max-Q, 82 Wh | MSI GS65 Stealth Thin 8RE-051US i7-8750H, GeForce GTX 1060 Mobile, 82 Wh | Schenker Key 15 Coffee Lake i7-8750H, GeForce GTX 1070 Max-Q, 55 Wh | Microsoft Surface Book 2 i7-8650U, GeForce GTX 1050 Mobile, 75 Wh | MSI Prestige PS42 8RB-059 i5-8550U, GeForce MX150, 50 Wh | Schenker XMG Neo 15 i7-8750H, GeForce GTX 1060 Mobile, 46.7 Wh | Gigabyte Aero 15X v8 i7-8750H, GeForce GTX 1070 Max-Q, 94.24 Wh | Lenovo Ideapad 720S-15IKB 81AC001AGE i7-7700HQ, GeForce GTX 1050 Ti Max-Q, 79 Wh | Dell XPS 15 2018 i5 FHD 97Wh i5-8300H, GeForce GTX 1050 Mobile, 97 Wh | Apple MacBook Pro 15 2018 (2.6 GHz, 560X) i7-8850H, Radeon Pro 560X, 83 Wh | Lenovo ThinkPad X1 Extreme-20MF000RGE i5-8300H, GeForce GTX 1050 Ti Max-Q, 80 Wh | Average of class Multimedia | |
|---|---|---|---|---|---|---|---|---|---|---|---|---|---|
| Battery runtime | -45% | -52% | -59% | 29% | 7% | -48% | -14% | 3% | 3% | -11% | -1% | 15% | |
| Reader / Idle (h) | 14 | 7.5 -46% | 5 -64% | 24.5 75% | 16.8 20% | 6.7 -52% | 12.7 -9% | 22.6 61% | 21 50% | 25.2 ? 80% | |||
| WiFi v1.3 (h) | 11.4 | 7.1 -38% | 6.2 -46% | 3.7 -68% | 11.1 -3% | 14.9 31% | 4.4 -61% | 8.6 -25% | 9.8 -14% | 15.7 38% | 10.2 -11% | 9.4 -18% | 12 ? 5% |
| Load (h) | 2.8 | 1.4 -50% | 1.2 -57% | 1.5 -46% | 3.2 14% | 2 -29% | 1.9 -32% | 2.6 -7% | 1.7 -39% | 1.9 -32% | 1.8 -36% | 1.669 ? -40% | |
| H.264 (h) | 5.9 | 15.6 | 4.8 | 8.4 | 11.1 | 11.7 | 9.6 | 16.2 ? | |||||
| Witcher 3 ultra (h) | 3.8 | 1 | 1.5 |
Pros
Cons
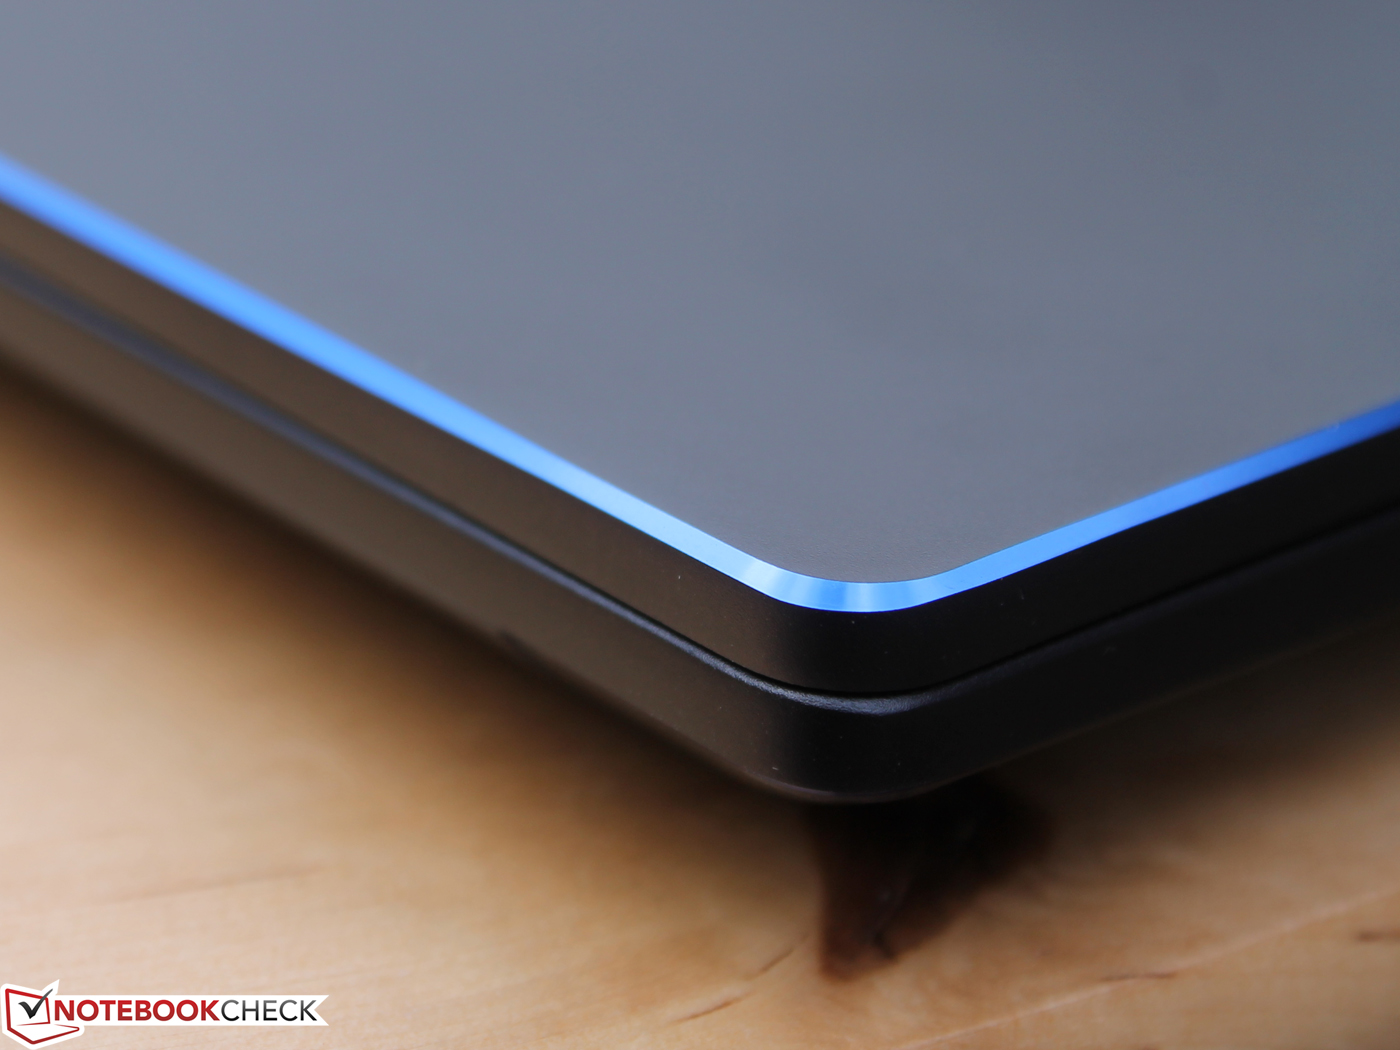
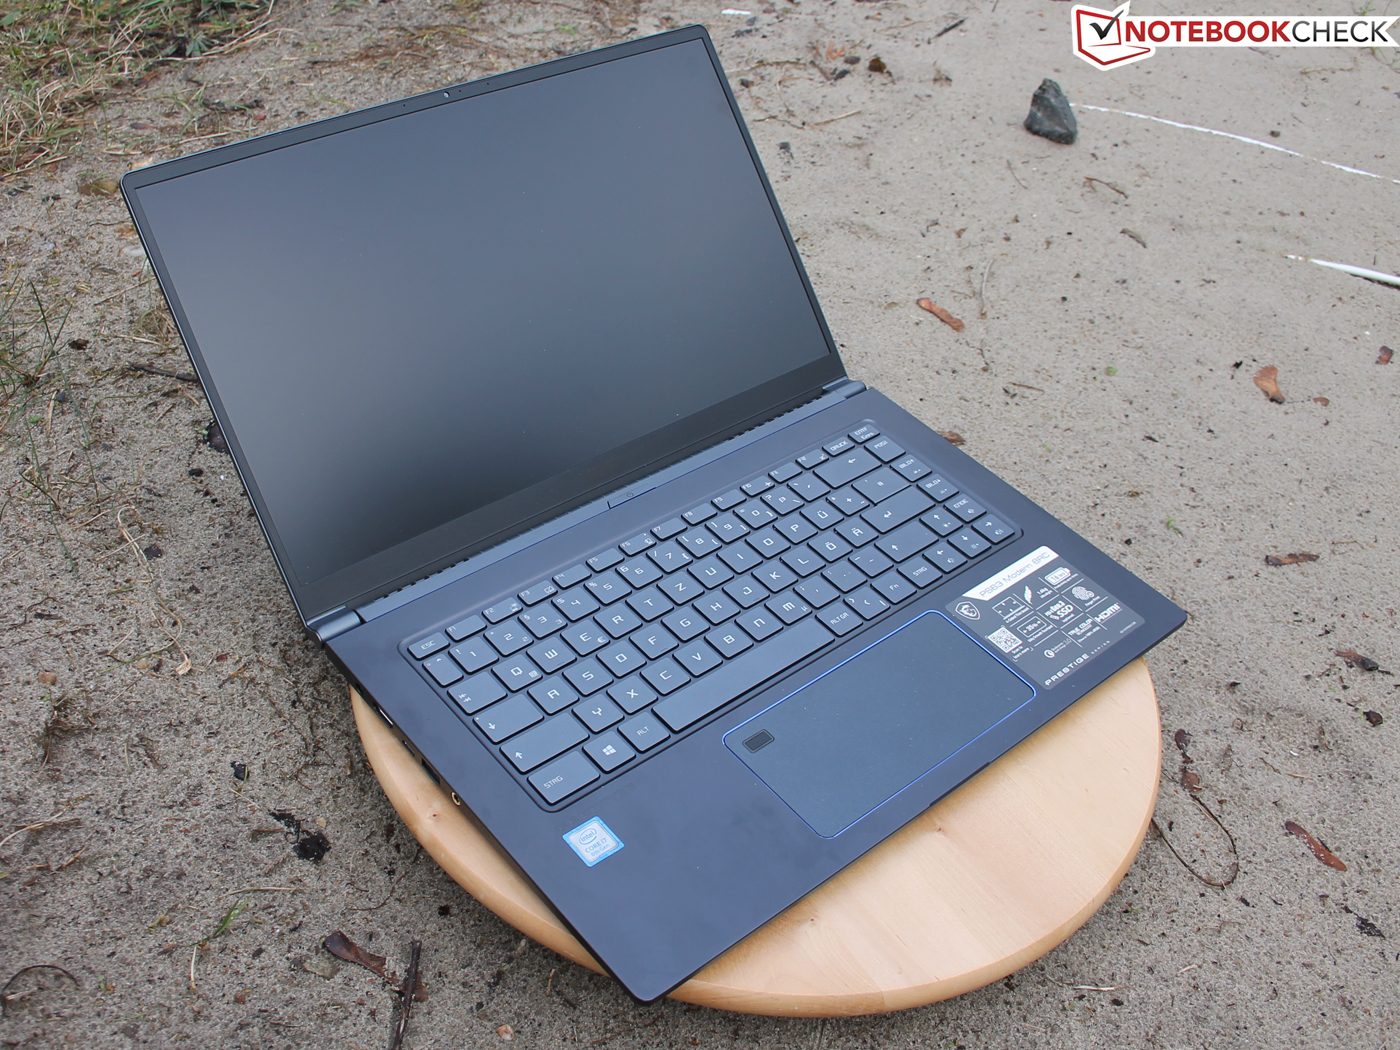
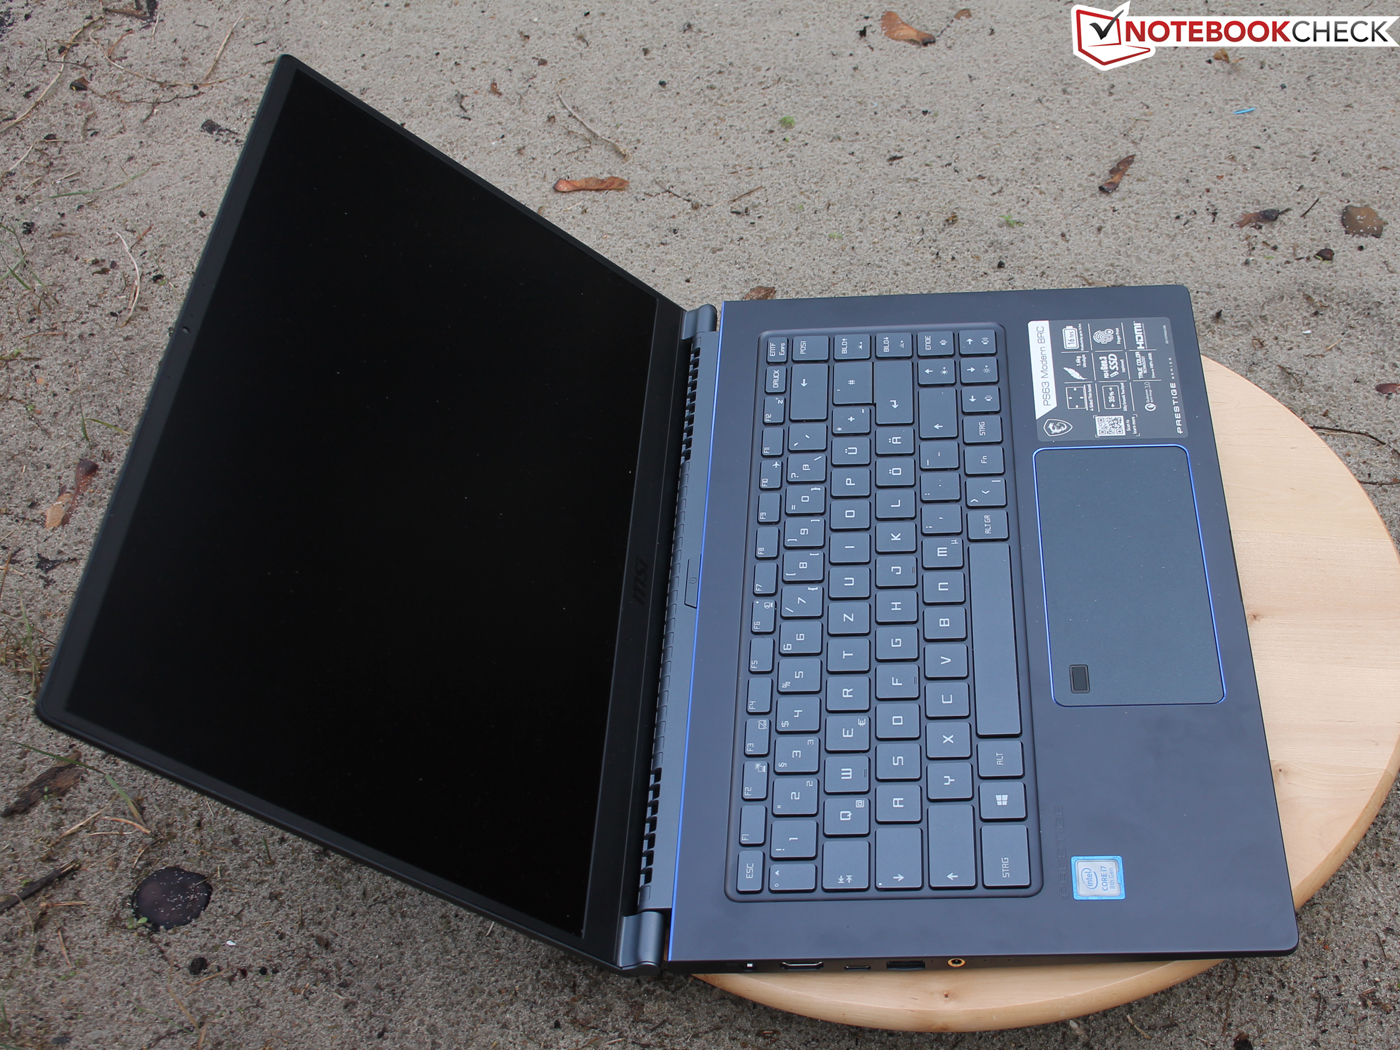
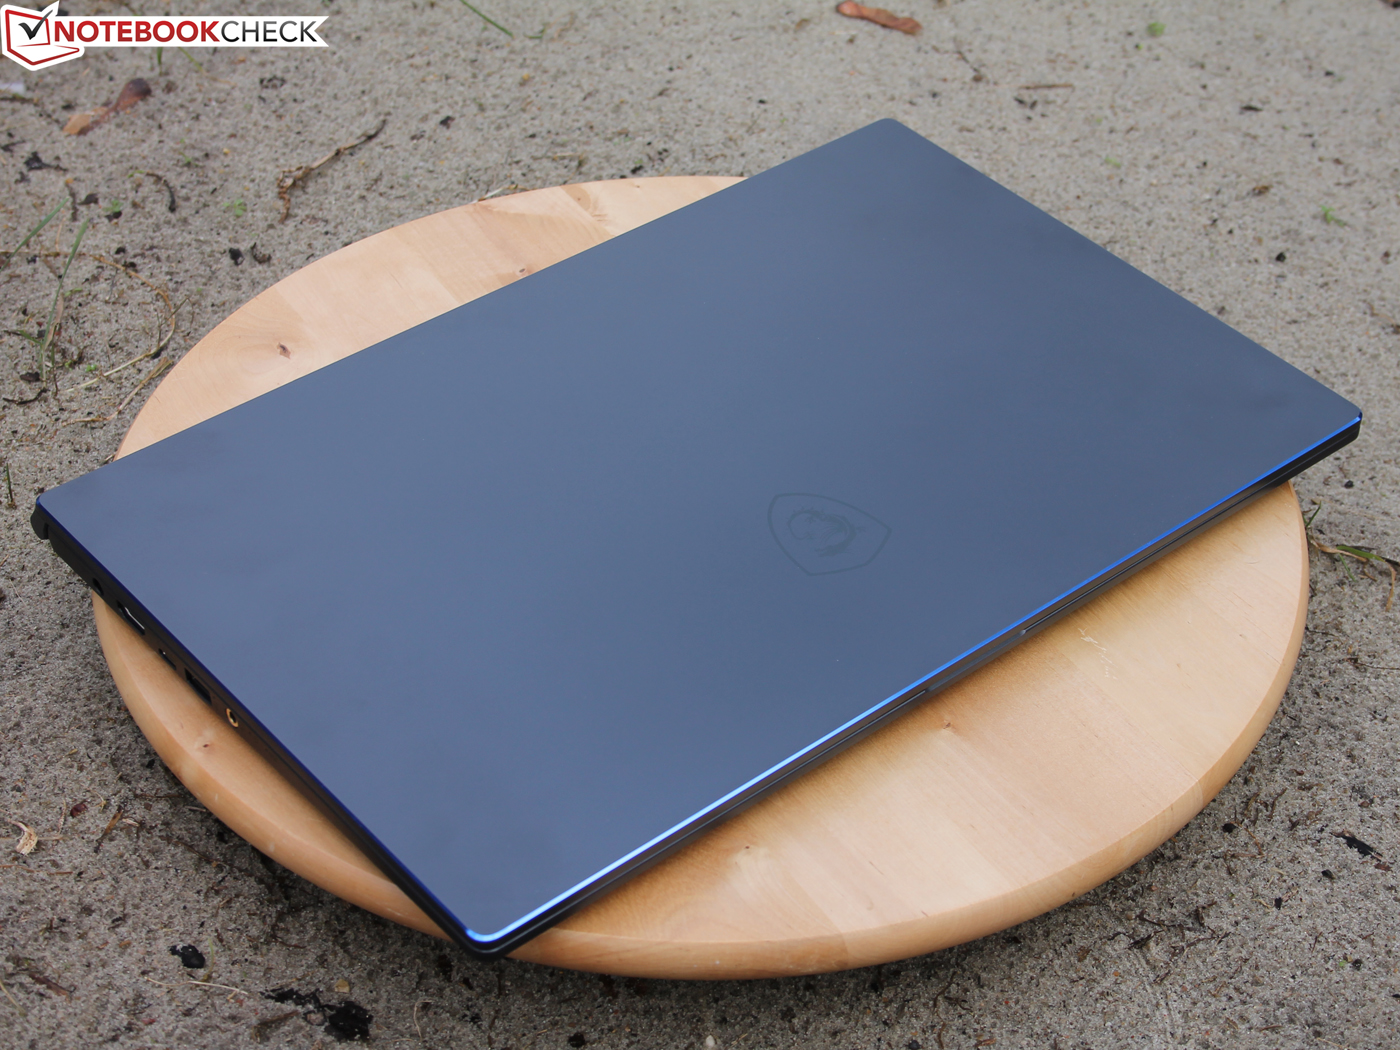
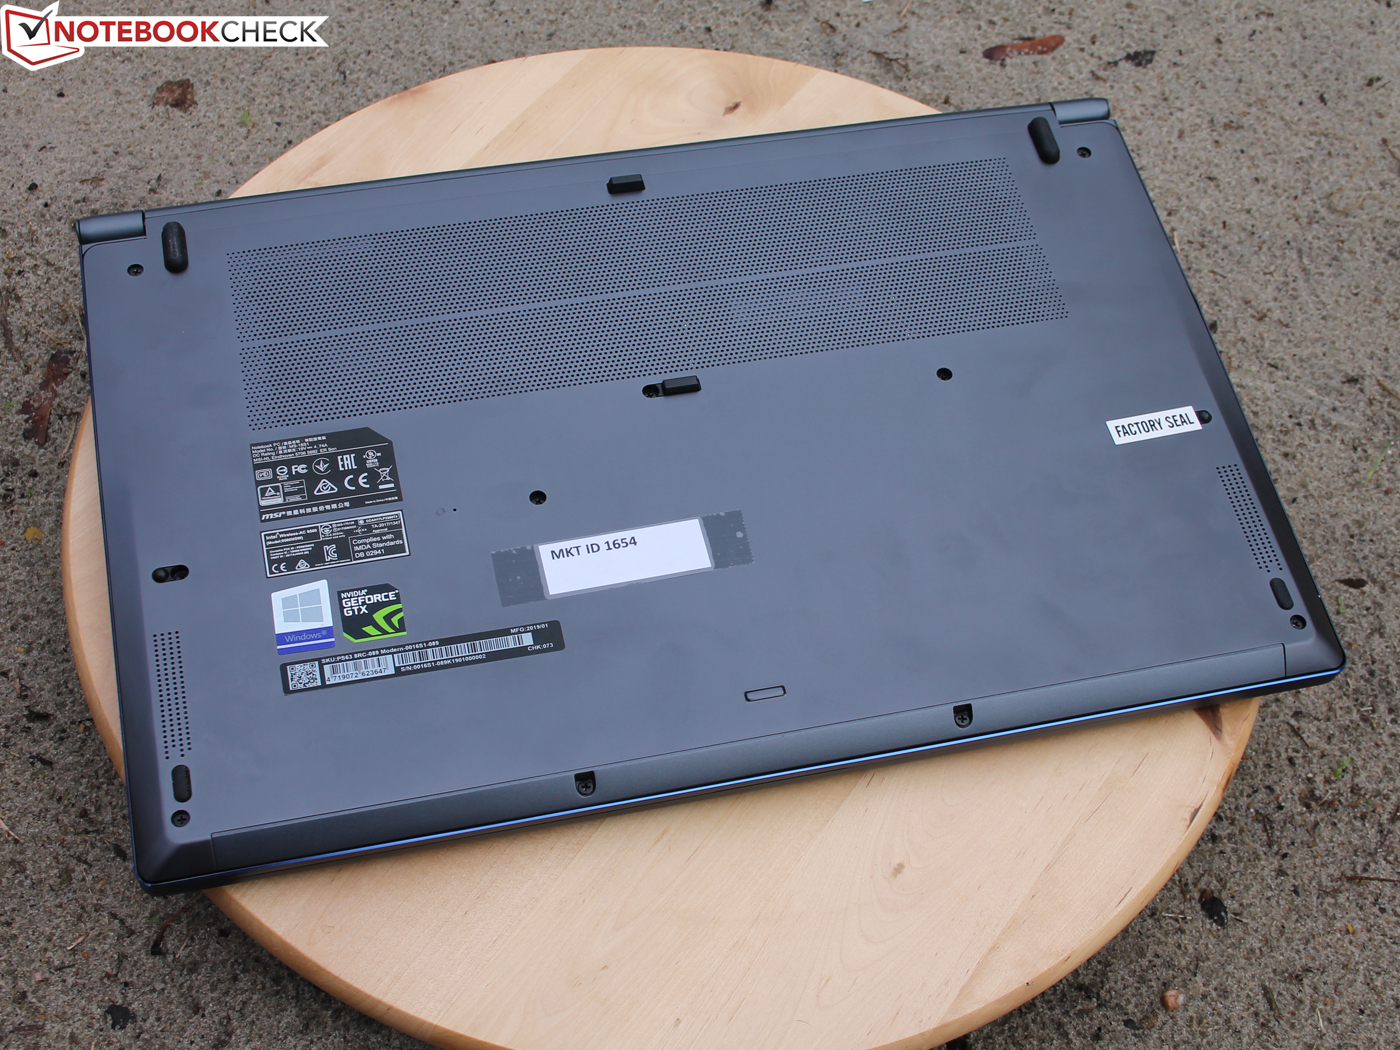
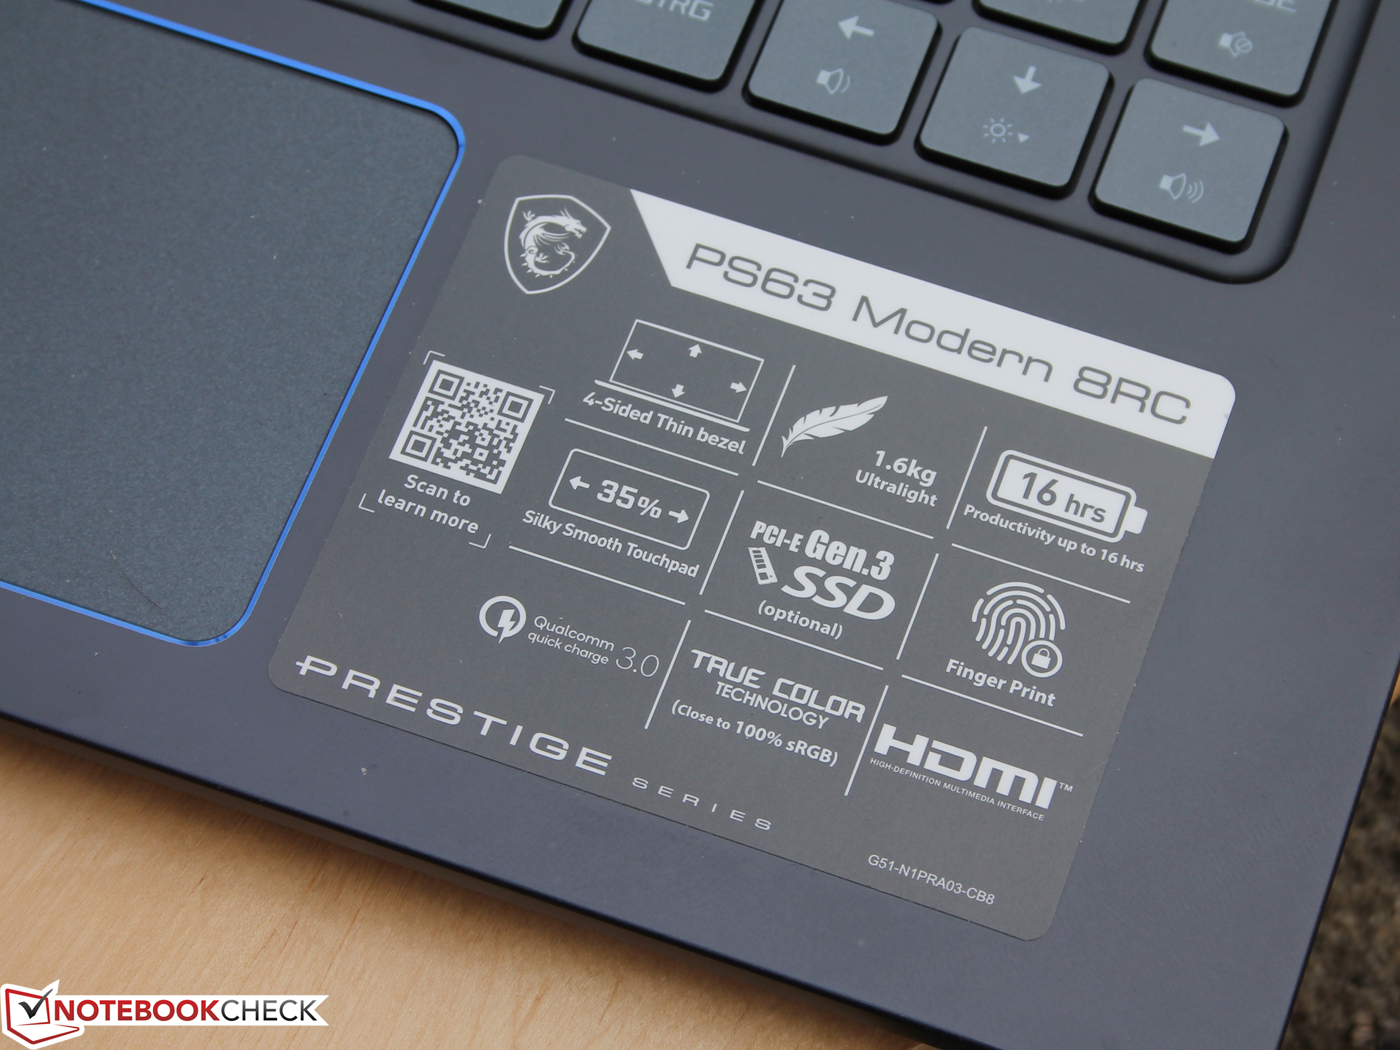
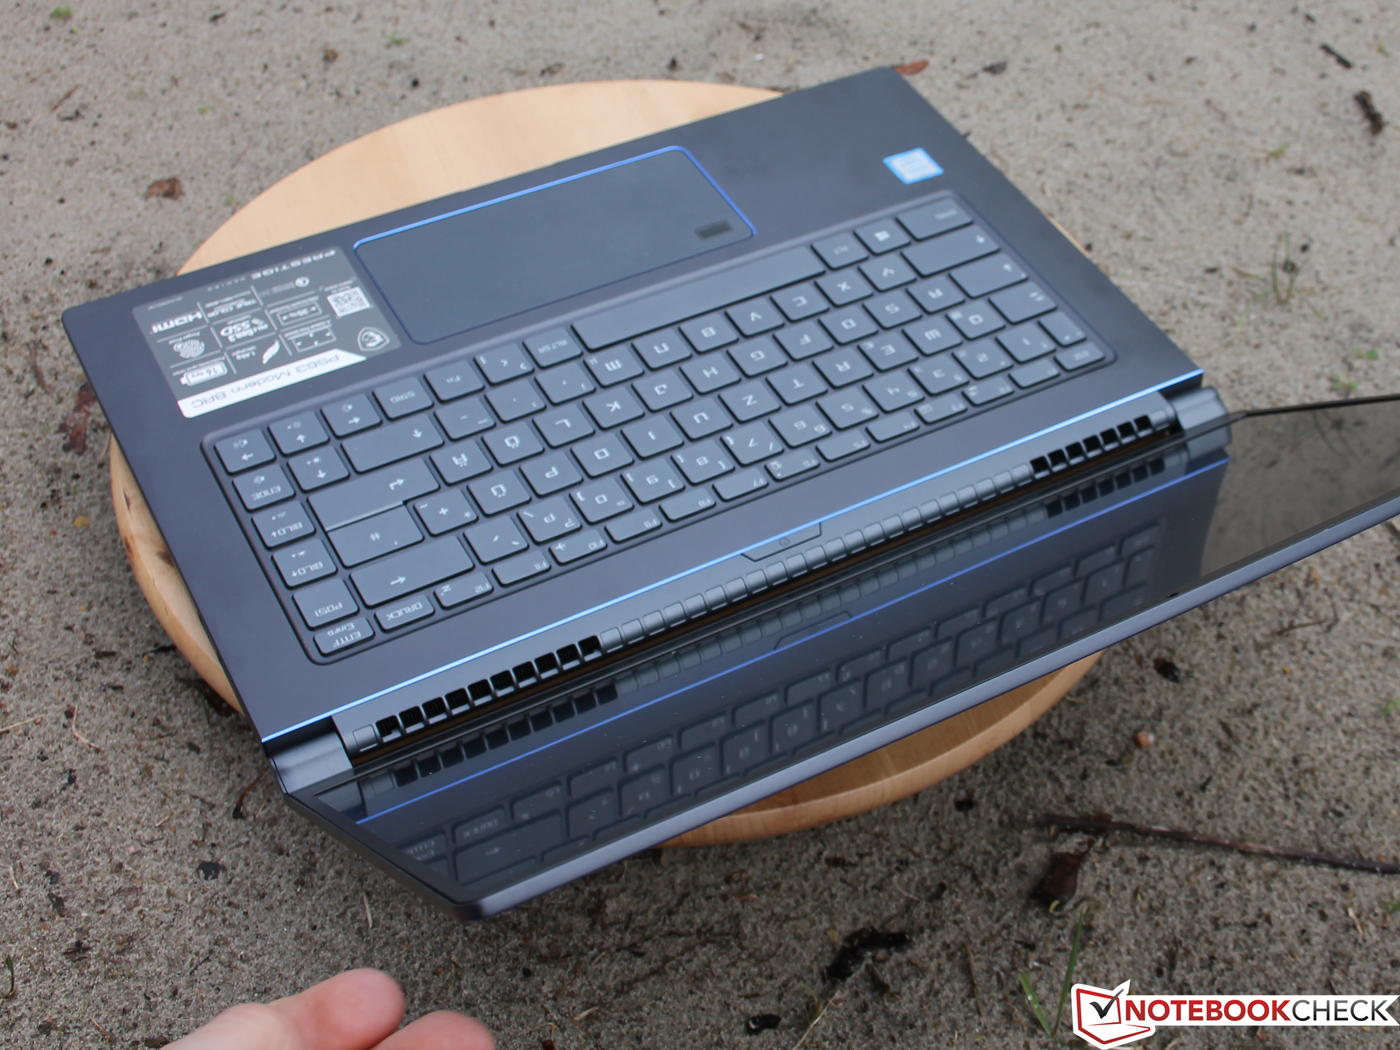
MSI PS63是一款令人印象深刻的中端多媒体全能笔记本电脑。它的CPU,GPU和SSD组合算不上出彩,但该设备在其他方面显现出优势。PS63重量轻,结构紧凑,易于维修或维护。此外,由于采用铝合金设计,外形看起来时尚,高端,且坚固耐用。
如果您正在寻找多媒体全能笔记本电脑但不需要标压CPU,MSI PS63是一个很好的选择。它提供了稳定的性能并且很安静,而其80 Wh电池将轻松地维持整个工作日的续航。
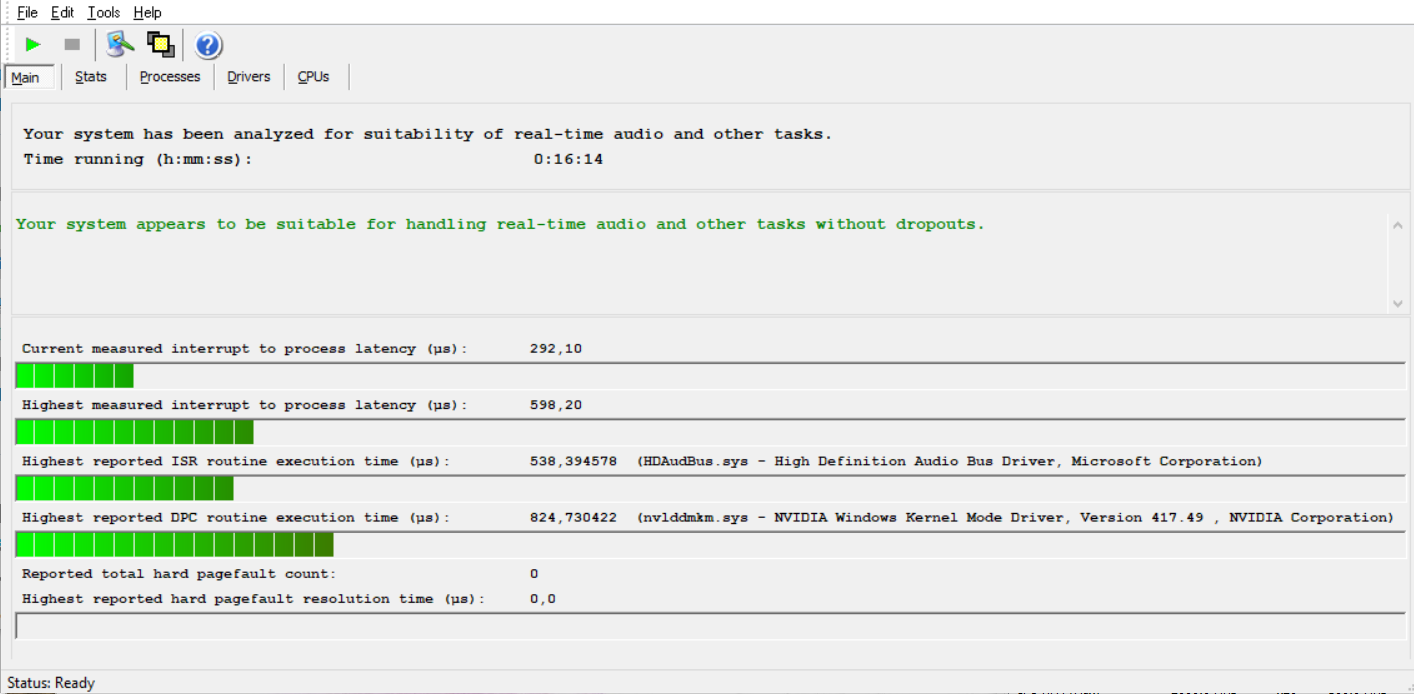
该设备通常温度不高,但在持续负载下运行时,它比大多数同类笔记本电脑更热,这可能是某些人的担忧。我们对于PS63风扇唯一的抱怨是,它使得该设备无法从Core i7-8565U处理器中获得最大性能,例如,当处理器达到75°C时会严重节流,这可能会影响渲染时间。 不够GeForce GTX 1050 Max-Q不受影响。
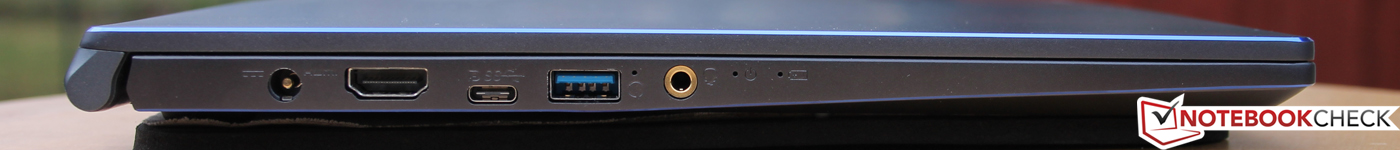
MSI还包含两个M.2插槽,这并非所有同类型笔记本电脑都有,并且制造商已经提供了一个空闲的RAM插槽,如果需要,可以轻松升级到32 GB RAM。令人遗憾的是MSI没有包含雷电3端口,但带有DisplayPort输出的USB 3.1 Gen2 Type-C是一个可圈可点的弥补。
PS63 Modern的售价大约为12999元,这对你的钱包来说有点可怕,特别是因为你可以用相同的钱购买更强大的笔记本电脑,如技嘉Aero 15X V8或戴尔XPS 15 9570。不够那样做的话你会牺牲一些便携性。
如果移动性是次要因素,那么六核Core i7-8850H或四核Core i5-8300H将是比Core i7-8565U更好的选择。戴尔有XPS 15 9570,而MSI则提供P65或GS65型号。在低压和标压的CPU之间做决定最终归结为偏好以及是否需要标压处理器带来的额外性能。让我们使用VEGAS Pro 16系统要求作为例子:
MSI PS63 Modern 8RC
- 10/25/2019 v7 (old)
Sebastian Jentsch
Price comparison

