宏碁Swift 3 SF314的审查。笔记本电脑以优异的成绩应对测试

对于那些经常在旅行中使用其设备的人来说,14英寸的笔记本电脑很受欢迎。在这种情况下,稳定性、显示属性、输入设备,以及最后但并非最不重要的,电池运行时间都必须是正确的。Swift 3毫不费力地满足了这些要求,它甚至还进一步增加了对Thunderbolt的支持。这款14英寸的产品是否有能力成为一个通用的移动全能型产品?
我们可以提前说这么多。这款笔记本电脑很有可能会受到好评。它获得了很高的评价--而且是在所有个别领域。虽然竞争对手在整体评级方面并不差,但在某些情况下,他们的价格要高得多。继续阅读,了解你能从宏碁Swift 3 SF314-511中得到什么--以及什么不是。
前身和兄弟姐妹的机型。
Acer Swift 3 SF314-42(AMD) - 2020年
宏碁Swift 3X SF314-510G(性能版) - 2021年
宏碁Swift 3 SF314-43 (AMD) - 2022年 - 审查过程中
Possible contenders in comparison
Rating | Date | Model | Weight | Height | Size | Resolution | Price |
|---|---|---|---|---|---|---|---|
| 88.2 % v7 (old) | 02 / 2022 | Acer Swift 3 SF314-511-54ZK i5-1135G7, Iris Xe G7 80EUs | 1.2 kg | 16.55 mm | 14.00" | 1920x1080 | |
| 88.5 % v7 (old) | 06 / 2021 | Asus ZenBook 13 UM325S R7 5800U, Vega 8 | 1.2 kg | 13.9 mm | 13.30" | 1920x1080 | |
| 87.7 % v7 (old) | Dell XPS 13 9305 Core i5 FHD i5-1135G7, Iris Xe G7 80EUs | 1.2 kg | 16 mm | 13.30" | 1920x1080 | ||
| 87.8 % v7 (old) | 01 / 2022 | Lenovo ThinkBook 13s G3 20YA0005GE R7 5800U, Vega 8 | 1.3 kg | 14.9 mm | 13.30" | 1920x1200 | |
v (old) | 10 / 2021 | Asus Zenbook 14X UX5400E i7-1165G7, GeForce MX450 | 1.4 kg | 16.9 mm | 14.00" | 2880x1800 |
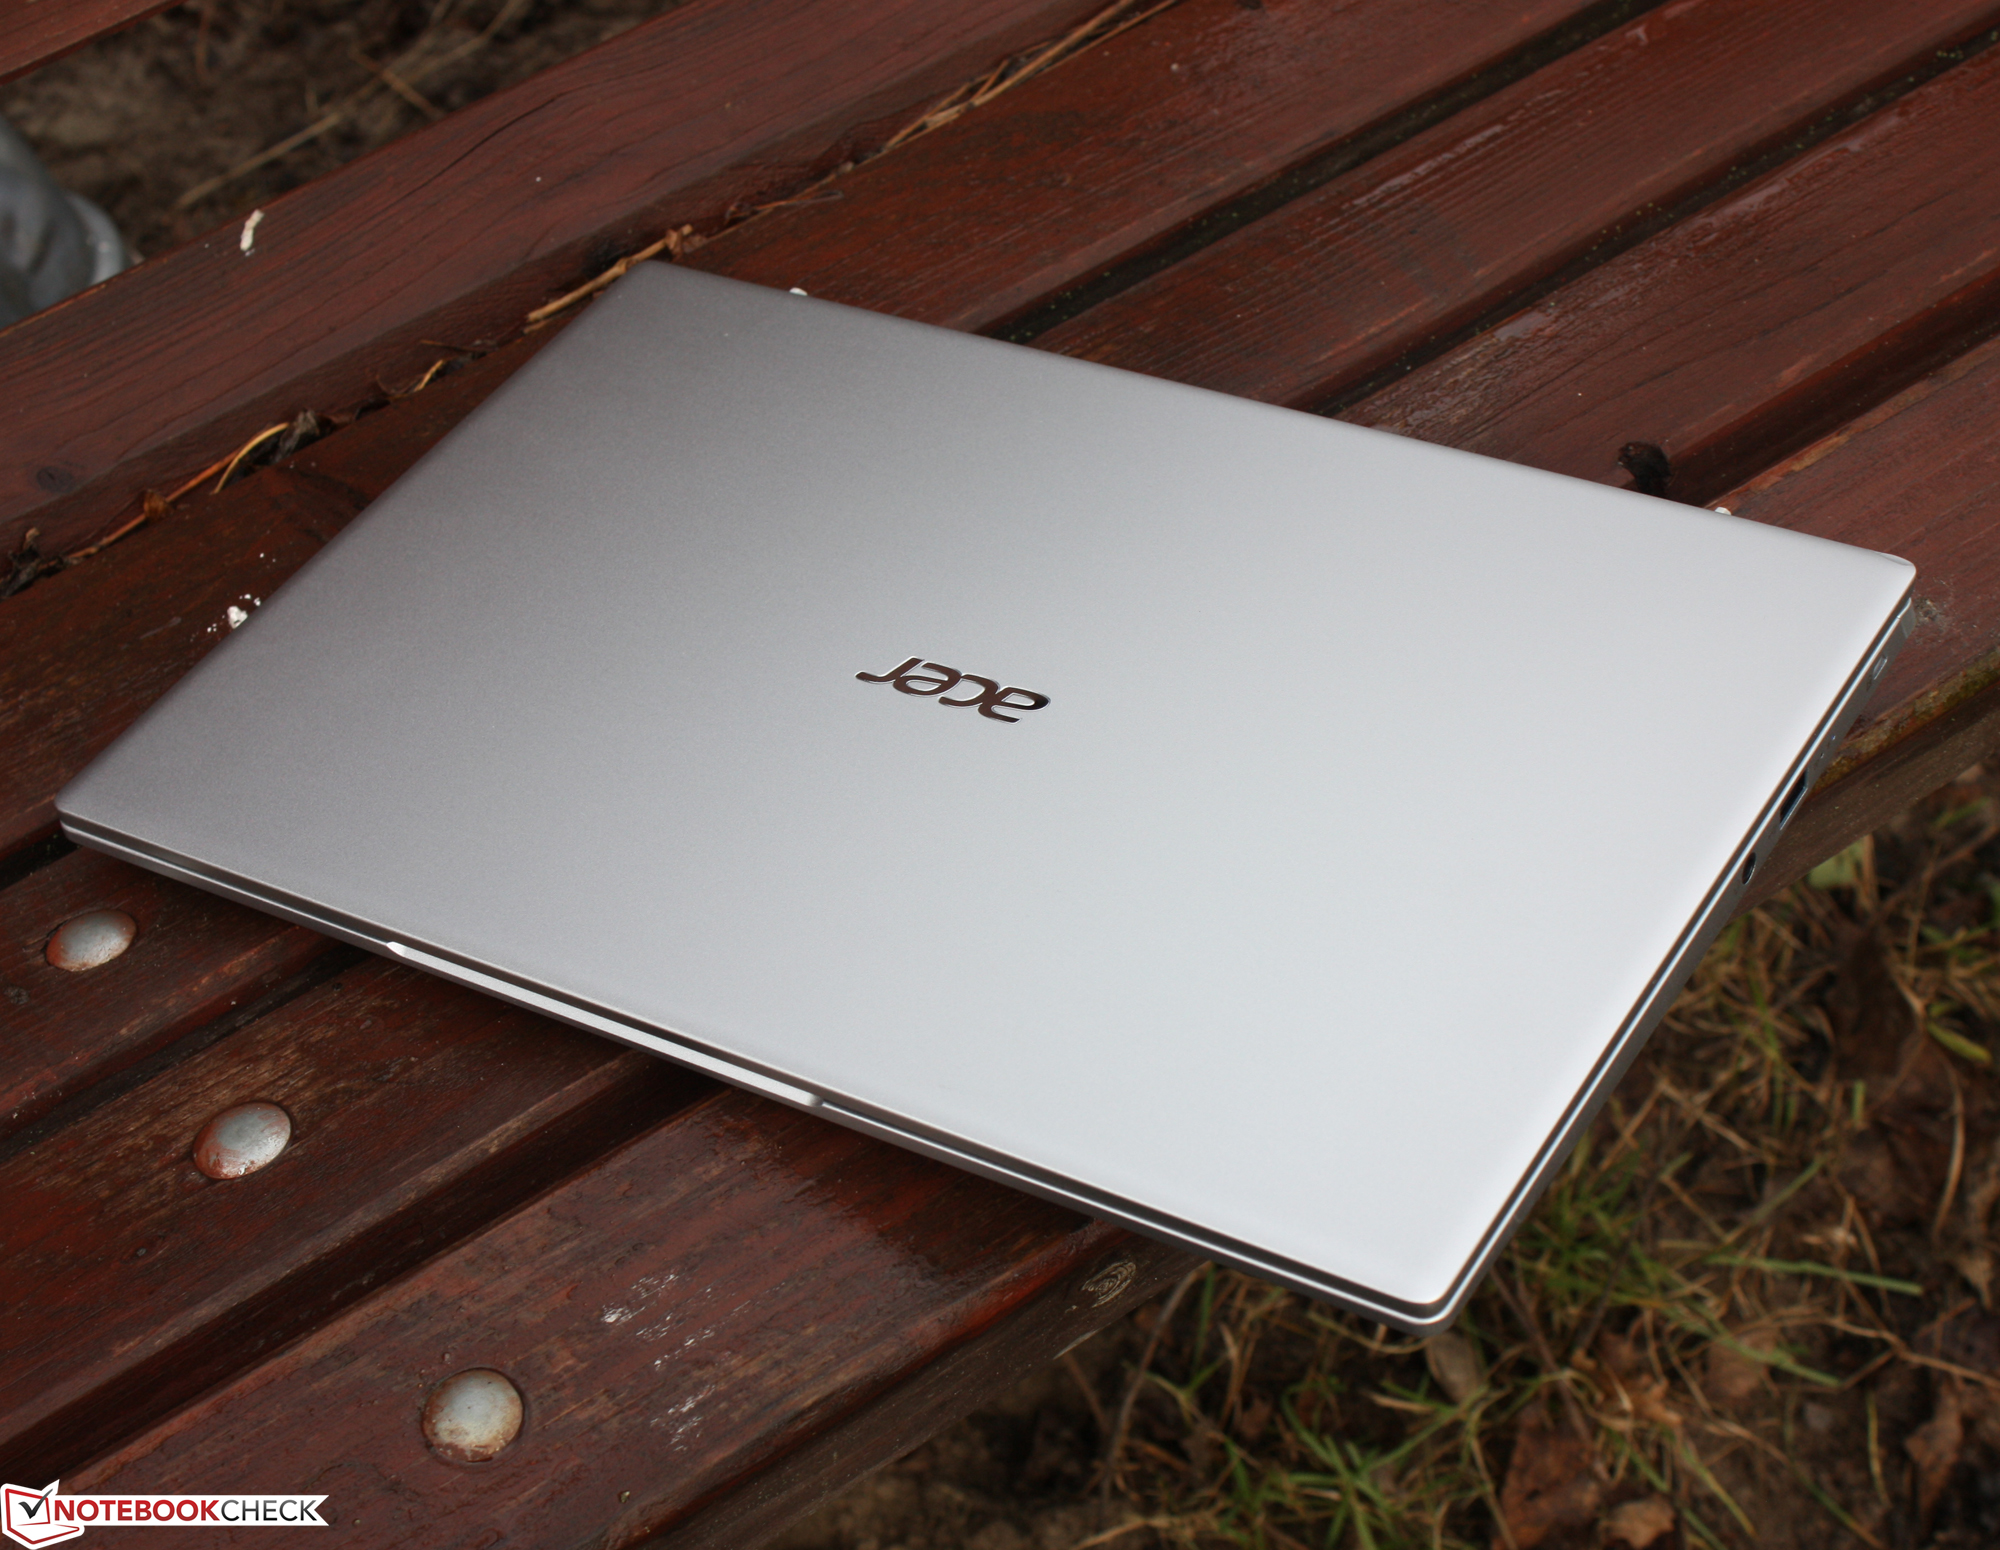
外壳 - 高品质的Swift 3
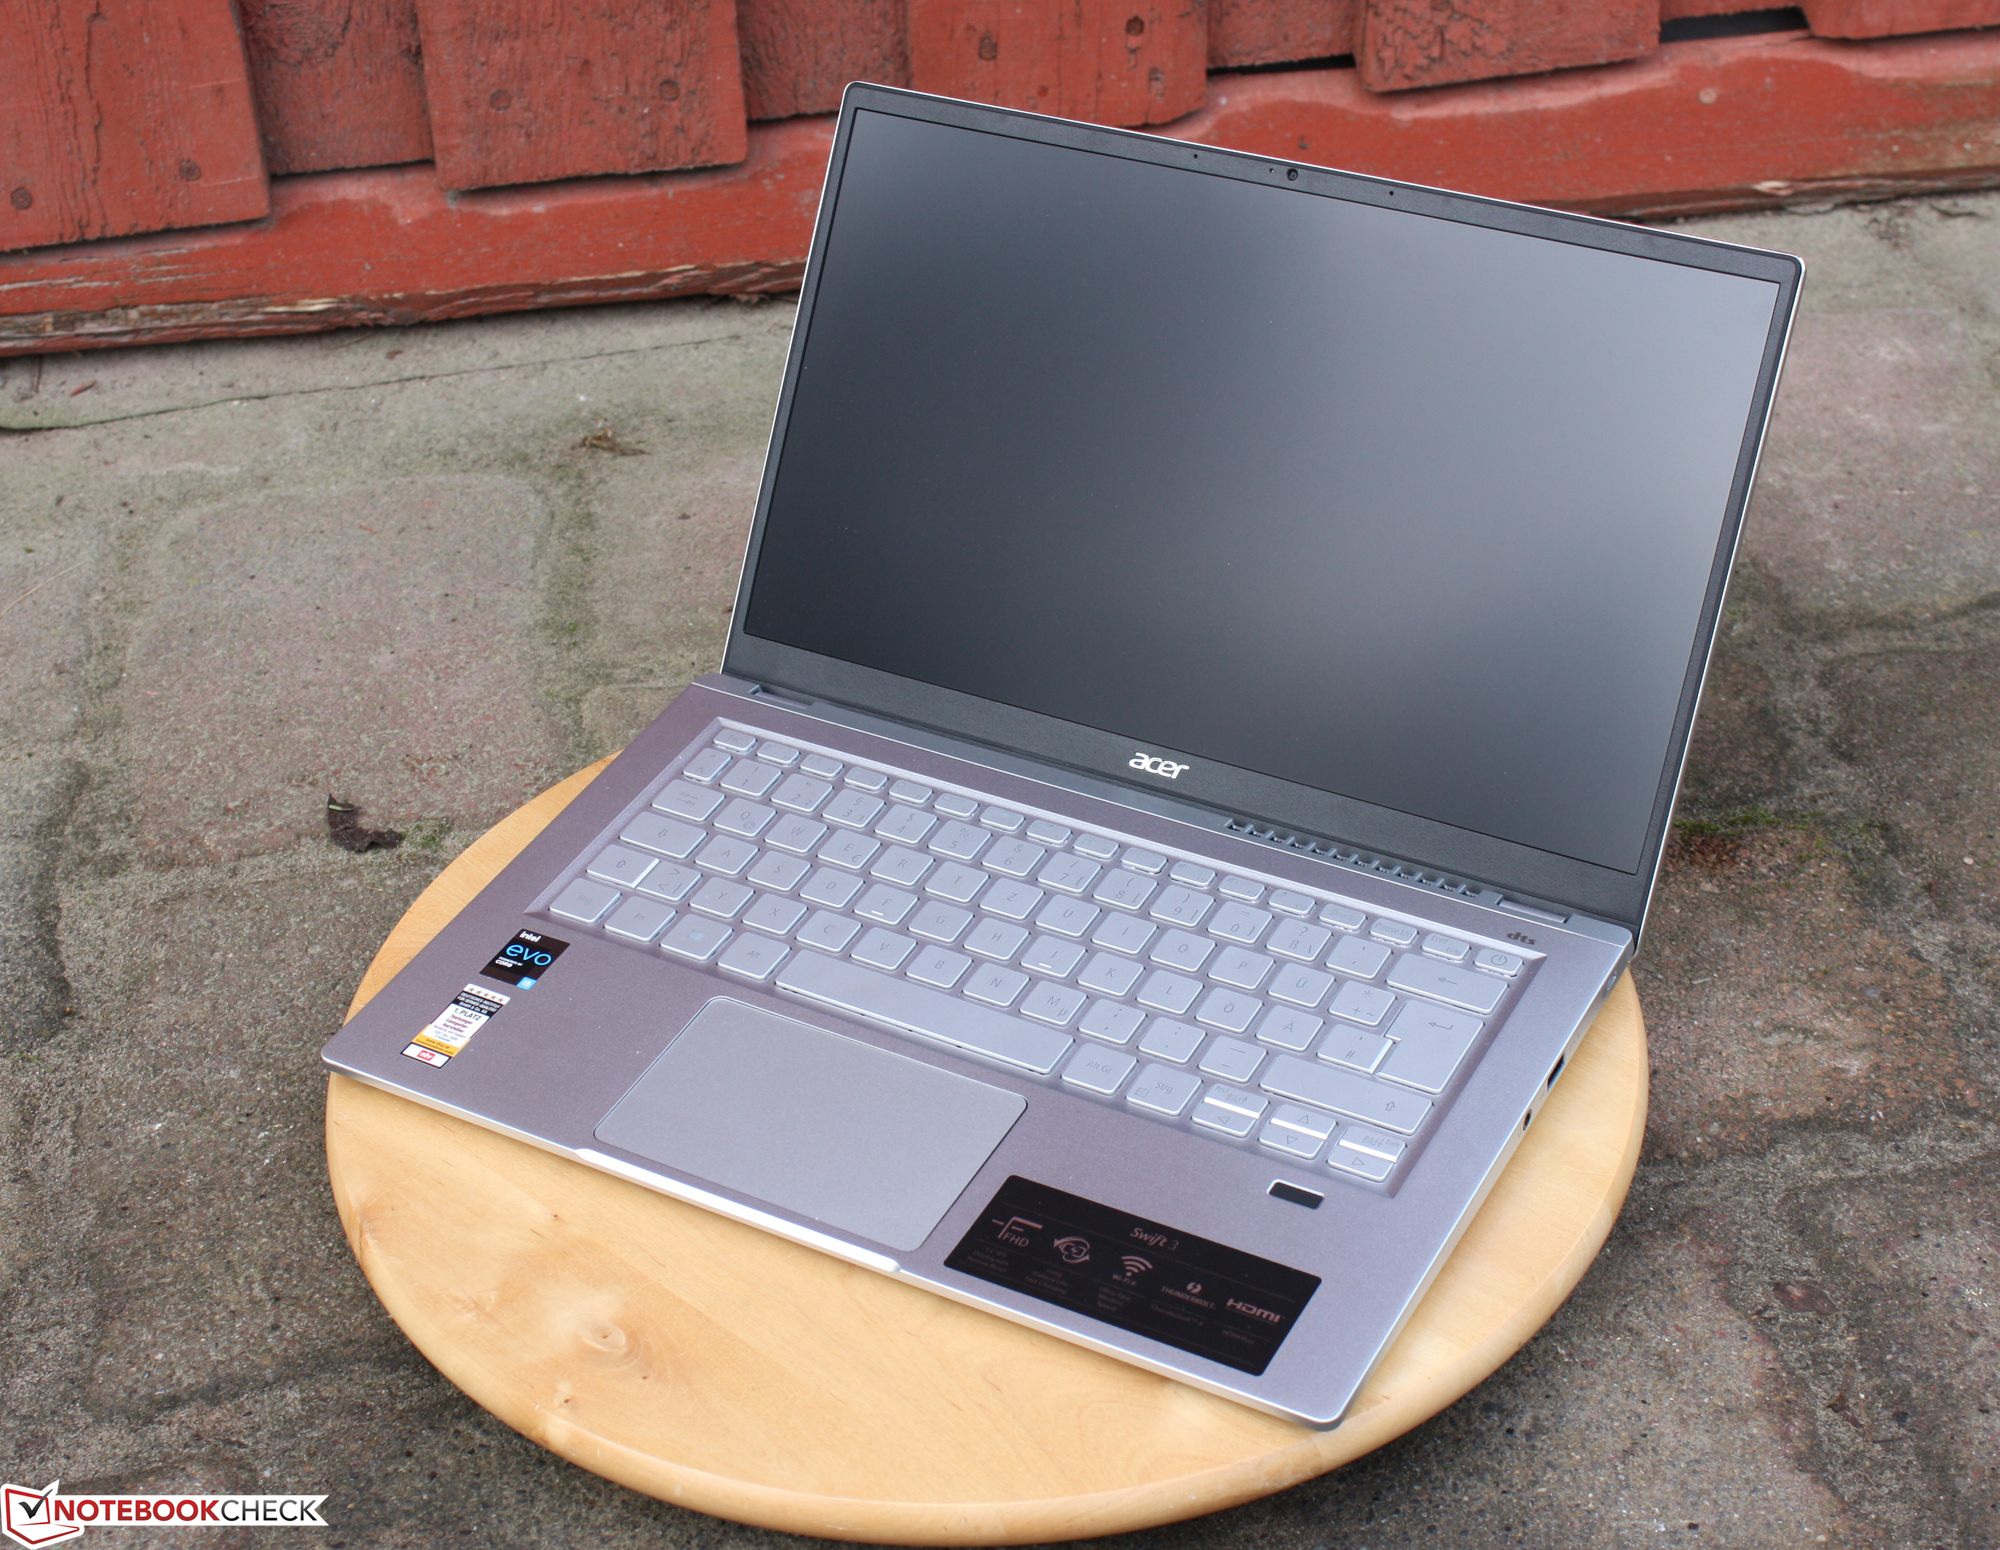
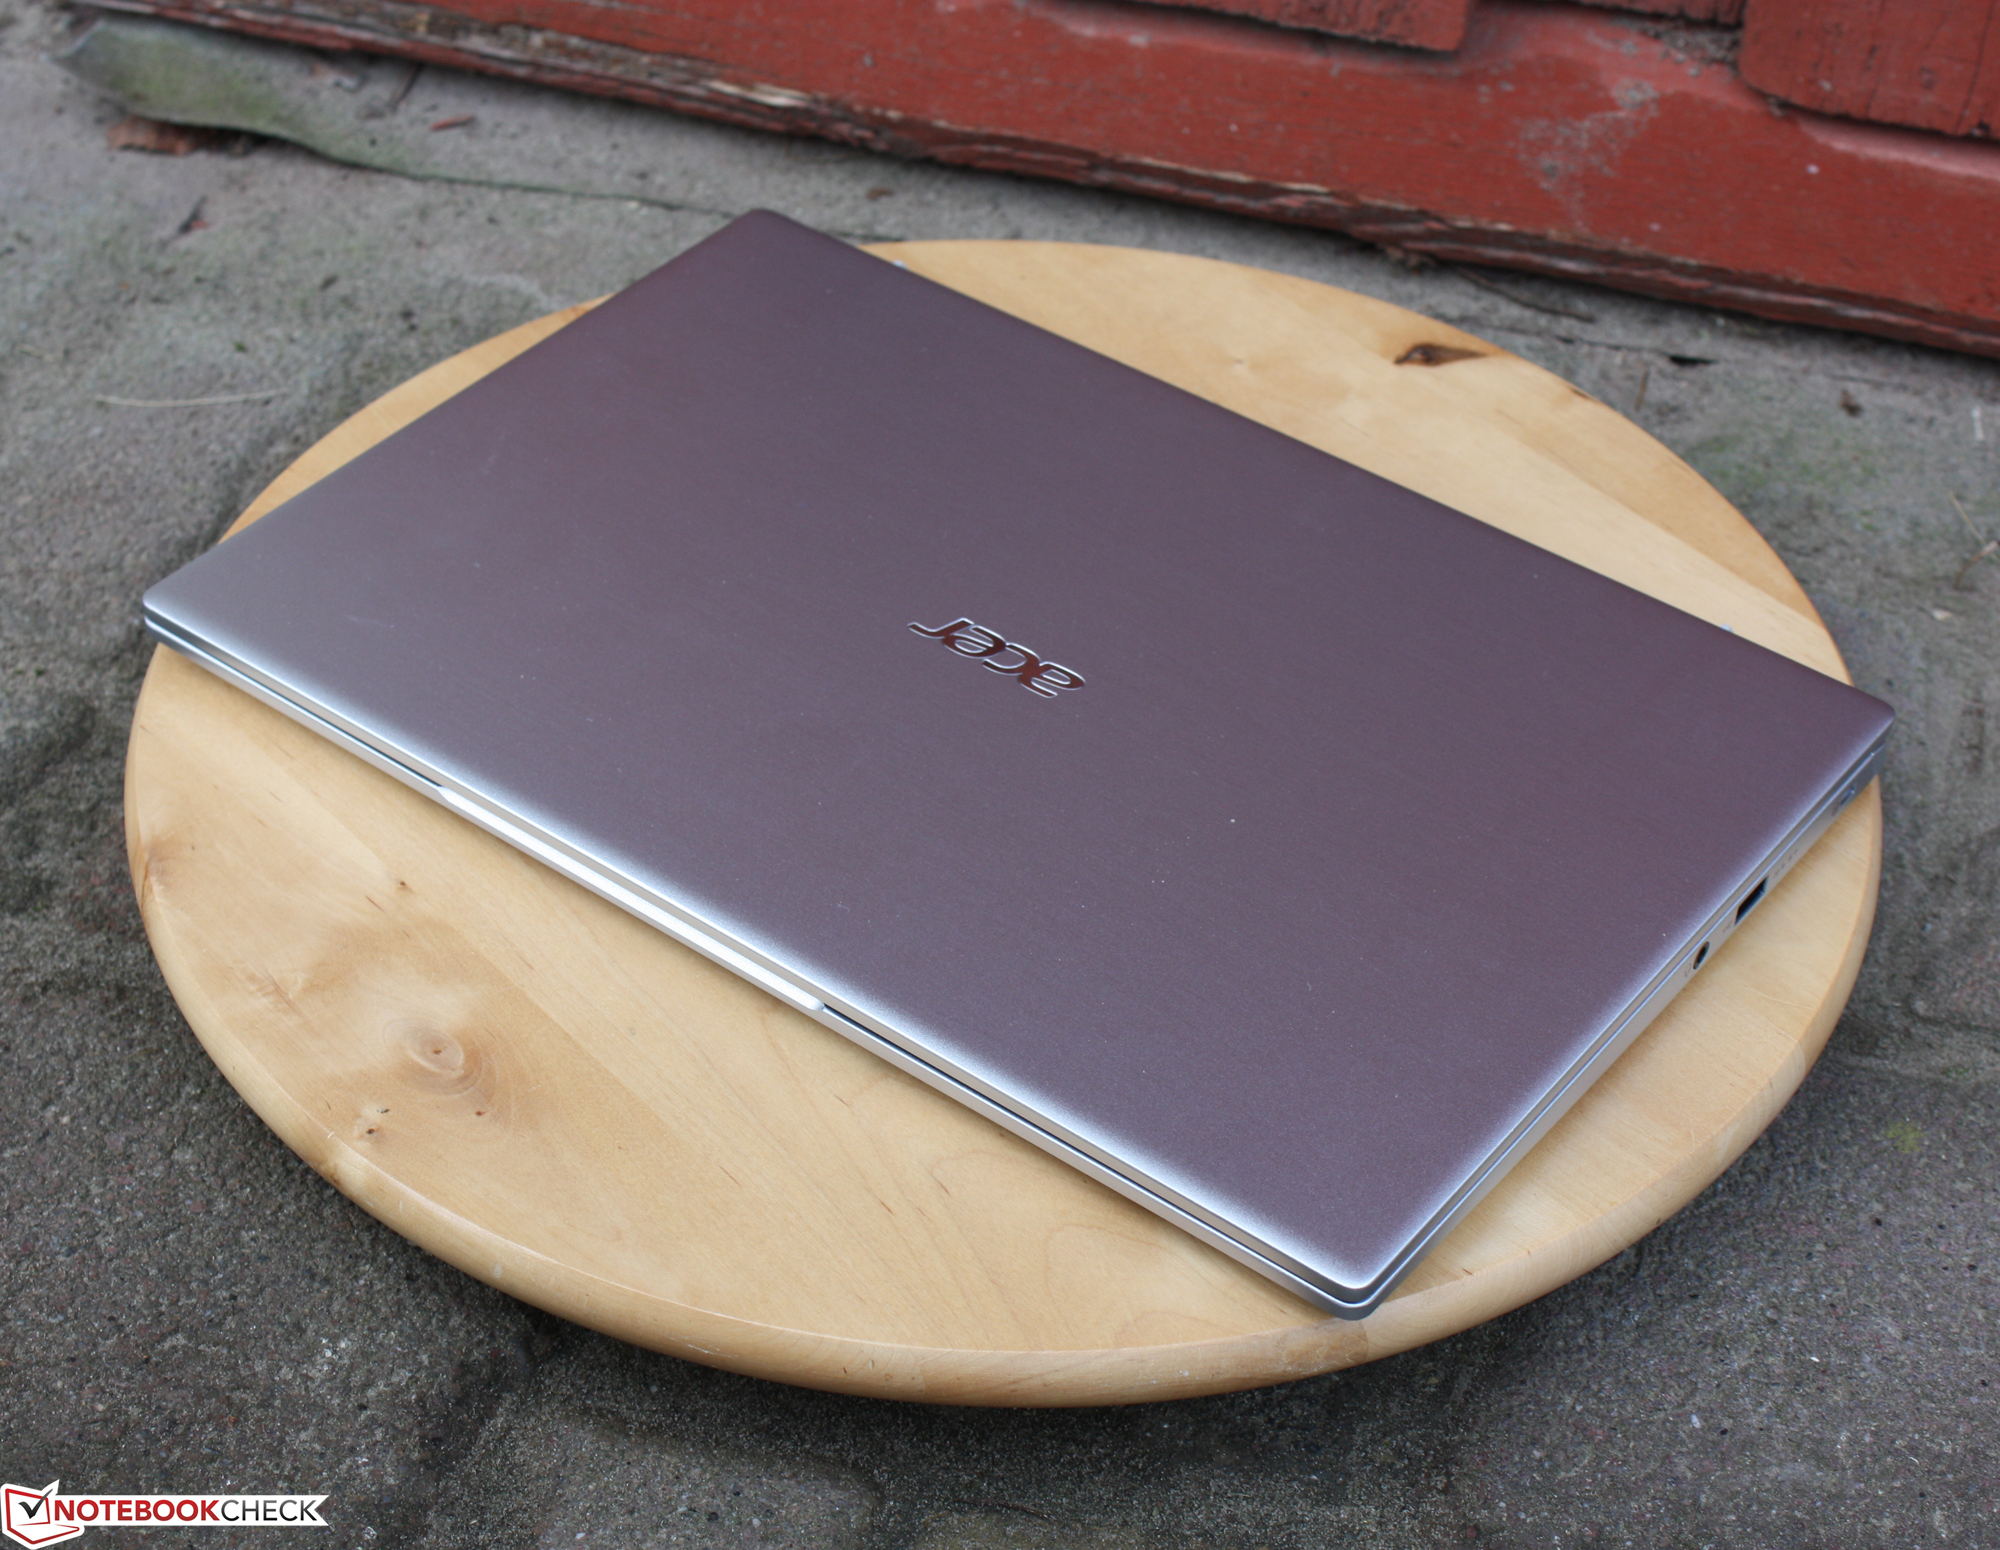
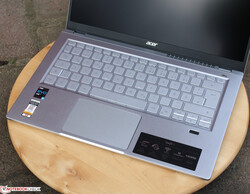
像以前一样,宏碁仍然用金属打造SF314--就像上一代产品一样。这款光滑、纤细的铝制外壳并不过分炫耀,但它具有高质量的装饰,尤其是当你考虑到边角和边缘的坚实感觉时。顶盖和盖子是由铝制成的,只有底盖是由塑料制成的。
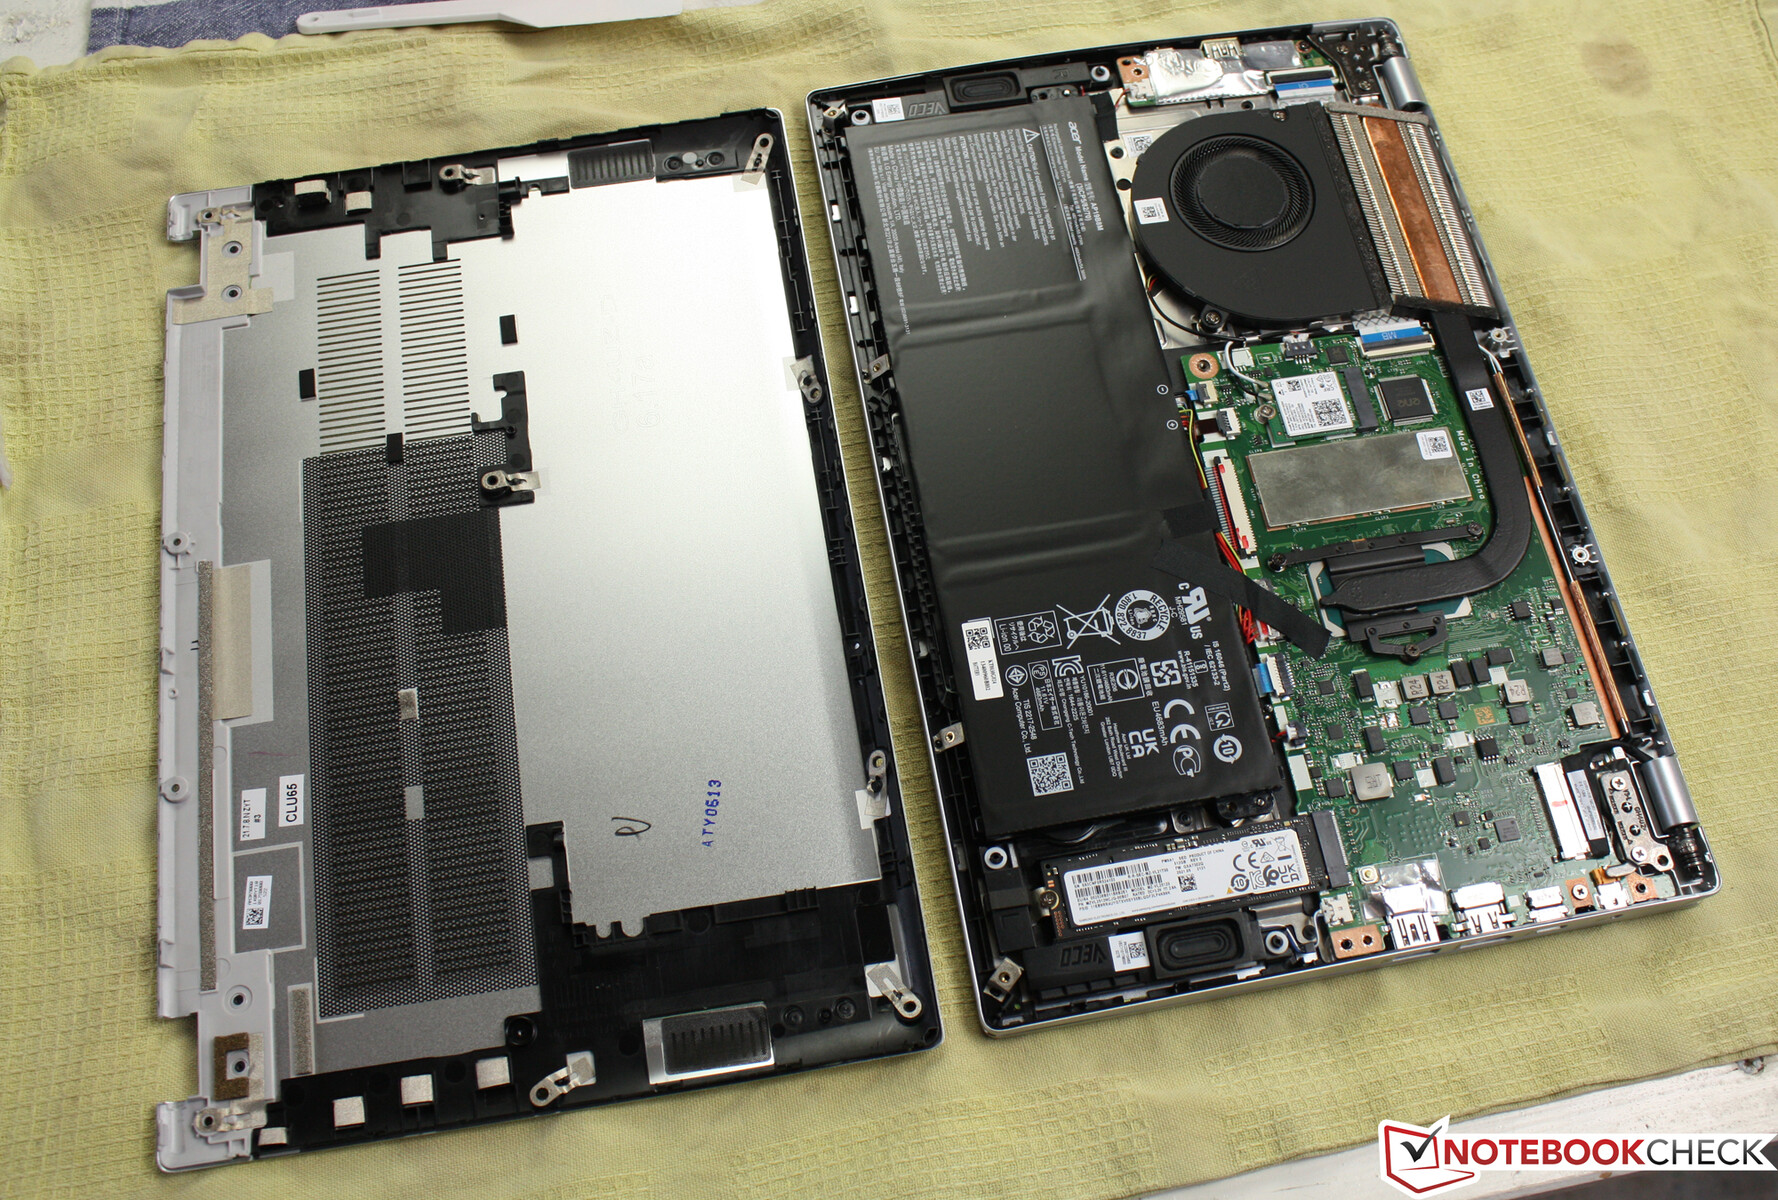
机箱采用哑光银色,与黑色塑料显示屏边框形成对比。宏碁在各处都选择了光滑的表面。笔记本电脑没有维护舱门,但松开螺丝后,底板可以很容易地被拆下。
缝隙尺寸很准确,没有任何材料突起。该设备没有发现任何稳定性问题,而且底座单元对扭转的抵抗力异常强大。盖子可以被扭转,但这并不导致显示器上的任何颜色变化。
铰链已经从单铰链改回了双铰链。
紧密的铰链很讨人喜欢;当设备被随身携带时,它们几乎不允许晃动。最大打开角度为130度。用一只手打开盖子是不可能的,底座必须被固定在原处。
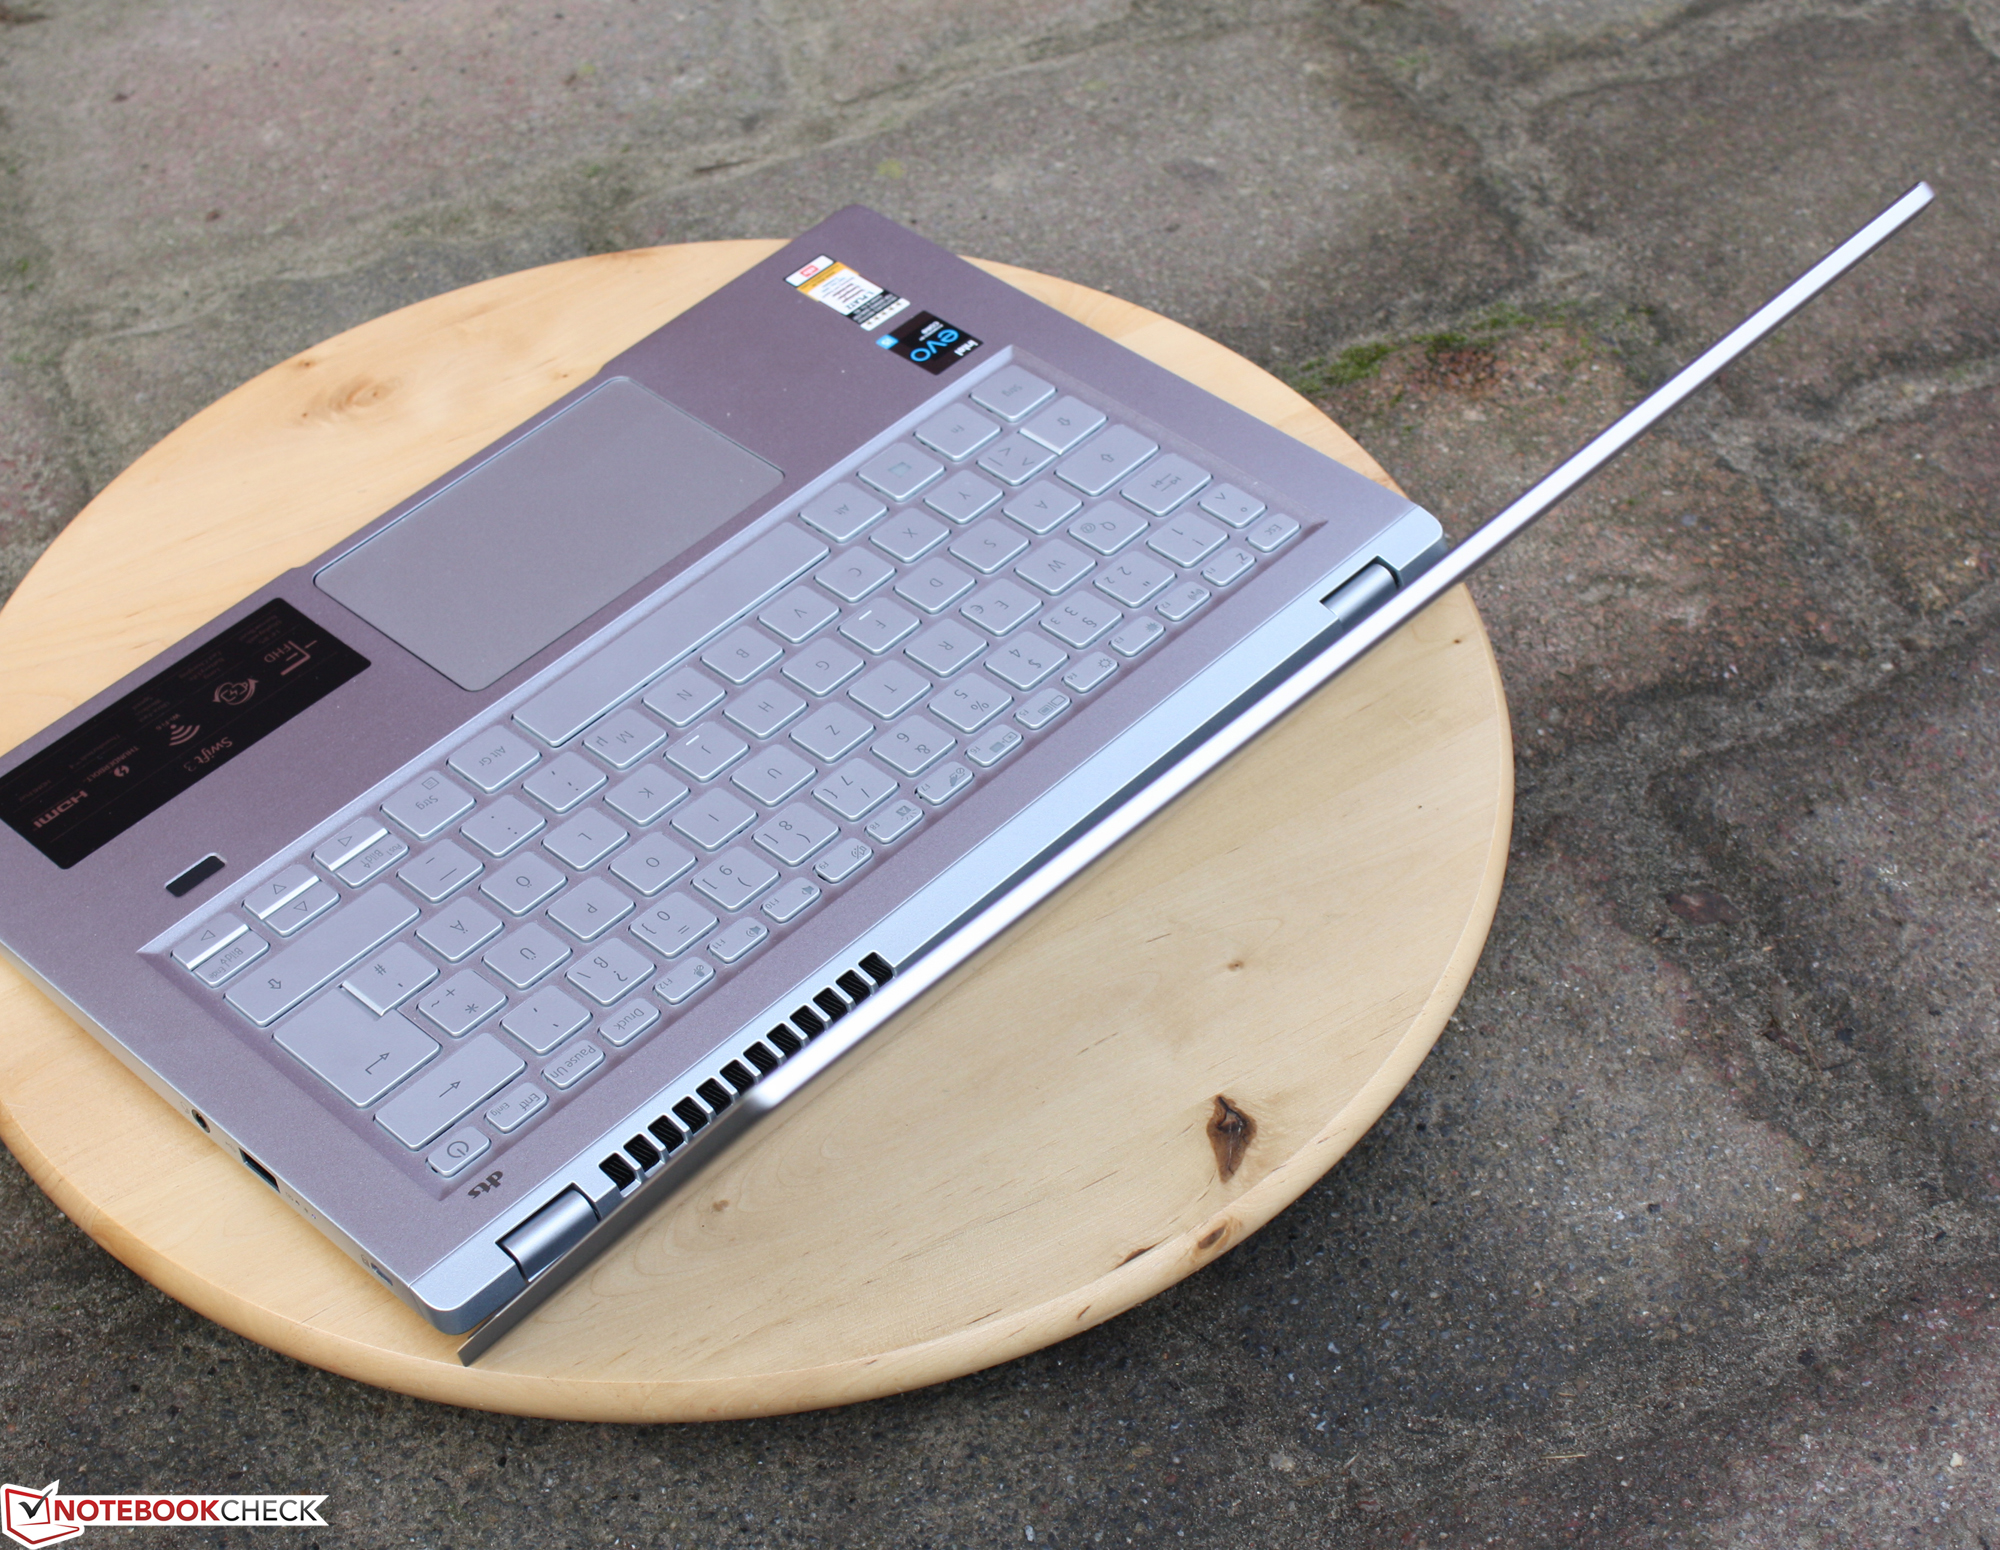
在我们的比较领域中,设备的尺寸只在其13或14英寸的外形尺寸方面有所不同。然而,那些密切关注毫米数的人将会发现,Swift 3的笔记本电脑和戴尔XPS 13一样薄。 戴尔XPS 13,即16毫米,不包括底座的脚。值得注意的是,作为一个14英寸的产品,我们的Swift 3的重量比13英寸的Swift 3少了1.2公斤。联想ThinkBook 13s(1.3公斤)。这款 AMD Swift 3 SF314-42的前身也有1.2公斤重。
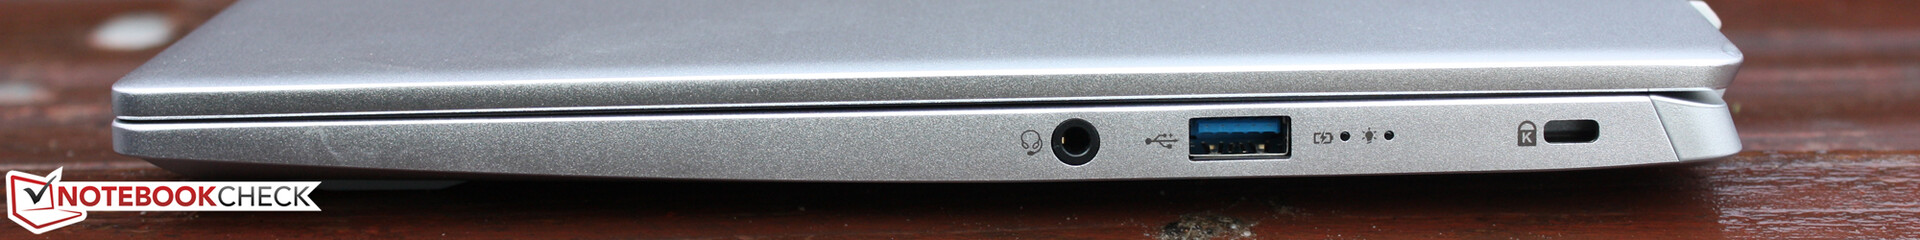
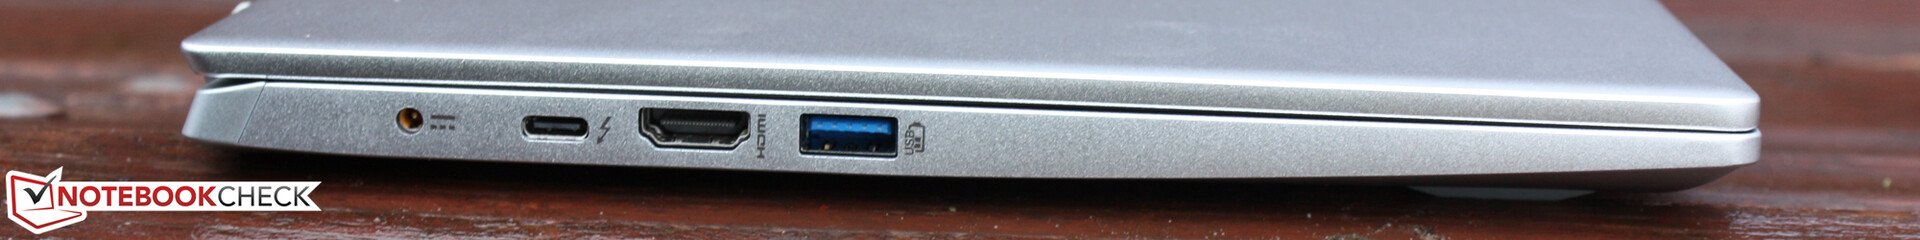
连接性 - 宏碁笔记本电脑与Thunderbolt
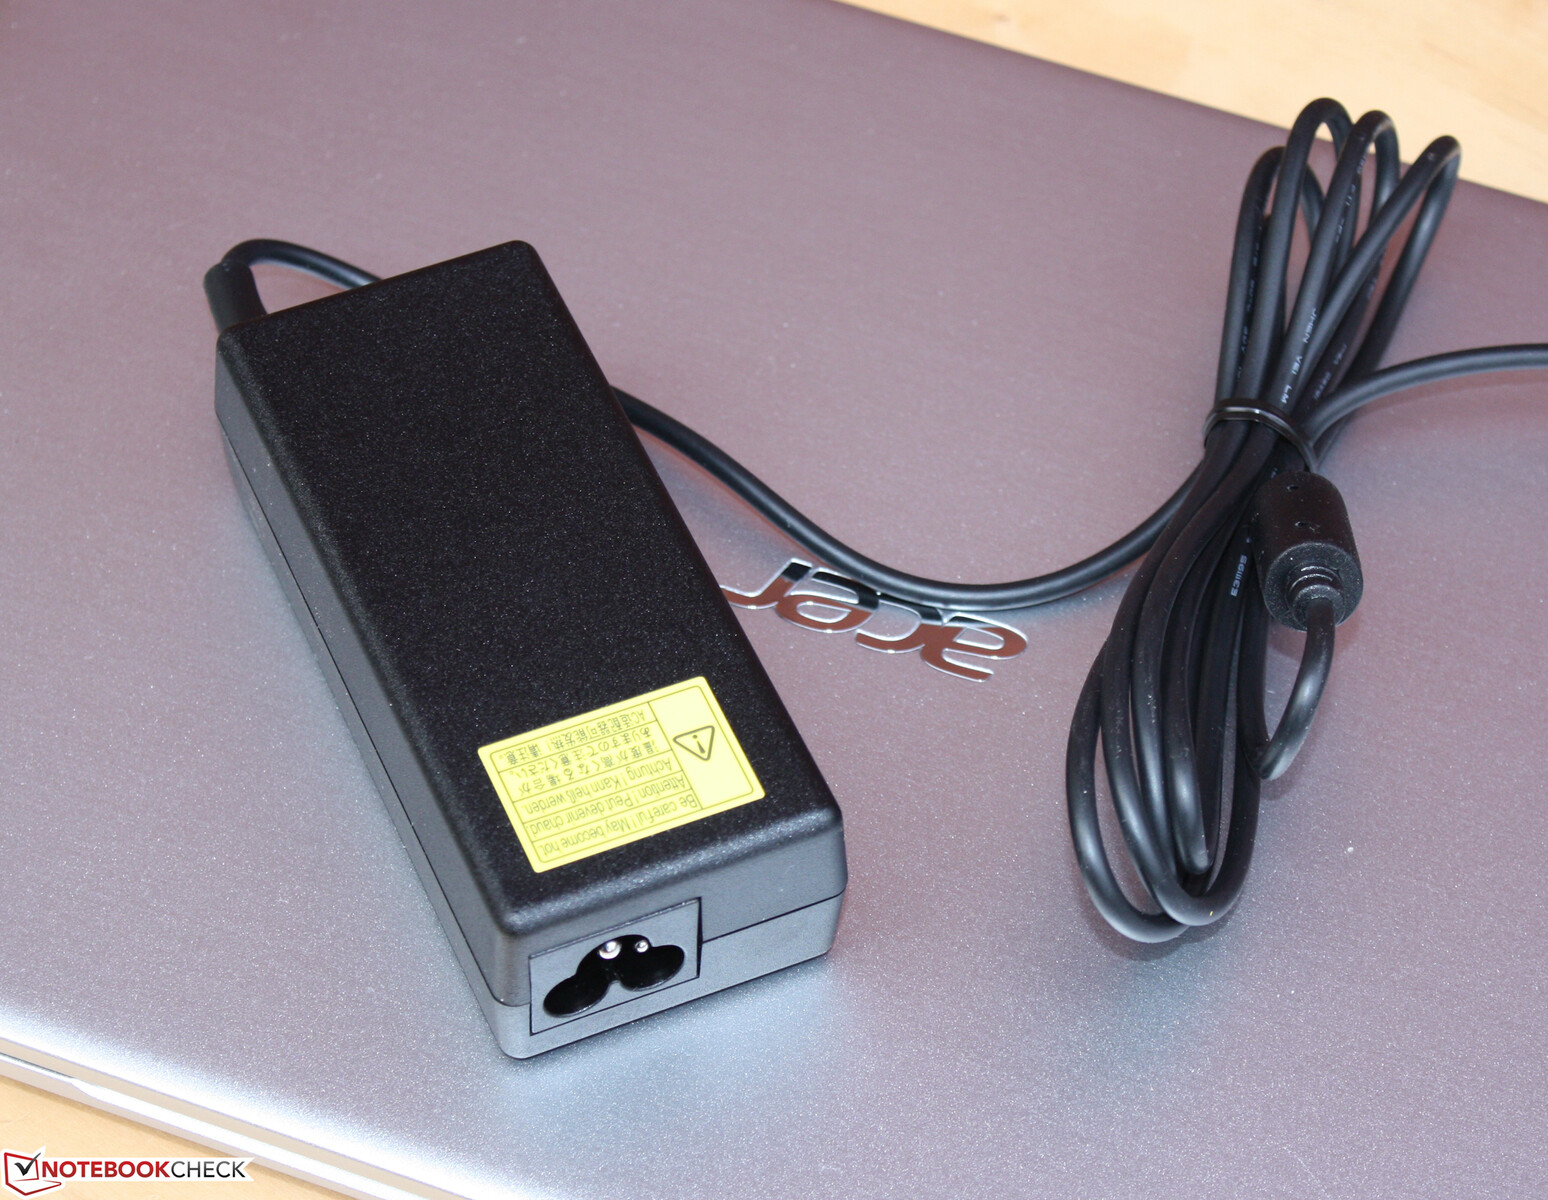
虽然这个价格区间之前只提供了带Power Delivery的USB Type-C,但现在它提供了Thunderbolt 4。它没有被电源适配器所阻挡;宏碁继续使用一个小型空心母接头,用于65瓦的电源适配器。Thunderbolt连接还支持通过USB-C的DisplayPort。与HDMI端口一起,Swift有两个视频输出。这款笔记本电脑没有存储卡读卡器。
沟通
英特尔的WLAN芯片(Wi-Fi 6 AX201)除了支持802.11a/b/g/n/ac WLAN标准外,还支持ax标准。此外,它还提供蓝牙5功能。在最佳条件下确定的传输速度(附近没有其他WLAN,笔记本电脑和服务器PC之间的距离为1米)从良好到非常好,在某些情况下处于比较领域的顶端。随着时间的推移,速度的下降似乎是因地制宜的。
| Networking | |
| iperf3 transmit AX12 | |
| Acer Swift 3 SF314-511-54ZK | |
| Lenovo ThinkBook 13s G3 20YA0005GE | |
| Average Intel Wi-Fi 6 AX201 (49.8 - 1775, n=324) | |
| Dell XPS 13 9305 Core i5 FHD | |
| Asus Zenbook 14X UX5400E | |
| iperf3 receive AX12 | |
| Dell XPS 13 9305 Core i5 FHD | |
| Average Intel Wi-Fi 6 AX201 (136 - 1743, n=324) | |
| Lenovo ThinkBook 13s G3 20YA0005GE | |
| Acer Swift 3 SF314-511-54ZK | |
| Asus Zenbook 14X UX5400E | |
网络摄像头
720p的相机是最低的共同点;所有的竞争对手都显示出高DeltaE值和大量的噪音。


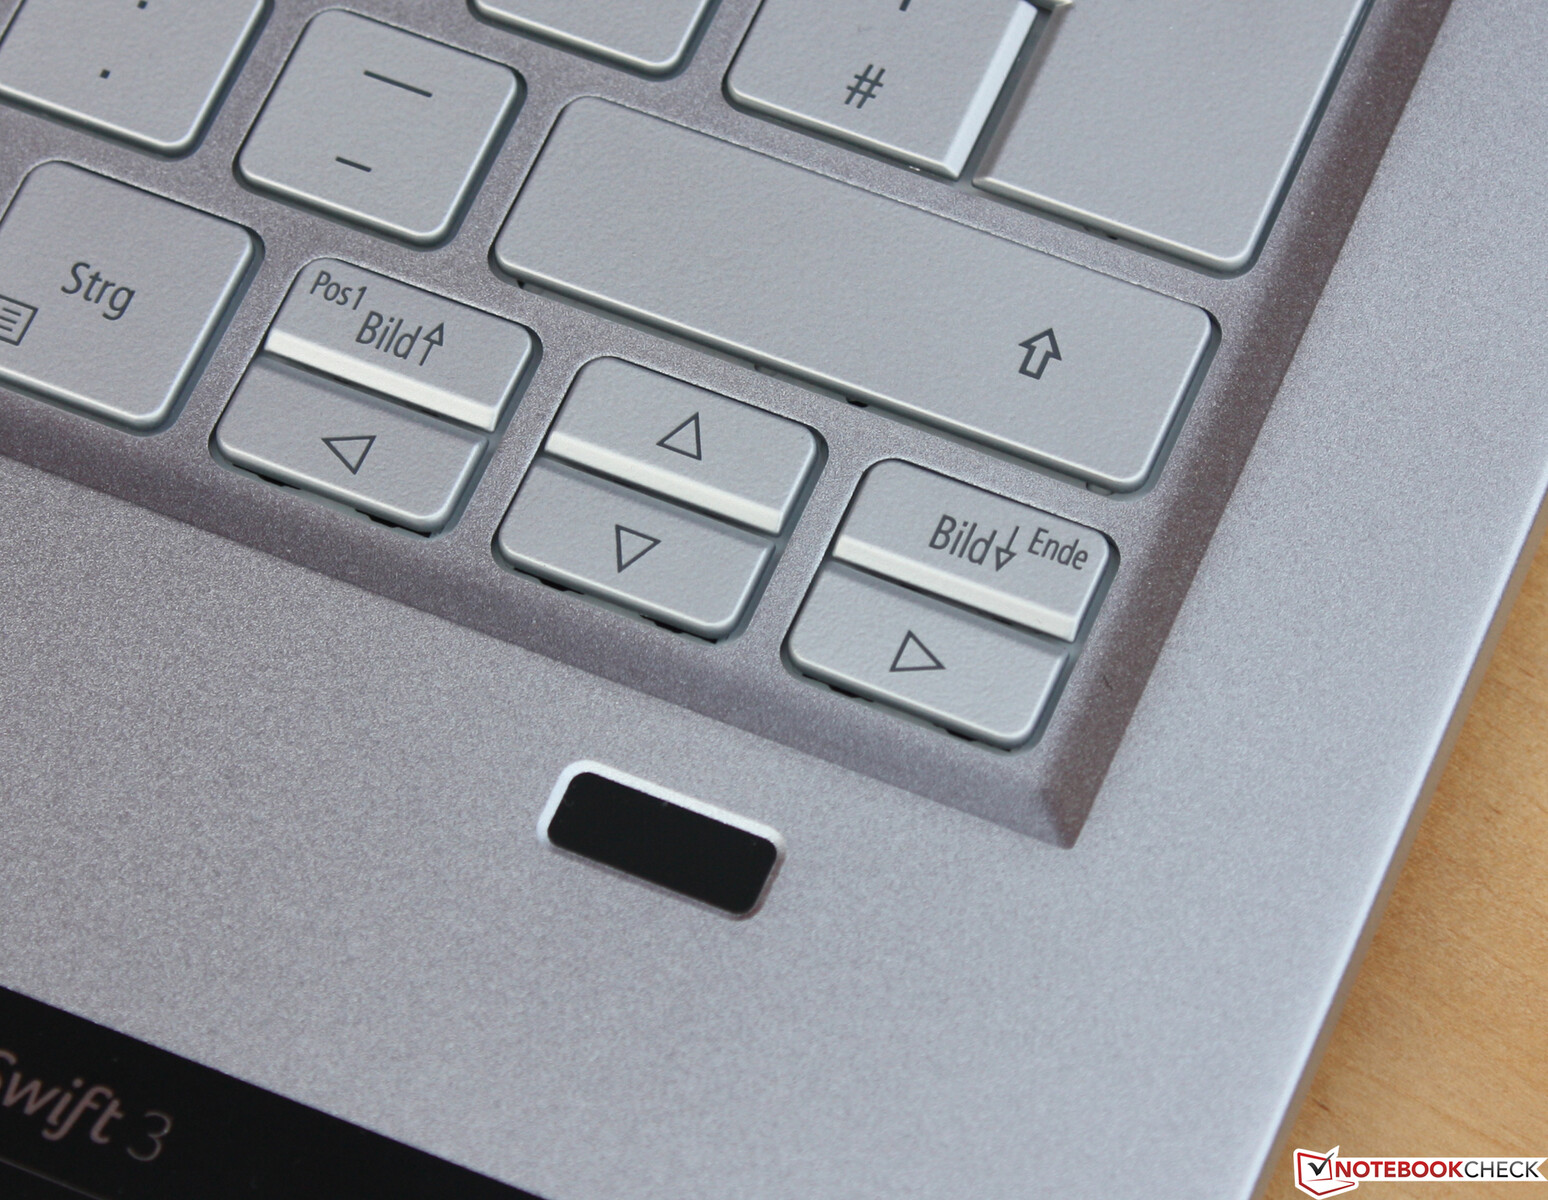
安全问题
宏碁笔记本电脑配备了一个指纹传感器和一个肯辛顿锁。网络摄像头没有配备红外摄像头,所以通过面部识别登录是不可能的。比起在触摸板上发现的解决方案,我们更喜欢方向键下的指纹识别器。
辅料
除了通常的文件(保修信息、快速启动指南),笔记本电脑所包含的唯一东西是65瓦的电源适配器。
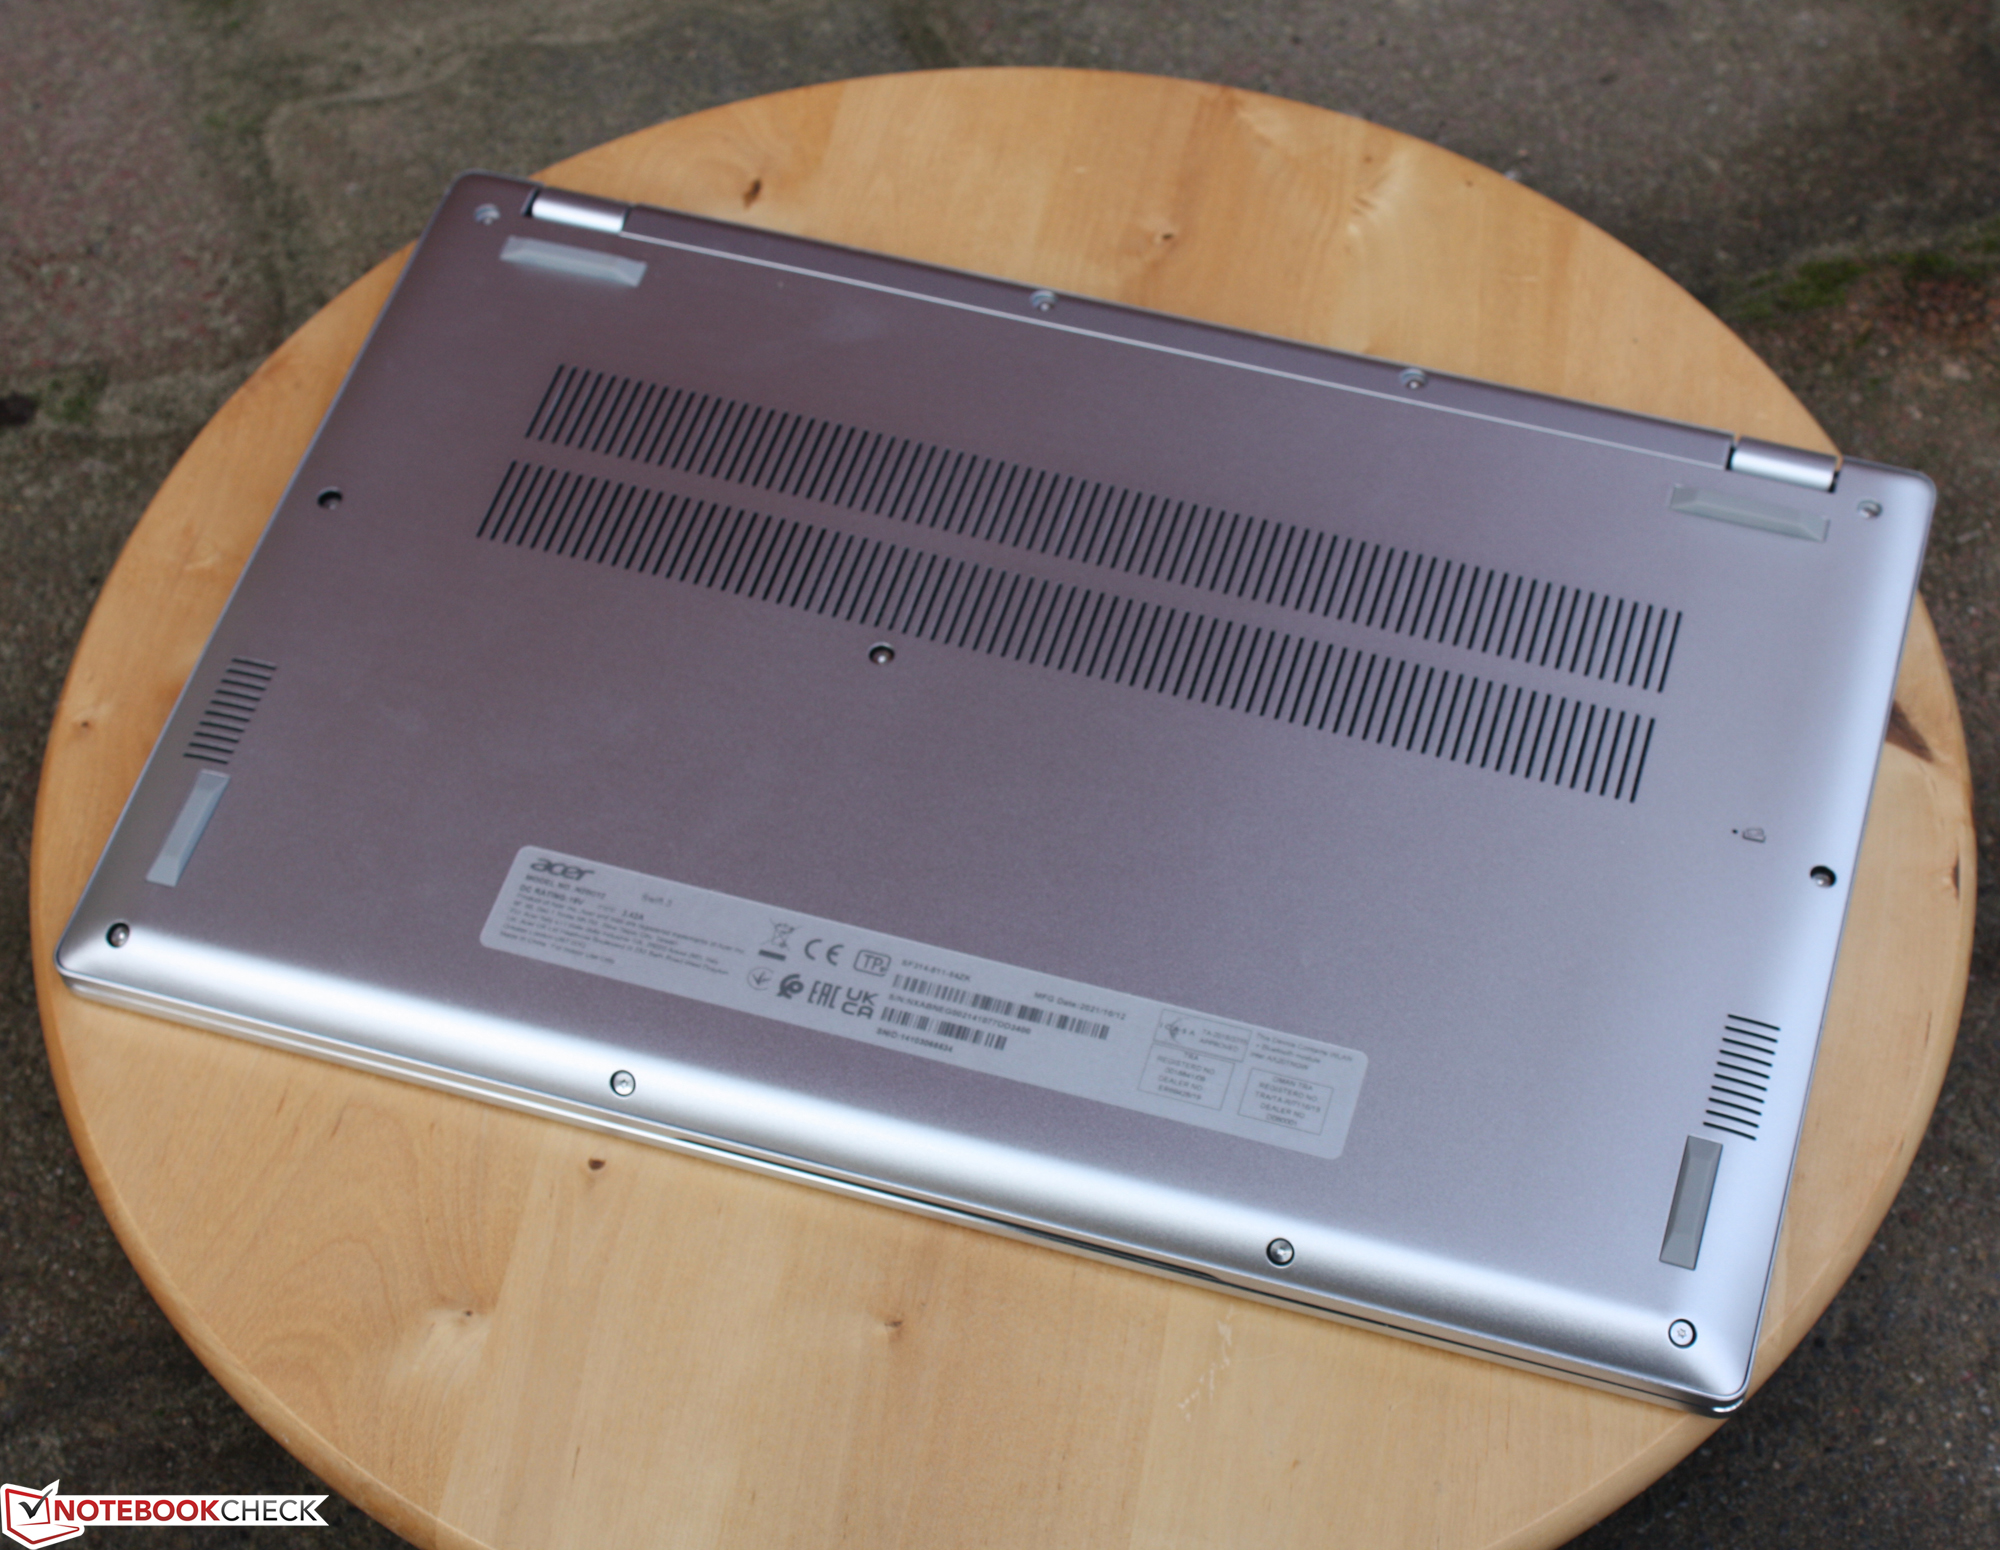
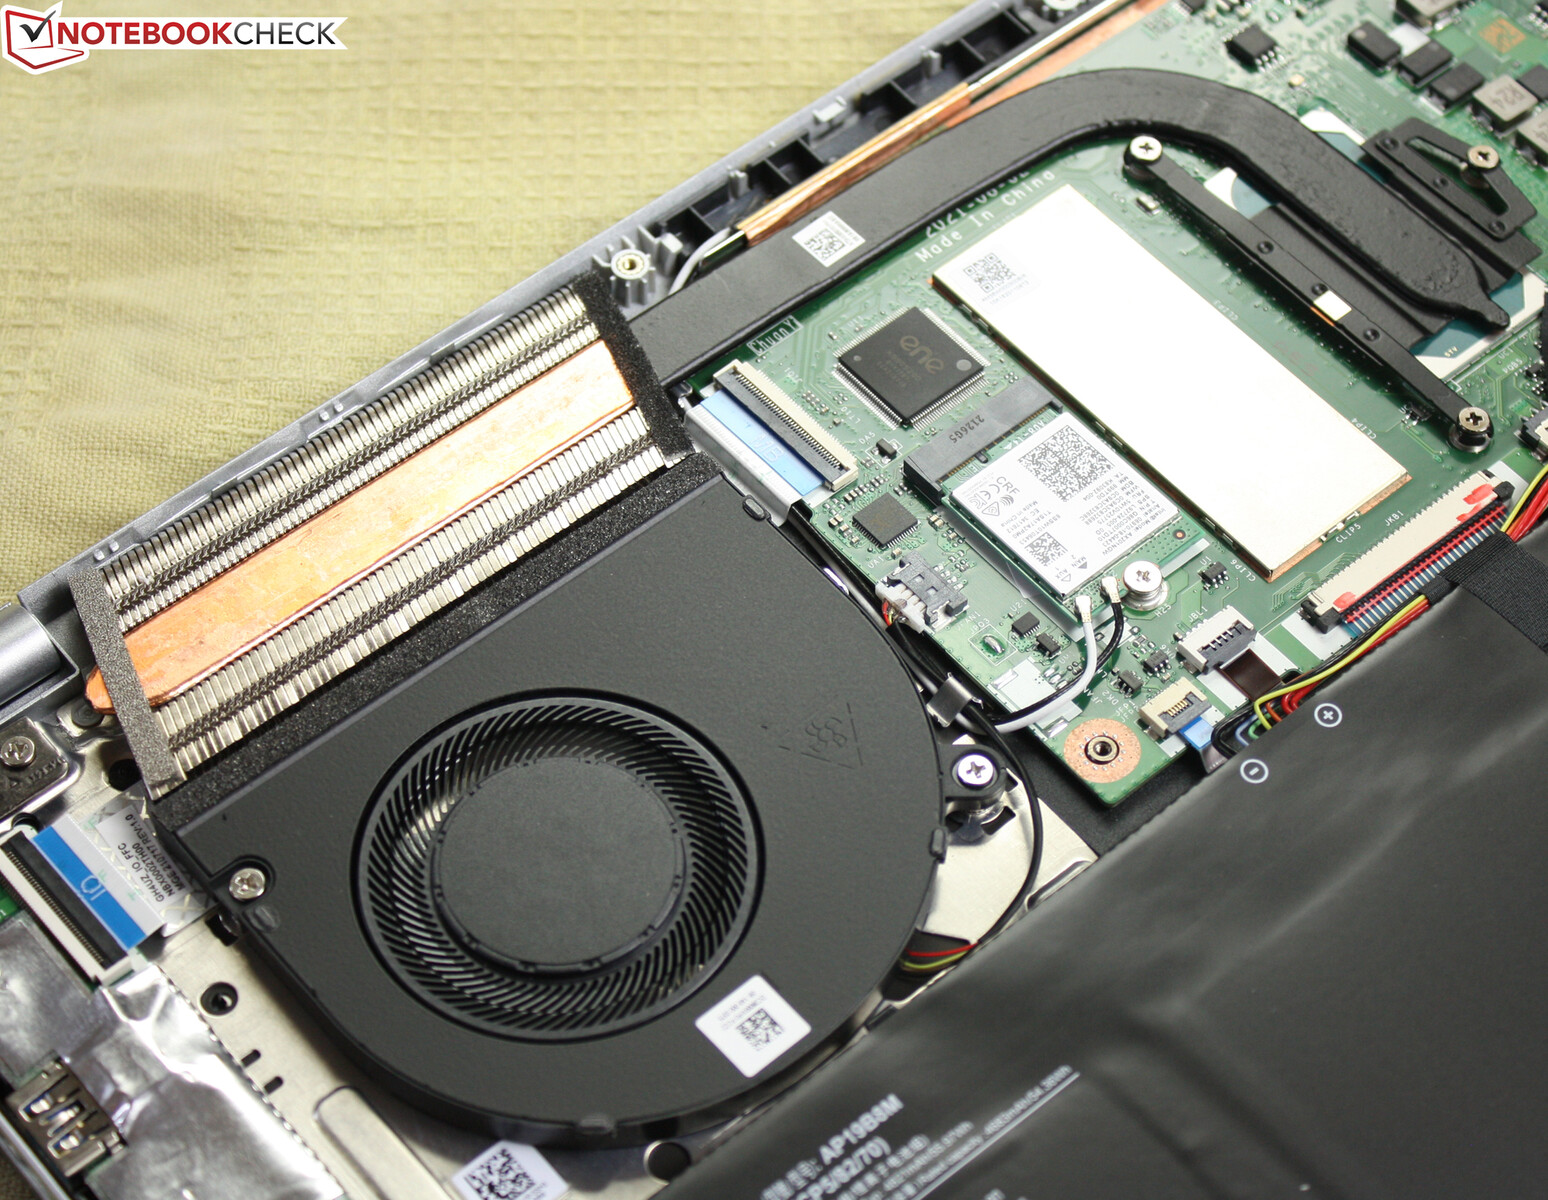
维护
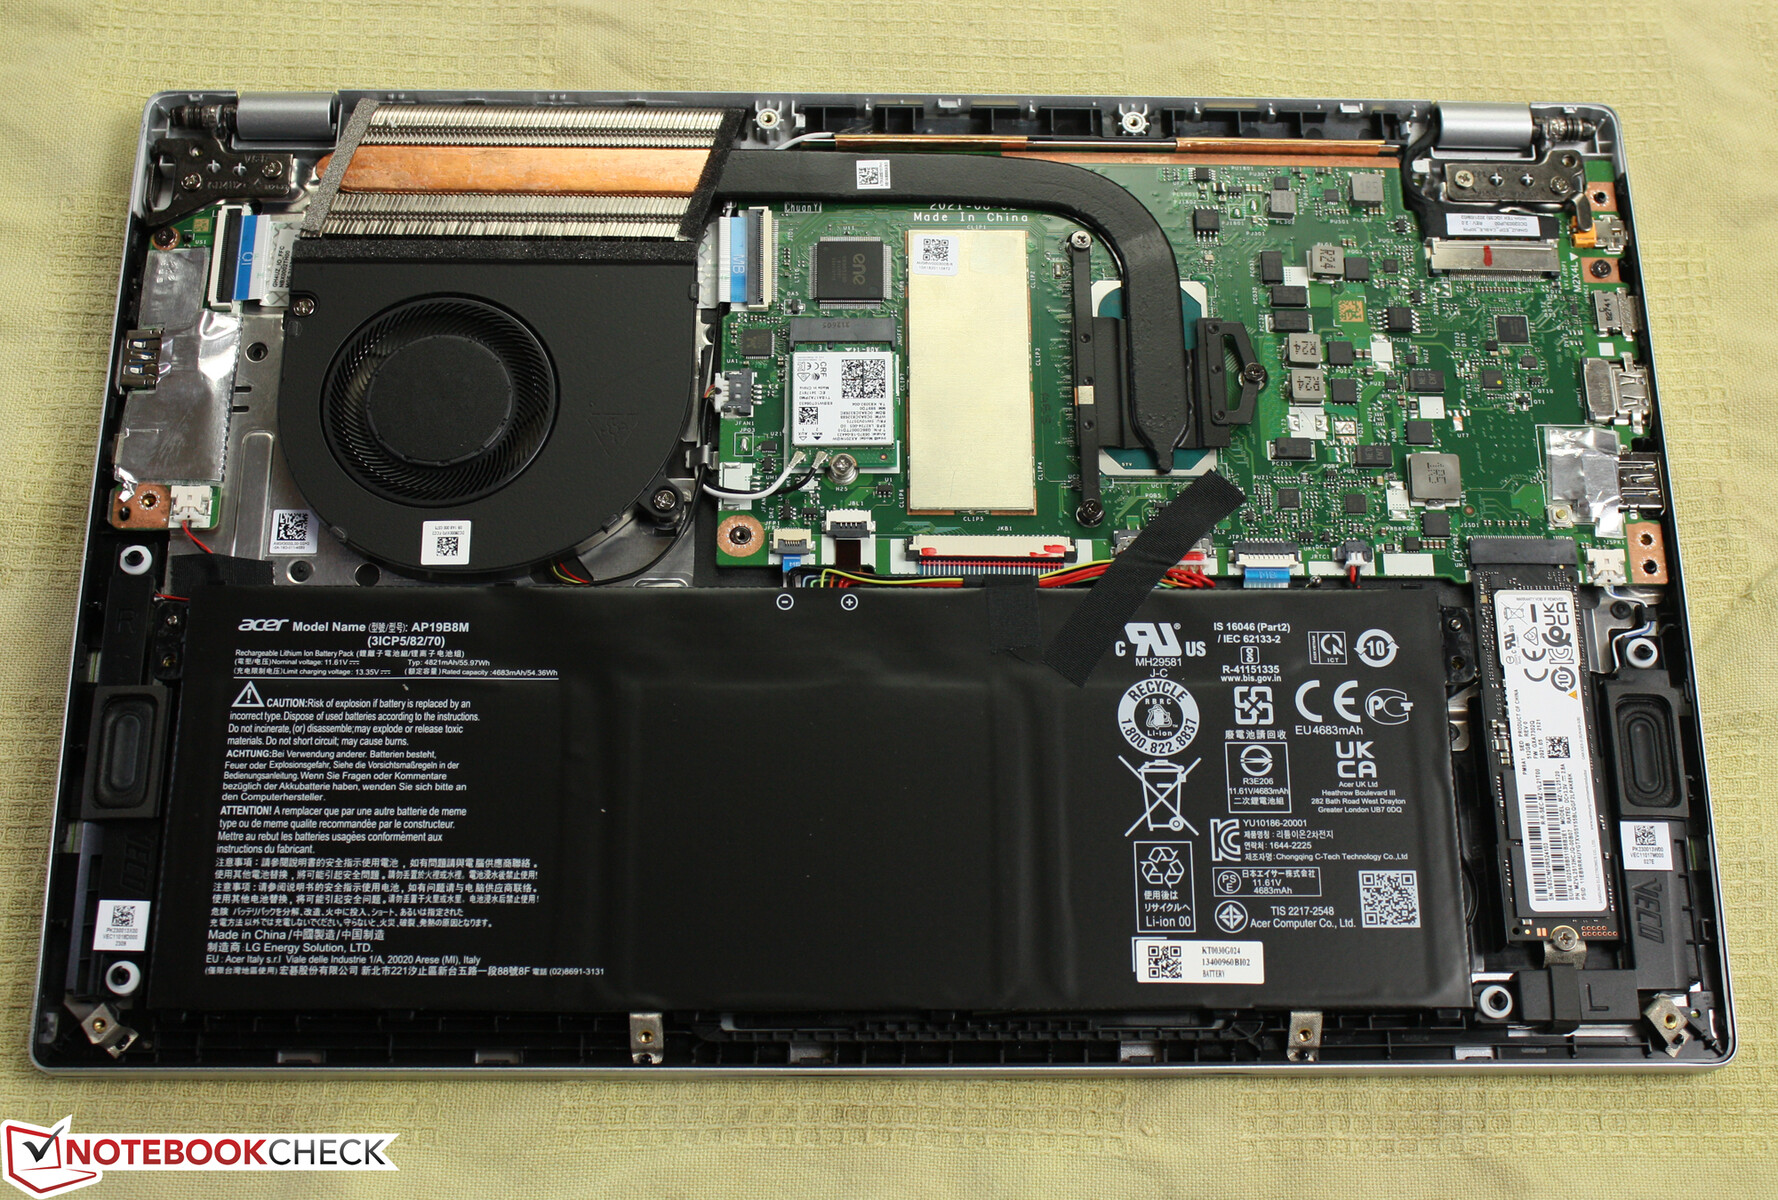
雨燕3没有维修舱门。不过,要进入其内部还是比较容易的。在卸下设备底部的所有螺丝后,可以借助关节平滑器或扁平铲子将底盖取下。不幸的是,内存完全是板载的,没有可用于扩展的插槽。
担保
宏碁为这款14英寸的超薄产品在德国提供两年的保修服务--包括提货服务。三年保修的费用约为50欧元(约合57美元)。
输入设备 - 使用宏碁笔记本电脑快速打字
键盘
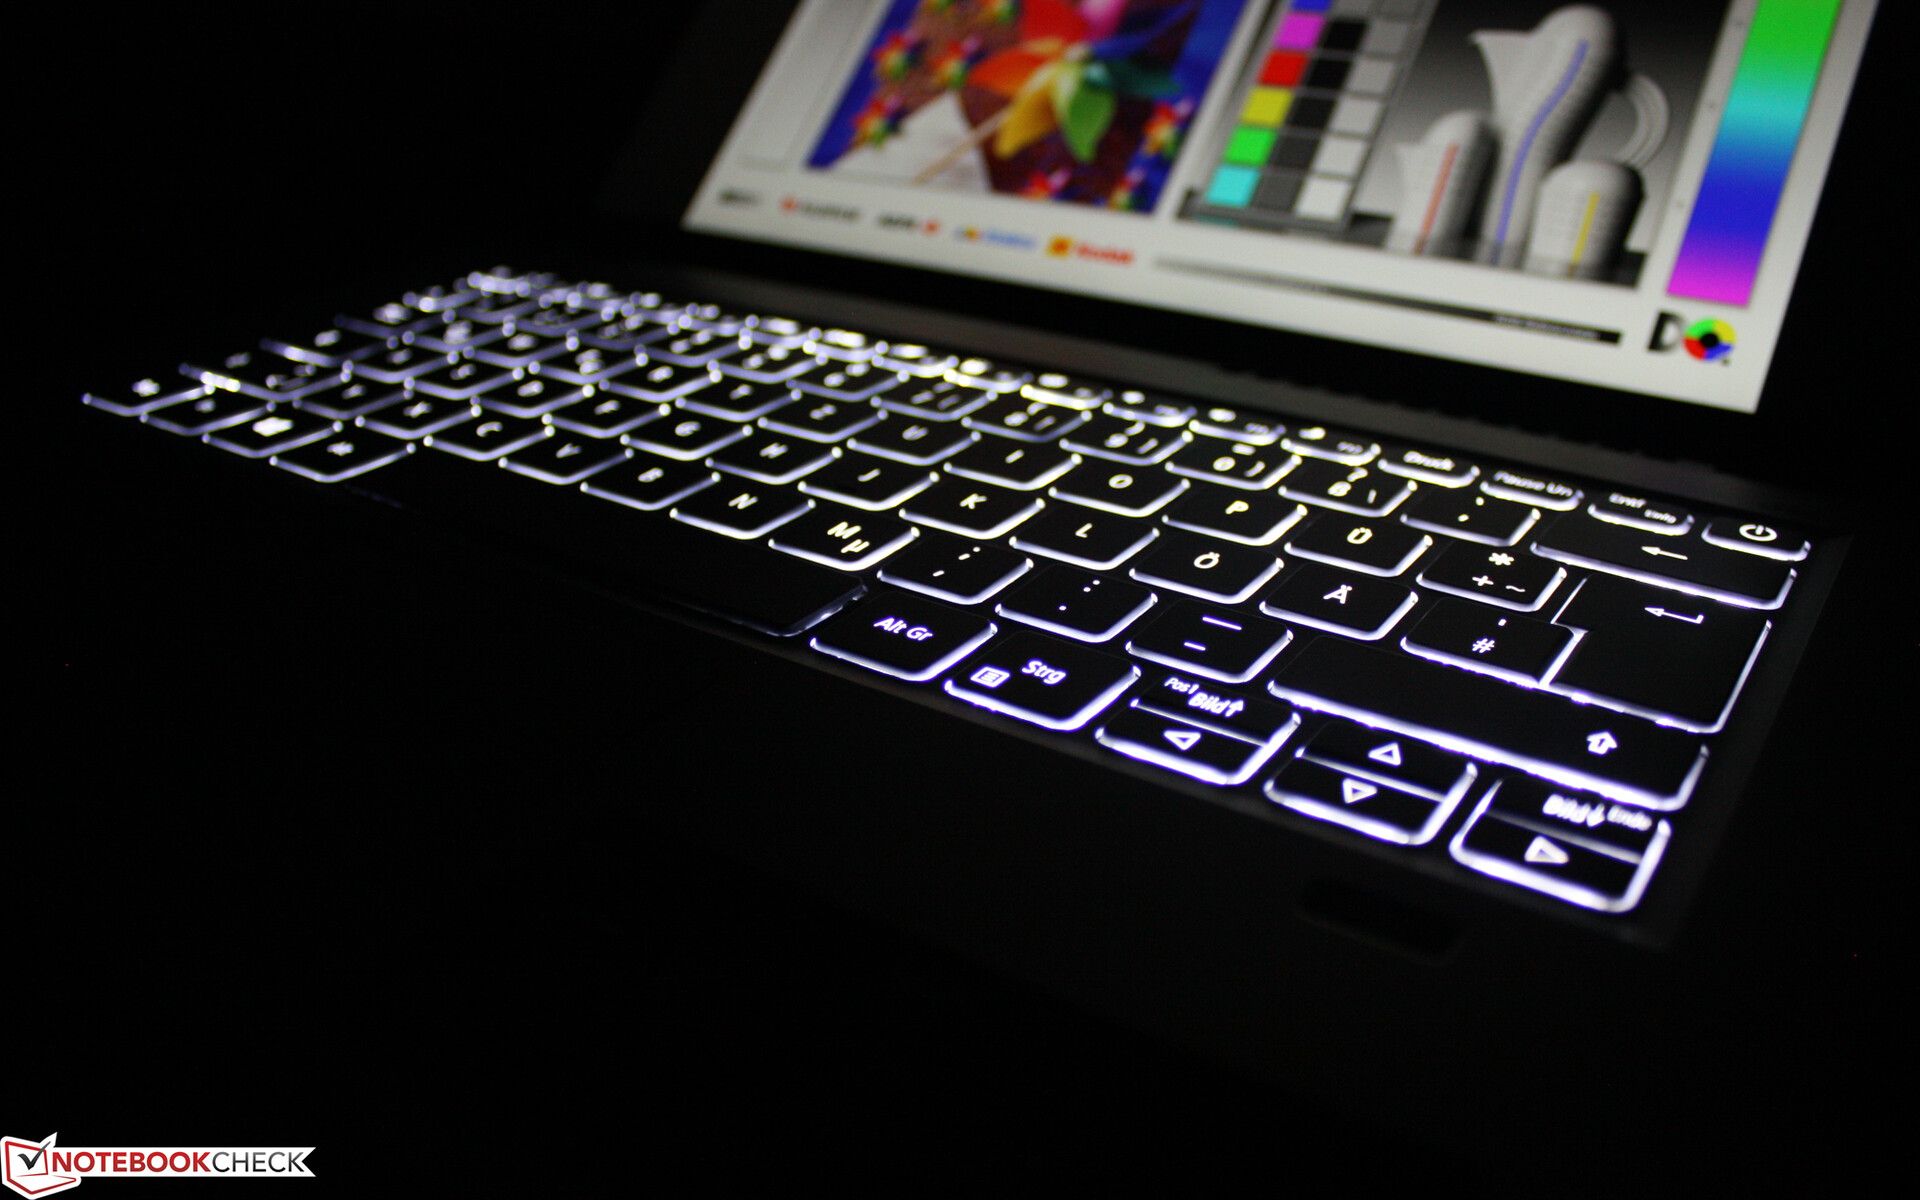
宏碁为这台14英寸的电脑配备了一个单层背光的小键盘。平坦、光滑的按键提供了一个短的行程和一个清晰的压力点。键盘提供的阻力还可以。在打字过程中,键盘在任何位置都不会屈服。总而言之,宏碁提供了一个适合日常使用的键盘,用它可以快速打字;但是,它似乎有点僵硬。行程和压力点应该更加明显,以获得更好的反馈。

触摸板
具有多点触摸功能的ClickPad占据了大约10.5 x 6.5厘米的面积。这为使用手势控制提供了很大的空间。光滑的表面使手指很容易在上面滑行。垫子对角落里的输入也有反应。它的行程很短,有一个清晰的压力点;此外,它发出的噪音是可以听到的,但很温和。
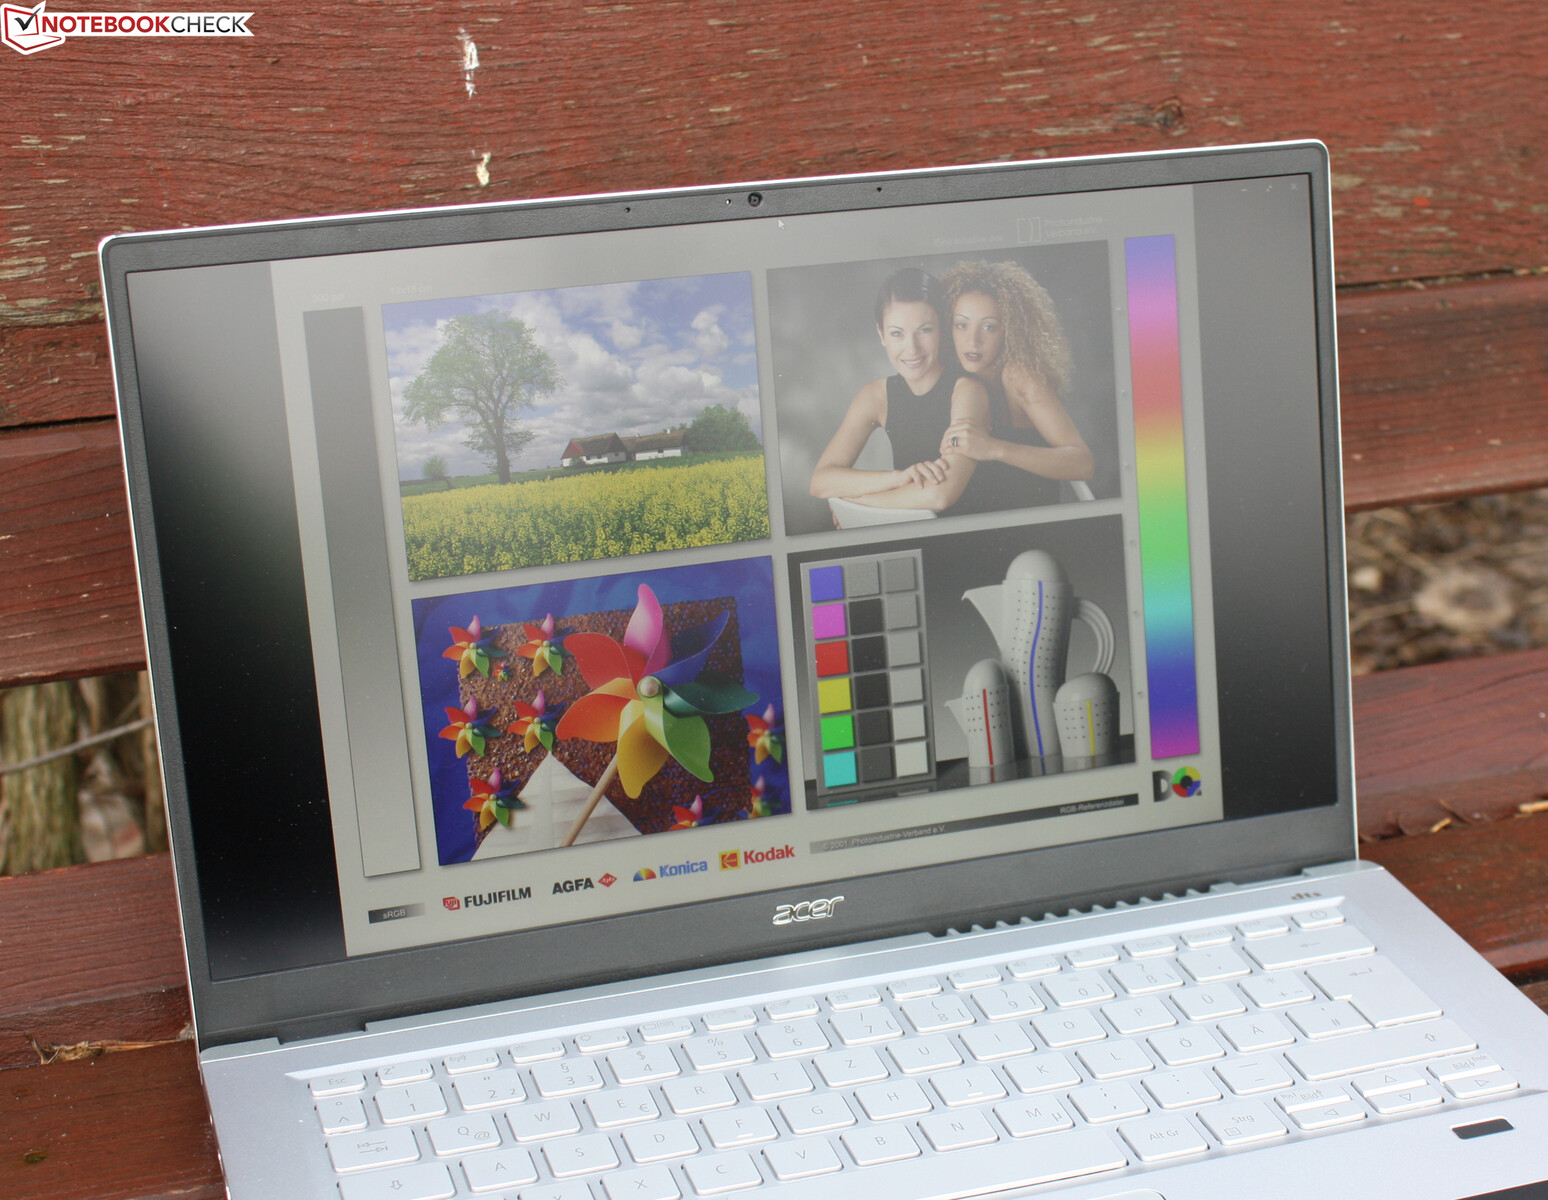
显示屏 - 全高清,色彩鲜艳
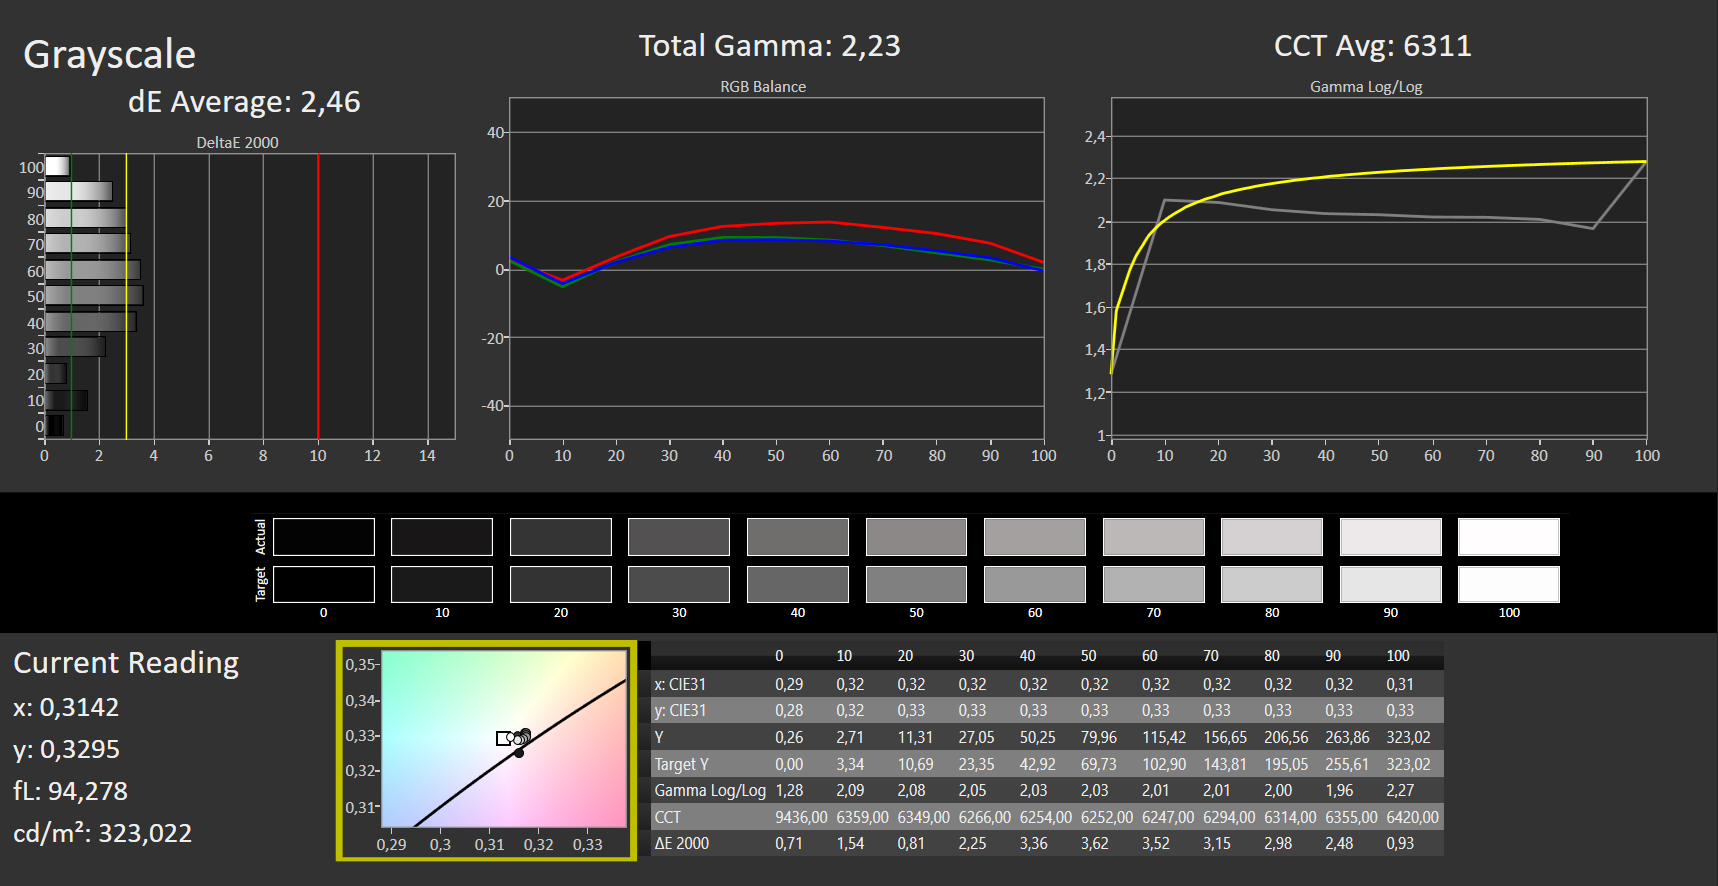
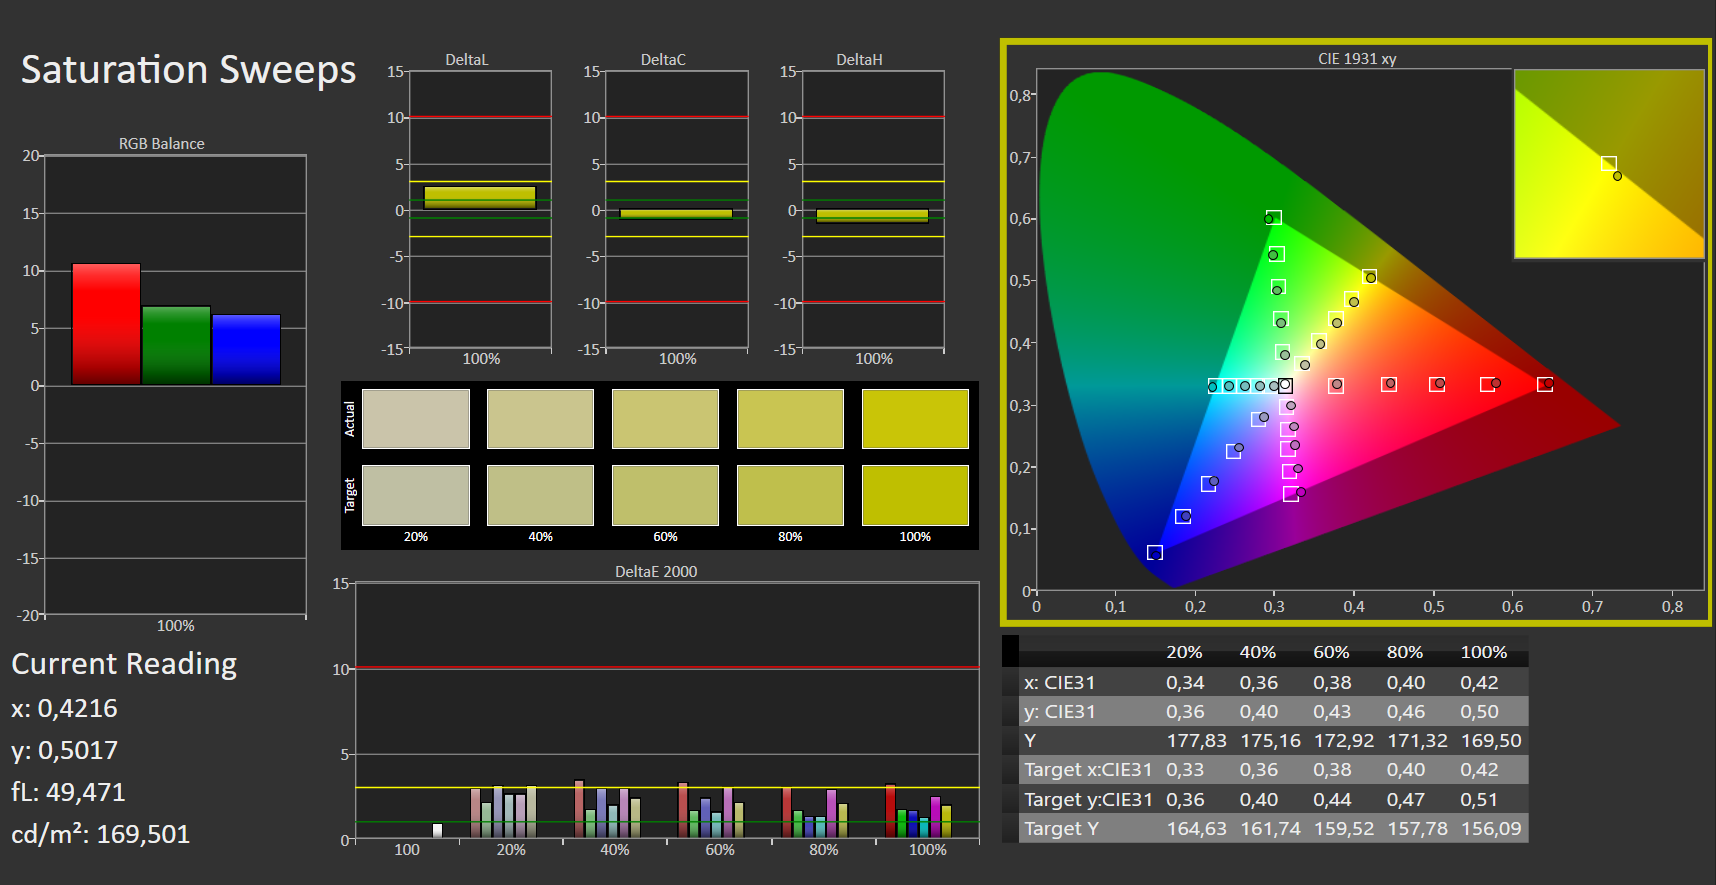
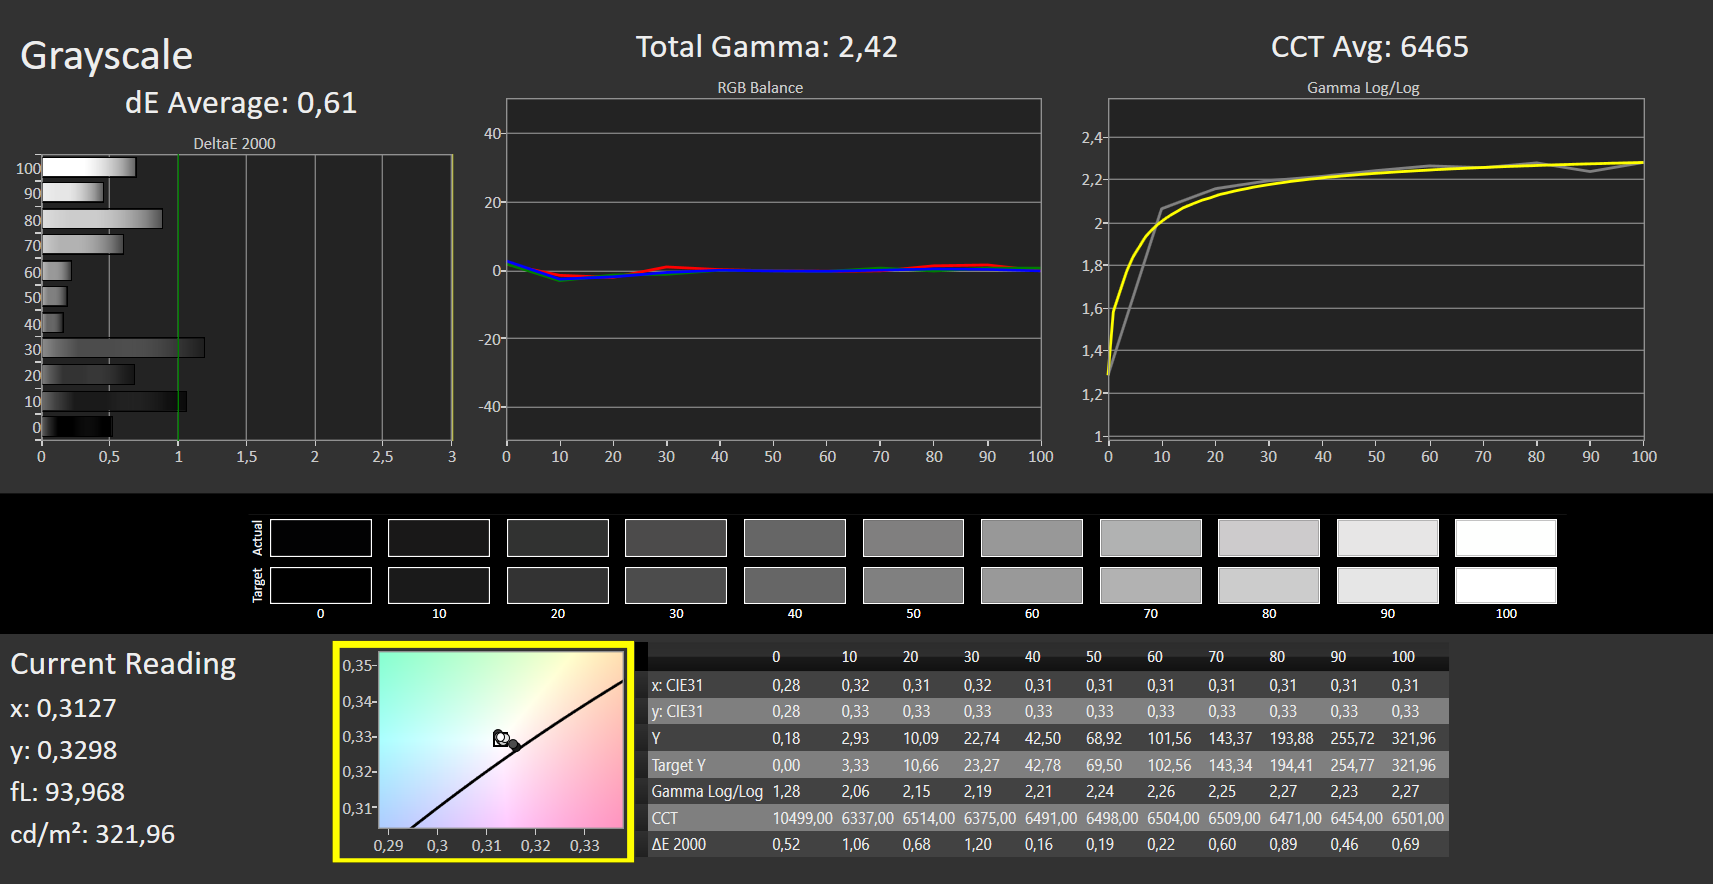
宏碁Swift 3的哑光14英寸显示屏的原始分辨率为1920x1080像素。它提供了良好的对比度(1280:1),最大亮度(347 cd/m²)也不错,但低于所有竞争对手。与前代产品相比,宏碁在这里做了改进,特别是在电池供电的情况下,亮度保持不变。积极的一面。显示器不会出现PWM闪烁。
| |||||||||||||||||||||||||
Brightness Distribution: 84 %
Center on Battery: 324 cd/m²
Contrast: 1280:1 (Black: 0.25 cd/m²)
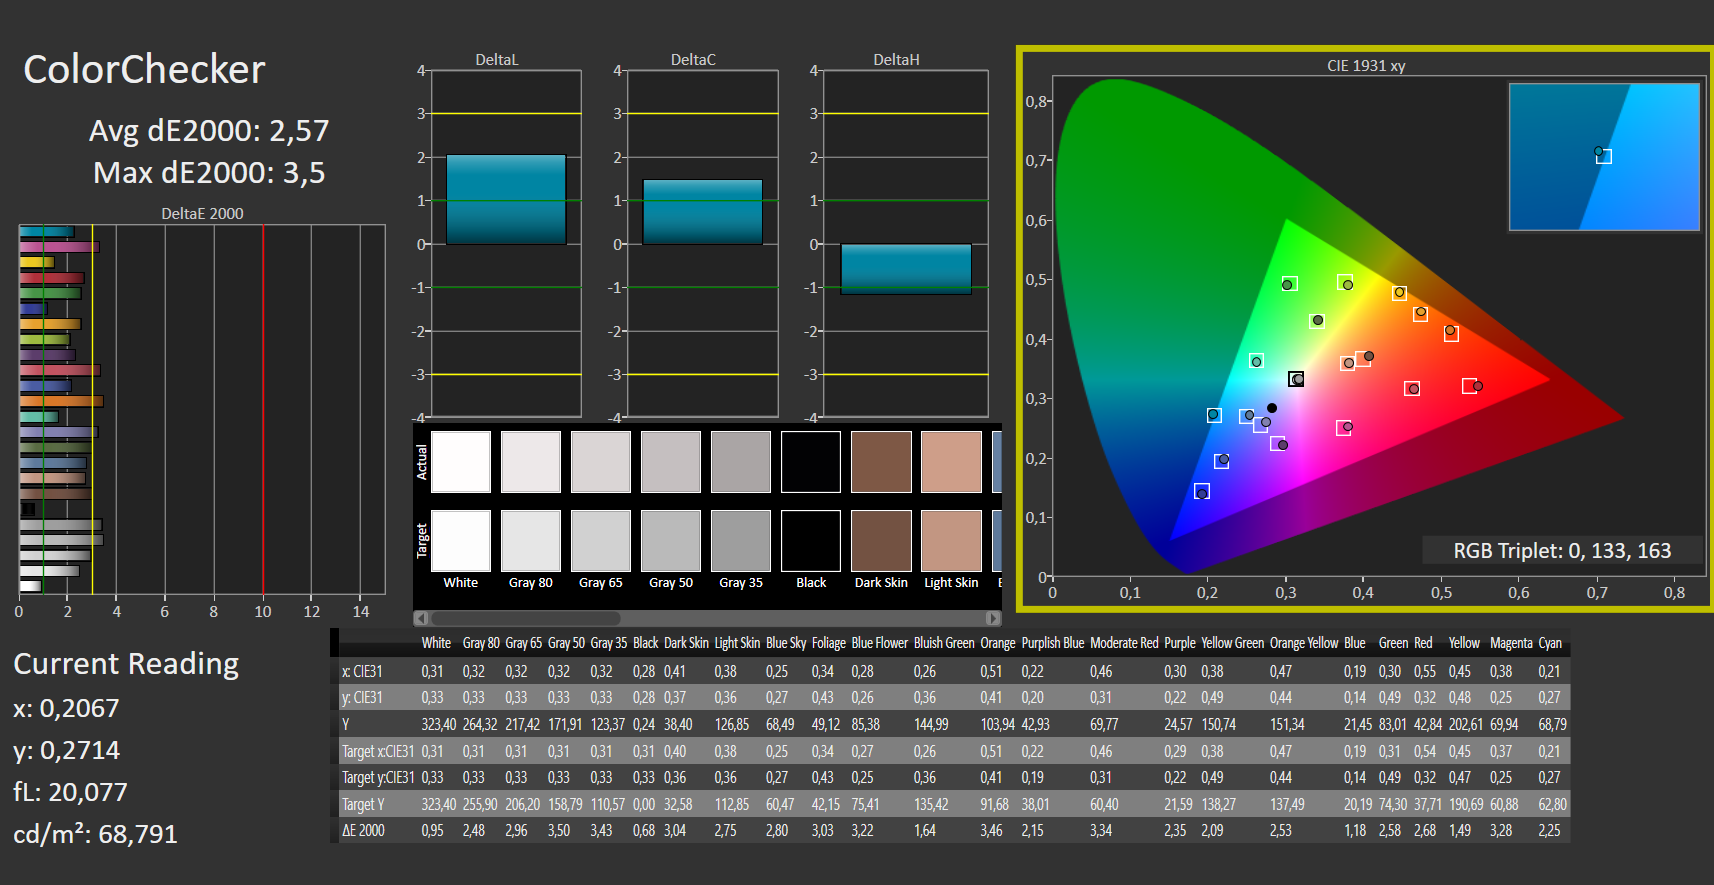
ΔE ColorChecker Calman: 2.57 | ∀{0.5-29.43 Ø4.73}
calibrated: 0.76
ΔE Greyscale Calman: 2.46 | ∀{0.09-98 Ø4.97}
69% AdobeRGB 1998 (Argyll 3D)
98% sRGB (Argyll 3D)
67% Display P3 (Argyll 3D)
Gamma: 2.23
CCT: 6311 K
| Acer Swift 3 SF314-511-54ZK AUO B140HAN06, IPS, 1920x1080, 14" | Asus ZenBook 13 UM325S Samsung (SDC4158), OLED, 1920x1080, 13.3" | Dell XPS 13 9305 Core i5 FHD Sharp SHP14AE, IPS, 1920x1080, 13.3" | Lenovo ThinkBook 13s G3 20YA0005GE M133NW4JR0, IPS, 1920x1200, 13.3" | Asus Zenbook 14X UX5400E Samsung SDC4154, OLED, 2880x1800, 14" | |
|---|---|---|---|---|---|
| Display | 32% | -2% | 0% | 30% | |
| Display P3 Coverage (%) | 67 | 99.9 49% | 66.3 -1% | 67.5 1% | 100 49% |
| sRGB Coverage (%) | 98 | 100 2% | 97.1 -1% | 97.1 -1% | 100 2% |
| AdobeRGB 1998 Coverage (%) | 69 | 99.7 44% | 67.1 -3% | 68.8 0% | 96 39% |
| Response Times | 89% | 1% | -8% | 95% | |
| Response Time Grey 50% / Grey 80% * (ms) | 52 ? | 4 ? 92% | 55 ? -6% | 53.2 ? -2% | 2 ? 96% |
| Response Time Black / White * (ms) | 29 ? | 4 ? 86% | 27 ? 7% | 32.8 ? -13% | 2 ? 93% |
| PWM Frequency (Hz) | 60 ? | 996 ? | |||
| Screen | 7% | -4% | 14% | 11% | |
| Brightness middle (cd/m²) | 320 | 370 16% | 486 52% | 379 18% | 379 18% |
| Brightness (cd/m²) | 309 | 378 22% | 446 44% | 356 15% | 381 23% |
| Brightness Distribution (%) | 84 | 96 14% | 77 -8% | 88 5% | 93 11% |
| Black Level * (cd/m²) | 0.25 | 0.05 80% | 0.4 -60% | 0.23 8% | 0.1 60% |
| Contrast (:1) | 1280 | 7400 478% | 1215 -5% | 1648 29% | 3790 196% |
| Colorchecker dE 2000 * | 2.57 | 4.33 -68% | 2.54 1% | 1.6 38% | 2.3 11% |
| Colorchecker dE 2000 max. * | 3.5 | 7.04 -101% | 4.34 -24% | 2.7 23% | 4.16 -19% |
| Colorchecker dE 2000 calibrated * | 0.76 | 4.14 -445% | 1.04 -37% | 1 -32% | 2.42 -218% |
| Greyscale dE 2000 * | 2.46 | 0.92 63% | 2.34 5% | 2 19% | 2.12 14% |
| Gamma | 2.23 99% | 2.38 92% | 2.28 96% | 2.25 98% | 2.42 91% |
| CCT | 6311 103% | 6394 102% | 6864 95% | 6835 95% | |
| Color Space (Percent of AdobeRGB 1998) (%) | 89.4 | 62 | |||
| Color Space (Percent of sRGB) (%) | 100 | 97 | |||
| Total Average (Program / Settings) | 43% /
24% | -2% /
-3% | 2% /
8% | 45% /
27% |
* ... smaller is better
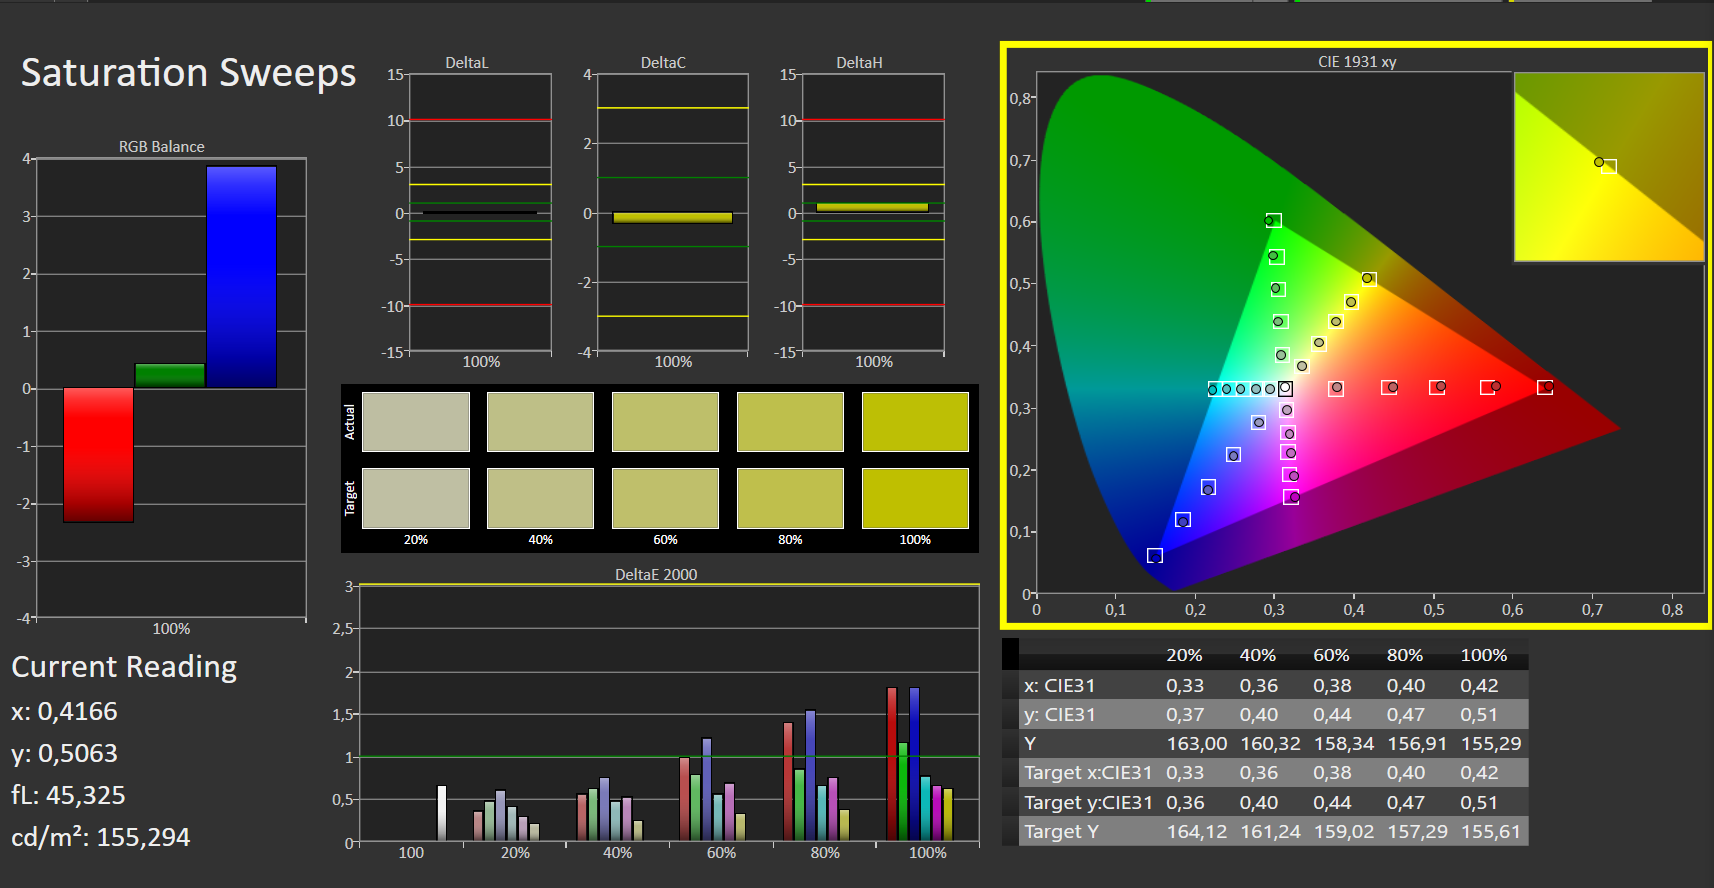
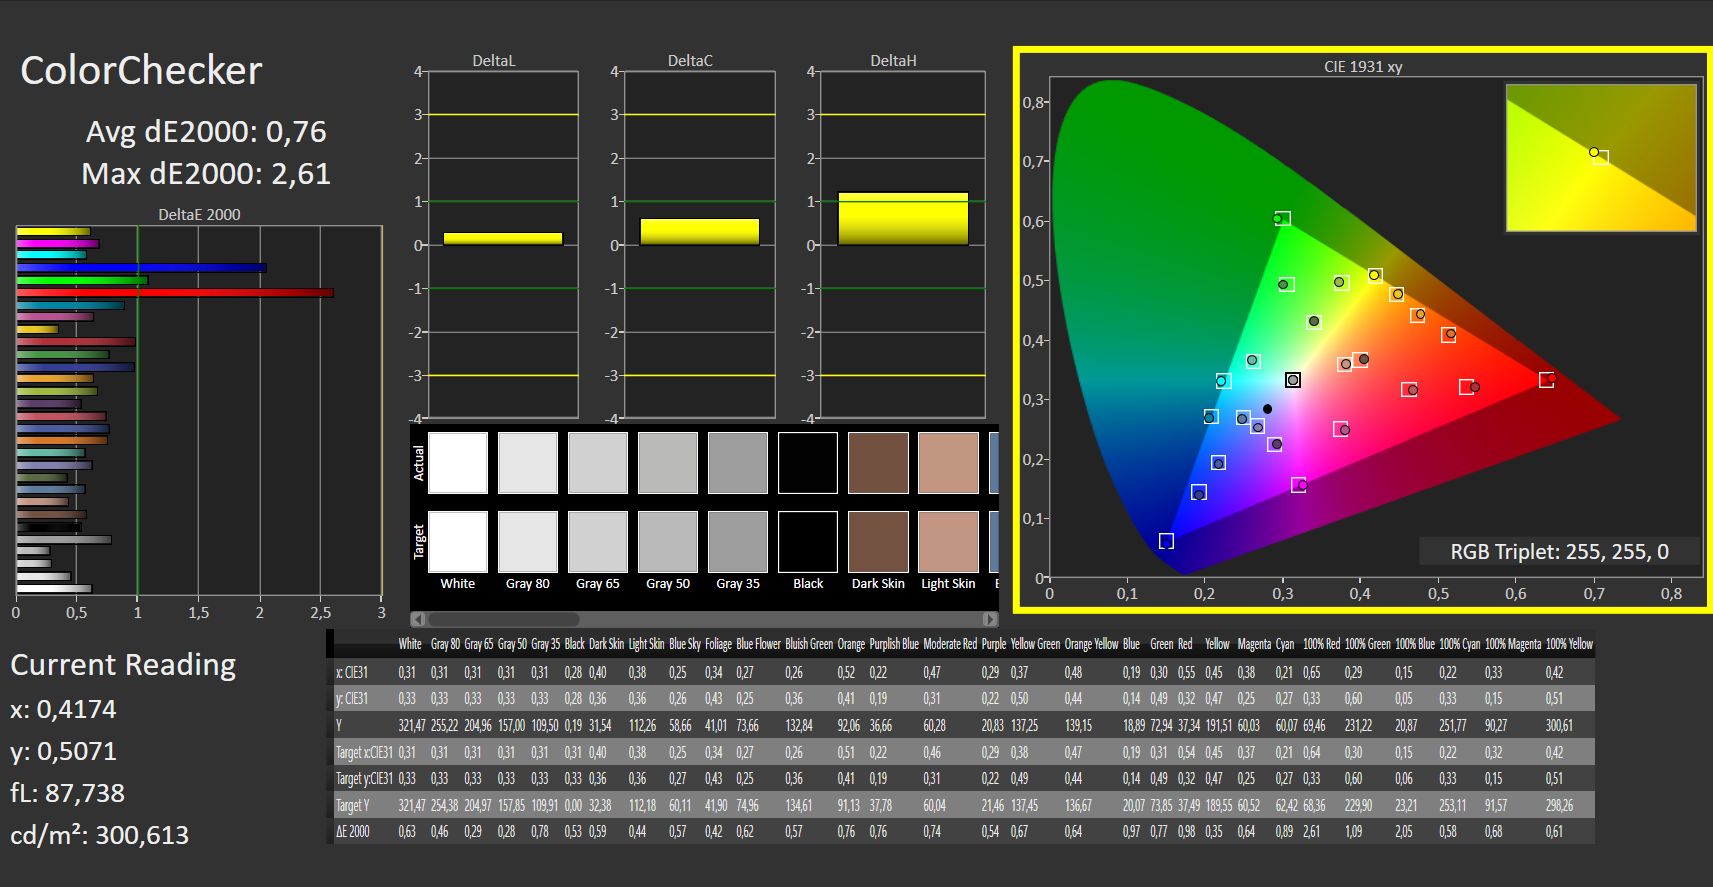
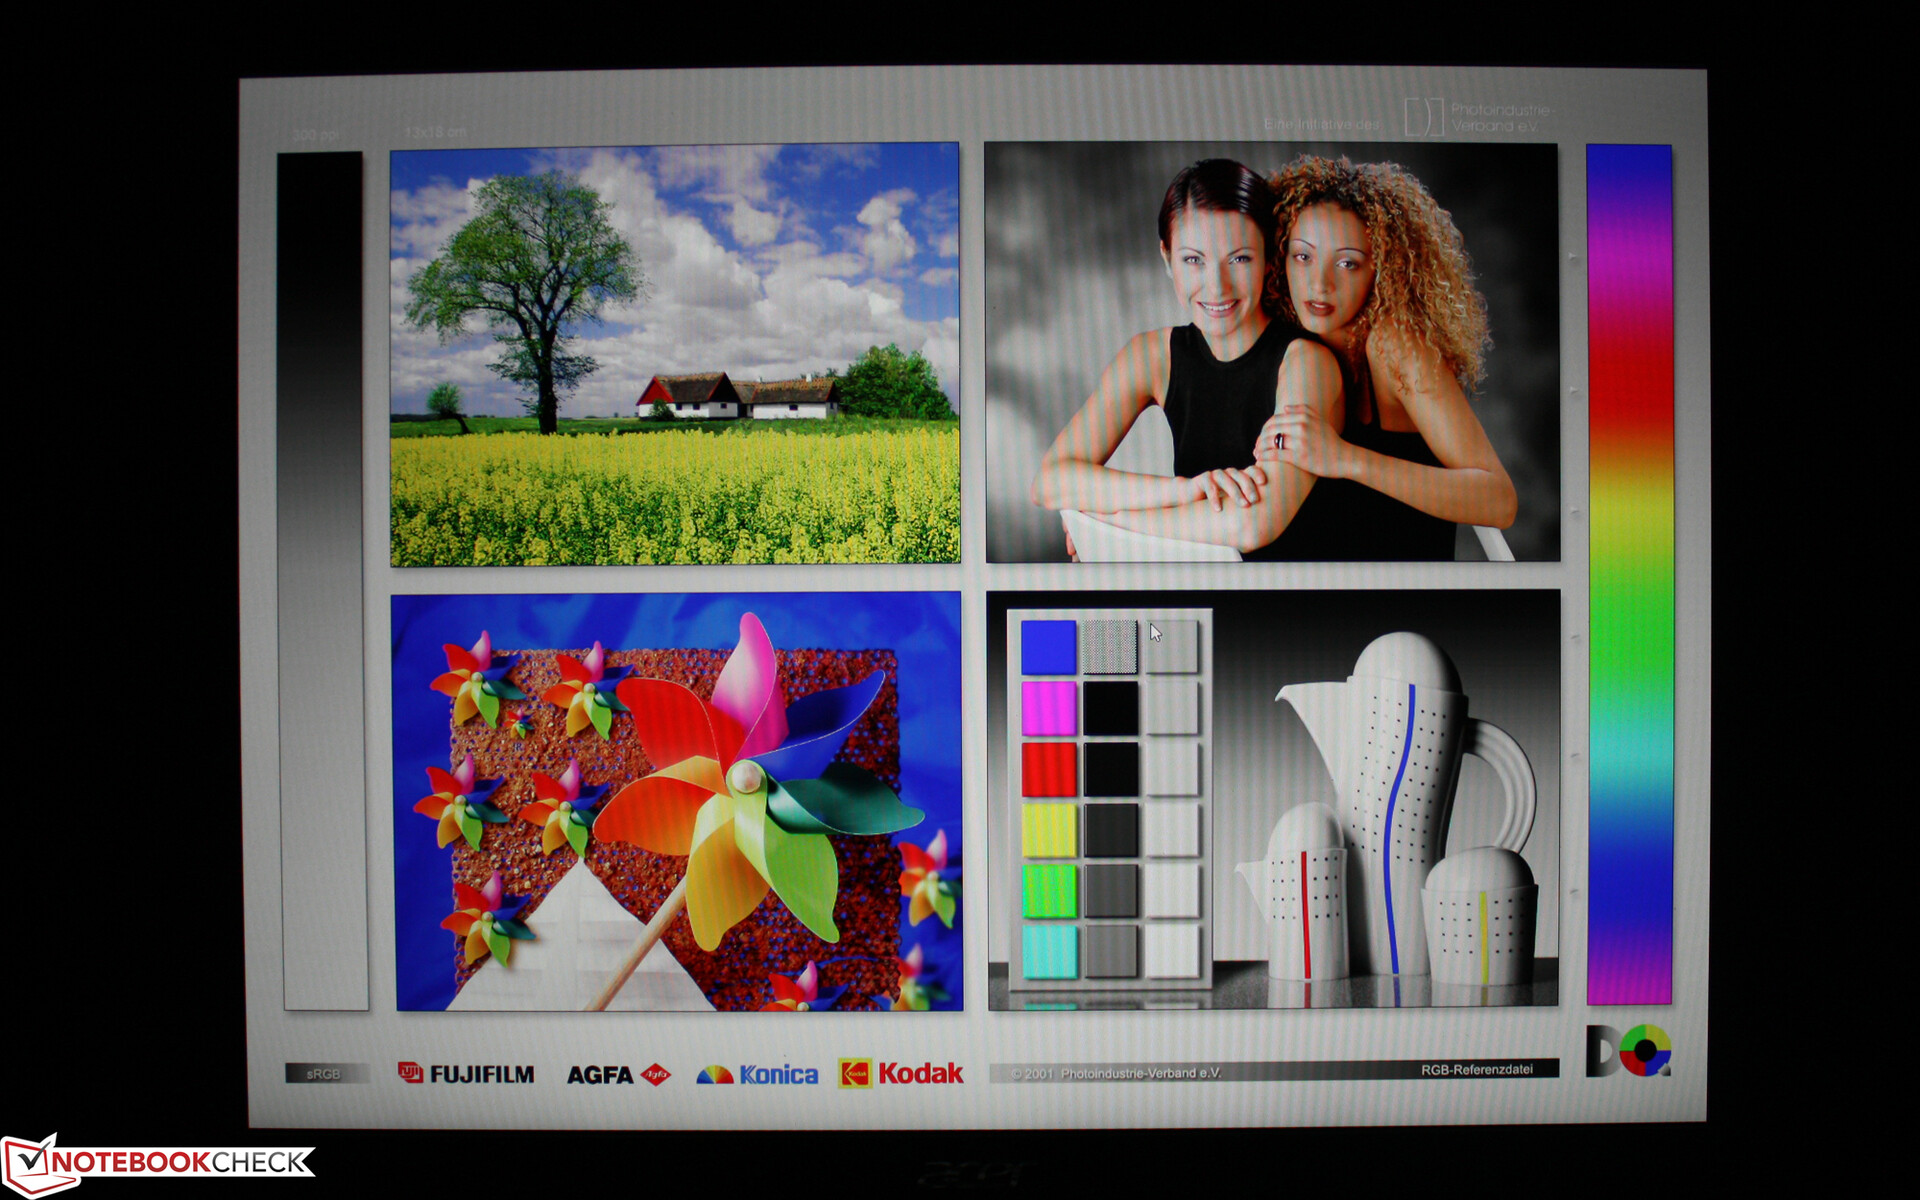
开箱后,该显示器显示了体面的色彩再现和良好的精度。DeltaE 2000色彩偏差为2.5,达到了目标(DeltaE小于3)。该显示器没有受到蓝色色调的影响;相反,sRGB色彩空间覆盖率为98%。在这方面,采用IPS的竞争者也不差;XPS 13和ThinkBook 13s显示了非常相似的测量结果。华硕ZenBook 13 UM325S的OLED显示屏和ZenBook 14XUX5400E在100%覆盖P3色彩空间方面做得更好,它们在DeltaE方面的成绩也更好。
校准后,Swift的性能提高得更多。灰度的DeltaE降至0.6,色彩的DeltaE降至0.7。这些最高分说明了一个优秀的、可校准的IPS面板,在这种情况下,它是由友达制造的。
Display Response Times
| ↔ Response Time Black to White | ||
|---|---|---|
| 29 ms ... rise ↗ and fall ↘ combined | ↗ 13 ms rise |  |
| ↘ 16 ms fall | ||
| The screen shows relatively slow response rates in our tests and may be too slow for gamers. In comparison, all tested devices range from 0.1 (minimum) to 240 (maximum) ms. » 77 % of all devices are better. This means that the measured response time is worse than the average of all tested devices (19.9 ms). | ||
| ↔ Response Time 50% Grey to 80% Grey | ||
| 52 ms ... rise ↗ and fall ↘ combined | ↗ 23 ms rise |  |
| ↘ 29 ms fall | ||
| The screen shows slow response rates in our tests and will be unsatisfactory for gamers. In comparison, all tested devices range from 0.165 (minimum) to 636 (maximum) ms. » 88 % of all devices are better. This means that the measured response time is worse than the average of all tested devices (31.1 ms). | ||
Screen Flickering / PWM (Pulse-Width Modulation)
| Screen flickering / PWM not detected |  | ||
In comparison: 52 % of all tested devices do not use PWM to dim the display. If PWM was detected, an average of 7784 (minimum: 5 - maximum: 343500) Hz was measured. | |||
在户外,不反光的表面以及适度的亮度确保了在阳光下的体面可见性。亮度不会因为电池电量而降低。
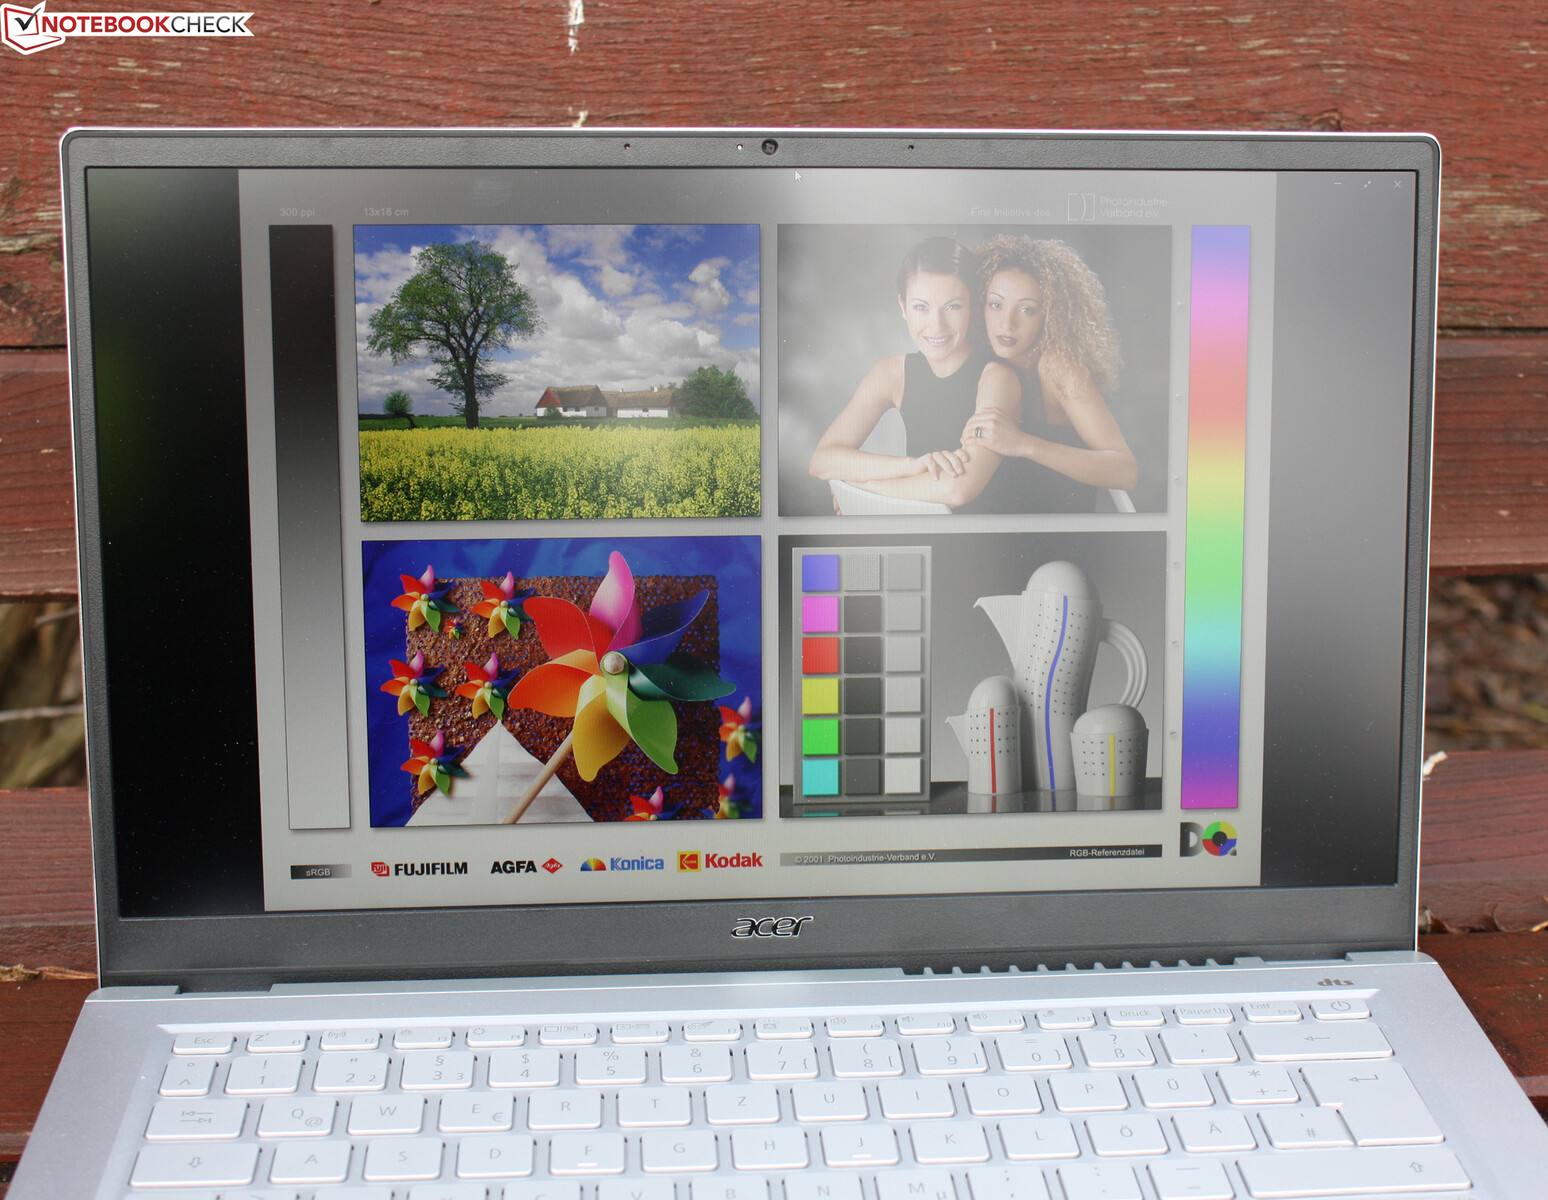
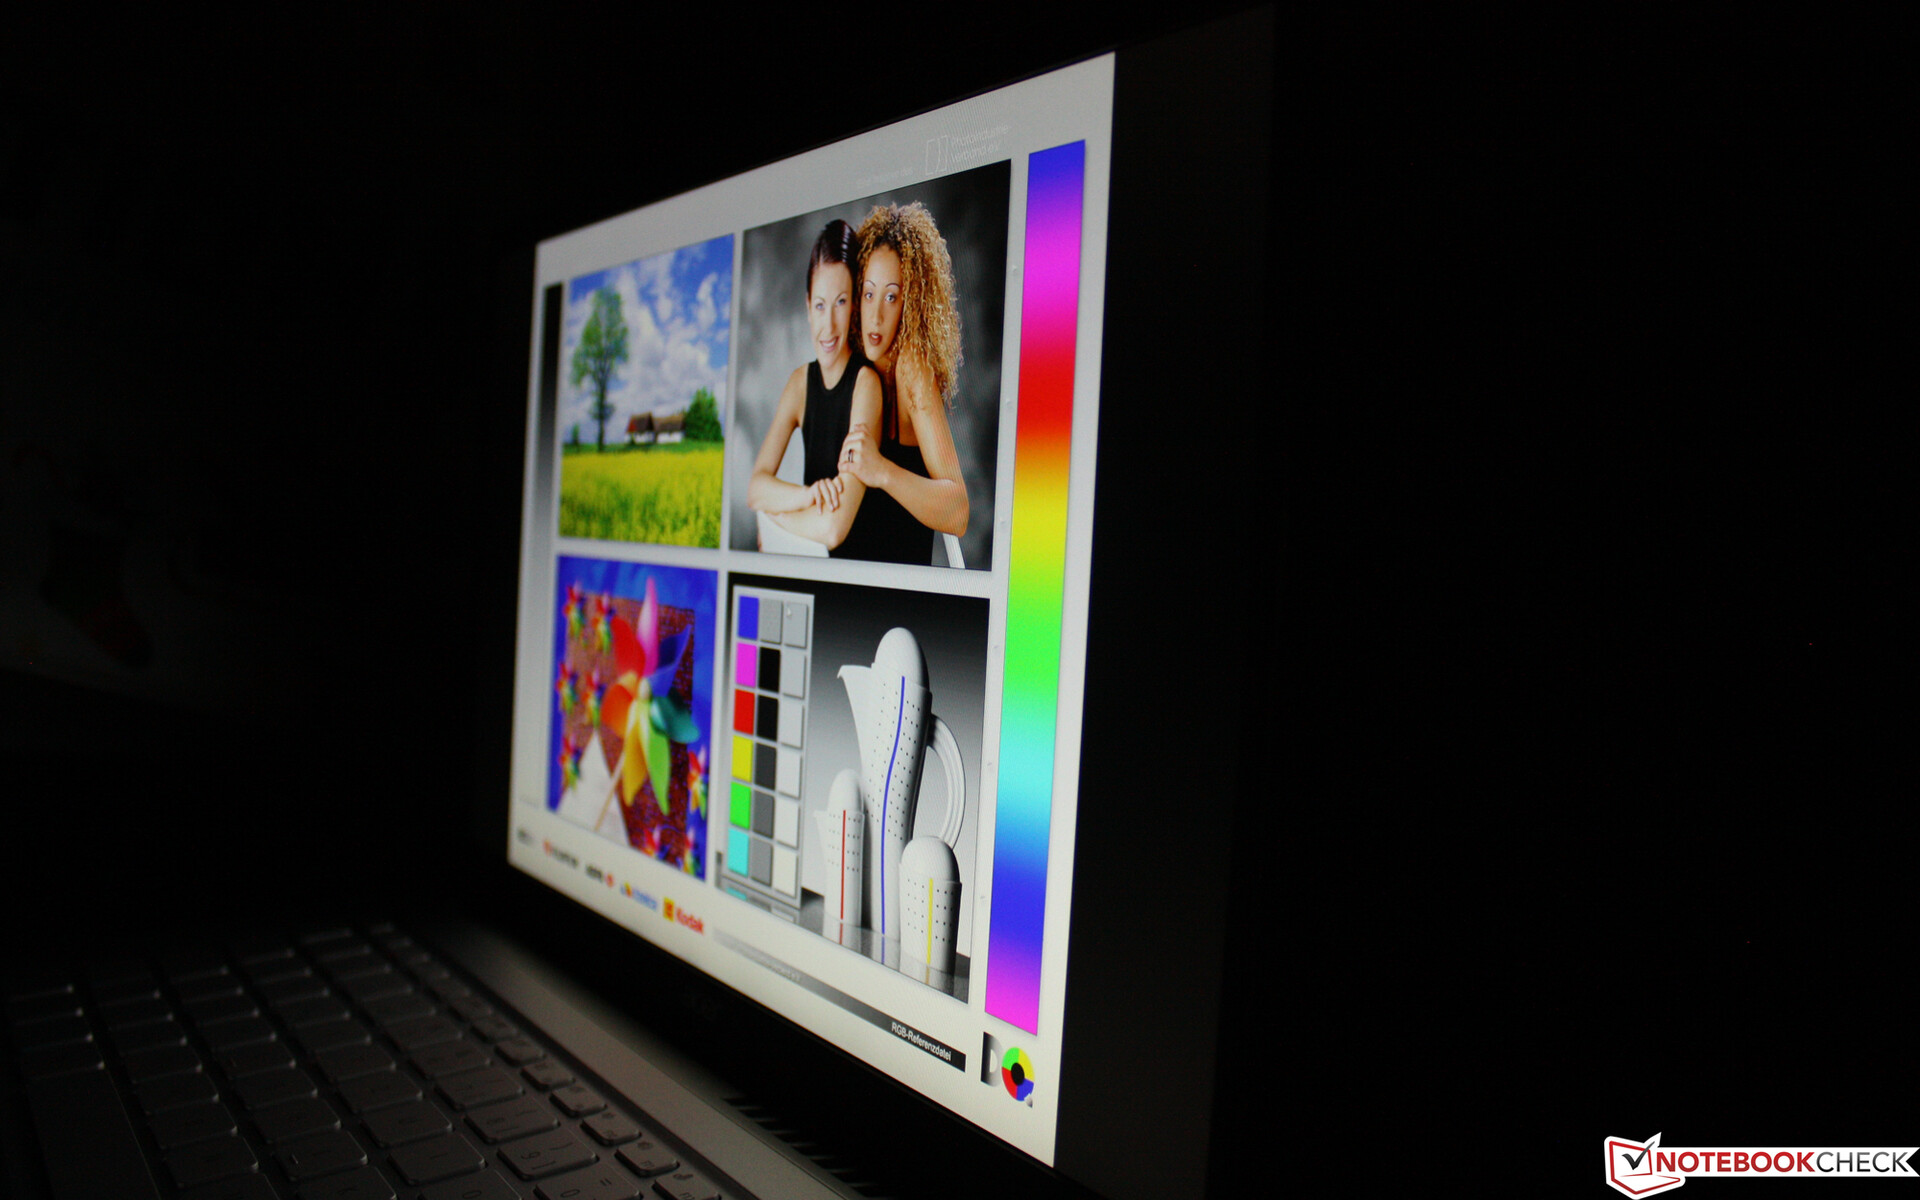
宏碁笔记本电脑配备了一个视角稳定的IPS面板。因此,屏幕从任何位置都清晰可辨。

性能 - Swift 3实现了它的承诺
通过Swift 3,宏碁瞄准了办公用户,它为笔记本电脑配备了相应的硬件。虽然目前有各种Tiger Lake 和Ryzen 5000 CPU作为处理器,但在显卡方面只有相应处理器的内部GPU可以选择。价格稍高的宏碁Swift 3X SF314-510G冒险使用了一个Iris Xe图形MAX,在测试中也显示了游戏性能的适度提高。
测试条件
我们使用Windows最佳性能配置文件运行所有的基准测试。对于Wi-Fi测试中的电池运行时间,我们选择了最佳节能以及省电模式(较少的后台进程)。InsydeH30 BIOS中没有关于性能(TDP限制)的设置。
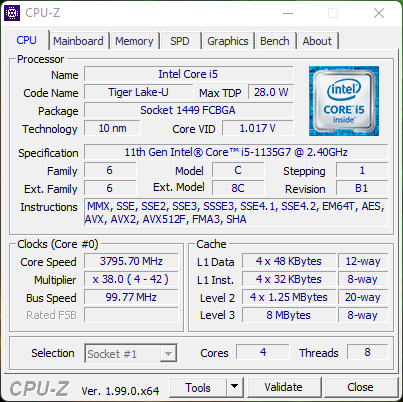
处理器
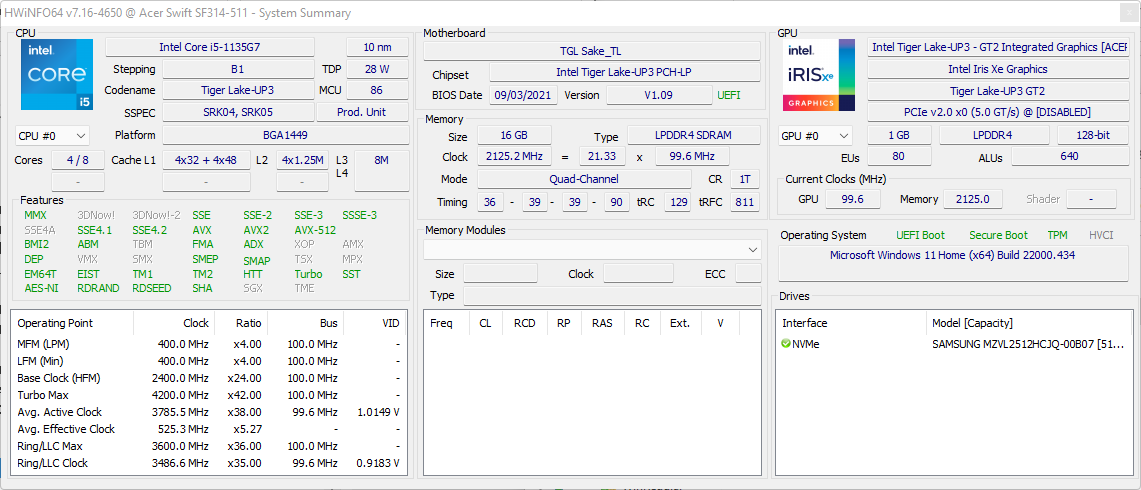
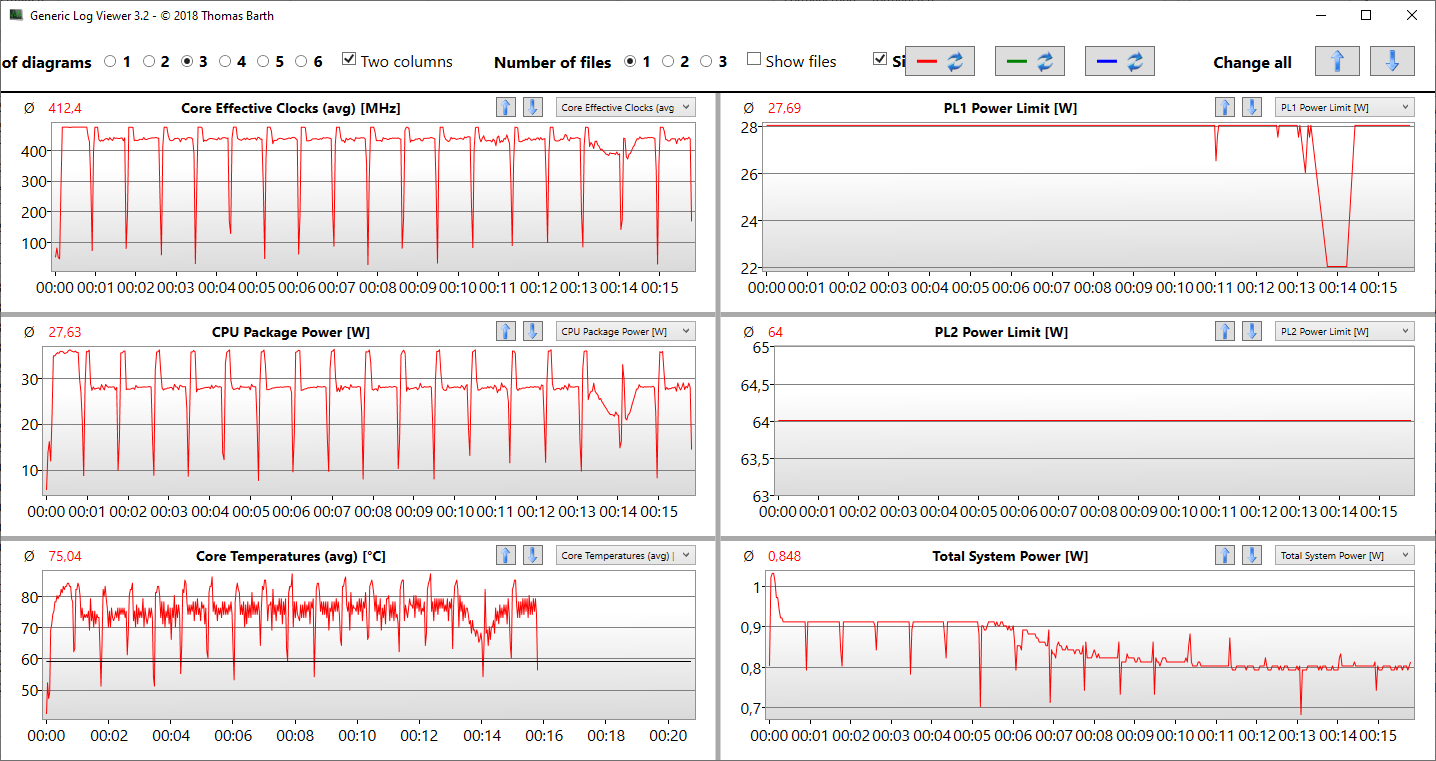
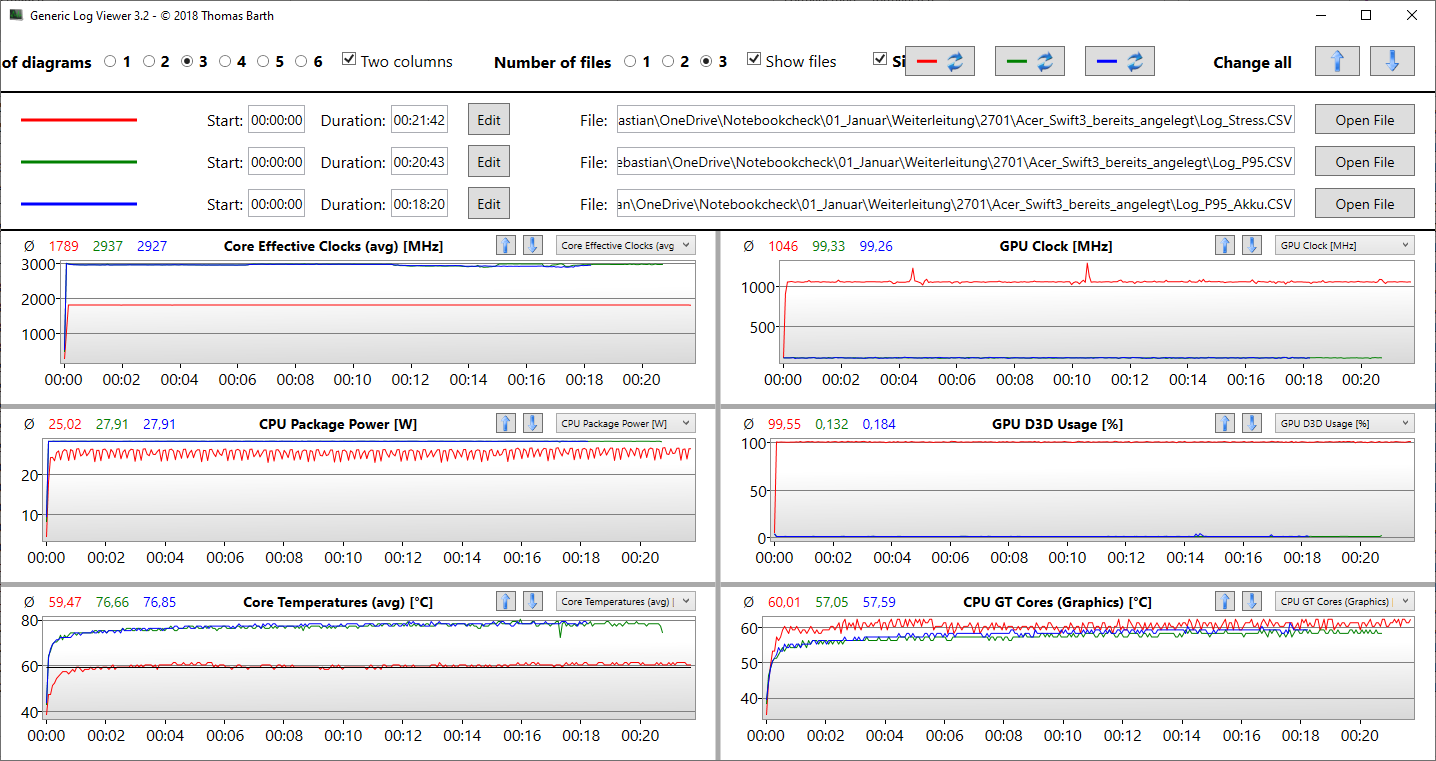
我们的测试模型宏碁Swift 3配备了一个 英特尔酷睿i5-1135G7.这个处理器属于英特尔的Tiger Lake ,提供四个核心,可以同时处理多达八个任务,时钟频率在2.4和4.2GHz之间。这里的性能取决于设定的TDP和冷却方式。在Cinebench测量过程中,我们看到CPU封装功率最大为35瓦,这应该与PL2/Short Burst值相对应。这意味着宏碁离PL2理论上可能达到的64瓦还很远。
PL1/Sustained值为28瓦,Cinebench循环显示这个水平可以长期保持。第一个循环以904分结束,第六个循环以848分结束,所以性能损失很低(7%)。循环中的 戴尔XPS 13 9305采用相同的SoC,从芯片中获得的性能明显较低,甚至在ZenBook 14X中的Core i7-1165G7也是如此。笔记本14X也没有比Swift 3做得更好。在所有基准测试中的性能评级显示,Swift 3的得分略高于平均水平。
简而言之:尽管PL2只有35瓦,看起来很低,但宏碁从Swift 3的SoC中获得了高于平均水平的性能。
正如我们经常看到的那样,Ryzen 5000替代品以很大的优势胜出,这就是为什么在关注性能时,建议看一下AMD Swift 3 SF314-43版本。
Cinebench R15 Multi endurance test
Cinebench R23: Multi Core | Single Core
Cinebench R20: CPU (Multi Core) | CPU (Single Core)
Cinebench R15: CPU Multi 64Bit | CPU Single 64Bit
Blender: v2.79 BMW27 CPU
7-Zip 18.03: 7z b 4 | 7z b 4 -mmt1
Geekbench 5.5: Multi-Core | Single-Core
HWBOT x265 Benchmark v2.2: 4k Preset
LibreOffice : 20 Documents To PDF
R Benchmark 2.5: Overall mean
| CPU Performance rating | |
| Average of class Subnotebook | |
| Lenovo ThinkBook 13s G3 20YA0005GE | |
| Asus ZenBook 13 UM325S | |
| Asus Zenbook 14X UX5400E | |
| Acer Swift 3 SF314-511-54ZK | |
| Average Intel Core i5-1135G7 | |
| Dell XPS 13 9305 Core i5 FHD -2! | |
| Cinebench R23 / Multi Core | |
| Average of class Subnotebook (1555 - 21812, n=60, last 2 years) | |
| Asus ZenBook 13 UM325S | |
| Lenovo ThinkBook 13s G3 20YA0005GE | |
| Asus Zenbook 14X UX5400E | |
| Acer Swift 3 SF314-511-54ZK | |
| Dell XPS 13 9305 Core i5 FHD | |
| Average Intel Core i5-1135G7 (2786 - 6136, n=55) | |
| Cinebench R23 / Single Core | |
| Average of class Subnotebook (358 - 2213, n=61, last 2 years) | |
| Asus Zenbook 14X UX5400E | |
| Lenovo ThinkBook 13s G3 20YA0005GE | |
| Asus ZenBook 13 UM325S | |
| Average Intel Core i5-1135G7 (1062 - 1373, n=53) | |
| Dell XPS 13 9305 Core i5 FHD | |
| Acer Swift 3 SF314-511-54ZK | |
| Cinebench R20 / CPU (Multi Core) | |
| Average of class Subnotebook (579 - 8541, n=57, last 2 years) | |
| Asus ZenBook 13 UM325S | |
| Lenovo ThinkBook 13s G3 20YA0005GE | |
| Asus Zenbook 14X UX5400E | |
| Acer Swift 3 SF314-511-54ZK | |
| Dell XPS 13 9305 Core i5 FHD | |
| Average Intel Core i5-1135G7 (979 - 2382, n=62) | |
| Cinebench R20 / CPU (Single Core) | |
| Average of class Subnotebook (128 - 832, n=57, last 2 years) | |
| Asus Zenbook 14X UX5400E | |
| Lenovo ThinkBook 13s G3 20YA0005GE | |
| Asus ZenBook 13 UM325S | |
| Acer Swift 3 SF314-511-54ZK | |
| Average Intel Core i5-1135G7 (375 - 527, n=62) | |
| Dell XPS 13 9305 Core i5 FHD | |
| Cinebench R15 / CPU Multi 64Bit | |
| Average of class Subnotebook (327 - 3345, n=57, last 2 years) | |
| Lenovo ThinkBook 13s G3 20YA0005GE | |
| Lenovo ThinkBook 13s G3 20YA0005GE | |
| Asus ZenBook 13 UM325S | |
| Asus Zenbook 14X UX5400E | |
| Acer Swift 3 SF314-511-54ZK | |
| Average Intel Core i5-1135G7 (431 - 941, n=65) | |
| Dell XPS 13 9305 Core i5 FHD | |
| Cinebench R15 / CPU Single 64Bit | |
| Average of class Subnotebook (72.4 - 322, n=57, last 2 years) | |
| Lenovo ThinkBook 13s G3 20YA0005GE | |
| Asus ZenBook 13 UM325S | |
| Acer Swift 3 SF314-511-54ZK | |
| Average Intel Core i5-1135G7 (141.4 - 205, n=61) | |
| Asus Zenbook 14X UX5400E | |
| Blender / v2.79 BMW27 CPU | |
| Average Intel Core i5-1135G7 (499 - 1044, n=60) | |
| Dell XPS 13 9305 Core i5 FHD | |
| Acer Swift 3 SF314-511-54ZK | |
| Asus Zenbook 14X UX5400E | |
| Lenovo ThinkBook 13s G3 20YA0005GE | |
| Average of class Subnotebook (159 - 2271, n=58, last 2 years) | |
| Asus ZenBook 13 UM325S | |
| 7-Zip 18.03 / 7z b 4 | |
| Average of class Subnotebook (11668 - 77867, n=57, last 2 years) | |
| Asus ZenBook 13 UM325S | |
| Lenovo ThinkBook 13s G3 20YA0005GE | |
| Dell XPS 13 9305 Core i5 FHD | |
| Acer Swift 3 SF314-511-54ZK | |
| Asus Zenbook 14X UX5400E | |
| Average Intel Core i5-1135G7 (14745 - 24873, n=62) | |
| 7-Zip 18.03 / 7z b 4 -mmt1 | |
| Average of class Subnotebook (2643 - 6699, n=59, last 2 years) | |
| Asus ZenBook 13 UM325S | |
| Lenovo ThinkBook 13s G3 20YA0005GE | |
| Average Intel Core i5-1135G7 (3924 - 4921, n=62) | |
| Asus Zenbook 14X UX5400E | |
| Dell XPS 13 9305 Core i5 FHD | |
| Acer Swift 3 SF314-511-54ZK | |
| Geekbench 5.5 / Multi-Core | |
| Average of class Subnotebook (2557 - 17218, n=48, last 2 years) | |
| Asus ZenBook 13 UM325S | |
| Lenovo ThinkBook 13s G3 20YA0005GE | |
| Asus Zenbook 14X UX5400E | |
| Dell XPS 13 9305 Core i5 FHD | |
| Acer Swift 3 SF314-511-54ZK | |
| Average Intel Core i5-1135G7 (3475 - 5472, n=58) | |
| Geekbench 5.5 / Single-Core | |
| Average of class Subnotebook (726 - 2224, n=48, last 2 years) | |
| Asus Zenbook 14X UX5400E | |
| Asus ZenBook 13 UM325S | |
| Lenovo ThinkBook 13s G3 20YA0005GE | |
| Acer Swift 3 SF314-511-54ZK | |
| Average Intel Core i5-1135G7 (1147 - 1428, n=58) | |
| Dell XPS 13 9305 Core i5 FHD | |
| HWBOT x265 Benchmark v2.2 / 4k Preset | |
| Average of class Subnotebook (0.97 - 25.1, n=57, last 2 years) | |
| Asus ZenBook 13 UM325S | |
| Lenovo ThinkBook 13s G3 20YA0005GE | |
| Acer Swift 3 SF314-511-54ZK | |
| Asus Zenbook 14X UX5400E | |
| Average Intel Core i5-1135G7 (3.57 - 7.6, n=57) | |
| LibreOffice / 20 Documents To PDF | |
| Dell XPS 13 9305 Core i5 FHD | |
| Average of class Subnotebook (39.9 - 220, n=56, last 2 years) | |
| Asus ZenBook 13 UM325S | |
| Acer Swift 3 SF314-511-54ZK | |
| Average Intel Core i5-1135G7 (44.2 - 62.9, n=60) | |
| Asus Zenbook 14X UX5400E | |
| Lenovo ThinkBook 13s G3 20YA0005GE | |
| R Benchmark 2.5 / Overall mean | |
| Dell XPS 13 9305 Core i5 FHD | |
| Average Intel Core i5-1135G7 (0.619 - 0.727, n=59) | |
| Acer Swift 3 SF314-511-54ZK | |
| Asus Zenbook 14X UX5400E | |
| Lenovo ThinkBook 13s G3 20YA0005GE | |
| Asus ZenBook 13 UM325S | |
| Average of class Subnotebook (0.4024 - 1.456, n=58, last 2 years) | |
* ... smaller is better
AIDA64: FP32 Ray-Trace | FPU Julia | CPU SHA3 | CPU Queen | FPU SinJulia | FPU Mandel | CPU AES | CPU ZLib | FP64 Ray-Trace | CPU PhotoWorxx
| Performance rating | |
| Lenovo ThinkBook 13s G3 20YA0005GE | |
| Average of class Subnotebook | |
| Asus Zenbook 14X UX5400E | |
| Average Intel Core i5-1135G7 | |
| Acer Swift 3 SF314-511-54ZK | |
| AIDA64 / FP32 Ray-Trace | |
| Average of class Subnotebook (1135 - 32888, n=58, last 2 years) | |
| Lenovo ThinkBook 13s G3 20YA0005GE | |
| Asus Zenbook 14X UX5400E | |
| Acer Swift 3 SF314-511-54ZK | |
| Average Intel Core i5-1135G7 (4313 - 7952, n=45) | |
| AIDA64 / FPU Julia | |
| Lenovo ThinkBook 13s G3 20YA0005GE | |
| Average of class Subnotebook (5218 - 123315, n=58, last 2 years) | |
| Asus Zenbook 14X UX5400E | |
| Acer Swift 3 SF314-511-54ZK | |
| Average Intel Core i5-1135G7 (19402 - 32283, n=45) | |
| AIDA64 / CPU SHA3 | |
| Average of class Subnotebook (444 - 5287, n=58, last 2 years) | |
| Lenovo ThinkBook 13s G3 20YA0005GE | |
| Asus Zenbook 14X UX5400E | |
| Acer Swift 3 SF314-511-54ZK | |
| Average Intel Core i5-1135G7 (1316 - 2172, n=45) | |
| AIDA64 / CPU Queen | |
| Lenovo ThinkBook 13s G3 20YA0005GE | |
| Average of class Subnotebook (10579 - 95002, n=51, last 2 years) | |
| Asus Zenbook 14X UX5400E | |
| Average Intel Core i5-1135G7 (39000 - 46951, n=45) | |
| Acer Swift 3 SF314-511-54ZK | |
| AIDA64 / FPU SinJulia | |
| Lenovo ThinkBook 13s G3 20YA0005GE | |
| Average of class Subnotebook (744 - 18418, n=58, last 2 years) | |
| Asus Zenbook 14X UX5400E | |
| Average Intel Core i5-1135G7 (3497 - 4445, n=45) | |
| Acer Swift 3 SF314-511-54ZK | |
| AIDA64 / FPU Mandel | |
| Lenovo ThinkBook 13s G3 20YA0005GE | |
| Average of class Subnotebook (3341 - 65433, n=58, last 2 years) | |
| Asus Zenbook 14X UX5400E | |
| Acer Swift 3 SF314-511-54ZK | |
| Average Intel Core i5-1135G7 (12569 - 19635, n=45) | |
| AIDA64 / CPU AES | |
| Lenovo ThinkBook 13s G3 20YA0005GE | |
| Asus Zenbook 14X UX5400E | |
| Average Intel Core i5-1135G7 (28988 - 67977, n=45) | |
| Average of class Subnotebook (638 - 96917, n=58, last 2 years) | |
| Acer Swift 3 SF314-511-54ZK | |
| AIDA64 / CPU ZLib | |
| Average of class Subnotebook (164.9 - 1379, n=58, last 2 years) | |
| Lenovo ThinkBook 13s G3 20YA0005GE | |
| Asus Zenbook 14X UX5400E | |
| Average Intel Core i5-1135G7 (265 - 373, n=51) | |
| Acer Swift 3 SF314-511-54ZK | |
| AIDA64 / FP64 Ray-Trace | |
| Average of class Subnotebook (610 - 17495, n=58, last 2 years) | |
| Lenovo ThinkBook 13s G3 20YA0005GE | |
| Asus Zenbook 14X UX5400E | |
| Acer Swift 3 SF314-511-54ZK | |
| Average Intel Core i5-1135G7 (2226 - 4291, n=45) | |
| AIDA64 / CPU PhotoWorxx | |
| Average of class Subnotebook (6569 - 85600, n=58, last 2 years) | |
| Acer Swift 3 SF314-511-54ZK | |
| Asus Zenbook 14X UX5400E | |
| Average Intel Core i5-1135G7 (9004 - 45366, n=45) | |
| Lenovo ThinkBook 13s G3 20YA0005GE | |
系统性能
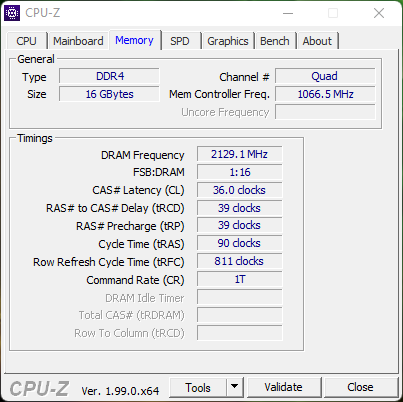
该系统运行良好且流畅。这款笔记本电脑为办公和互联网以外的应用提供了足够的性能。iGPU允许在有限范围内玩电脑游戏。PCMark基准测试结果略高于平均水平,这也是合理的,因为有四通道内存(16GB)和快速的三星SSD。
其他笔记本电脑所能达到的性能比较,可以在我们的 CPU基准测试文章.
CrossMark: Overall | Productivity | Creativity | Responsiveness
| PCMark 10 / Score | |
| Average of class Subnotebook (4920 - 9939, n=44, last 2 years) | |
| Lenovo ThinkBook 13s G3 20YA0005GE | |
| Asus ZenBook 13 UM325S | |
| Asus Zenbook 14X UX5400E | |
| Acer Swift 3X SF314-510G-70DW | |
| Acer Swift 3 SF314-511-54ZK | |
| Dell XPS 13 9305 Core i5 FHD | |
| Average Intel Core i5-1135G7, Intel Iris Xe Graphics G7 80EUs (4026 - 4952, n=53) | |
| PCMark 10 / Essentials | |
| Average of class Subnotebook (8552 - 11646, n=44, last 2 years) | |
| Lenovo ThinkBook 13s G3 20YA0005GE | |
| Acer Swift 3X SF314-510G-70DW | |
| Asus ZenBook 13 UM325S | |
| Acer Swift 3 SF314-511-54ZK | |
| Dell XPS 13 9305 Core i5 FHD | |
| Average Intel Core i5-1135G7, Intel Iris Xe Graphics G7 80EUs (8149 - 9917, n=53) | |
| Asus Zenbook 14X UX5400E | |
| PCMark 10 / Productivity | |
| Lenovo ThinkBook 13s G3 20YA0005GE | |
| Average of class Subnotebook (5435 - 16606, n=44, last 2 years) | |
| Asus ZenBook 13 UM325S | |
| Asus Zenbook 14X UX5400E | |
| Acer Swift 3X SF314-510G-70DW | |
| Acer Swift 3 SF314-511-54ZK | |
| Dell XPS 13 9305 Core i5 FHD | |
| Average Intel Core i5-1135G7, Intel Iris Xe Graphics G7 80EUs (5040 - 6619, n=53) | |
| PCMark 10 / Digital Content Creation | |
| Average of class Subnotebook (5722 - 13779, n=44, last 2 years) | |
| Lenovo ThinkBook 13s G3 20YA0005GE | |
| Asus ZenBook 13 UM325S | |
| Acer Swift 3 SF314-511-54ZK | |
| Asus Zenbook 14X UX5400E | |
| Acer Swift 3X SF314-510G-70DW | |
| Dell XPS 13 9305 Core i5 FHD | |
| Average Intel Core i5-1135G7, Intel Iris Xe Graphics G7 80EUs (3548 - 5255, n=53) | |
| CrossMark / Overall | |
| Average of class Subnotebook (365 - 2356, n=60, last 2 years) | |
| Lenovo ThinkBook 13s G3 20YA0005GE | |
| Acer Swift 3 SF314-511-54ZK | |
| Average Intel Core i5-1135G7, Intel Iris Xe Graphics G7 80EUs (1058 - 1293, n=11) | |
| CrossMark / Productivity | |
| Average of class Subnotebook (364 - 2277, n=60, last 2 years) | |
| Lenovo ThinkBook 13s G3 20YA0005GE | |
| Acer Swift 3 SF314-511-54ZK | |
| Average Intel Core i5-1135G7, Intel Iris Xe Graphics G7 80EUs (1148 - 1332, n=11) | |
| CrossMark / Creativity | |
| Average of class Subnotebook (372 - 2743, n=60, last 2 years) | |
| Lenovo ThinkBook 13s G3 20YA0005GE | |
| Acer Swift 3 SF314-511-54ZK | |
| Average Intel Core i5-1135G7, Intel Iris Xe Graphics G7 80EUs (895 - 1263, n=11) | |
| CrossMark / Responsiveness | |
| Average of class Subnotebook (312 - 1854, n=60, last 2 years) | |
| Acer Swift 3 SF314-511-54ZK | |
| Average Intel Core i5-1135G7, Intel Iris Xe Graphics G7 80EUs (923 - 1320, n=11) | |
| Lenovo ThinkBook 13s G3 20YA0005GE | |
| PCMark 10 Score | 4904 points | |
Help | ||
| AIDA64 / Memory Copy | |
| Average of class Subnotebook (14554 - 131023, n=58, last 2 years) | |
| Asus Zenbook 14X UX5400E | |
| Acer Swift 3 SF314-511-54ZK | |
| Average Intel Core i5-1135G7 (17443 - 63889, n=45) | |
| Lenovo ThinkBook 13s G3 20YA0005GE | |
| AIDA64 / Memory Read | |
| Average of class Subnotebook (15948 - 127174, n=58, last 2 years) | |
| Asus Zenbook 14X UX5400E | |
| Acer Swift 3 SF314-511-54ZK | |
| Average Intel Core i5-1135G7 (19716 - 63705, n=45) | |
| Lenovo ThinkBook 13s G3 20YA0005GE | |
| AIDA64 / Memory Write | |
| Average of class Subnotebook (15709 - 135141, n=58, last 2 years) | |
| Asus Zenbook 14X UX5400E | |
| Acer Swift 3 SF314-511-54ZK | |
| Average Intel Core i5-1135G7 (18722 - 66778, n=45) | |
| Lenovo ThinkBook 13s G3 20YA0005GE | |
| AIDA64 / Memory Latency | |
| Asus Zenbook 14X UX5400E | |
| Lenovo ThinkBook 13s G3 20YA0005GE | |
| Acer Swift 3 SF314-511-54ZK | |
| Average of class Subnotebook (6.1 - 159.9, n=56, last 2 years) | |
| Average Intel Core i5-1135G7 (68.3 - 107, n=51) | |
* ... smaller is better
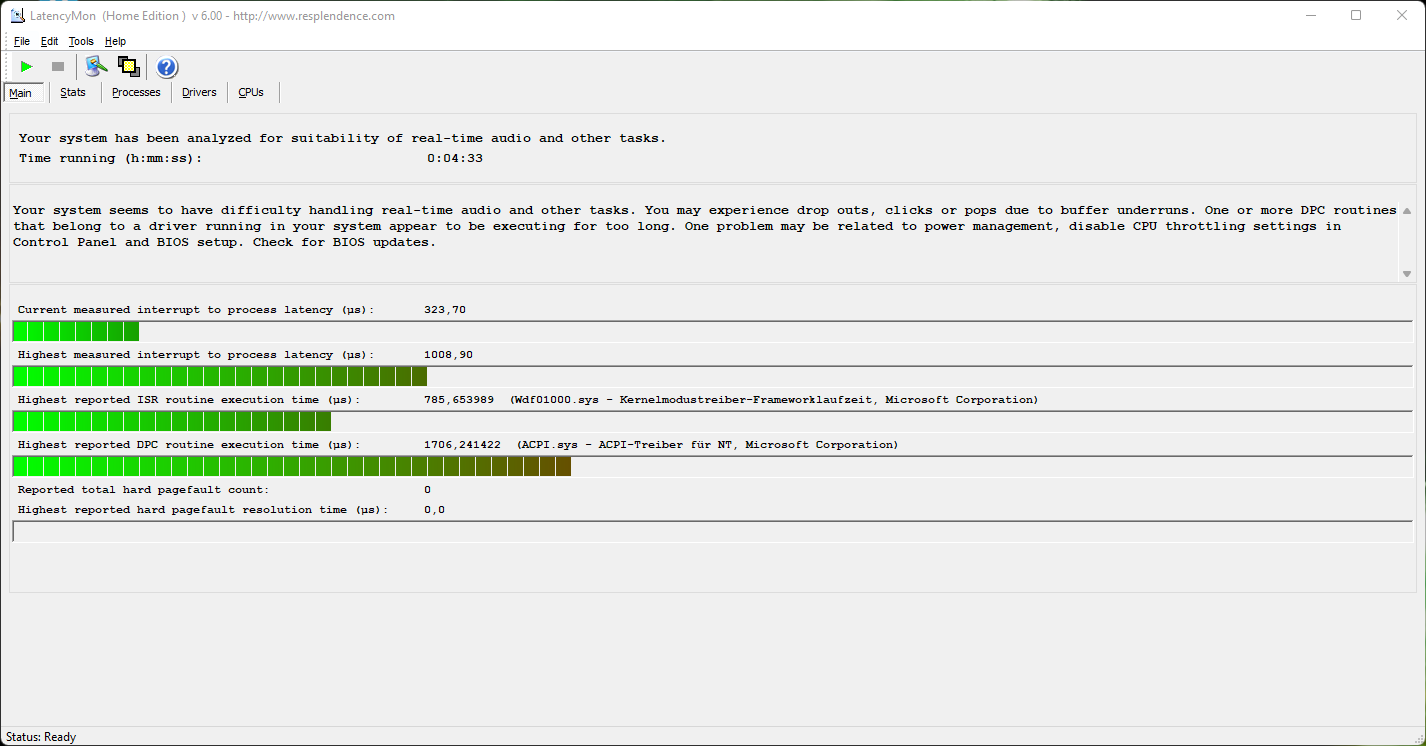
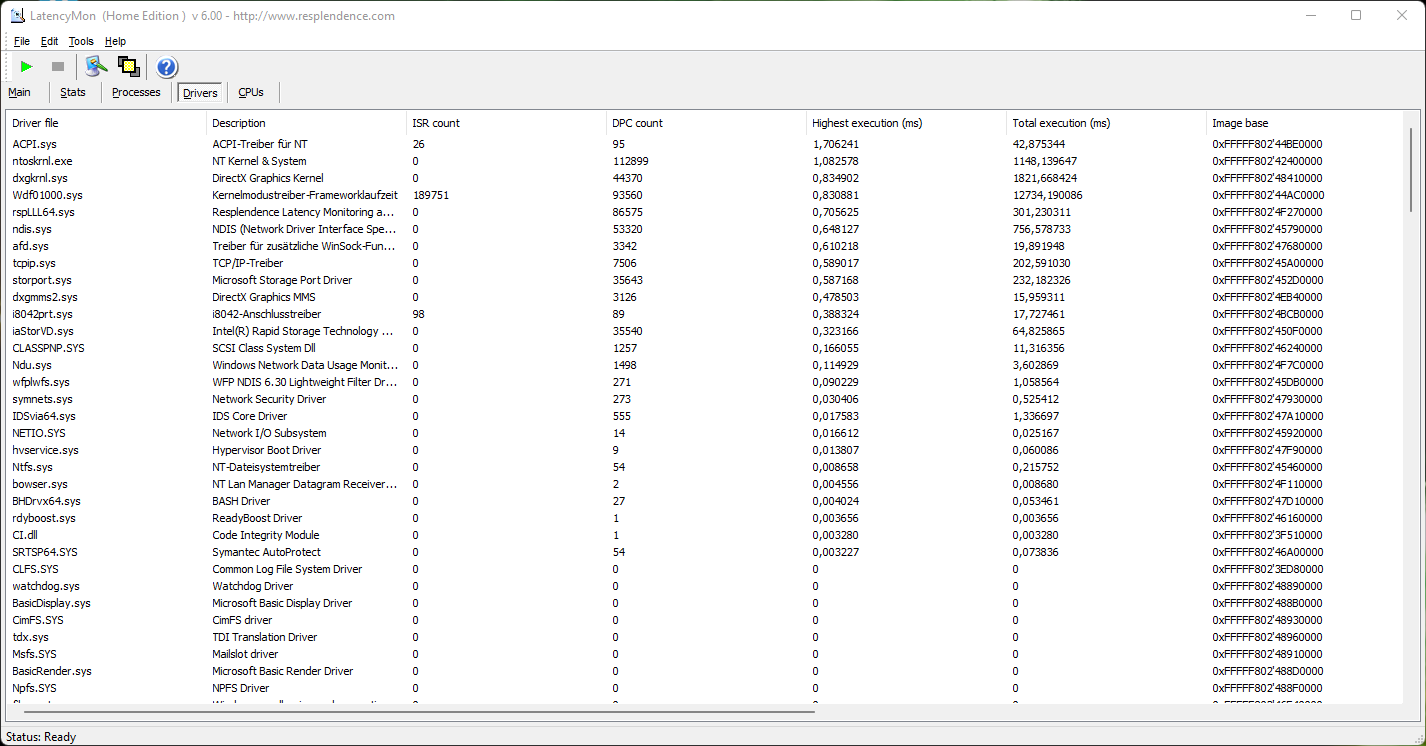
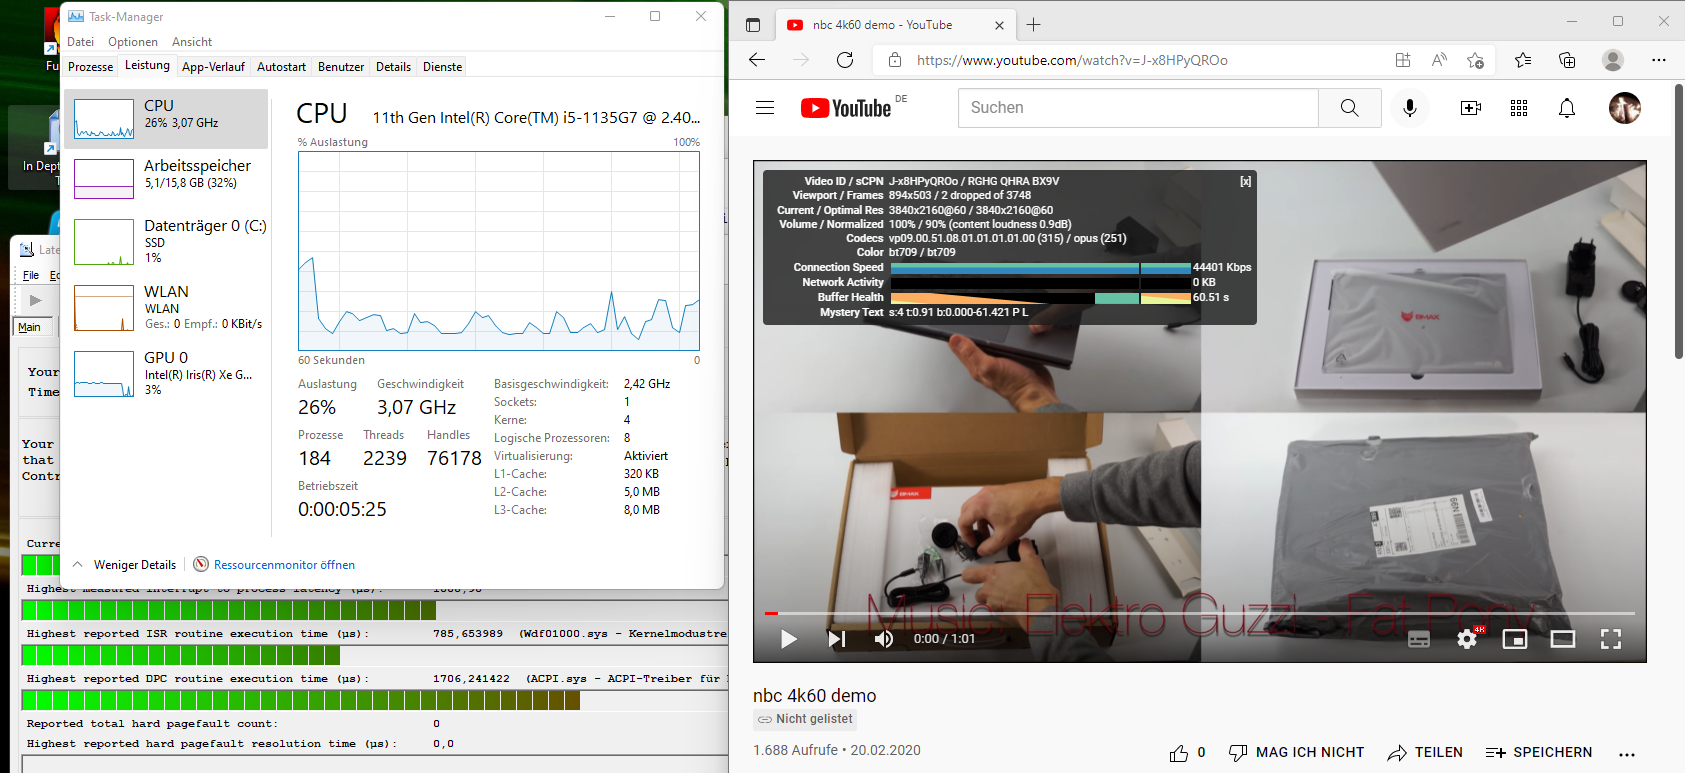
DPC延迟
在用LatencyMon进行的测试中,宏碁笔记本电脑显示出较高的延迟时间。因此,它只在有限的范围内适用于实时应用程序等。该测量是基于目前的驱动程序配置,并可能随其他驱动程序而波动。
| DPC Latencies / LatencyMon - interrupt to process latency (max), Web, Youtube, Prime95 | |
| Acer Swift 3 SF314-511-54ZK | |
| Asus Zenbook 14X UX5400E | |
| Lenovo ThinkBook 13s G3 20YA0005GE | |
| Asus ZenBook 13 UM325S | |
| Dell XPS 13 9305 Core i5 FHD | |
* ... smaller is better
储存
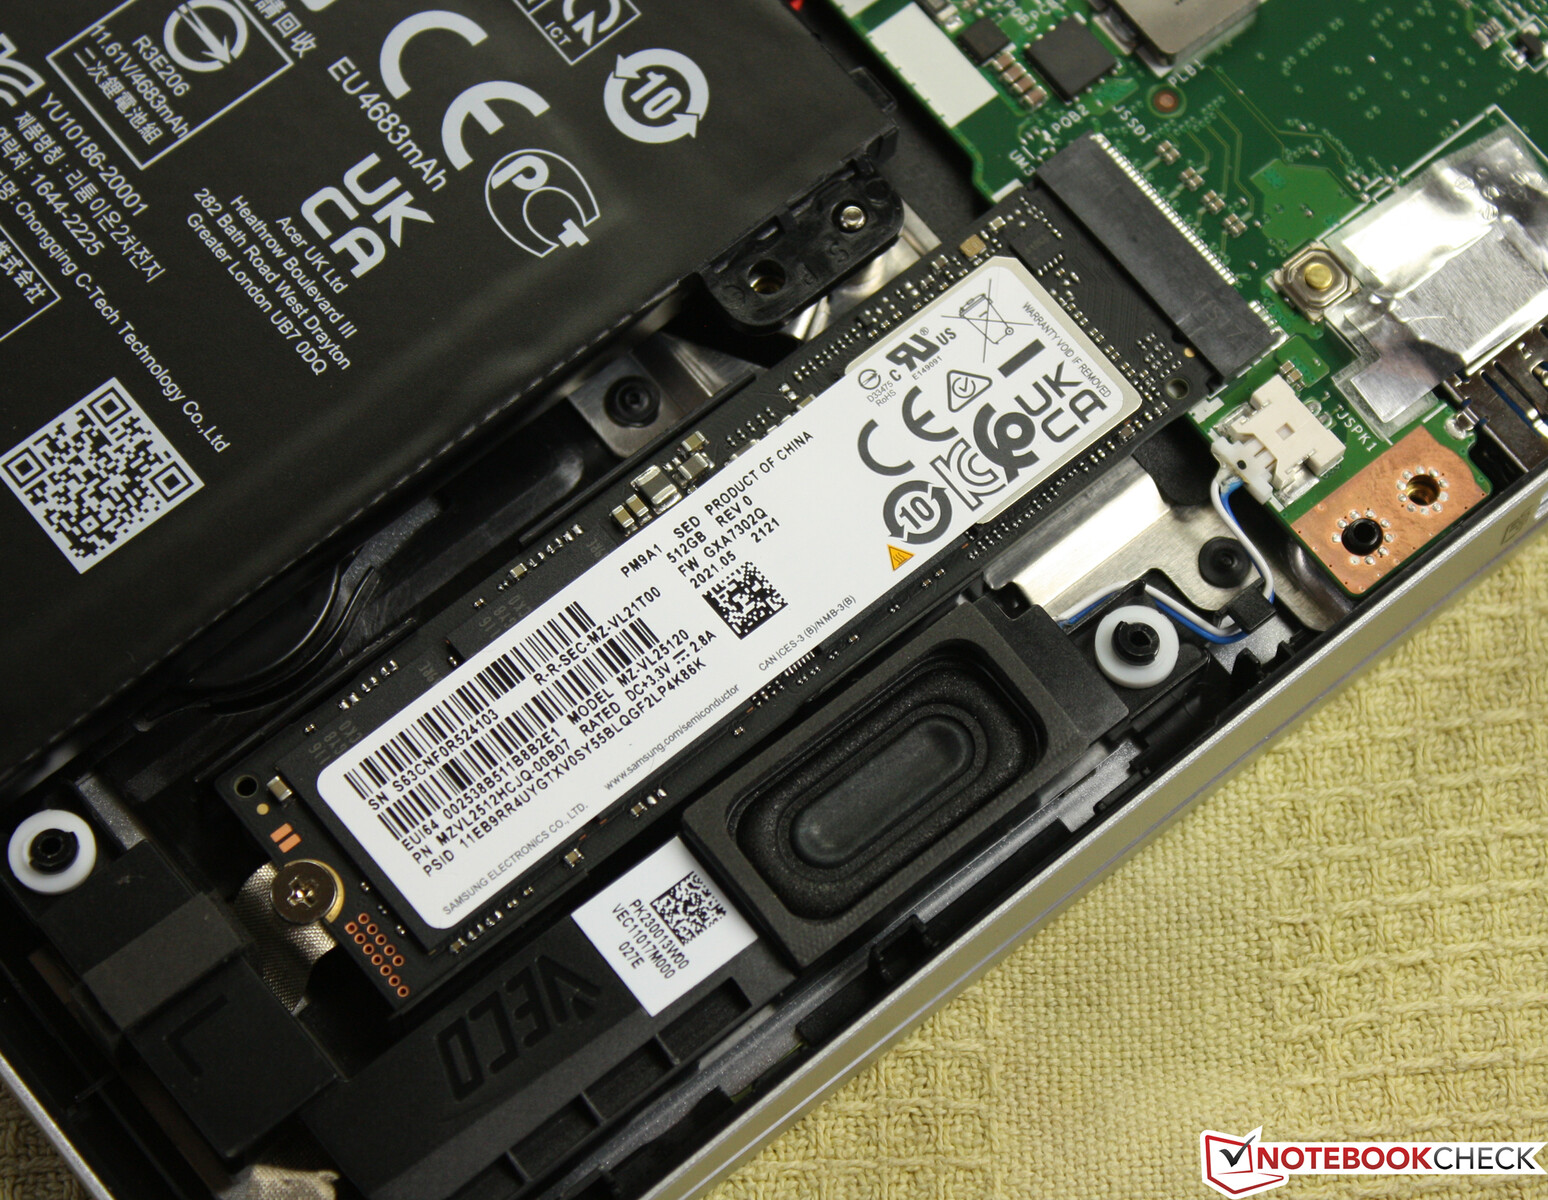
宏碁为我们的测试配置配备了一块512GB的三星固态硬盘(PM9A1 MZVL2512HCJQ),在存储基准中取得了非常好的读写速率。245GB是可用的;这相当低,也是由于较大的Windows 11的原因。
其他大容量存储设备在测试中能够达到的性能,在我们的 硬盘/SSD基准测试文章.

| Drive Performance rating - Percent | |
| Acer Swift 3 SF314-511-54ZK -1! | |
| Average Samsung PM9A1 MZVL2512HCJQ | |
| Average of class Subnotebook | |
| Asus ZenBook 13 UM325S | |
| Asus Zenbook 14X UX5400E | |
| Dell XPS 13 9305 Core i5 FHD | |
| Lenovo ThinkBook 13s G3 20YA0005GE | |
* ... smaller is better
Continuous load read: DiskSpd Read Loop, Queue Depth 8
图形卡
| 3DMark Performance rating - Percent | |
| Average of class Subnotebook | |
| Acer Swift 3X SF314-510G-70DW | |
| Asus Zenbook 14X UX5400E -1! | |
| Dell XPS 13 9305 Core i5 FHD | |
| Acer Swift 3 SF314-511-54ZK | |
| Asus ZenBook 13 UM325S | |
| Lenovo ThinkBook 13s G3 20YA0005GE | |
| Average Intel Iris Xe Graphics G7 80EUs | |
| 3DMark 11 - 1280x720 Performance GPU | |
| Average of class Subnotebook (995 - 18489, n=55, last 2 years) | |
| Acer Swift 3X SF314-510G-70DW | |
| Lenovo ThinkBook 13s G3 20YA0005GE | |
| Dell XPS 13 9305 Core i5 FHD | |
| Asus ZenBook 13 UM325S | |
| Acer Swift 3 SF314-511-54ZK | |
| Average Intel Iris Xe Graphics G7 80EUs (2246 - 6579, n=112) | |
| 3DMark | |
| 1920x1080 Fire Strike Graphics | |
| Average of class Subnotebook (832 - 16347, n=56, last 2 years) | |
| Acer Swift 3X SF314-510G-70DW | |
| Asus Zenbook 14X UX5400E | |
| Dell XPS 13 9305 Core i5 FHD | |
| Acer Swift 3 SF314-511-54ZK | |
| Asus ZenBook 13 UM325S | |
| Average Intel Iris Xe Graphics G7 80EUs (1560 - 5398, n=114) | |
| Lenovo ThinkBook 13s G3 20YA0005GE | |
| 2560x1440 Time Spy Graphics | |
| Average of class Subnotebook (804 - 6288, n=55, last 2 years) | |
| Acer Swift 3X SF314-510G-70DW | |
| Asus Zenbook 14X UX5400E | |
| Dell XPS 13 9305 Core i5 FHD | |
| Acer Swift 3 SF314-511-54ZK | |
| Average Intel Iris Xe Graphics G7 80EUs (561 - 1576, n=111) | |
| Asus ZenBook 13 UM325S | |
| Lenovo ThinkBook 13s G3 20YA0005GE | |
| 3DMark 11 Performance | 6176 points | |
| 3DMark Fire Strike Score | 4193 points | |
| 3DMark Time Spy Score | 1412 points | |
Help | ||
游戏性能
从其结构来看,内部图形单元的表现一点也不差,但它只适合于老游戏或对图形性能要求不高的游戏。为了获得流畅的游戏体验,还需要降低图形设置和较低的分辨率。
我们的GPU游戏文章显示了在其他游戏中可以预期的性能。
| The Witcher 3 | |
| 1366x768 Medium Graphics & Postprocessing | |
| Average of class Subnotebook (71 - 115, n=8, last 2 years) | |
| Acer Swift 3X SF314-510G-70DW | |
| Acer Swift 3 SF314-511-54ZK | |
| Dell XPS 13 9305 Core i5 FHD | |
| Average Intel Iris Xe Graphics G7 80EUs (21.8 - 56.9, n=103) | |
| 1920x1080 High Graphics & Postprocessing (Nvidia HairWorks Off) | |
| Average of class Subnotebook (25.6 - 64, n=13, last 2 years) | |
| Acer Swift 3X SF314-510G-70DW | |
| Asus Zenbook 14X UX5400E | |
| Lenovo ThinkBook 13s G3 20YA0005GE | |
| Average Intel Iris Xe Graphics G7 80EUs (9.3 - 33.5, n=101) | |
| Acer Swift 3 SF314-511-54ZK | |
| Dell XPS 13 9305 Core i5 FHD | |
| Dota 2 Reborn - 1920x1080 ultra (3/3) best looking | |
| Average of class Subnotebook (13 - 97, n=61, last 2 years) | |
| Acer Swift 3 SF314-511-54ZK | |
| Asus ZenBook 13 UM325S | |
| Lenovo ThinkBook 13s G3 20YA0005GE | |
| Acer Swift 3X SF314-510G-70DW | |
| Dell XPS 13 9305 Core i5 FHD | |
| Average Intel Iris Xe Graphics G7 80EUs (7.8 - 66.1, n=114) | |
| Asus Zenbook 14X UX5400E | |
| Final Fantasy XV Benchmark | |
| 1280x720 Lite Quality | |
| Average of class Subnotebook (21.4 - 129.8, n=55, last 2 years) | |
| Acer Swift 3 SF314-511-54ZK | |
| Lenovo ThinkBook 13s G3 20YA0005GE | |
| Dell XPS 13 9305 Core i5 FHD | |
| Asus ZenBook 13 UM325S | |
| Average Intel Iris Xe Graphics G7 80EUs (8.32 - 45.6, n=107) | |
| 1920x1080 Standard Quality | |
| Average of class Subnotebook (15.1 - 75.2, n=54, last 2 years) | |
| Acer Swift 3X SF314-510G-70DW | |
| Acer Swift 3 SF314-511-54ZK | |
| Dell XPS 13 9305 Core i5 FHD | |
| Lenovo ThinkBook 13s G3 20YA0005GE | |
| Average Intel Iris Xe Graphics G7 80EUs (4.47 - 25.4, n=100) | |
| Asus ZenBook 13 UM325S | |
| Strange Brigade | |
| 1920x1080 medium AA:medium AF:4 | |
| Average of class Subnotebook (29.8 - 137.5, n=50, last 2 years) | |
| Acer Swift 3X SF314-510G-70DW | |
| Acer Swift 3 SF314-511-54ZK | |
| Dell XPS 13 9305 Core i5 FHD | |
| Average Intel Iris Xe Graphics G7 80EUs (6 - 48.8, n=86) | |
| 1920x1080 high AA:high AF:8 | |
| Average of class Subnotebook (22.8 - 114.9, n=50, last 2 years) | |
| Asus Zenbook 14X UX5400E | |
| Acer Swift 3X SF314-510G-70DW | |
| Acer Swift 3 SF314-511-54ZK | |
| Dell XPS 13 9305 Core i5 FHD | |
| Average Intel Iris Xe Graphics G7 80EUs (11.4 - 34, n=83) | |
| Farming Simulator 22 | |
| 1920x1080 Medium Preset | |
| Acer Swift 3 SF314-511-54ZK | |
| Asus ZenBook 13 UM325S | |
| Average Intel Iris Xe Graphics G7 80EUs (18 - 38, n=4) | |
| 1920x1080 High Preset | |
| Acer Swift 3 SF314-511-54ZK | |
| Asus ZenBook 13 UM325S | |
| Average Intel Iris Xe Graphics G7 80EUs (20.8 - 27, n=3) | |
我们的 《巫师》帧率分析使用超强设置对我们的测试设备来说太多;这里只实现了11-14帧。然而,与其他设备的比较很好地说明了在这样一个最大的游戏场景中预期的性能下降。这Iris XeMax达到18帧,而MX 450的平均帧数为19.5帧。至少在这个压力测试中的性能几乎完全保持不变,这一点是联想ThinkBook 13s G3配备的AMD无法做到。
The Witcher 3 FPS diagram
| low | med. | high | ultra | |
|---|---|---|---|---|
| The Witcher 3 (2015) | 80 | 51 | 19.7 | 12.3 |
| Dota 2 Reborn (2015) | 101 | 92 | 58.7 | 51.7 |
| Final Fantasy XV Benchmark (2018) | 40 | 21.9 | 15.6 | |
| X-Plane 11.11 (2018) | 41.5 | 31.6 | 28.9 | |
| Far Cry 5 (2018) | 49 | 24 | 22 | |
| Strange Brigade (2018) | 82 | 35.6 | 28.3 | 23.2 |
| Farming Simulator 22 (2021) | 89 | 38 | 27 |
排放物 - 宏碁笔记本电脑可以很安静,但也很响亮
噪声排放
宏碁笔记本电脑的风扇在日常使用中很少能听到。这使得该设备非常适合于安静的环境。在负载情况下,它发出均匀的噪音,不涉及任何高频声音或类似情况。只有在连续高负荷的情况下才会达到42分贝(A)的最大值。这在办公室或娱乐场所使用时不会发生。重要的是:风扇在加载后10-15秒内恢复到耳语般的噪音。
Noise level
| Idle |
| 25 / 25 / 27.5 dB(A) |
| Load |
| 32.9 / 42 dB(A) |
 | ||
30 dB silent 40 dB(A) audible 50 dB(A) loud |
||
min: | ||
| Acer Swift 3 SF314-511-54ZK Iris Xe G7 80EUs, i5-1135G7, Samsung PM9A1 MZVL2512HCJQ | Asus ZenBook 13 UM325S Vega 8, R7 5800U, SK Hynix HFM001TD3JX013N | Dell XPS 13 9305 Core i5 FHD Iris Xe G7 80EUs, i5-1135G7, Samsung PM9A1 MZVL2512HCJQ | Lenovo ThinkBook 13s G3 20YA0005GE Vega 8, R7 5800U, WDC PC SN530 SDBPNPZ-512G | Asus Zenbook 14X UX5400E GeForce MX450, i7-1165G7, SK Hynix HFM001TD3JX013N | |
|---|---|---|---|---|---|
| Noise | -12% | 2% | -7% | -2% | |
| off / environment * (dB) | 25 | 29.6 -18% | 26 -4% | 24.7 1% | 26 -4% |
| Idle Minimum * (dB) | 25 | 30.5 -22% | 26 -4% | 24.7 1% | 26 -4% |
| Idle Average * (dB) | 25 | 30.5 -22% | 26 -4% | 27 -8% | 26 -4% |
| Idle Maximum * (dB) | 27.5 | 30.5 -11% | 26 5% | 29.8 -8% | 26.3 4% |
| Load Average * (dB) | 32.9 | 35.7 -9% | 33.5 -2% | 42.4 -29% | 37.1 -13% |
| Load Maximum * (dB) | 42 | 37.2 11% | 33.5 20% | 42.4 -1% | 38 10% |
| Witcher 3 ultra * (dB) | 33.5 | 42.4 |
* ... smaller is better
温度
根据我们的测量,宏碁笔记本电脑的表面在负载下加热到39℃(约102°F)。因此,外壳只感觉有点热,但它永远不会太热,例如放在腿上。闲置时的平均温度只有24 °C (~76 °F),金属外壳摸起来很凉。
(+) The maximum temperature on the upper side is 39.6 °C / 103 F, compared to the average of 35.9 °C / 97 F, ranging from 21.4 to 59 °C for the class Subnotebook.
(±) The bottom heats up to a maximum of 43.2 °C / 110 F, compared to the average of 39.2 °C / 103 F
(+) In idle usage, the average temperature for the upper side is 23.9 °C / 75 F, compared to the device average of 30.8 °C / 87 F.
(+) The palmrests and touchpad are reaching skin temperature as a maximum (33 °C / 91.4 F) and are therefore not hot.
(-) The average temperature of the palmrest area of similar devices was 28.2 °C / 82.8 F (-4.8 °C / -8.6 F).
| Acer Swift 3 SF314-511-54ZK Intel Core i5-1135G7, Intel Iris Xe Graphics G7 80EUs | Asus ZenBook 13 UM325S AMD Ryzen 7 5800U, AMD Radeon RX Vega 8 (Ryzen 4000/5000) | Dell XPS 13 9305 Core i5 FHD Intel Core i5-1135G7, Intel Iris Xe Graphics G7 80EUs | Lenovo ThinkBook 13s G3 20YA0005GE AMD Ryzen 7 5800U, AMD Radeon RX Vega 8 (Ryzen 4000/5000) | Asus Zenbook 14X UX5400E Intel Core i7-1165G7, NVIDIA GeForce MX450 | |
|---|---|---|---|---|---|
| Heat | -20% | -5% | 6% | -17% | |
| Maximum Upper Side * (°C) | 39.6 | 42.6 -8% | 43.5 -10% | 36.5 8% | 42.4 -7% |
| Maximum Bottom * (°C) | 43.2 | 43.6 -1% | 44.8 -4% | 39.6 8% | 47.7 -10% |
| Idle Upper Side * (°C) | 25 | 36 -44% | 26.2 -5% | 24.5 2% | 32.3 -29% |
| Idle Bottom * (°C) | 26.2 | 32.8 -25% | 26.4 -1% | 25 5% | 31.9 -22% |
* ... smaller is better
压力测试
在我们的压力测试中,内部温度上升到77℃(约171°F)。测试结束时,时钟速率为1.8 GHz,低于基本时钟速度。由于像我们的压力测试方案中的负载程度在日常使用中几乎不可能发生,所以你不会遇到由于温度过高造成的问题。单独运行Prime95也表明了这一点。在SoC温度为77℃(约171°F)的情况下,3.0GHz的时钟速率可以持续保持。
发言人
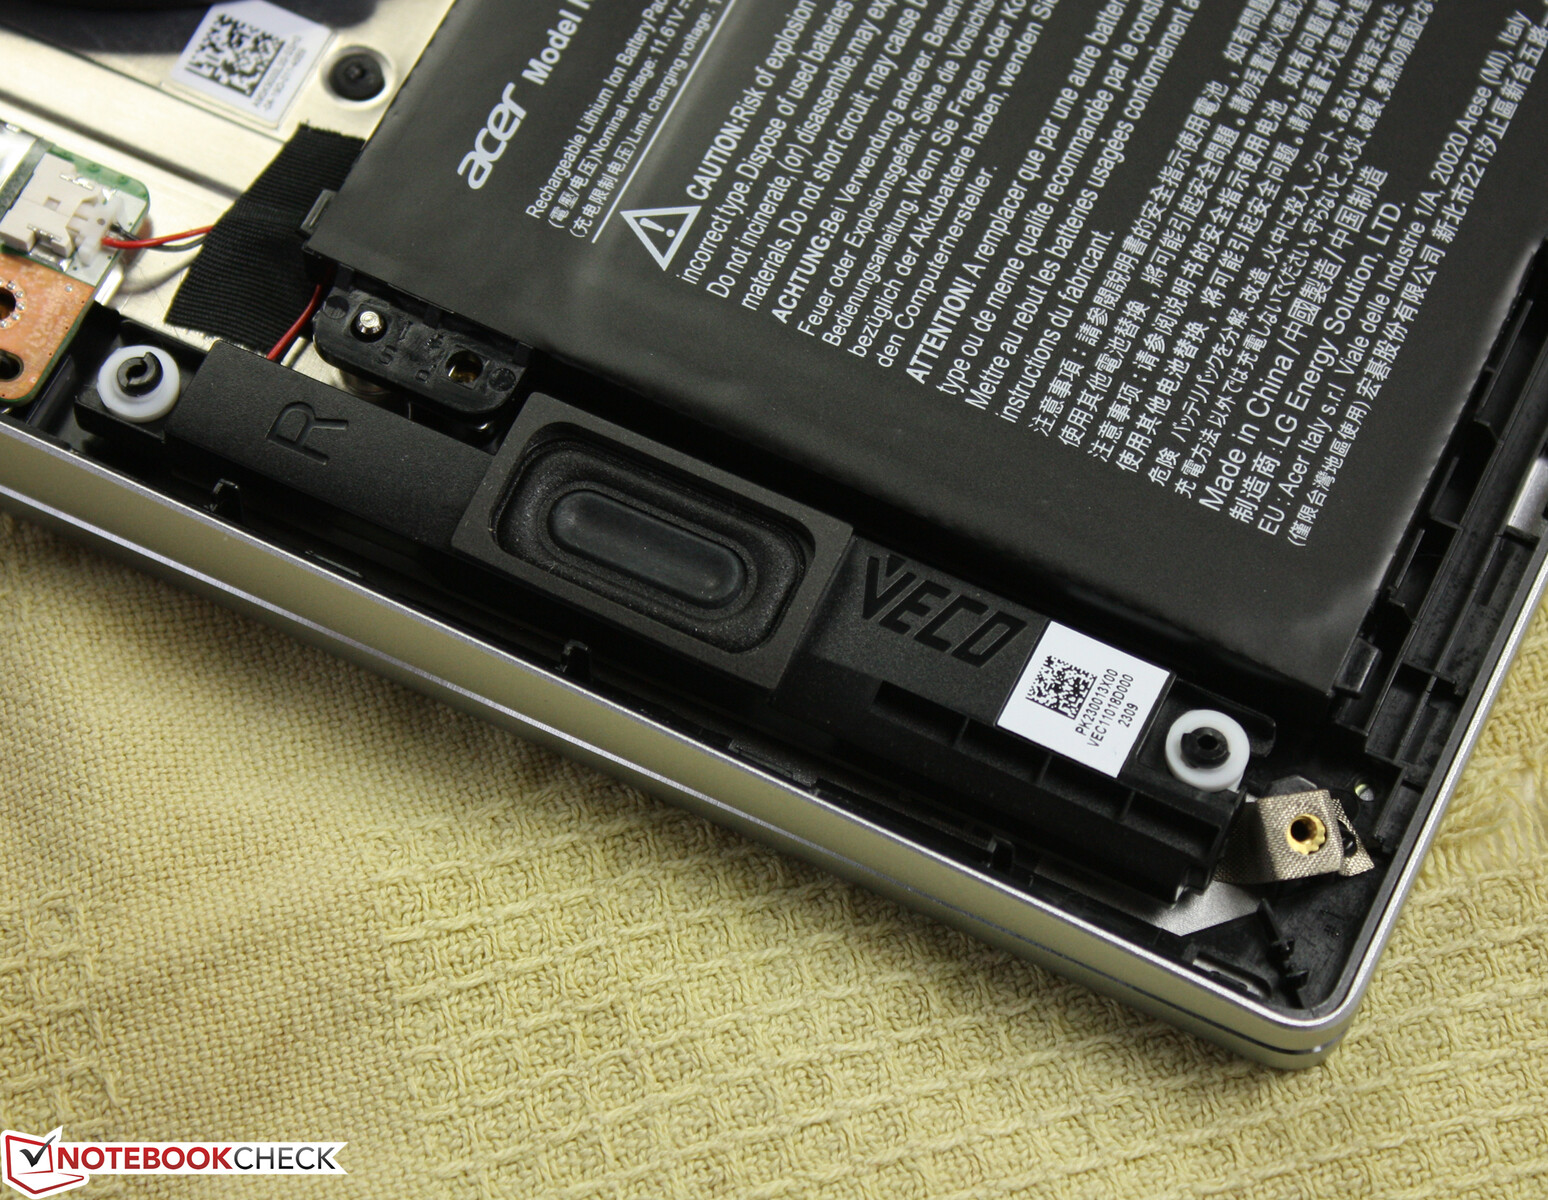
宏碁笔记本电脑的扬声器很安静,但它们提供了一个相对平衡的声谱。这使它们适合在非常安静的环境中播放媒体内容。然而,从长远来看,外部扬声器或耳机应该是首选。
宏碁运行一个软件DTS音频处理器,应该是为了改善音乐、游戏和电影的声音。你可以清楚地听到内置扬声器的效果,但它并不总是一种改进。
网络摄像头旁边的双阵列麦克风可以干净地捕捉声音,没有噪音,但当与扬声器的距离超过1.5米时,它们在水平上有困难。然而,对于在设备前举行的会议,它们绝对足够好。
Acer Swift 3 SF314-511-54ZK audio analysis
(±) | speaker loudness is average but good (74.1 dB)
Bass 100 - 315 Hz
(-) | nearly no bass - on average 31.2% lower than median
(±) | linearity of bass is average (10.8% delta to prev. frequency)
Mids 400 - 2000 Hz
(+) | balanced mids - only 4.9% away from median
(+) | mids are linear (6.3% delta to prev. frequency)
Highs 2 - 16 kHz
(+) | balanced highs - only 3.9% away from median
(±) | linearity of highs is average (8.2% delta to prev. frequency)
Overall 100 - 16.000 Hz
(±) | linearity of overall sound is average (29.2% difference to median)
Compared to same class
» 92% of all tested devices in this class were better, 1% similar, 7% worse
» The best had a delta of 5%, average was 18%, worst was 53%
Compared to all devices tested
» 87% of all tested devices were better, 2% similar, 10% worse
» The best had a delta of 4%, average was 24%, worst was 134%
Apple MacBook Pro 16 2021 M1 Pro audio analysis
(+) | speakers can play relatively loud (84.7 dB)
Bass 100 - 315 Hz
(+) | good bass - only 3.8% away from median
(+) | bass is linear (5.2% delta to prev. frequency)
Mids 400 - 2000 Hz
(+) | balanced mids - only 1.3% away from median
(+) | mids are linear (2.1% delta to prev. frequency)
Highs 2 - 16 kHz
(+) | balanced highs - only 1.9% away from median
(+) | highs are linear (2.7% delta to prev. frequency)
Overall 100 - 16.000 Hz
(+) | overall sound is linear (4.6% difference to median)
Compared to same class
» 0% of all tested devices in this class were better, 0% similar, 100% worse
» The best had a delta of 5%, average was 17%, worst was 45%
Compared to all devices tested
» 0% of all tested devices were better, 0% similar, 100% worse
» The best had a delta of 4%, average was 24%, worst was 134%
能源管理
能源消耗
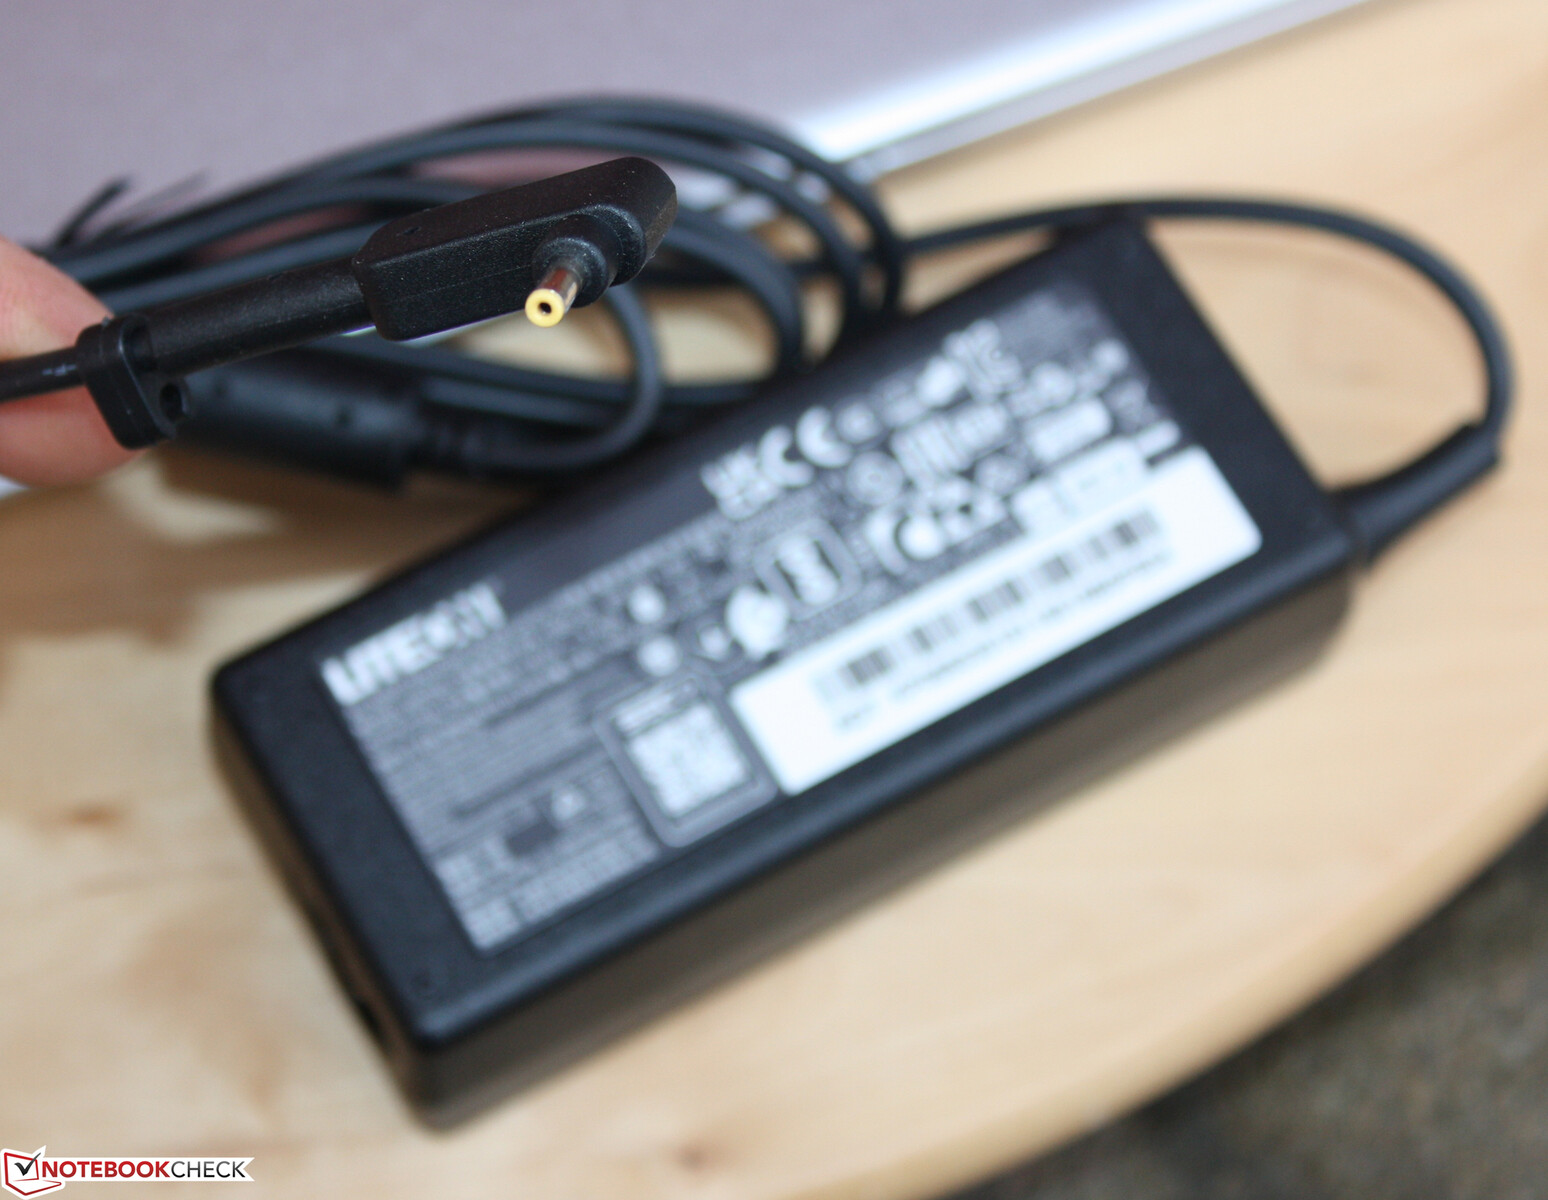
我们的测量显示,Swift 3的功耗非常低。然而,平均负载下33瓦的数值并不是测试领域中最低的。戴尔戴尔XPS 13采用相同的芯片,更加节俭,但它在CPU基准测试中的得分也较少。附带的电源适配器的输出功率为65瓦,这是一个足够高的容量,以确保可靠的电源供应。
压力测试中的功耗在不到一分钟后就显示出突然的下降(开始时系统总功耗为65瓦)。这就是PL1持续值开启28瓦的时候。其他英特尔机型也显示出类似的效果;另一方面,AMD则一直在同一水平上运行(联想ThinkBook 13s G3).
| Off / Standby | |
| Idle | |
| Load |
|
Key:
min: | |
| Acer Swift 3 SF314-511-54ZK i5-1135G7, Iris Xe G7 80EUs, Samsung PM9A1 MZVL2512HCJQ, IPS, 1920x1080, 14" | Asus ZenBook 13 UM325S R7 5800U, Vega 8, SK Hynix HFM001TD3JX013N, OLED, 1920x1080, 13.3" | Dell XPS 13 9305 Core i5 FHD i5-1135G7, Iris Xe G7 80EUs, Samsung PM9A1 MZVL2512HCJQ, IPS, 1920x1080, 13.3" | Lenovo ThinkBook 13s G3 20YA0005GE R7 5800U, Vega 8, WDC PC SN530 SDBPNPZ-512G, IPS, 1920x1200, 13.3" | Asus Zenbook 14X UX5400E i7-1165G7, GeForce MX450, SK Hynix HFM001TD3JX013N, OLED, 2880x1800, 14" | Average Intel Iris Xe Graphics G7 80EUs | Average of class Subnotebook | |
|---|---|---|---|---|---|---|---|
| Power Consumption | -22% | 7% | -14% | -56% | -4% | 0% | |
| Idle Minimum * (Watt) | 4.3 | 7.4 -72% | 3.2 26% | 5 -16% | 7.2 -67% | 4.49 ? -4% | 3.82 ? 11% |
| Idle Average * (Watt) | 6.8 | 10.4 -53% | 6.7 1% | 8.2 -21% | 10.4 -53% | 7.4 ? -9% | 6.61 ? 3% |
| Idle Maximum * (Watt) | 9 | 11.1 -23% | 10.5 -17% | 9 -0% | 11 -22% | 9.26 ? -3% | 7.99 ? 11% |
| Load Average * (Watt) | 33.3 | 35.7 -7% | 28.5 14% | 45 -35% | 61.7 -85% | 36.6 ? -10% | 41.9 ? -26% |
| Witcher 3 ultra * (Watt) | 33.3 | 28.5 14% | 45.1 -35% | 53.6 -61% | |||
| Load Maximum * (Watt) | 65 | 37.2 43% | 64 2% | 51.2 21% | 96 -48% | 61.7 ? 5% | 64.1 ? 1% |
* ... smaller is better
Energy consumption during The Witcher 3 / stress test
Energy consumption with an external monitor
电池寿命
在我们的实际Wi-Fi测试中,宏碁笔记本电脑实现了12小时的运行时间。我们使用一个脚本来模拟访问网站时引起的负载。显示屏亮度被设置为大约150cd/m²(-5级)。对于一个56Wh的电池来说,这是一个非常令人印象深刻的结果。新的Windows 11省电模式可能在其中起了一点作用。当激活时,它会阻止某些背景活动和通知。
| Acer Swift 3 SF314-511-54ZK i5-1135G7, Iris Xe G7 80EUs, 56 Wh | Asus ZenBook 13 UM325S R7 5800U, Vega 8, 67 Wh | Dell XPS 13 9305 Core i5 FHD i5-1135G7, Iris Xe G7 80EUs, 52 Wh | Lenovo ThinkBook 13s G3 20YA0005GE R7 5800U, Vega 8, 56 Wh | Asus Zenbook 14X UX5400E i7-1165G7, GeForce MX450, 63 Wh | Average of class Subnotebook | |
|---|---|---|---|---|---|---|
| Battery runtime | 17% | 2% | -9% | -30% | 1% | |
| Reader / Idle (h) | 33.6 | 23.2 -31% | 25.4 -24% | 34 1% | 28.6 ? -15% | |
| WiFi v1.3 (h) | 12.1 | 9.2 -24% | 9.2 -24% | 11 -9% | 5.4 -55% | 14 ? 16% |
| Load (h) | 1.9 | 3.9 105% | 2.9 53% | 1.2 -37% | 1.946 ? 2% | |
| H.264 (h) | 9.9 | 15.6 ? |
Pros
Cons
判决书
通过Swift 3 SF314-511,宏碁提供了一个14英寸的笔记本电脑,拥有光滑、纤细的金属底盘。后者质量高,足够结实,适合日常使用,这在700欧元(约798美元)的机型中是一个真正的加分项。一个新功能是Type-C格式的Thunderbolt 4,用于外围设备甚至是显示器(通过Type-C的DisplayPort)。不幸的是,读卡器仍然缺失,而且内存完全是板载的,所以这里没有升级选项。
IPS全高清显示屏以稳定的视角、无光泽的表面、强烈的色彩还原和良好的对比度取悦于人。最大亮度是适中的。输入设备适合日常使用,但按键的行程很小。
尽管它的尺寸很紧凑,但不必担心性能限制。与其他笔记本相比,这款14英寸的笔记本从酷睿i5中获得了更多的性能。
宏碁Swift 3 SF314-511没有全力以赴地使用其处理器,但在基准测试以及连续负载下,它从芯片中获得的性能高于平均水平。游戏性能较低,但它往往高于你将获得的 Iris Xe Graphics G7 80EUs在其他设备中获得的性能。与Iris Xe MAX的差距 Iris Xe MAX图形的差距仍然很大(20-70%),但在游戏中。
最大的亮点是12小时的实际电池寿命,这很适合1.2公斤重的14英寸机。
宏碁的14英寸笔记本价格合理,但它能满足大多数人对真正的移动笔记本的一切要求。电池寿命长,显示效果好,质量好,端口充足,重量轻,噪音和热量排放低。
价格和可用性
我们评测的宏碁Swift 3 SF314-511的确切配置,在美国写稿时有点难找。尽管如此,你可以在沃尔玛的网上商店找到一个几乎相同的产品。以599美元的折扣价(优惠100美元)找到一个几乎相同的产品;唯一的区别是内存和存储量,Walmart版本配备了8GB的内存和512GB的NVMe SSD存储。
Acer Swift 3 SF314-511-54ZK
- 02/09/2022 v7 (old)
Sebastian Jentsch
Price comparison

