三星 Galaxy A5 (2017) 智能手机简短评测

| Networking | |
| iperf3 transmit AX12 | |
| OnePlus 3T | |
| Samsung Galaxy A5 2017 | |
| Lenovo Moto Z Play | |
| Huawei Nova Plus | |
| iperf3 receive AX12 | |
| OnePlus 3T | |
| Samsung Galaxy A5 2017 | |
| Lenovo Moto Z Play | |
| Huawei Nova Plus | |


| |||||||||||||||||||||||||
Brightness Distribution: 93 %
Center on Battery: 660 cd/m²
Contrast: ∞:1 (Black: 0 cd/m²)
ΔE ColorChecker Calman: 1.6 | ∀{0.5-29.43 Ø4.71}
ΔE Greyscale Calman: 1.5 | ∀{0.09-98 Ø4.96}
Gamma: 2.28
CCT: 6422 K
| Samsung Galaxy A5 2017 Super AMOLED, 1920x1080, 5.2" | Samsung Galaxy A5 2016 Super AMOLED, 1920x1080, 5.2" | Huawei Nova Plus IPS, 1920x1080, 5.5" | ZTE Axon 7 AMOLED, 2560x1440, 5.5" | OnePlus 3T Optic-AMOLED, 1920x1080, 5.5" | Lenovo Moto Z Play AMOLED, 1920x1080, 5.5" | Honor 8 IPS, 1920x1080, 5.2" | |
|---|---|---|---|---|---|---|---|
| Screen | -21% | -102% | -137% | -206% | -34% | -150% | |
| Brightness middle (cd/m²) | 539 | 378 -30% | 485 -10% | 328 -39% | 421 -22% | 509 -6% | 451 -16% |
| Brightness (cd/m²) | 542 | 380 -30% | 481 -11% | 334 -38% | 430 -21% | 511 -6% | 443 -18% |
| Brightness Distribution (%) | 93 | 91 -2% | 90 -3% | 88 -5% | 84 -10% | 93 0% | 93 0% |
| Black Level * (cd/m²) | 0.5 | 0.4 | |||||
| Colorchecker dE 2000 * | 1.6 | 1.95 -22% | 4.2 -163% | 4.6 -187% | 7.1 -344% | 2.2 -38% | 5.4 -238% |
| Colorchecker dE 2000 max. * | 2.6 | 3.09 -19% | 7.9 -204% | 14.7 -465% | 15.3 -488% | 5.8 -123% | 9.9 -281% |
| Greyscale dE 2000 * | 1.5 | 1.86 -24% | 4.8 -220% | 2.8 -87% | 6.8 -353% | 2 -33% | 6.7 -347% |
| Gamma | 2.28 96% | 2.13 103% | 2.36 93% | 2.29 96% | 2.23 99% | 2.25 98% | 2.33 94% |
| CCT | 6422 101% | 6376 102% | 7568 86% | 6612 98% | 7866 83% | 6768 96% | 8262 79% |
| Contrast (:1) | 970 | 1128 |
* ... smaller is better
Screen Flickering / PWM (Pulse-Width Modulation)
| Screen flickering / PWM detected | 250 Hz | 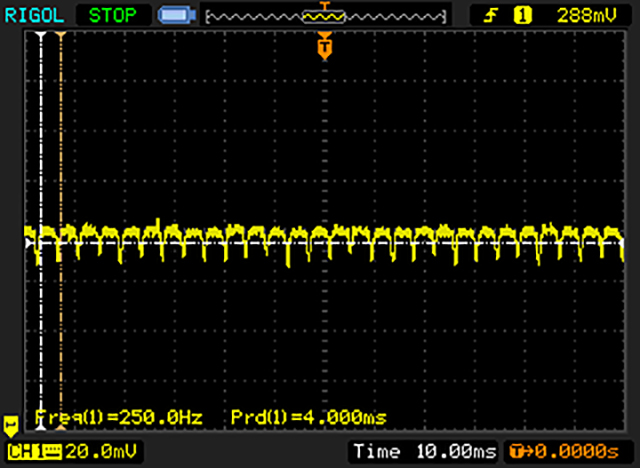 | |
The display backlight flickers at 250 Hz (worst case, e.g., utilizing PWM) . The frequency of 250 Hz is relatively low, so sensitive users will likely notice flickering and experience eyestrain at the stated brightness setting and below. In comparison: 52 % of all tested devices do not use PWM to dim the display. If PWM was detected, an average of 7754 (minimum: 5 - maximum: 343500) Hz was measured. | |||
Display Response Times
| ↔ Response Time Black to White | ||
|---|---|---|
| 3.6 ms ... rise ↗ and fall ↘ combined | ↗ 2 ms rise | 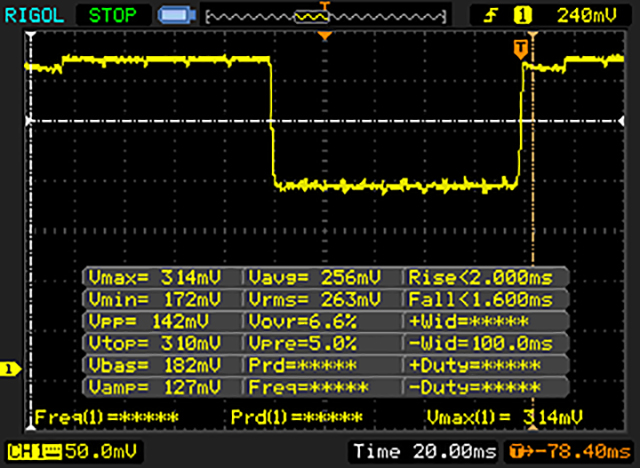 |
| ↘ 1.6 ms fall | ||
| The screen shows very fast response rates in our tests and should be very well suited for fast-paced gaming. In comparison, all tested devices range from 0.1 (minimum) to 240 (maximum) ms. » 16 % of all devices are better. This means that the measured response time is better than the average of all tested devices (19.8 ms). | ||
| ↔ Response Time 50% Grey to 80% Grey | ||
| 3.6 ms ... rise ↗ and fall ↘ combined | ↗ 2 ms rise | 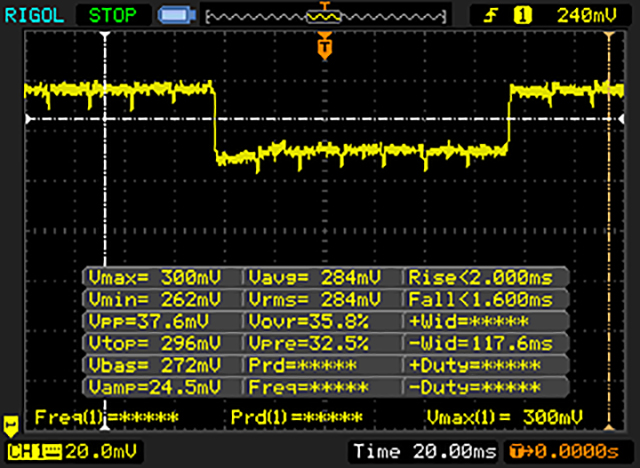 |
| ↘ 1.6 ms fall | ||
| The screen shows very fast response rates in our tests and should be very well suited for fast-paced gaming. In comparison, all tested devices range from 0.165 (minimum) to 636 (maximum) ms. » 14 % of all devices are better. This means that the measured response time is better than the average of all tested devices (31 ms). | ||
| AnTuTu v6 - Total Score (sort by value) | |
| Samsung Galaxy A5 2017 | |
| Samsung Galaxy A5 2016 | |
| Huawei Nova Plus | |
| Lenovo Moto Z Play | |
| Honor 8 | |
| ZTE Axon 7 | |
| OnePlus 3T | |
| Geekbench 4.0 | |
| 64 Bit Single-Core Score (sort by value) | |
| Samsung Galaxy A5 2017 | |
| Huawei Nova Plus | |
| Lenovo Moto Z Play | |
| Honor 8 | |
| ZTE Axon 7 | |
| OnePlus 3T | |
| 64 Bit Multi-Core Score (sort by value) | |
| Samsung Galaxy A5 2017 | |
| Huawei Nova Plus | |
| Lenovo Moto Z Play | |
| Honor 8 | |
| ZTE Axon 7 | |
| OnePlus 3T | |
| GFXBench (DX / GLBenchmark) 2.7 | |
| T-Rex Onscreen (sort by value) | |
| Samsung Galaxy A5 2017 | |
| Samsung Galaxy A5 2016 | |
| Huawei Nova Plus | |
| Lenovo Moto Z Play | |
| Honor 8 | |
| ZTE Axon 7 | |
| OnePlus 3T | |
| 1920x1080 T-Rex Offscreen (sort by value) | |
| Samsung Galaxy A5 2017 | |
| Samsung Galaxy A5 2016 | |
| Huawei Nova Plus | |
| Lenovo Moto Z Play | |
| Honor 8 | |
| ZTE Axon 7 | |
| OnePlus 3T | |
| GFXBench 3.0 | |
| on screen Manhattan Onscreen OGL (sort by value) | |
| Samsung Galaxy A5 2017 | |
| Samsung Galaxy A5 2016 | |
| Huawei Nova Plus | |
| Lenovo Moto Z Play | |
| Honor 8 | |
| ZTE Axon 7 | |
| OnePlus 3T | |
| 1920x1080 1080p Manhattan Offscreen (sort by value) | |
| Samsung Galaxy A5 2017 | |
| Samsung Galaxy A5 2016 | |
| Huawei Nova Plus | |
| Lenovo Moto Z Play | |
| Honor 8 | |
| ZTE Axon 7 | |
| OnePlus 3T | |
| GFXBench 3.1 | |
| on screen Manhattan ES 3.1 Onscreen (sort by value) | |
| Samsung Galaxy A5 2017 | |
| Huawei Nova Plus | |
| Lenovo Moto Z Play | |
| Honor 8 | |
| ZTE Axon 7 | |
| OnePlus 3T | |
| 1920x1080 Manhattan ES 3.1 Offscreen (sort by value) | |
| Samsung Galaxy A5 2017 | |
| Huawei Nova Plus | |
| Lenovo Moto Z Play | |
| Honor 8 | |
| ZTE Axon 7 | |
| OnePlus 3T | |
| PCMark for Android - Work performance score (sort by value) | |
| Samsung Galaxy A5 2017 | |
| Samsung Galaxy A5 2016 | |
| Huawei Nova Plus | |
| Lenovo Moto Z Play | |
| Honor 8 | |
| ZTE Axon 7 | |
| OnePlus 3T | |
| WebXPRT 2015 - Overall (sort by value) | |
| Samsung Galaxy A5 2017 | |
| Samsung Galaxy A5 2016 | |
| Huawei Nova Plus | |
| Lenovo Moto Z Play | |
| Honor 8 | |
| ZTE Axon 7 | |
| OnePlus 3T | |
| JetStream 1.1 - 1.1 Total (sort by value) | |
| Samsung Galaxy A5 2017 | |
| Samsung Galaxy A5 2016 | |
| Huawei Nova Plus | |
| Lenovo Moto Z Play | |
| Honor 8 | |
| ZTE Axon 7 | |
| OnePlus 3T | |
| Octane V2 - Total Score (sort by value) | |
| Samsung Galaxy A5 2017 | |
| Samsung Galaxy A5 2016 | |
| Huawei Nova Plus | |
| Lenovo Moto Z Play | |
| Honor 8 | |
| ZTE Axon 7 | |
| OnePlus 3T | |
| Mozilla Kraken 1.1 - Total (sort by value) | |
| Samsung Galaxy A5 2017 | |
| Samsung Galaxy A5 2016 | |
| Huawei Nova Plus | |
| Lenovo Moto Z Play | |
| Honor 8 | |
| ZTE Axon 7 | |
| OnePlus 3T | |
* ... smaller is better
| Samsung Galaxy A5 2017 | Samsung Galaxy A5 2016 | Huawei Nova Plus | Lenovo Moto Z Play | Honor 8 | ZTE Axon 7 | OnePlus 3T | |
|---|---|---|---|---|---|---|---|
| AndroBench 3-5 | -3% | 27% | 63% | 36% | 115% | 305% | |
| Sequential Read 256KB (MB/s) | 182 | 209.4 15% | 241.6 33% | 254.8 40% | 247.5 36% | 406.5 123% | 436.4 140% |
| Sequential Write 256KB (MB/s) | 77.1 | 60.4 -22% | 82.1 6% | 73.1 -5% | 119.3 55% | 150.9 96% | 165.3 114% |
| Random Read 4KB (MB/s) | 22.41 | 22.9 2% | 35.64 59% | 38.78 73% | 34.16 52% | 121.1 440% | 123.6 452% |
| Random Write 4KB (MB/s) | 12.13 | 11.2 -8% | 30.12 148% | 45.58 276% | 31.5 160% | 16.22 34% | 74.4 513% |
| Sequential Read 256KB SDCard (MB/s) | 73.7 | 41.64 -44% | 74.6 1% | 53.7 -27% | 78.4 6% | ||
| Sequential Write 256KB SDCard (MB/s) | 56 | 33.32 -40% | 50.6 -10% | 23.59 -58% | 51.3 -8% |
| Asphalt 8: Airborne | |||
| Settings | Value | ||
| high | 29 fps | ||
| very low | 30 fps | ||
| Dead Trigger 2 | |||
| Settings | Value | ||
| high | 30 fps | ||
(+) The maximum temperature on the upper side is 33.4 °C / 92 F, compared to the average of 35.3 °C / 96 F, ranging from 21.9 to 247 °C for the class Smartphone.
(+) The bottom heats up to a maximum of 34 °C / 93 F, compared to the average of 34 °C / 93 F
(+) In idle usage, the average temperature for the upper side is 31.1 °C / 88 F, compared to the device average of 33 °C / 91 F.
Samsung Galaxy A5 2017 audio analysis
(+) | speakers can play relatively loud (83 dB)
Bass 100 - 315 Hz
(-) | nearly no bass - on average 15.5% lower than median
(±) | linearity of bass is average (9.1% delta to prev. frequency)
Mids 400 - 2000 Hz
(±) | higher mids - on average 9.4% higher than median
(±) | linearity of mids is average (7.6% delta to prev. frequency)
Highs 2 - 16 kHz
(±) | higher highs - on average 5% higher than median
(±) | linearity of highs is average (7.6% delta to prev. frequency)
Overall 100 - 16.000 Hz
(±) | linearity of overall sound is average (23.6% difference to median)
Compared to same class
» 54% of all tested devices in this class were better, 8% similar, 38% worse
» The best had a delta of 11%, average was 34%, worst was 134%
Compared to all devices tested
» 71% of all tested devices were better, 6% similar, 23% worse
» The best had a delta of 4%, average was 23%, worst was 134%
Huawei Nova Plus audio analysis
(+) | speakers can play relatively loud (87.4 dB)
Bass 100 - 315 Hz
(-) | nearly no bass - on average 28.5% lower than median
(-) | bass is not linear (15.9% delta to prev. frequency)
Mids 400 - 2000 Hz
(+) | balanced mids - only 3.5% away from median
(+) | mids are linear (5% delta to prev. frequency)
Highs 2 - 16 kHz
(±) | higher highs - on average 5.7% higher than median
(+) | highs are linear (3.3% delta to prev. frequency)
Overall 100 - 16.000 Hz
(±) | linearity of overall sound is average (21.3% difference to median)
Compared to same class
» 41% of all tested devices in this class were better, 8% similar, 50% worse
» The best had a delta of 11%, average was 34%, worst was 134%
Compared to all devices tested
» 59% of all tested devices were better, 7% similar, 33% worse
» The best had a delta of 4%, average was 23%, worst was 134%
Lenovo Moto Z Play audio analysis
(+) | speakers can play relatively loud (88.1 dB)
Bass 100 - 315 Hz
(-) | nearly no bass - on average 28.9% lower than median
(±) | linearity of bass is average (8.3% delta to prev. frequency)
Mids 400 - 2000 Hz
(±) | reduced mids - on average 5.2% lower than median
(+) | mids are linear (4.7% delta to prev. frequency)
Highs 2 - 16 kHz
(+) | balanced highs - only 1.9% away from median
(+) | highs are linear (1.4% delta to prev. frequency)
Overall 100 - 16.000 Hz
(±) | linearity of overall sound is average (17.9% difference to median)
Compared to same class
» 16% of all tested devices in this class were better, 8% similar, 76% worse
» The best had a delta of 11%, average was 34%, worst was 134%
Compared to all devices tested
» 37% of all tested devices were better, 8% similar, 55% worse
» The best had a delta of 4%, average was 23%, worst was 134%
| Off / Standby | |
| Idle | |
| Load |
|
Key:
min: | |
| Samsung Galaxy A5 2017 3000 mAh | Samsung Galaxy A5 2016 2900 mAh | Huawei Nova Plus 3340 mAh | Lenovo Moto Z Play 3510 mAh | Honor 8 3000 mAh | ZTE Axon 7 3250 mAh | OnePlus 3T 3400 mAh | |
|---|---|---|---|---|---|---|---|
| Power Consumption | -30% | -16% | 23% | -53% | -50% | -84% | |
| Idle Minimum * (Watt) | 0.64 | 0.96 -50% | 0.49 23% | 0.51 20% | 0.78 -22% | 0.64 -0% | 0.61 5% |
| Idle Average * (Watt) | 1.36 | 1.64 -21% | 1.63 -20% | 0.87 36% | 1.89 -39% | 0.84 38% | 1.77 -30% |
| Idle Maximum * (Watt) | 1.4 | 1.71 -22% | 1.76 -26% | 0.9 36% | 2.02 -44% | 0.87 38% | 1.81 -29% |
| Load Average * (Watt) | 2.53 | 2.98 -18% | 2.98 -18% | 1.69 33% | 5.28 -109% | 6.02 -138% | 6.67 -164% |
| Load Maximum * (Watt) | 3.63 | 5.08 -40% | 4.99 -37% | 4 -10% | 5.44 -50% | 10.45 -188% | 10.98 -202% |
* ... smaller is better
| PCMark for Android - Work 2.0 battery life | |
| Samsung Galaxy A5 2017 | |
| Huawei Mate 9 | |
| Samsung Galaxy J5 2016 | |
| Samsung Galaxy S7 | |
| Samsung Galaxy A5 2017 3000 mAh | Samsung Galaxy A5 2016 2900 mAh | Huawei Nova Plus 3340 mAh | Lenovo Moto Z Play 3510 mAh | Honor 8 3000 mAh | ZTE Axon 7 3250 mAh | OnePlus 3T 3400 mAh | |
|---|---|---|---|---|---|---|---|
| Battery runtime | -15% | -17% | 16% | -43% | -39% | -35% | |
| Reader / Idle (h) | 40.3 | 38.7 -4% | 34.1 -15% | 42.3 5% | 24.8 -38% | 28.9 -28% | 23.7 -41% |
| H.264 (h) | 16.4 | 11.2 -32% | 12.2 -26% | 19.8 21% | 8.8 -46% | 11.7 -29% | 13.5 -18% |
| WiFi v1.3 (h) | 14.1 | 10.4 -26% | 13.7 -3% | 13.7 -3% | 8.3 -41% | 6.9 -51% | 8.2 -42% |
| Load (h) | 7.8 | 8.1 4% | 6.1 -22% | 10.9 40% | 4.3 -45% | 4.1 -47% | 4.7 -40% |
Pros
Cons
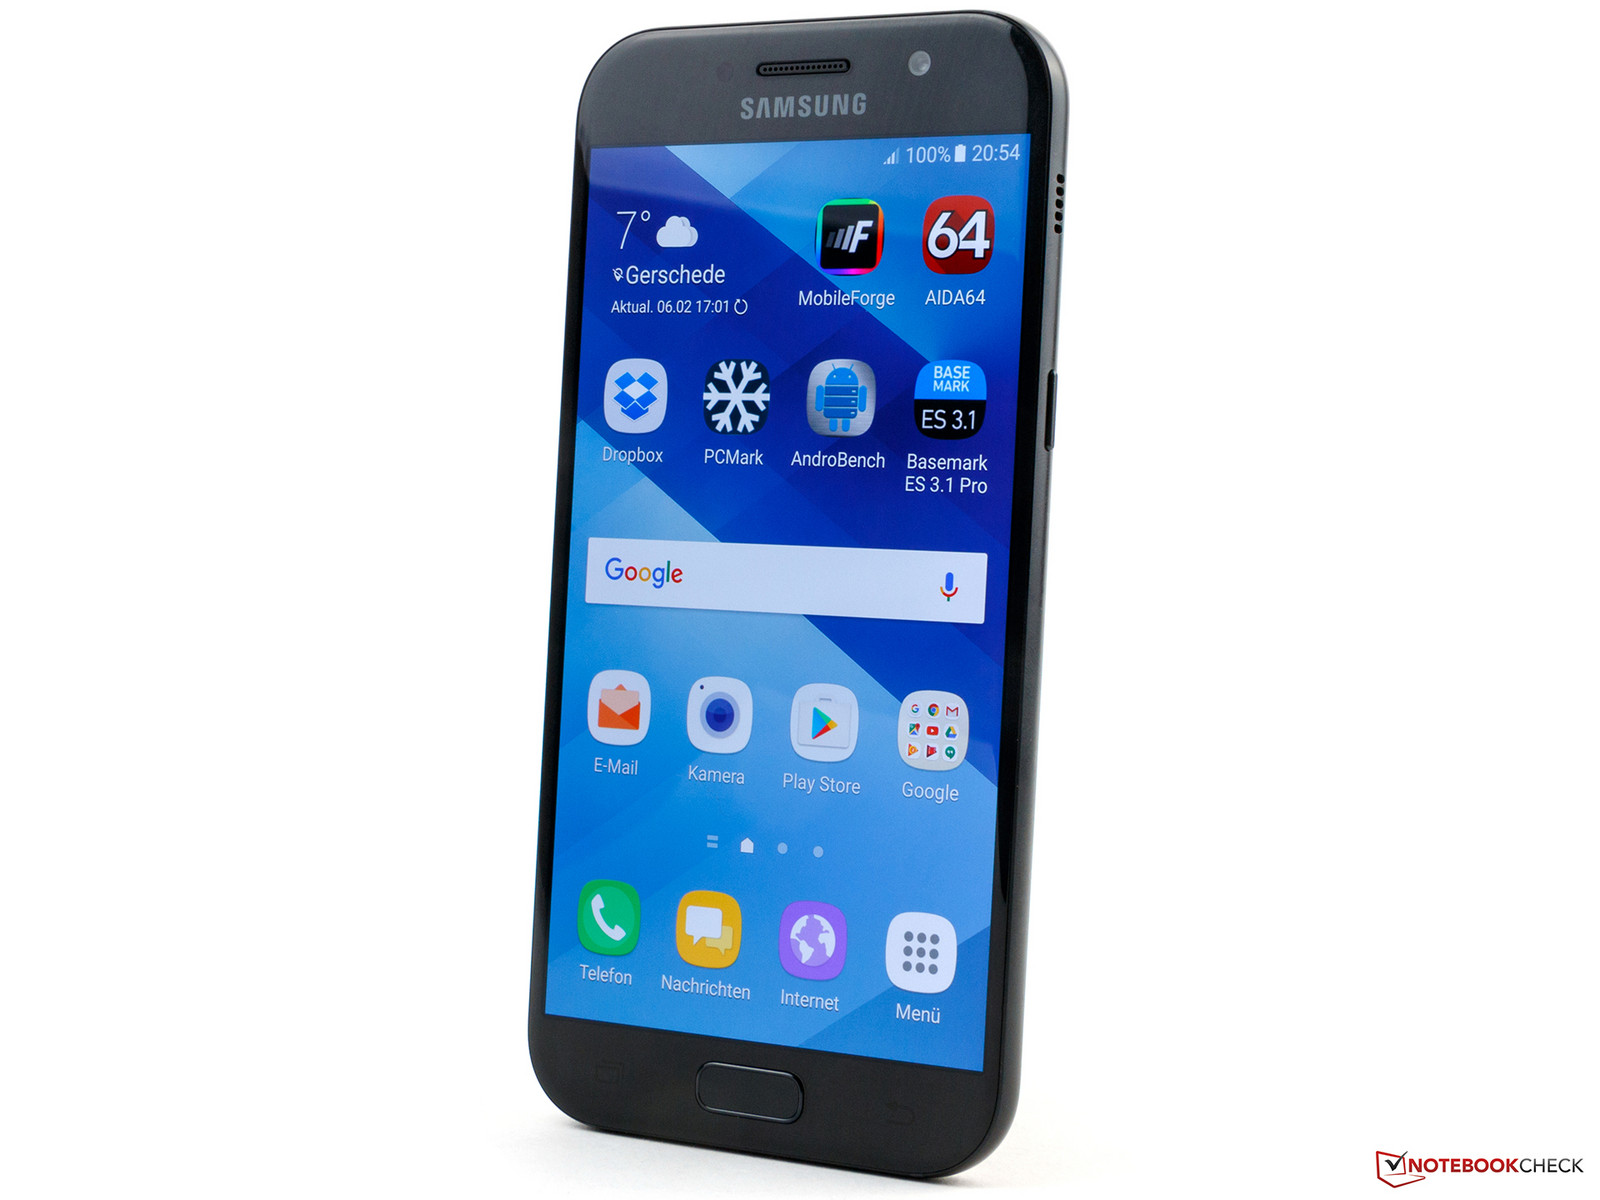
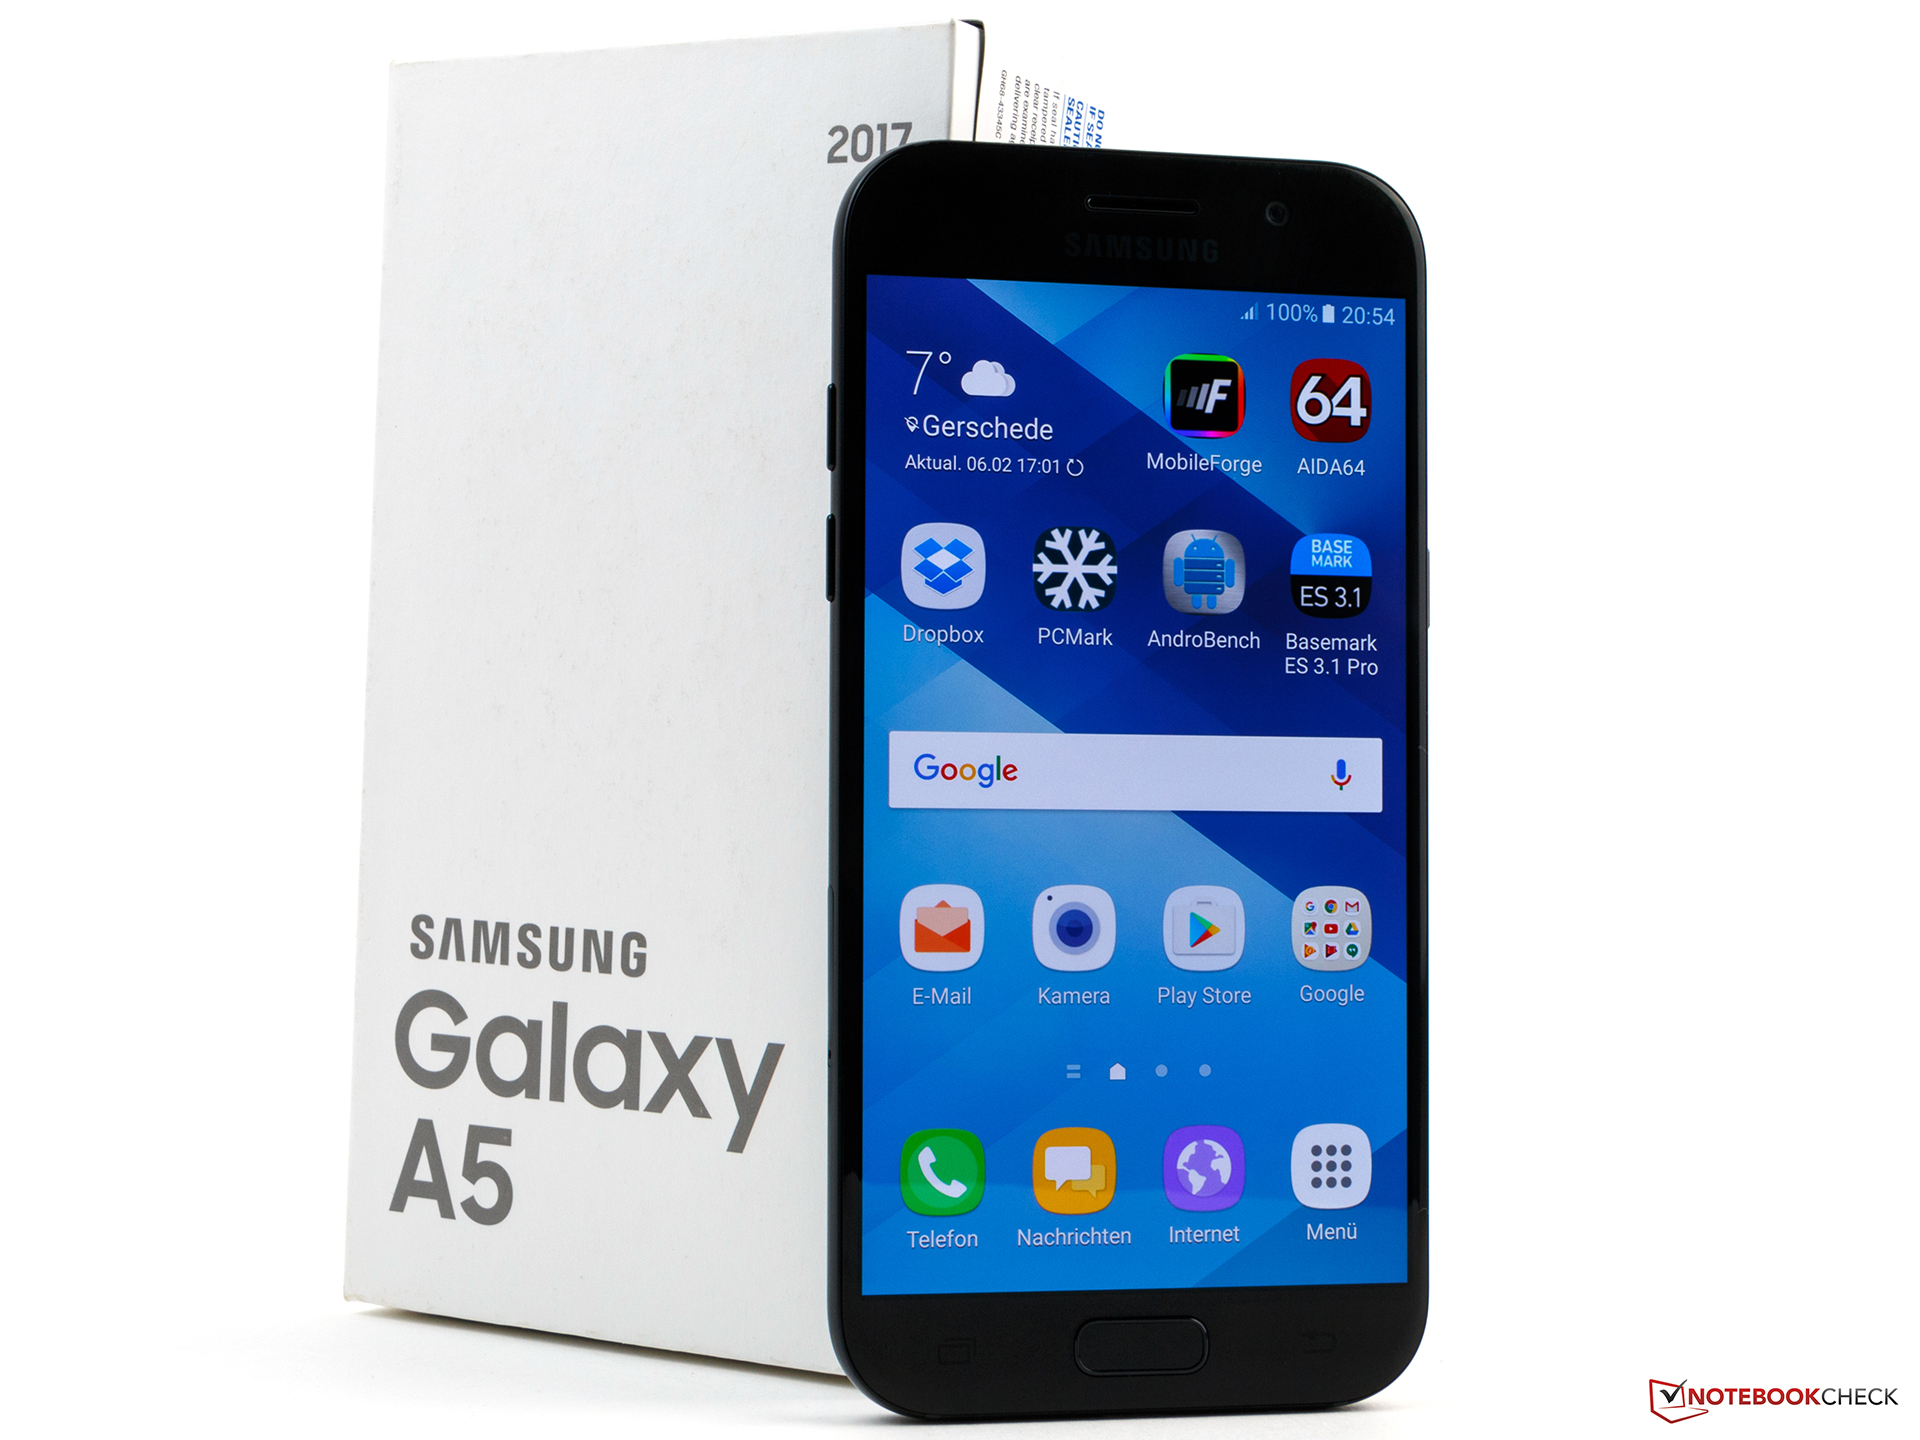
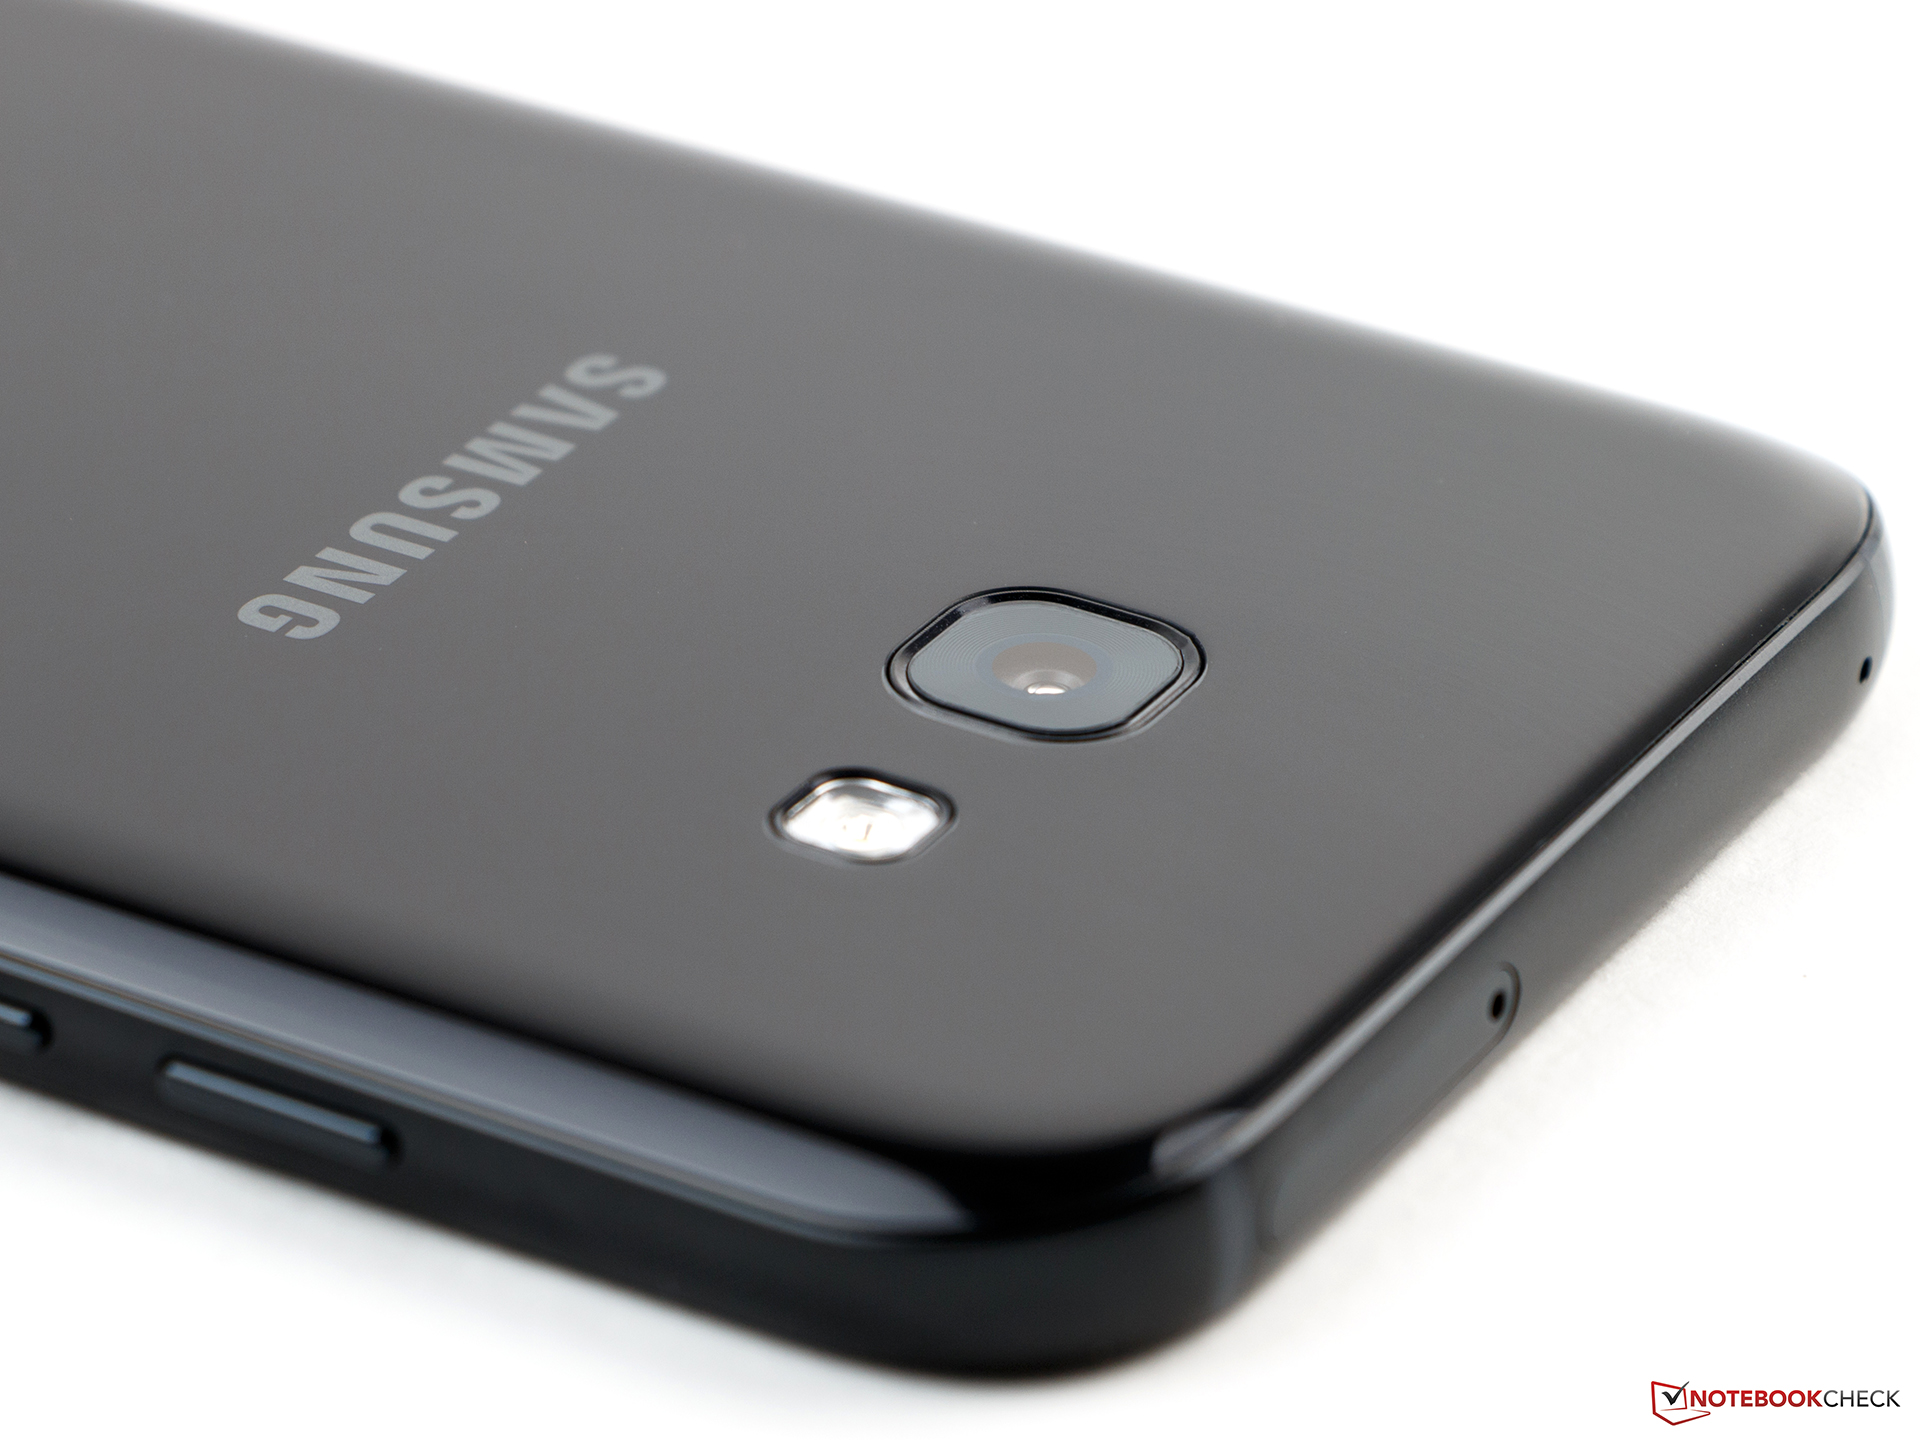
2017年的最新三星Galaxy A5 (SM-A520F)相比竞争机型丝毫不落下风——这家韩国生产商带来了一台非常优秀的智能手机。它的设计十分成功,而电池续航也很让人满意。尽管在性能水平上无法创造新纪录,不过相比其他同类产品也毫不逊色。只是它的Grace用户界面无法在所有情况下都流畅运行,不过相比前代的TouchWiz已经有所改善。它的相机尽管让我们在视频拍摄功能上略有遗憾,但照片的拍摄效果还十分不错。防尘防水的功能,与其他三星高端设备一样,在同类产品中几乎是独一无二。它的屏幕也非常绚丽。不过,对屏幕闪烁比较敏感的用户可能需要在选择这台智能手机前谨慎考虑。
三星在前代Galaxy A5的基础上做出了不小的改进,它的出色电池续航特别让我们惊喜。
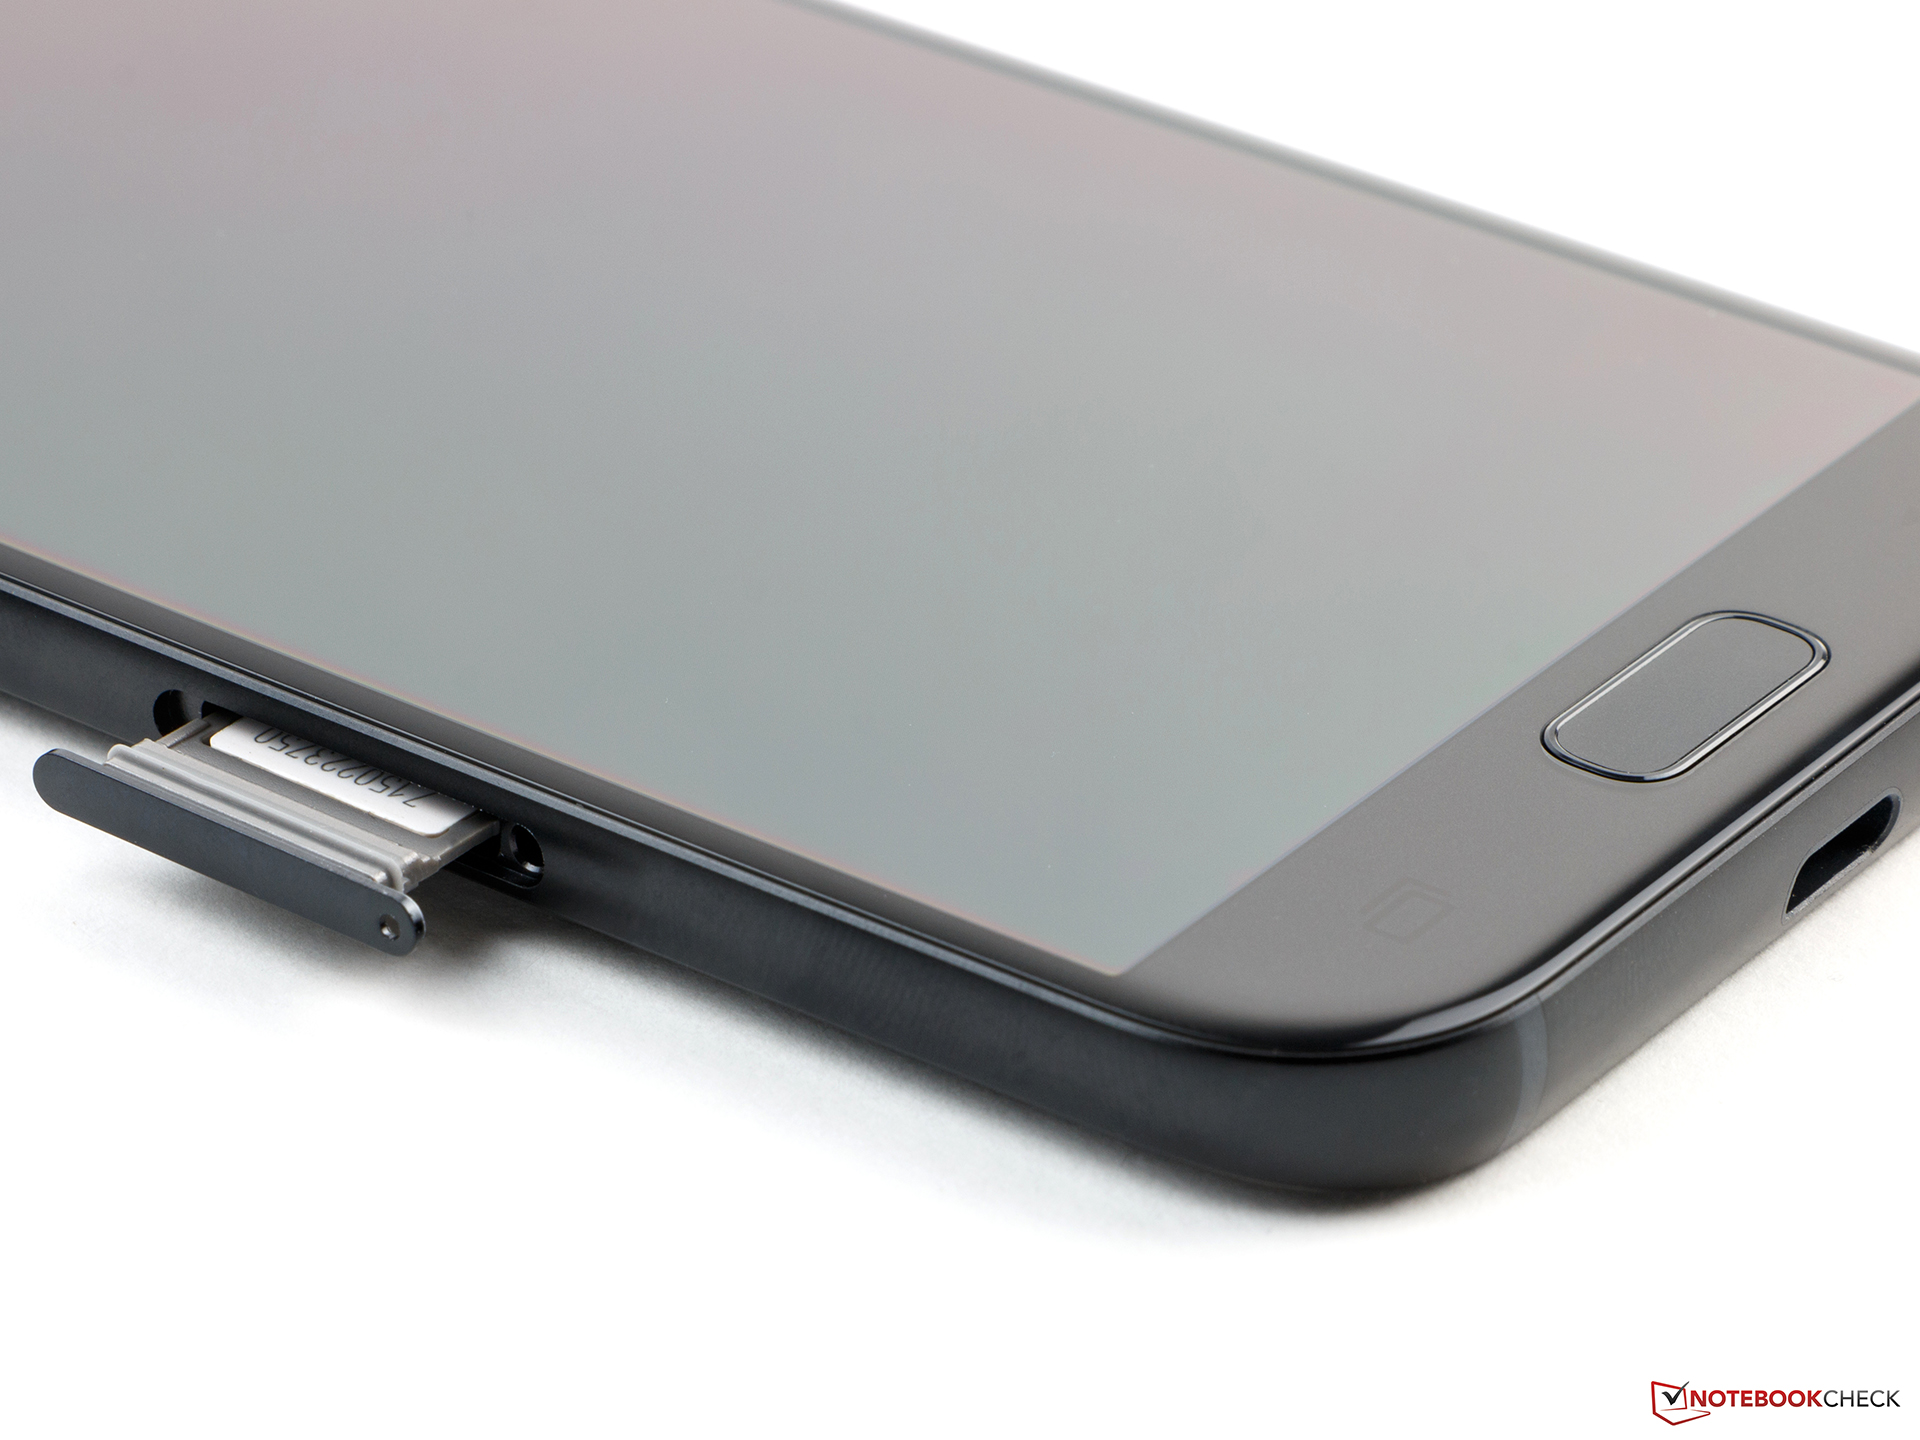
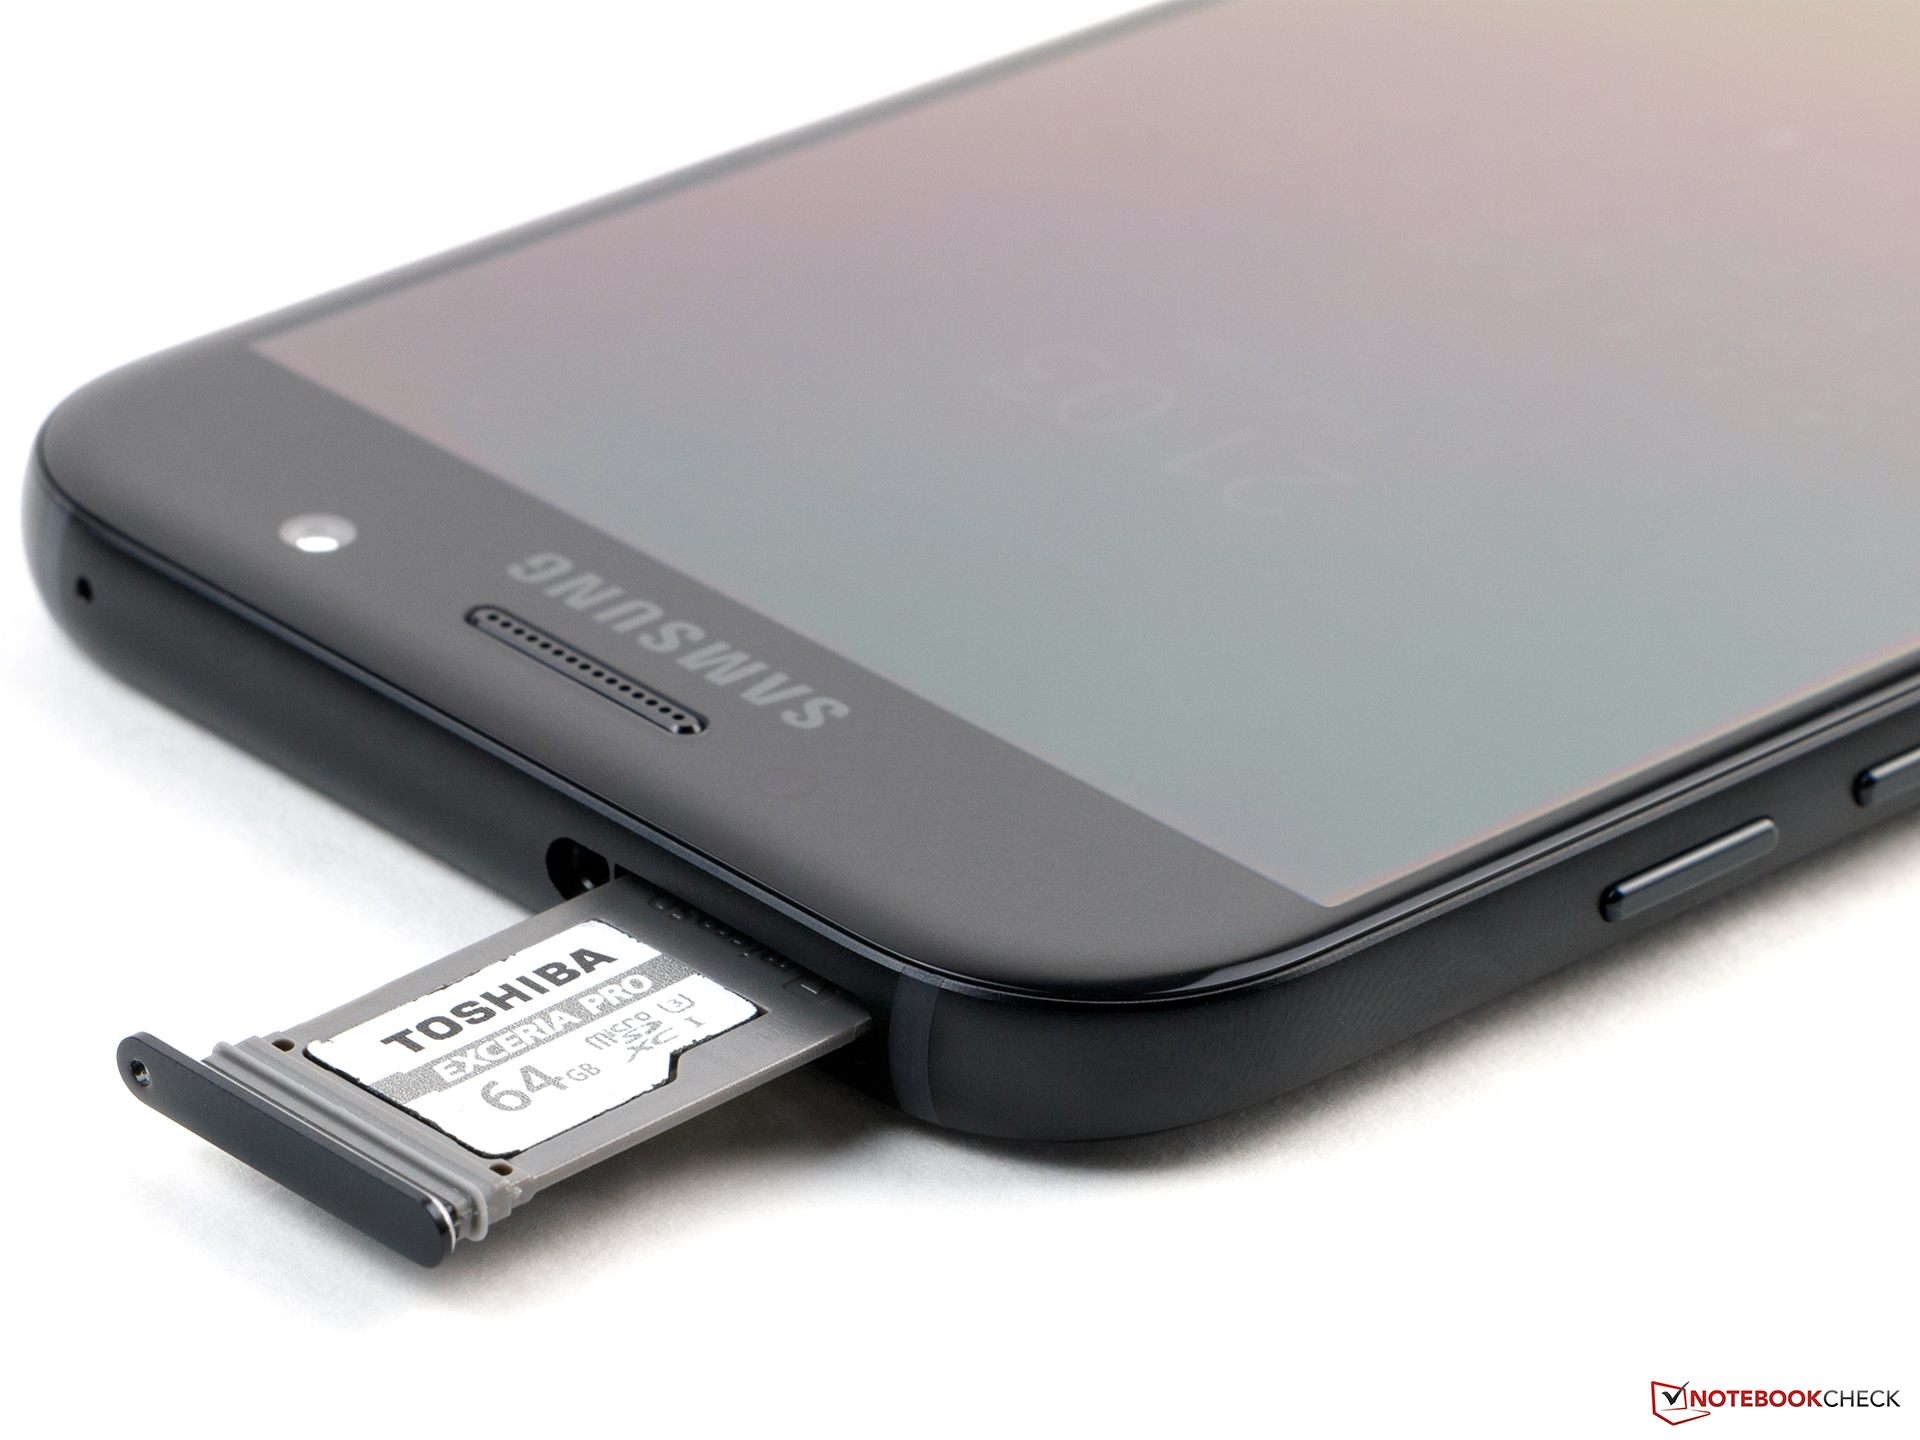
Galaxy A5 (2017)没有任何严重缺陷,不过在一些小细节如较慢的闪存,缺少对OTG和双SIM卡的支持等可能会影响一些用户的最终选择。
注:本文是基于完整评测的缩减版本,阅读完整的英文评测,请点击这里。
Samsung Galaxy A5 2017
- 02/07/2017 v6 (old)
Daniel Schmidt