三星 Galaxy A3 (2017) 智能手机简短评测
| Networking | |
| iperf3 transmit AX12 | |
| Lenovo ZUK Z2 | |
| BQ Aquaris X5 Plus | |
| Samsung Galaxy A3 2017 | |
| HTC One A9s | |
| Wiko U Feel Prime | |
| Huawei Nova | |
| iperf3 receive AX12 | |
| BQ Aquaris X5 Plus | |
| Samsung Galaxy A3 2017 | |
| Lenovo ZUK Z2 | |
| HTC One A9s | |
| Wiko U Feel Prime | |
| Huawei Nova | |

| |||||||||||||||||||||||||
Brightness Distribution: 94 %
Center on Battery: 574 cd/m²
Contrast: ∞:1 (Black: 0 cd/m²)
ΔE ColorChecker Calman: 2.4 | ∀{0.5-29.43 Ø4.71}
ΔE Greyscale Calman: 1.9 | ∀{0.09-98 Ø4.96}
Gamma: 2.09
CCT: 6502 K
| Samsung Galaxy A3 2017 Super AMOLED, 1280x720, 4.7" | BQ Aquaris X5 Plus IPS, 1920x1080, 5" | Huawei Nova IPS, 1920x1080, 5" | HTC One A9s IPS, 1280x720, 5" | Lenovo ZUK Z2 IPS, 1920x1080, 5" | Wiko U Feel Prime IPS, 1920x1080, 5" | Samsung Galaxy A3 2016 Super AMOLED, 1280x720, 4.7" | |
|---|---|---|---|---|---|---|---|
| Screen | -16% | -47% | -53% | -55% | -51% | 4% | |
| Brightness middle (cd/m²) | 574 | 640 11% | 493 -14% | 348 -39% | 512 -11% | 411 -28% | 386 -33% |
| Brightness (cd/m²) | 576 | 609 6% | 485 -16% | 320 -44% | 502 -13% | 386 -33% | 394 -32% |
| Brightness Distribution (%) | 94 | 85 -10% | 94 0% | 85 -10% | 84 -11% | 86 -9% | 88 -6% |
| Black Level * (cd/m²) | 0.93 | 0.44 | 0.23 | 0.58 | 0.36 | ||
| Colorchecker dE 2000 * | 2.4 | 2.8 -17% | 4.2 -75% | 3.5 -46% | 3.8 -58% | 4.3 -79% | 1.11 54% |
| Colorchecker dE 2000 max. * | 3.8 | 5.7 -50% | 6.6 -74% | 6.4 -68% | 11.2 -195% | 7.9 -108% | 3.35 12% |
| Greyscale dE 2000 * | 1.9 | 2.6 -37% | 3.8 -100% | 4 -111% | 2.7 -42% | 2.8 -47% | 1.34 29% |
| Gamma | 2.09 105% | 2.35 94% | 2.39 92% | 2.3 96% | 2.09 105% | 2.53 87% | 2.12 104% |
| CCT | 6502 100% | 6477 100% | 7438 87% | 6527 100% | 6076 107% | 6589 99% | 6441 101% |
| Contrast (:1) | 688 | 1120 | 1513 | 883 | 1142 |
* ... smaller is better
Screen Flickering / PWM (Pulse-Width Modulation)
| Screen flickering / PWM detected | 250 Hz | 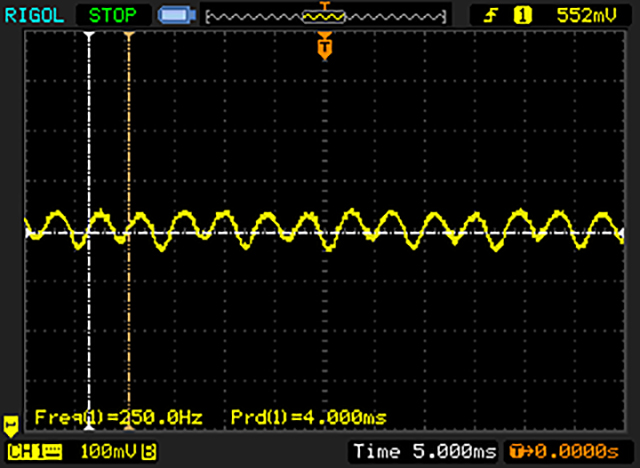 | |
The display backlight flickers at 250 Hz (worst case, e.g., utilizing PWM) . The frequency of 250 Hz is relatively low, so sensitive users will likely notice flickering and experience eyestrain at the stated brightness setting and below. In comparison: 52 % of all tested devices do not use PWM to dim the display. If PWM was detected, an average of 7757 (minimum: 5 - maximum: 343500) Hz was measured. | |||
Display Response Times
| ↔ Response Time Black to White | ||
|---|---|---|
| 6 ms ... rise ↗ and fall ↘ combined | ↗ 3 ms rise | 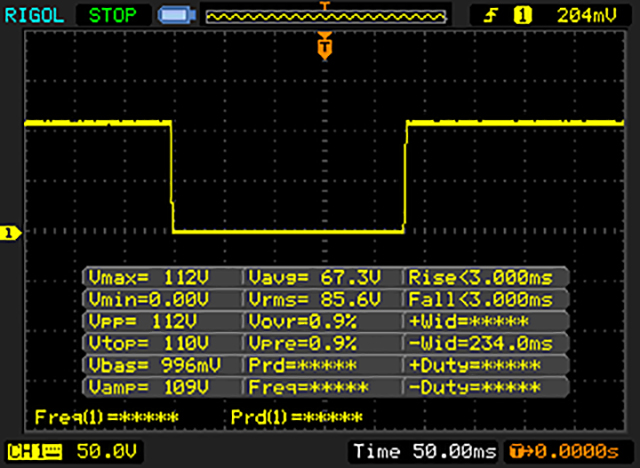 |
| ↘ 3 ms fall | ||
| The screen shows very fast response rates in our tests and should be very well suited for fast-paced gaming. In comparison, all tested devices range from 0.1 (minimum) to 240 (maximum) ms. » 19 % of all devices are better. This means that the measured response time is better than the average of all tested devices (19.8 ms). | ||
| ↔ Response Time 50% Grey to 80% Grey | ||
| 9 ms ... rise ↗ and fall ↘ combined | ↗ 5 ms rise | 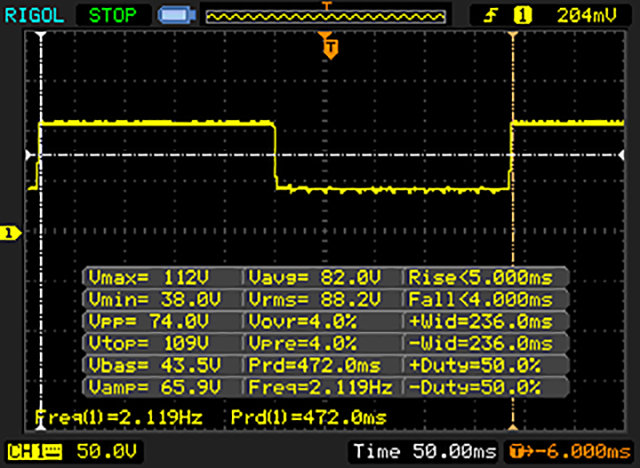 |
| ↘ 4 ms fall | ||
| The screen shows fast response rates in our tests and should be suited for gaming. In comparison, all tested devices range from 0.165 (minimum) to 636 (maximum) ms. » 23 % of all devices are better. This means that the measured response time is better than the average of all tested devices (31 ms). | ||
| AnTuTu v6 - Total Score (sort by value) | |
| Samsung Galaxy A3 2017 | |
| BQ Aquaris X5 Plus | |
| Huawei Nova | |
| HTC One A9s | |
| Lenovo ZUK Z2 | |
| Wiko U Feel Prime | |
| Samsung Galaxy A3 2016 | |
| Geekbench 4.0 | |
| 64 Bit Single-Core Score (sort by value) | |
| Samsung Galaxy A3 2017 | |
| BQ Aquaris X5 Plus | |
| Huawei Nova | |
| HTC One A9s | |
| Wiko U Feel Prime | |
| 64 Bit Multi-Core Score (sort by value) | |
| Samsung Galaxy A3 2017 | |
| BQ Aquaris X5 Plus | |
| Huawei Nova | |
| HTC One A9s | |
| Wiko U Feel Prime | |
| GFXBench (DX / GLBenchmark) 2.7 | |
| T-Rex Onscreen (sort by value) | |
| Samsung Galaxy A3 2017 | |
| BQ Aquaris X5 Plus | |
| Huawei Nova | |
| HTC One A9s | |
| Lenovo ZUK Z2 | |
| Wiko U Feel Prime | |
| Samsung Galaxy A3 2016 | |
| 1920x1080 T-Rex Offscreen (sort by value) | |
| Samsung Galaxy A3 2017 | |
| BQ Aquaris X5 Plus | |
| Huawei Nova | |
| HTC One A9s | |
| Lenovo ZUK Z2 | |
| Wiko U Feel Prime | |
| Samsung Galaxy A3 2016 | |
| GFXBench 3.0 | |
| on screen Manhattan Onscreen OGL (sort by value) | |
| Samsung Galaxy A3 2017 | |
| BQ Aquaris X5 Plus | |
| Huawei Nova | |
| HTC One A9s | |
| Lenovo ZUK Z2 | |
| Wiko U Feel Prime | |
| Samsung Galaxy A3 2016 | |
| 1920x1080 1080p Manhattan Offscreen (sort by value) | |
| Samsung Galaxy A3 2017 | |
| BQ Aquaris X5 Plus | |
| Huawei Nova | |
| HTC One A9s | |
| Lenovo ZUK Z2 | |
| Wiko U Feel Prime | |
| Samsung Galaxy A3 2016 | |
| GFXBench 3.1 | |
| on screen Manhattan ES 3.1 Onscreen (sort by value) | |
| Samsung Galaxy A3 2017 | |
| BQ Aquaris X5 Plus | |
| Huawei Nova | |
| HTC One A9s | |
| Lenovo ZUK Z2 | |
| Wiko U Feel Prime | |
| 1920x1080 Manhattan ES 3.1 Offscreen (sort by value) | |
| Samsung Galaxy A3 2017 | |
| BQ Aquaris X5 Plus | |
| Huawei Nova | |
| HTC One A9s | |
| Lenovo ZUK Z2 | |
| Wiko U Feel Prime | |
| PCMark for Android - Work performance score (sort by value) | |
| Samsung Galaxy A3 2017 | |
| BQ Aquaris X5 Plus | |
| Huawei Nova | |
| HTC One A9s | |
| Lenovo ZUK Z2 | |
| Wiko U Feel Prime | |
| Samsung Galaxy A3 2016 | |
| Octane V2 - Total Score (sort by value) | |
| Samsung Galaxy A3 2017 | |
| BQ Aquaris X5 Plus | |
| Huawei Nova | |
| HTC One A9s | |
| Lenovo ZUK Z2 | |
| Wiko U Feel Prime | |
| Samsung Galaxy A3 2016 | |
| Mozilla Kraken 1.1 - Total (sort by value) | |
| Samsung Galaxy A3 2017 | |
| BQ Aquaris X5 Plus | |
| Huawei Nova | |
| HTC One A9s | |
| Lenovo ZUK Z2 | |
| Wiko U Feel Prime | |
| Samsung Galaxy A3 2016 | |
| WebXPRT 2015 - Overall (sort by value) | |
| Samsung Galaxy A3 2017 | |
| Huawei Nova | |
| HTC One A9s | |
| Samsung Galaxy A3 2016 | |
| JetStream 1.1 - 1.1 Total (sort by value) | |
| Samsung Galaxy A3 2017 | |
| BQ Aquaris X5 Plus | |
| Huawei Nova | |
| HTC One A9s | |
| Lenovo ZUK Z2 | |
| Wiko U Feel Prime | |
| Samsung Galaxy A3 2016 | |
* ... smaller is better
| Samsung Galaxy A3 2017 Mali-T830 MP1, 7870 Octa, 16 GB eMMC Flash | BQ Aquaris X5 Plus Adreno 510, 652 MSM8976, 16 GB eMMC Flash | Huawei Nova Adreno 506, 625, 32 GB eMMC Flash | HTC One A9s Mali-T860 MP2, Helio P10 MT6755, 32 GB eMMC Flash | Lenovo ZUK Z2 Adreno 530, 820 MSM8996, 64 GB eMMC Flash | Wiko U Feel Prime Adreno 505, 430, 32 GB eMMC Flash | Samsung Galaxy A3 2016 Mali-T720 MP2, 7578, 16 GB eMMC Flash | |
|---|---|---|---|---|---|---|---|
| AndroBench 3-5 | 20% | 87% | 35% | -6% | 51% | -13% | |
| Sequential Read 256KB (MB/s) | 199.7 | 228.4 14% | 248.3 24% | 210.2 5% | 239.4 20% | 270.9 36% | 168.8 -15% |
| Sequential Write 256KB (MB/s) | 45.96 | 47.03 2% | 75 63% | 68.6 49% | 46.52 1% | 137.3 199% | 27.27 -41% |
| Random Read 4KB (MB/s) | 22.32 | 36.85 65% | 38.19 71% | 21.3 -5% | 21.27 -5% | 55 146% | 21.92 -2% |
| Random Write 4KB (MB/s) | 9.62 | 12.44 29% | 44.63 364% | 34.6 260% | 5.64 -41% | 9.4 -2% | 10.27 7% |
| Sequential Read 256KB SDCard (MB/s) | 75.5 | 73.2 -3% | 79.5 5% | 39.6 -48% | 41.98 -44% | ||
| Sequential Write 256KB SDCard (MB/s) | 50.1 | 54.9 10% | 47.69 -5% | 25.6 -49% | 35.21 -30% |
| Asphalt 8: Airborne | |||
| Settings | Value | ||
| high | 23 fps | ||
| very low | 29 fps | ||
| Dead Trigger 2 | |||
| Settings | Value | ||
| high | 52 fps | ||
(+) The maximum temperature on the upper side is 31.8 °C / 89 F, compared to the average of 35.3 °C / 96 F, ranging from 21.9 to 247 °C for the class Smartphone.
(+) The bottom heats up to a maximum of 32 °C / 90 F, compared to the average of 34 °C / 93 F
(+) In idle usage, the average temperature for the upper side is 27.3 °C / 81 F, compared to the device average of 33 °C / 91 F.
Samsung Galaxy A3 2017 audio analysis
(+) | speakers can play relatively loud (82.6 dB)
Bass 100 - 315 Hz
(-) | nearly no bass - on average 19.2% lower than median
(±) | linearity of bass is average (9.7% delta to prev. frequency)
Mids 400 - 2000 Hz
(±) | higher mids - on average 8.7% higher than median
(±) | linearity of mids is average (7.4% delta to prev. frequency)
Highs 2 - 16 kHz
(±) | higher highs - on average 5.6% higher than median
(+) | highs are linear (6.9% delta to prev. frequency)
Overall 100 - 16.000 Hz
(±) | linearity of overall sound is average (26.1% difference to median)
Compared to same class
» 66% of all tested devices in this class were better, 6% similar, 28% worse
» The best had a delta of 11%, average was 34%, worst was 134%
Compared to all devices tested
» 80% of all tested devices were better, 4% similar, 16% worse
» The best had a delta of 4%, average was 23%, worst was 134%
Samsung Galaxy A3 2016 audio analysis
(+) | speakers can play relatively loud (84.4 dB)
Bass 100 - 315 Hz
(-) | nearly no bass - on average 32.6% lower than median
(±) | linearity of bass is average (11.5% delta to prev. frequency)
Mids 400 - 2000 Hz
(+) | balanced mids - only 3.2% away from median
(+) | mids are linear (6.5% delta to prev. frequency)
Highs 2 - 16 kHz
(+) | balanced highs - only 4% away from median
(+) | highs are linear (5.5% delta to prev. frequency)
Overall 100 - 16.000 Hz
(±) | linearity of overall sound is average (22.8% difference to median)
Compared to same class
» 51% of all tested devices in this class were better, 6% similar, 43% worse
» The best had a delta of 11%, average was 34%, worst was 134%
Compared to all devices tested
» 68% of all tested devices were better, 5% similar, 27% worse
» The best had a delta of 4%, average was 23%, worst was 134%
HTC One A9s audio analysis
(+) | speakers can play relatively loud (82.6 dB)
Bass 100 - 315 Hz
(-) | nearly no bass - on average 18.2% lower than median
(±) | linearity of bass is average (13.5% delta to prev. frequency)
Mids 400 - 2000 Hz
(±) | higher mids - on average 5.4% higher than median
(+) | mids are linear (5.4% delta to prev. frequency)
Highs 2 - 16 kHz
(±) | higher highs - on average 11.7% higher than median
(±) | linearity of highs is average (8.3% delta to prev. frequency)
Overall 100 - 16.000 Hz
(±) | linearity of overall sound is average (28.6% difference to median)
Compared to same class
» 75% of all tested devices in this class were better, 4% similar, 21% worse
» The best had a delta of 11%, average was 34%, worst was 134%
Compared to all devices tested
» 86% of all tested devices were better, 3% similar, 11% worse
» The best had a delta of 4%, average was 23%, worst was 134%
| Off / Standby | |
| Idle | |
| Load |
|
Key:
min: | |
| Samsung Galaxy A3 2017 2350 mAh | BQ Aquaris X5 Plus 3200 mAh | Huawei Nova 3020 mAh | HTC One A9s 2300 mAh | Lenovo ZUK Z2 3500 mAh | Wiko U Feel Prime 3000 mAh | Samsung Galaxy A3 2016 2300 mAh | |
|---|---|---|---|---|---|---|---|
| Power Consumption | -137% | -111% | -185% | -193% | -94% | -82% | |
| Idle Minimum * (Watt) | 0.37 | 0.87 -135% | 0.61 -65% | 1.29 -249% | 1.31 -254% | 0.66 -78% | 0.96 -159% |
| Idle Average * (Watt) | 0.78 | 1.33 -71% | 1.83 -135% | 2.28 -192% | 2.03 -160% | 1.66 -113% | 1.39 -78% |
| Idle Maximum * (Watt) | 0.84 | 1.35 -61% | 1.86 -121% | 2.52 -200% | 2.08 -148% | 1.76 -110% | 1.45 -73% |
| Load Average * (Watt) | 1.52 | 5.44 -258% | 3.71 -144% | 4.06 -167% | 5.45 -259% | 2.85 -88% | 2.65 -74% |
| Load Maximum * (Watt) | 2.75 | 7.11 -159% | 5.19 -89% | 5.91 -115% | 6.75 -145% | 5.01 -82% | 3.51 -28% |
* ... smaller is better
| Samsung Galaxy A3 2017 2350 mAh | BQ Aquaris X5 Plus 3200 mAh | Huawei Nova 3020 mAh | HTC One A9s 2300 mAh | Lenovo ZUK Z2 3500 mAh | Wiko U Feel Prime 3000 mAh | Samsung Galaxy A3 2016 2300 mAh | |
|---|---|---|---|---|---|---|---|
| Battery runtime | -24% | -17% | -41% | -18% | -35% | -20% | |
| Reader / Idle (h) | 47.7 | 31.2 -35% | 25.7 -46% | 20.9 -56% | 33 -31% | ||
| H.264 (h) | 16.5 | 12 -27% | 9.8 -41% | 14.4 -13% | |||
| WiFi v1.3 (h) | 11.1 | 8.4 -24% | 14.6 32% | 8.6 -23% | 9.1 -18% | 9.6 -14% | 10.5 -5% |
| Load (h) | 8.9 | 5.5 -38% | 4.1 -54% | 6.3 -29% |
Pros
Cons
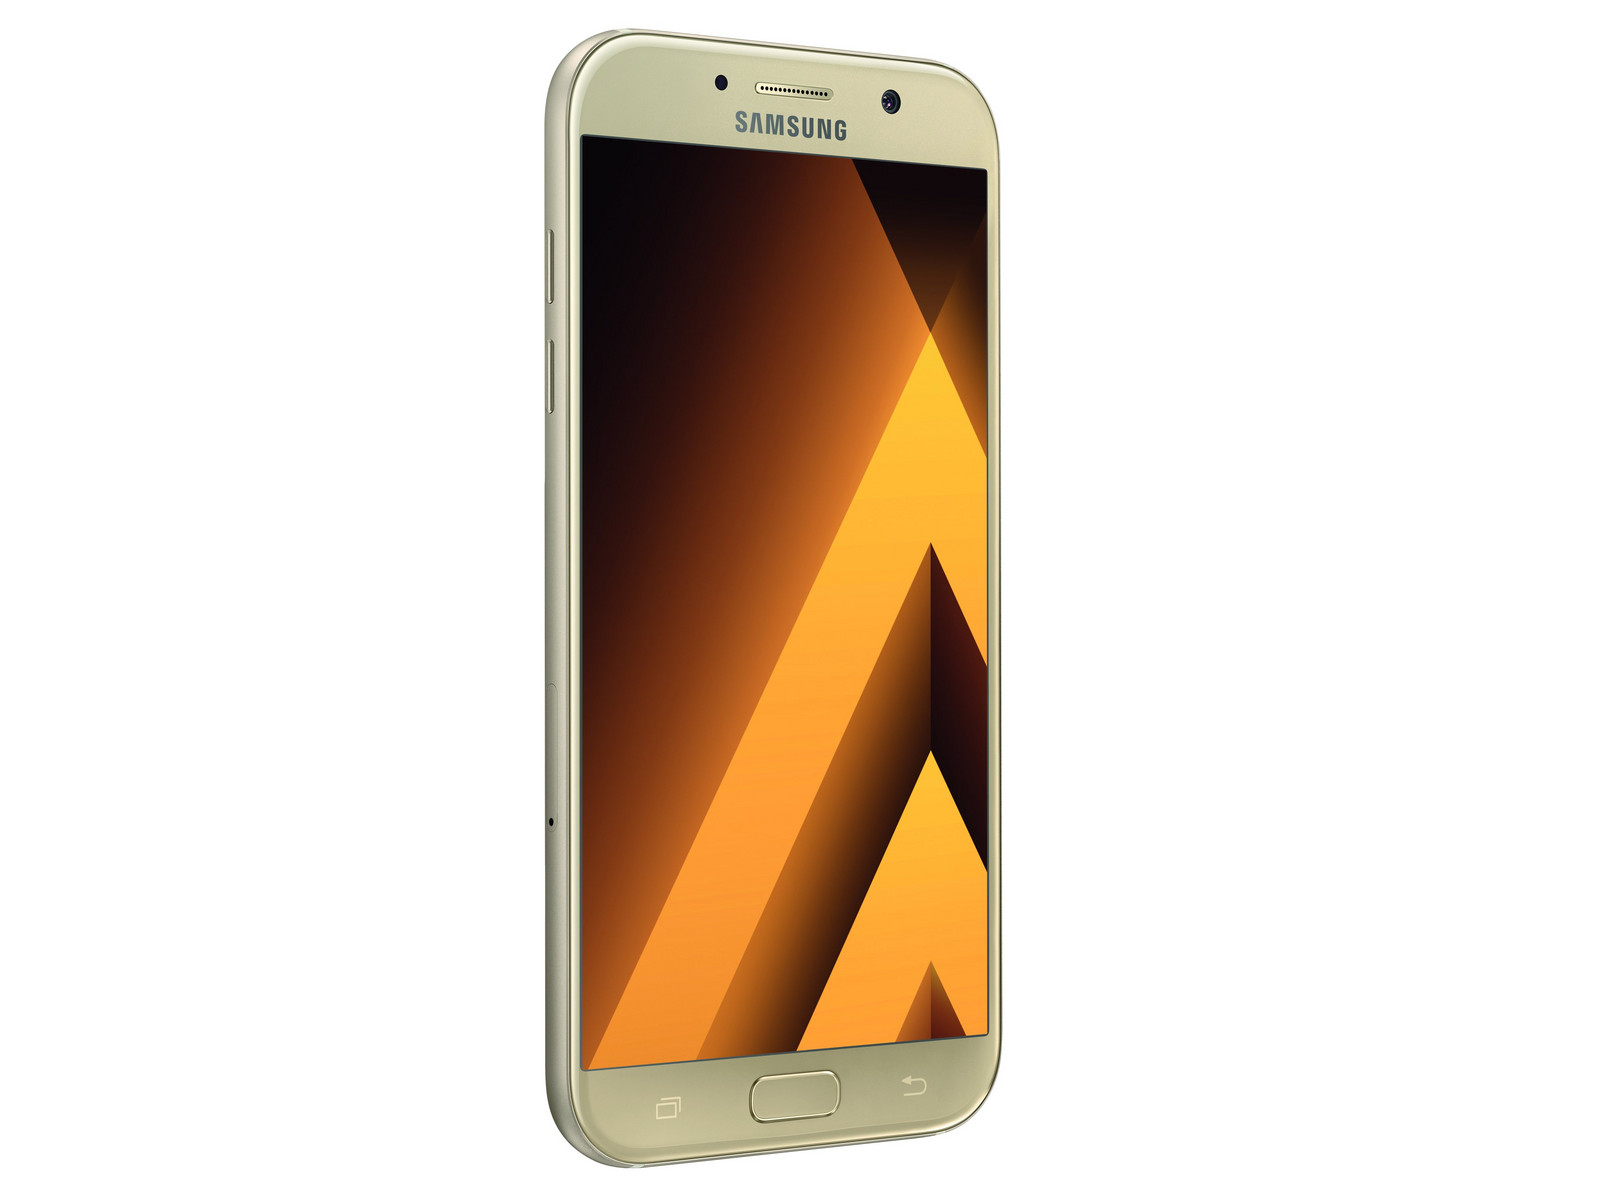
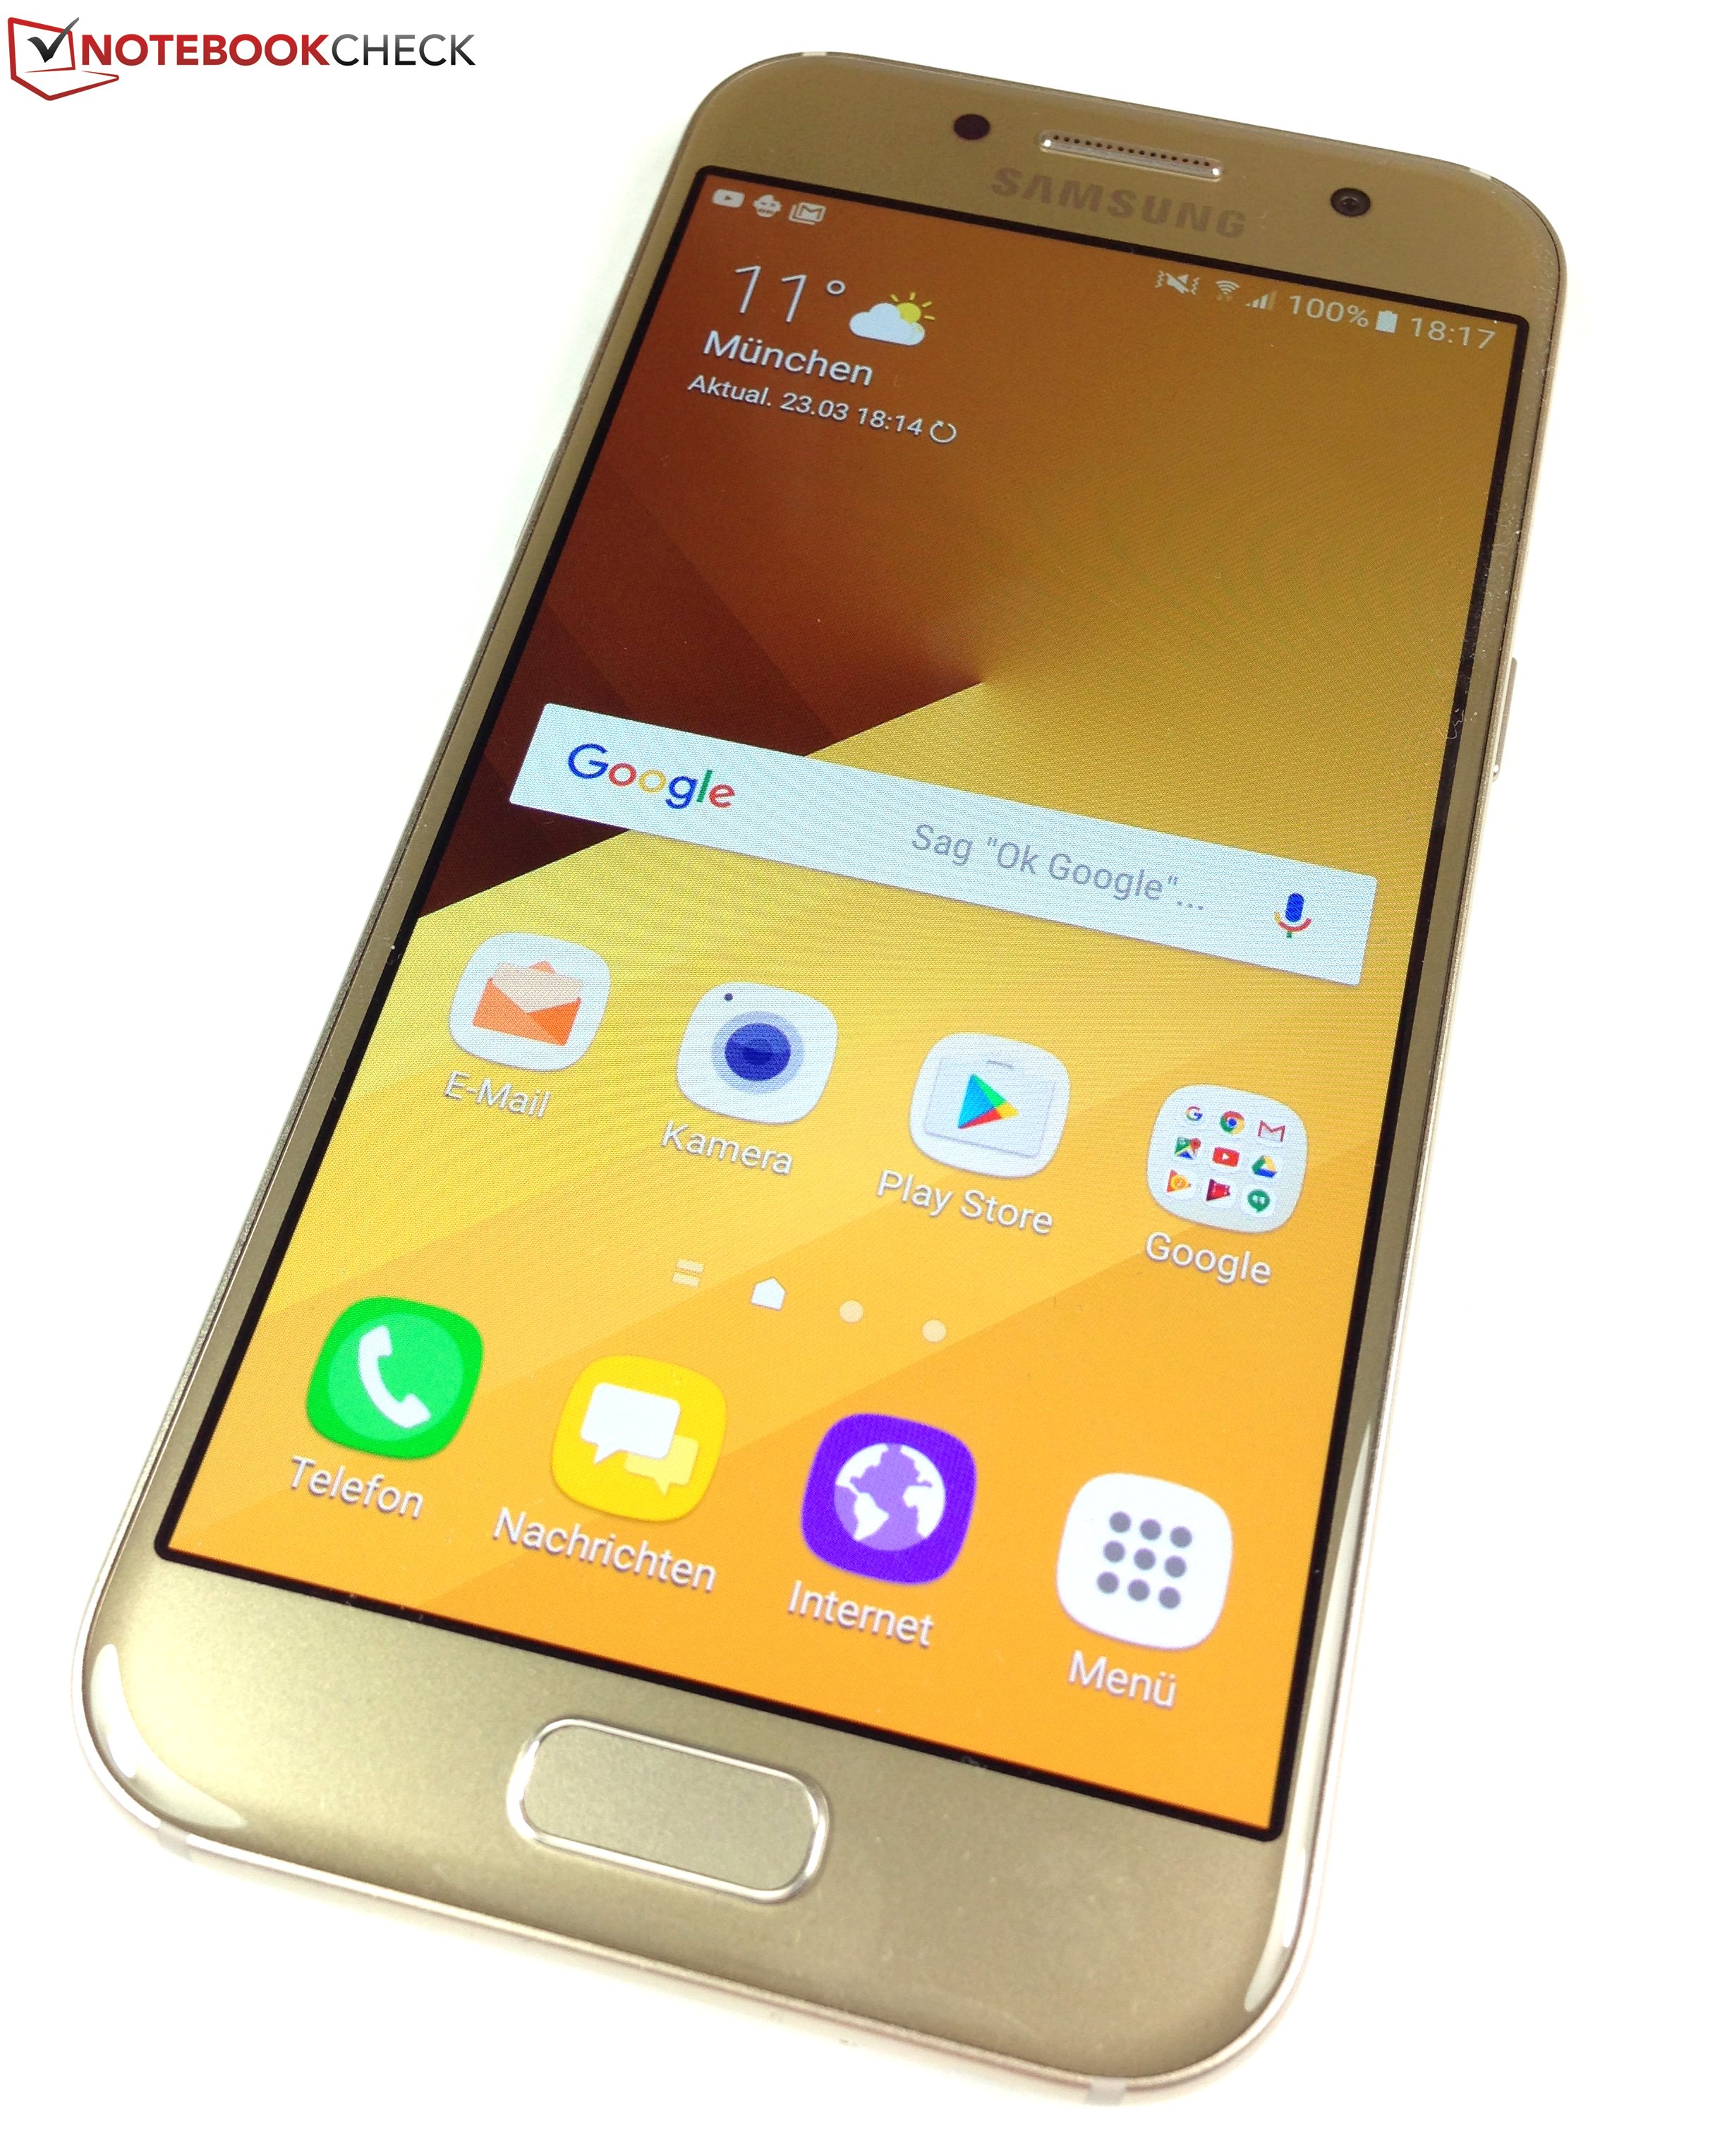
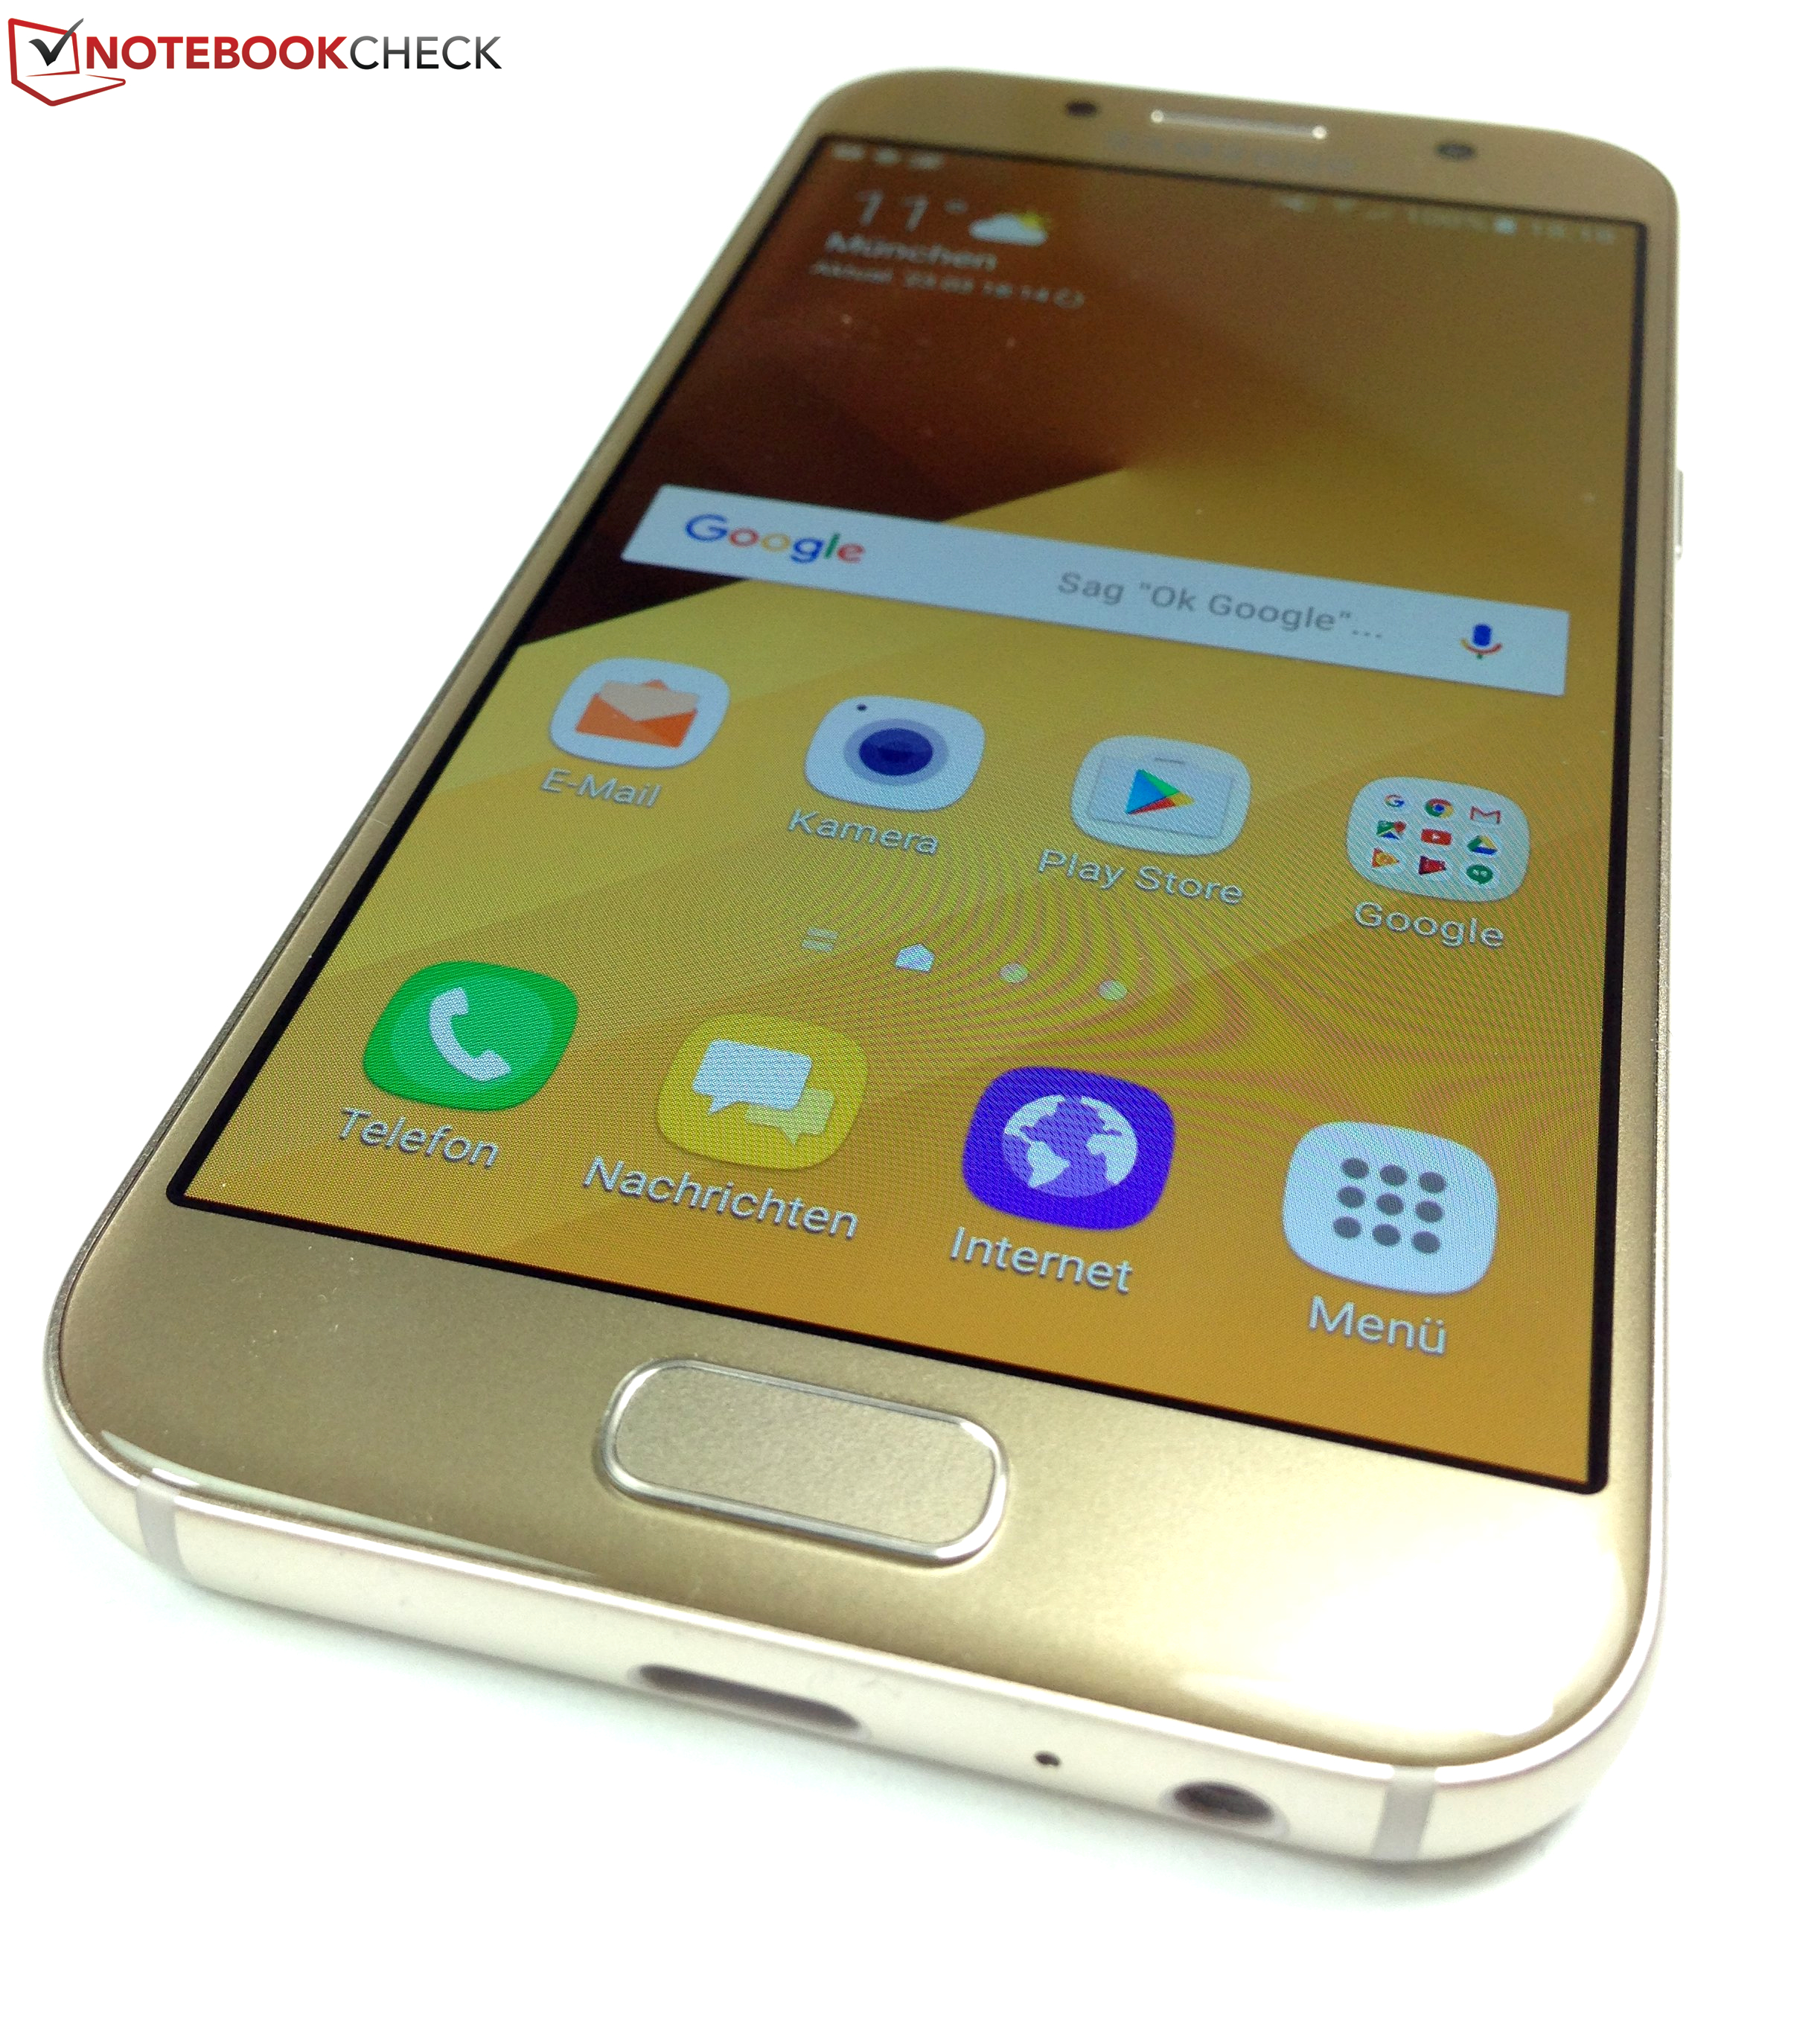
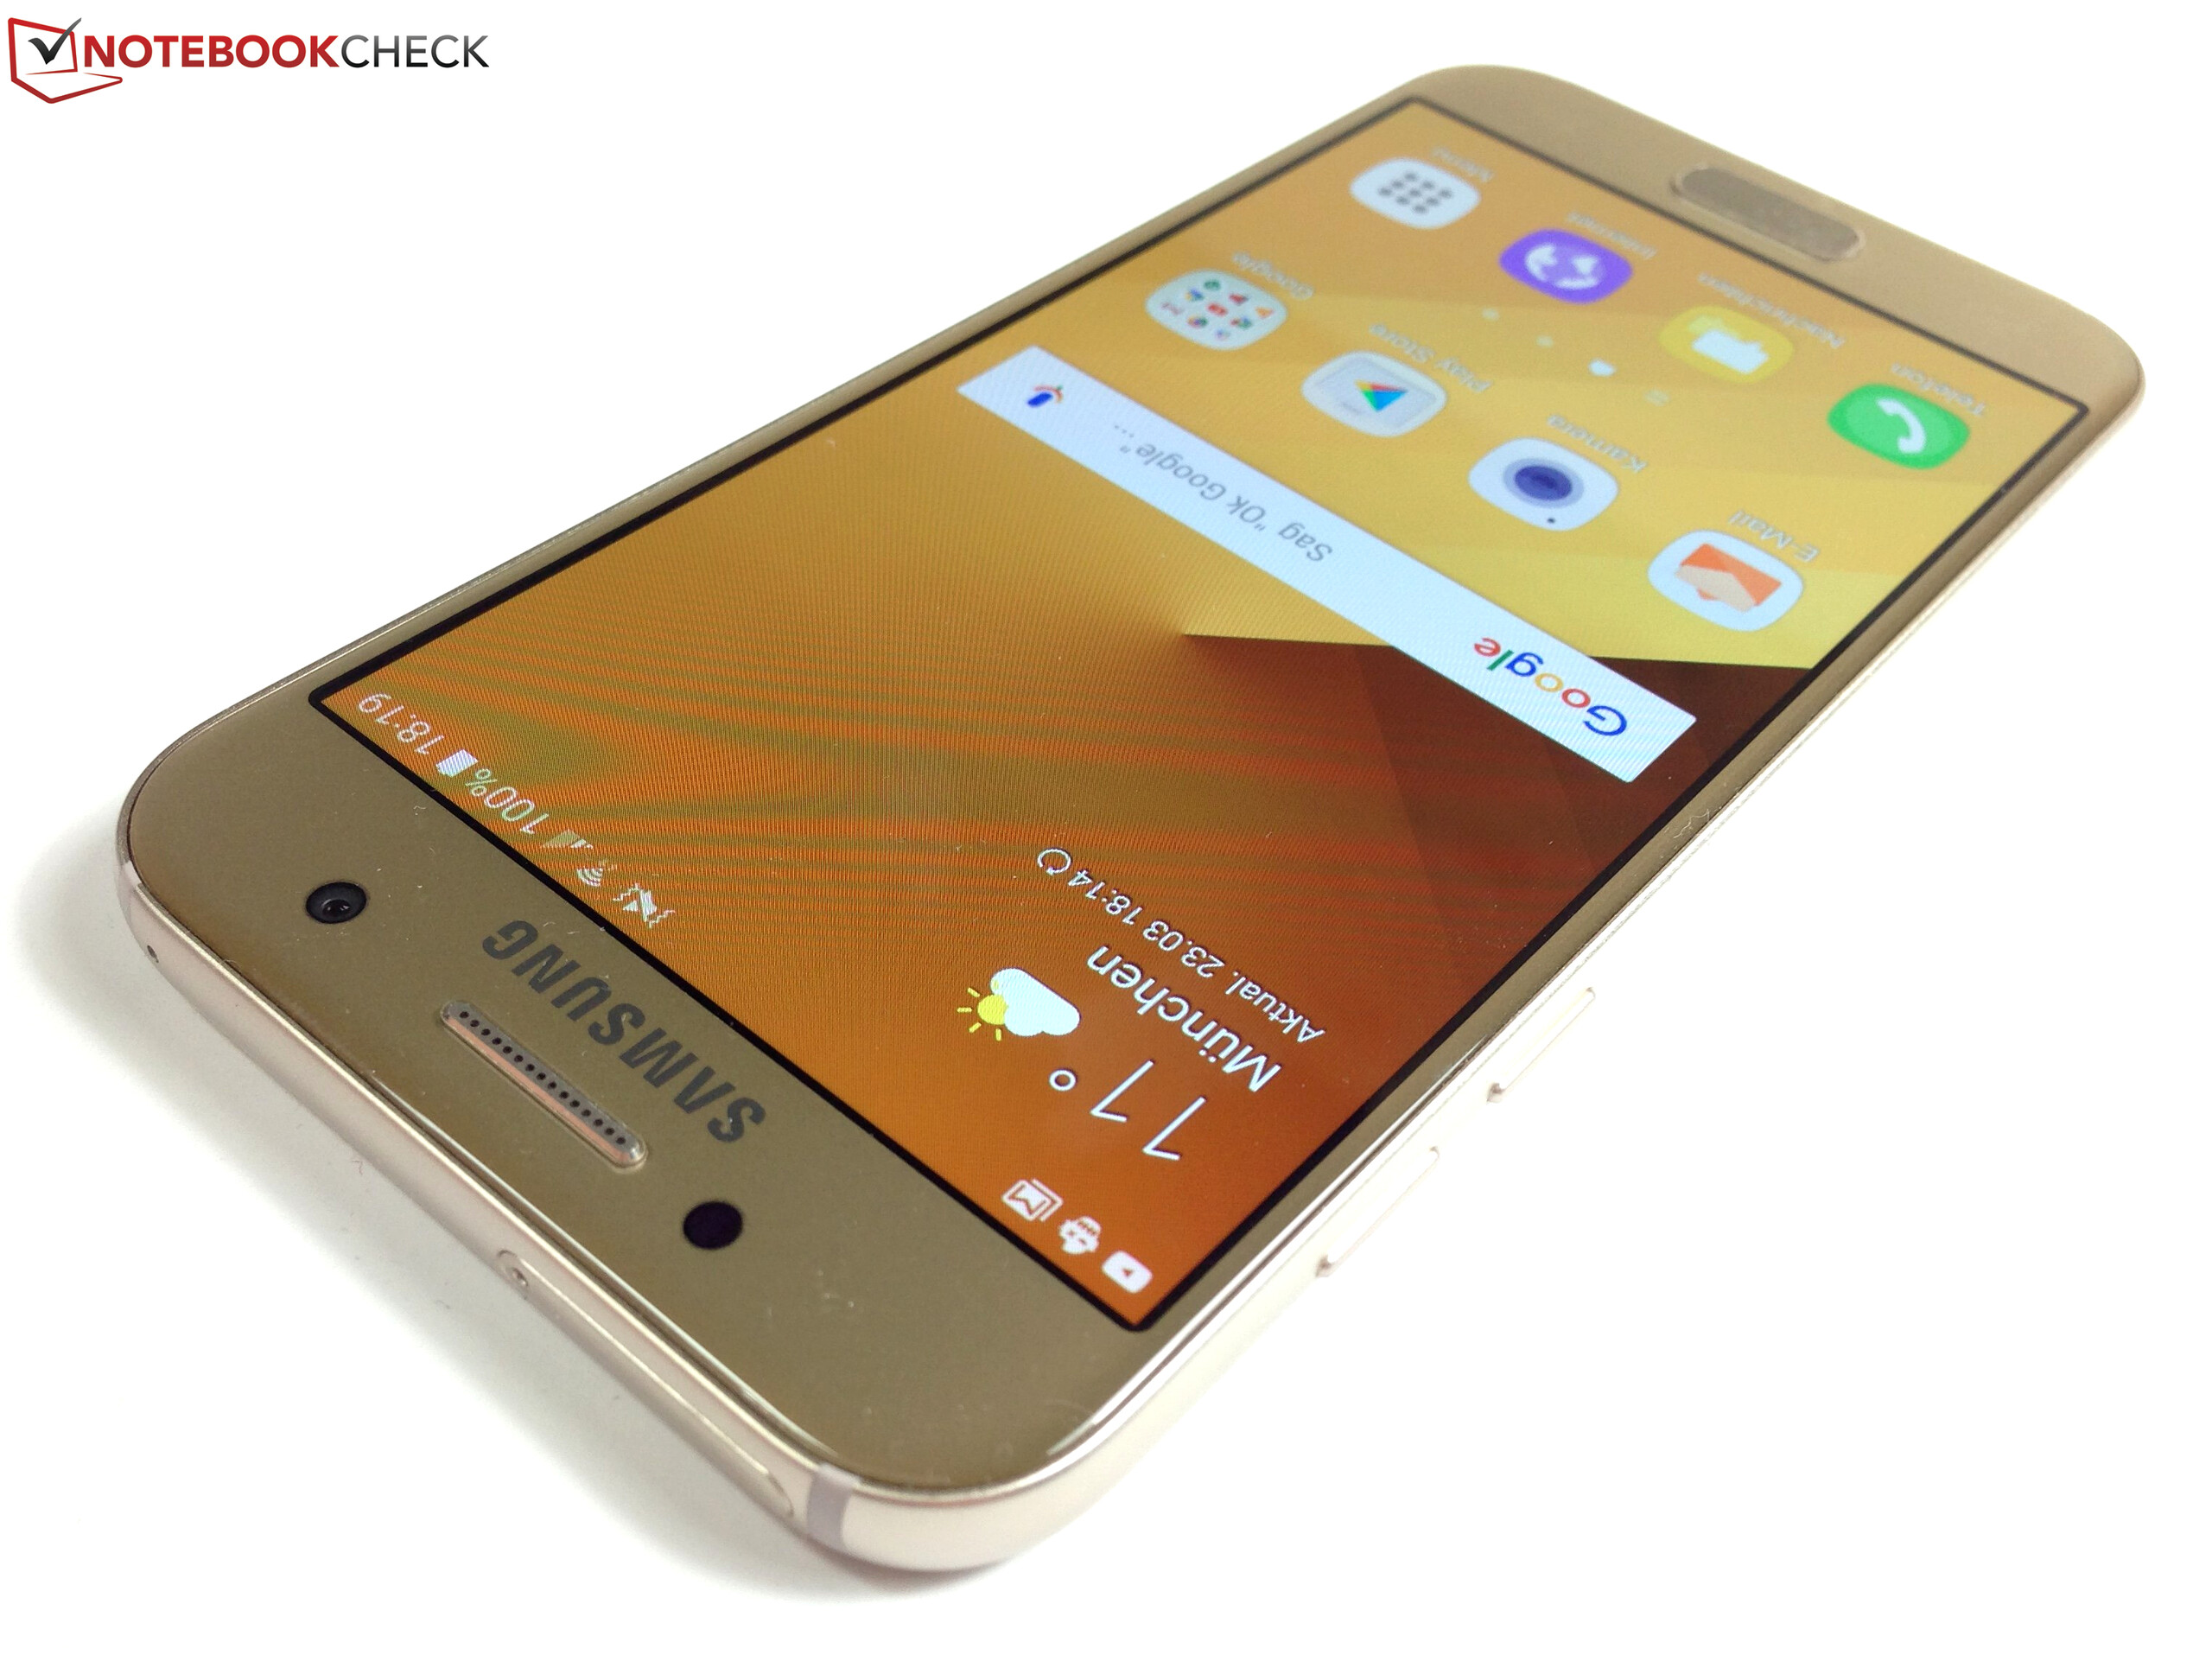
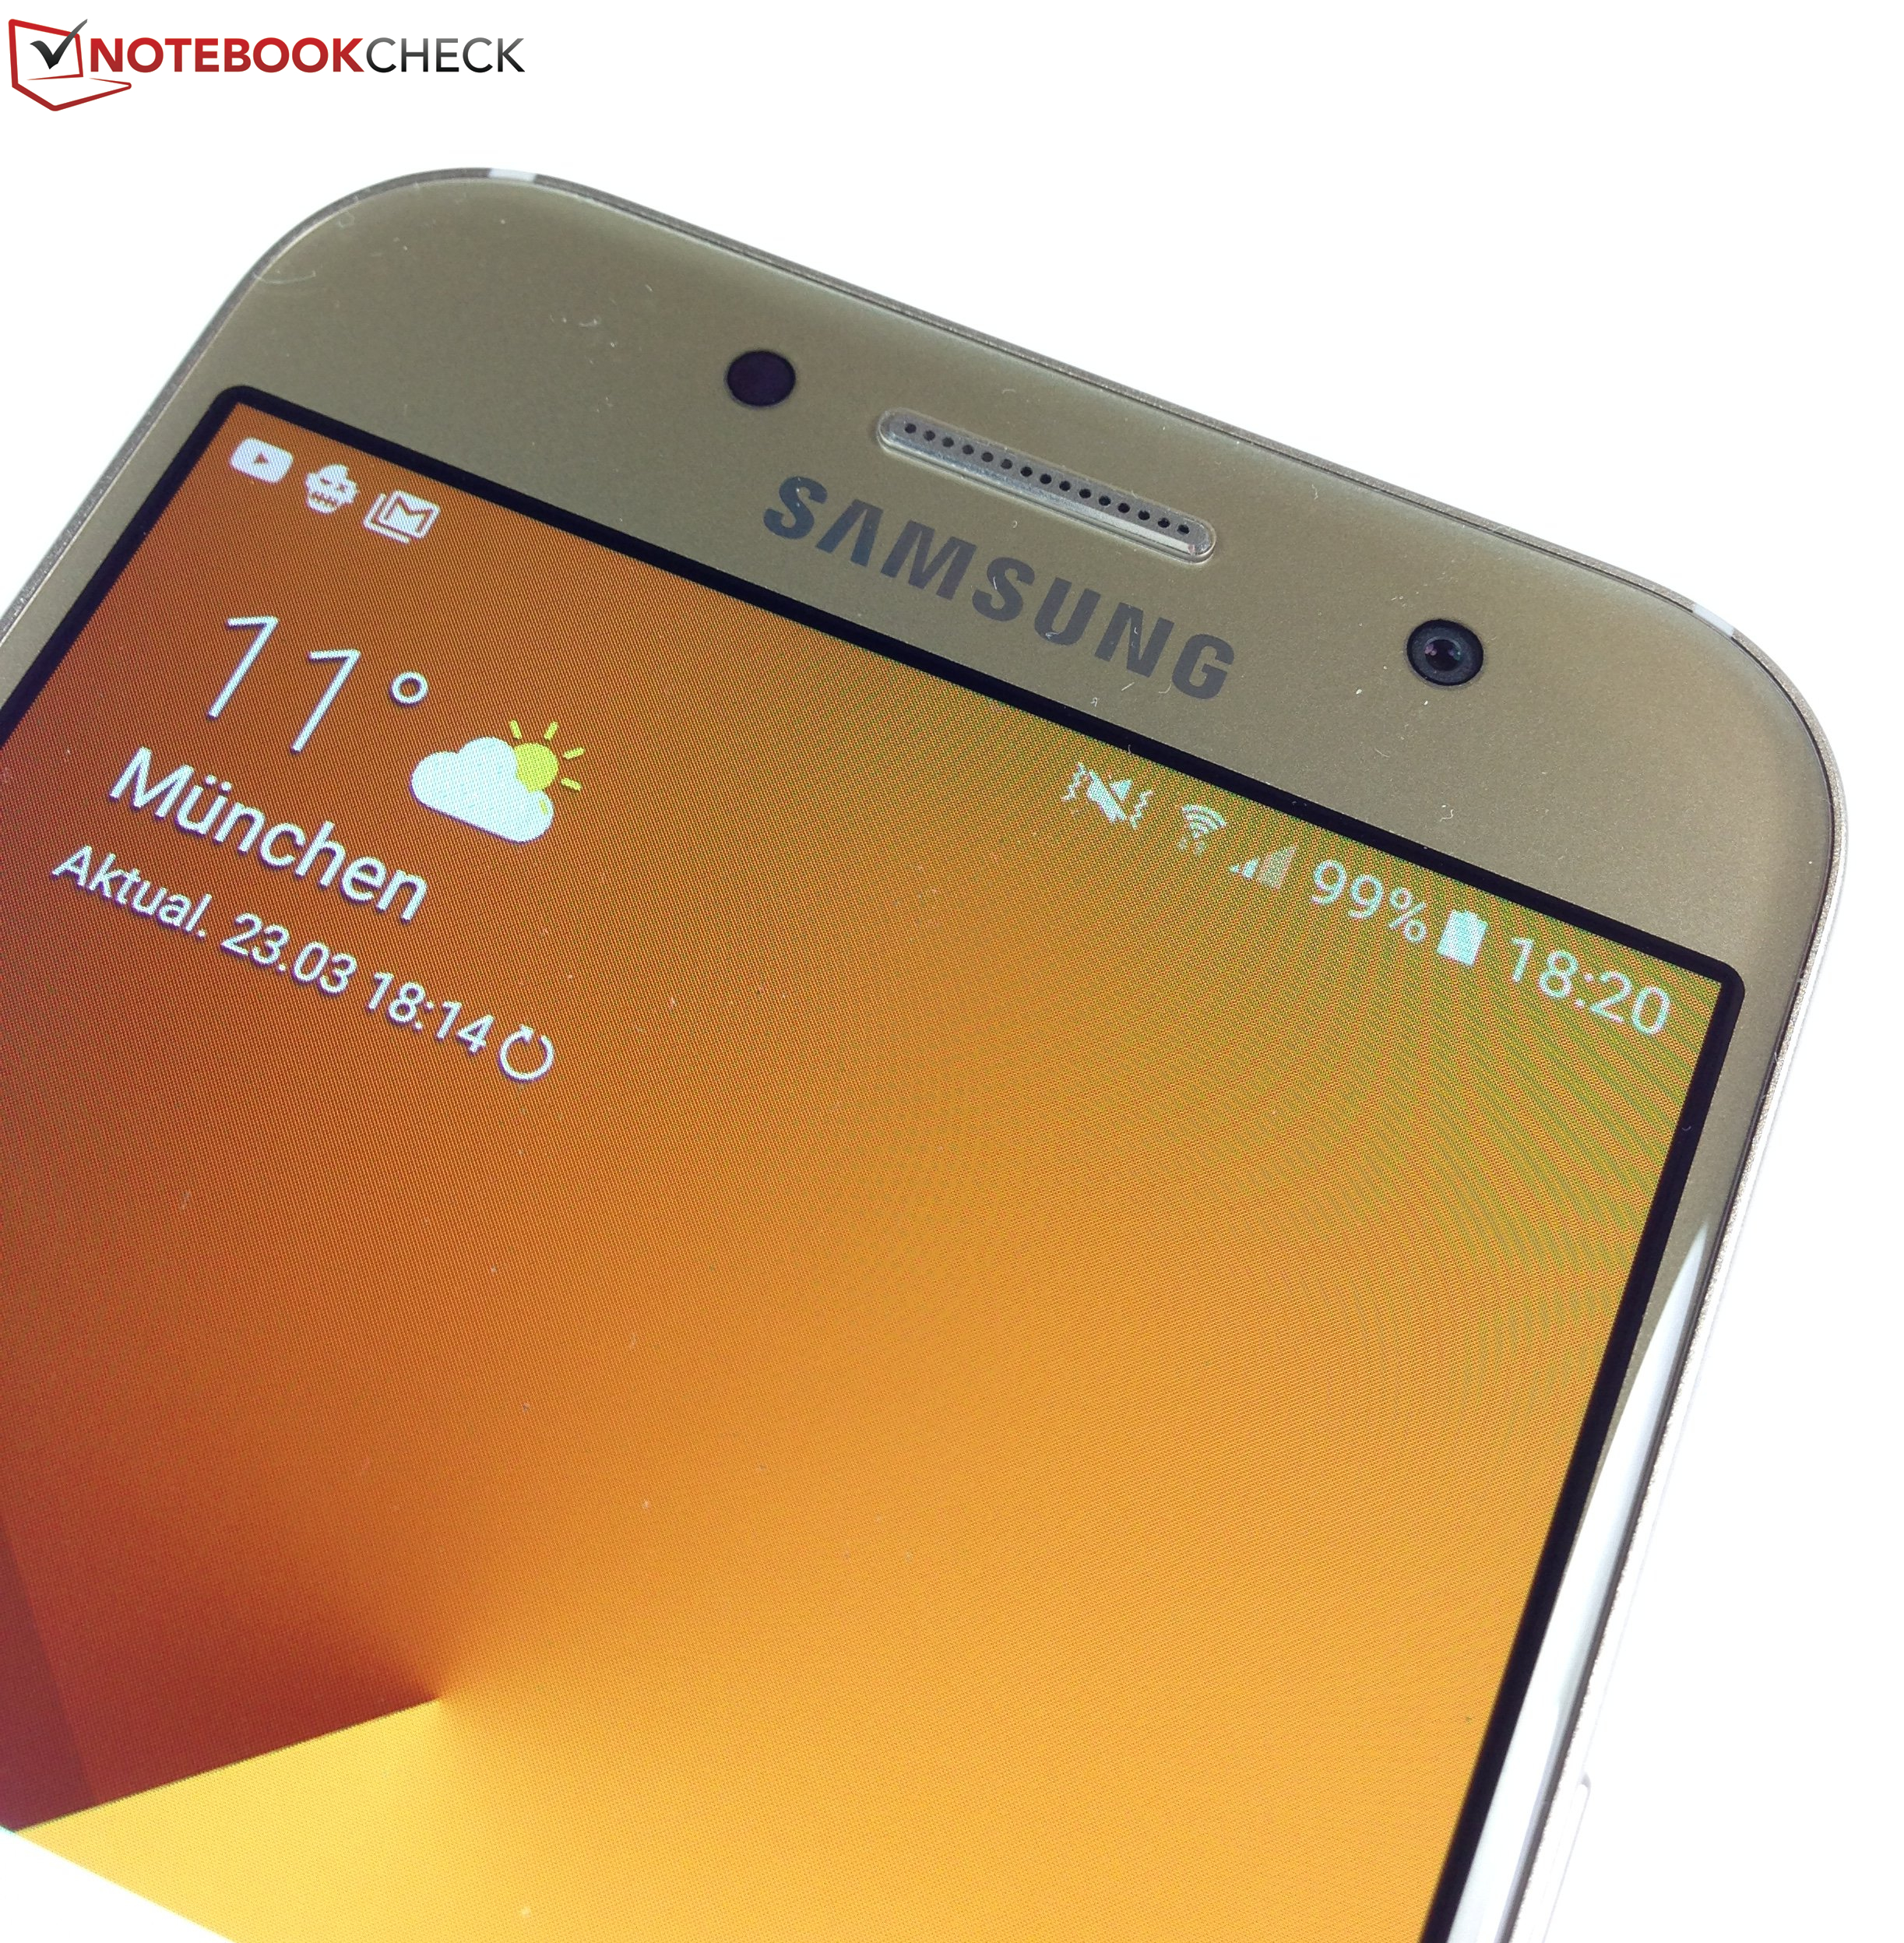
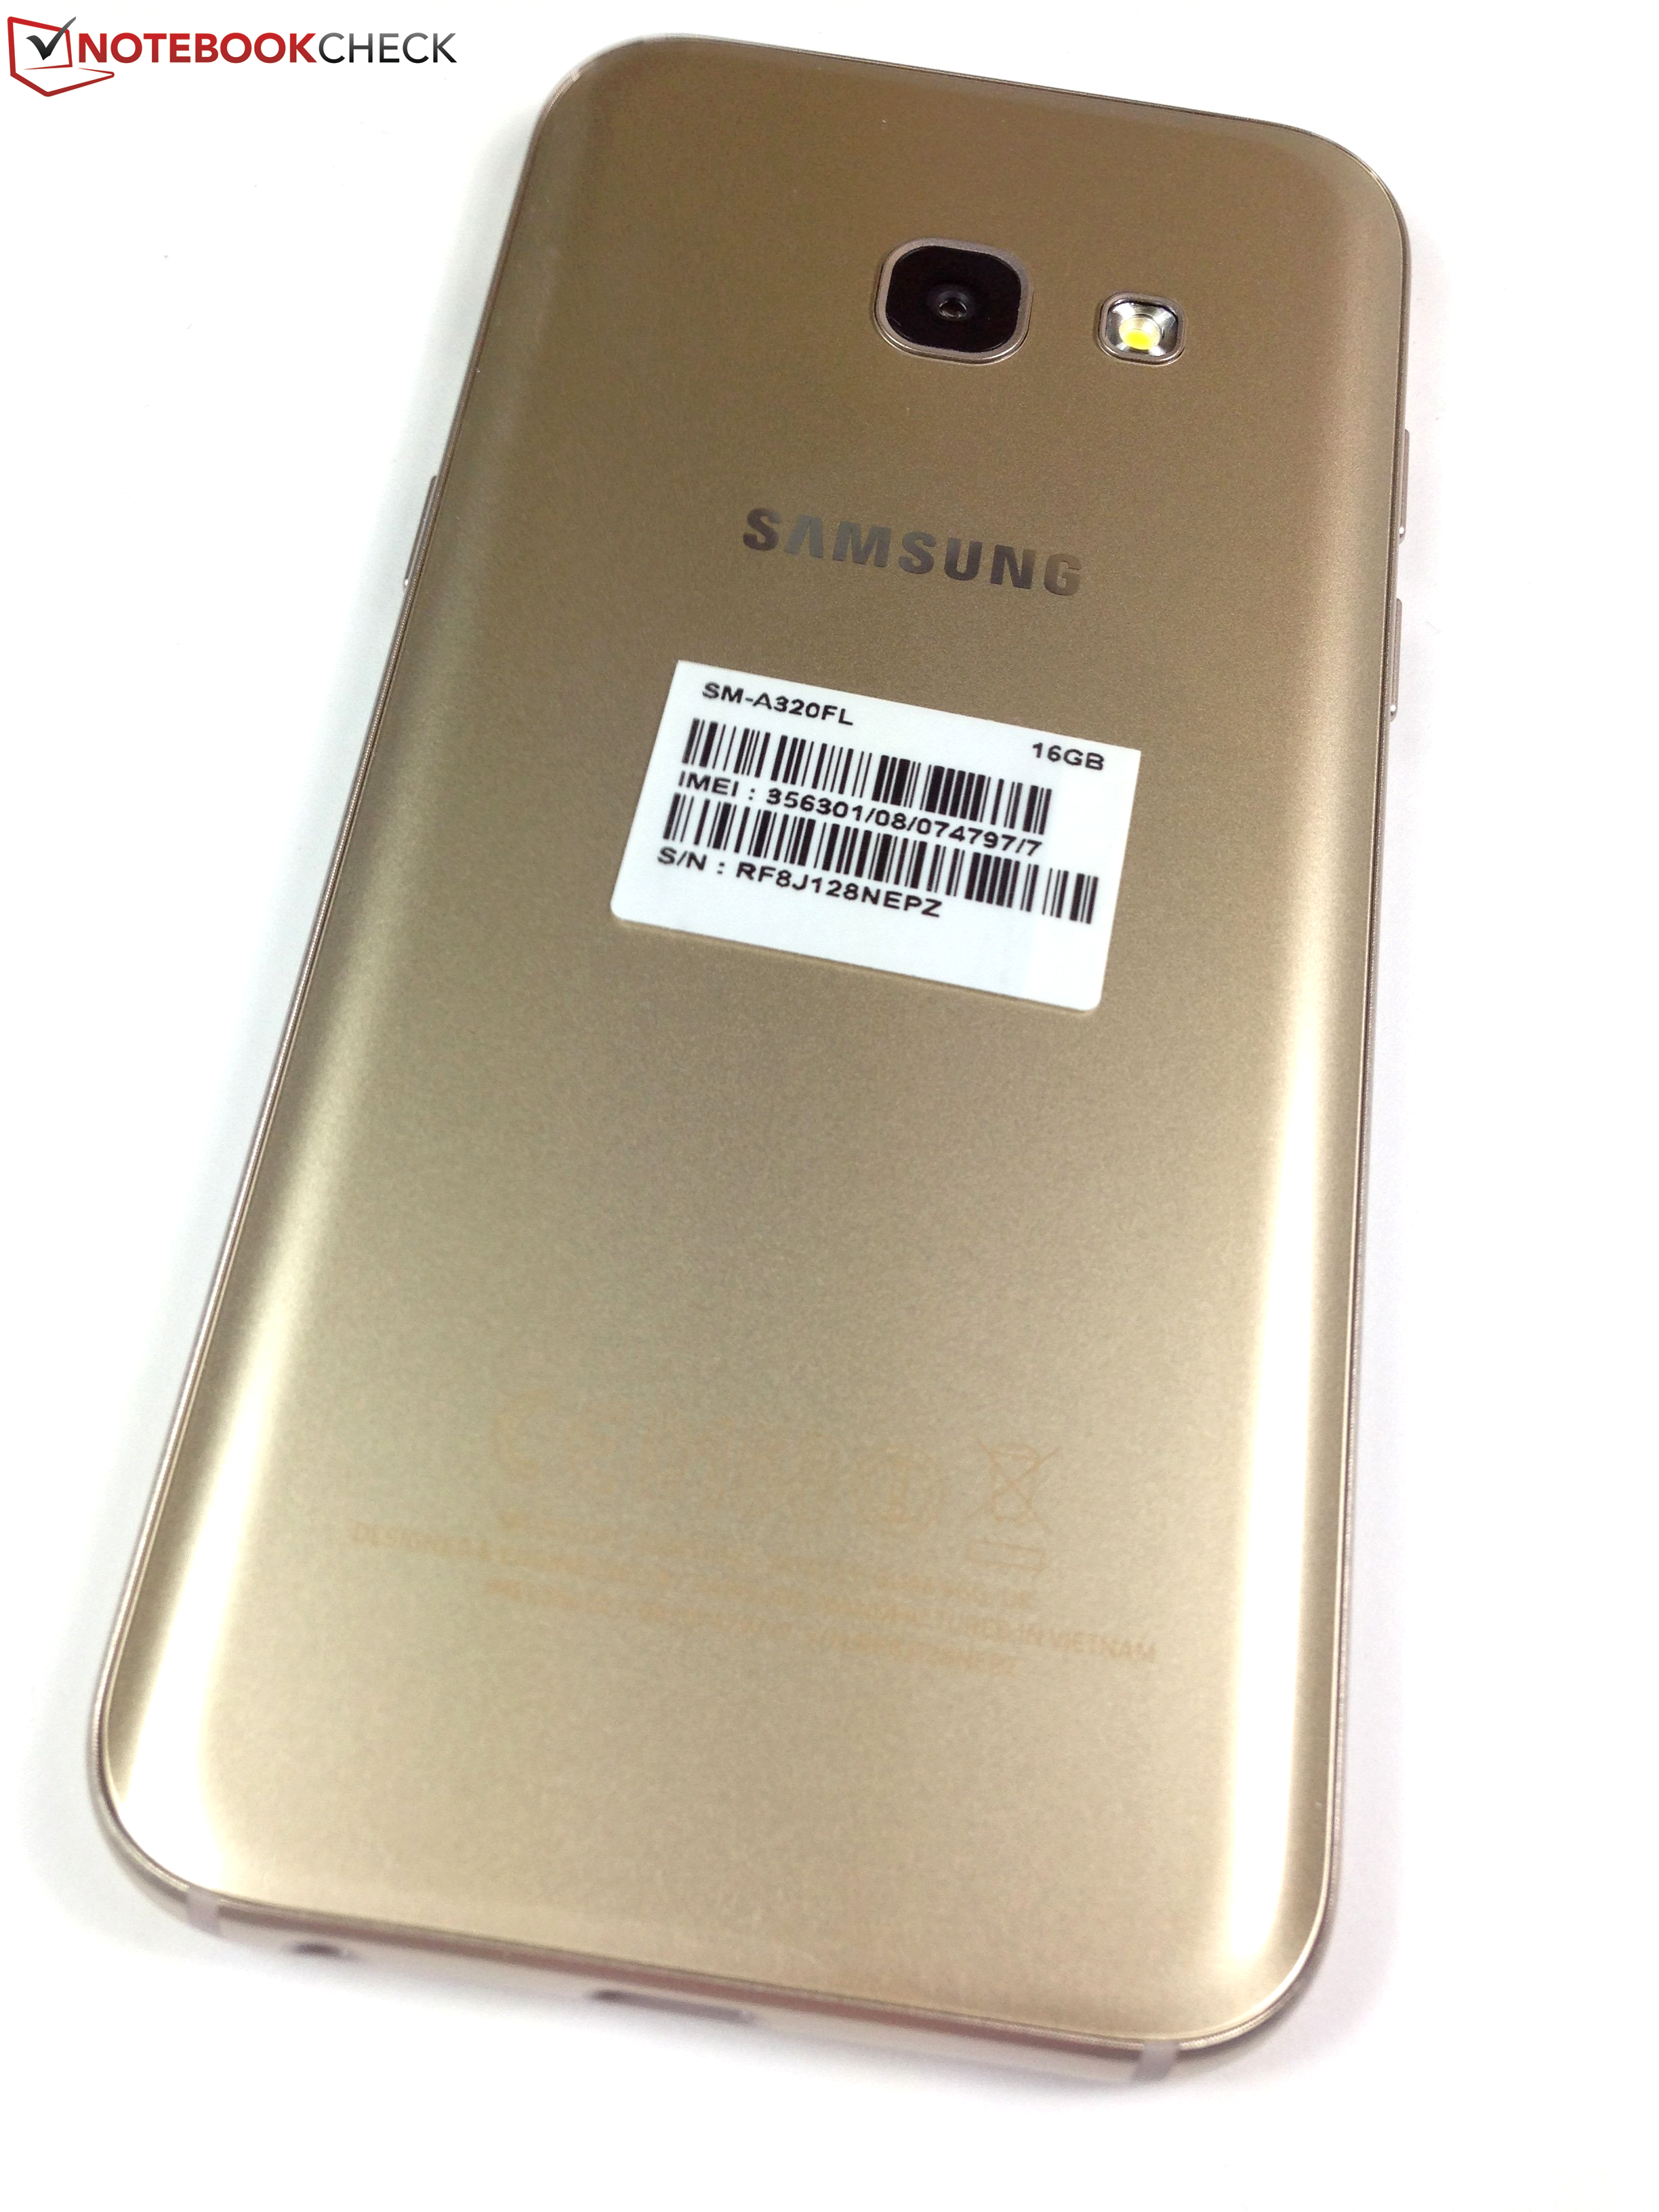
对于已经拥有去年的 Galaxy A3 (2016)的用户来说,几乎没有升级的必要。它们具有类似的质量。当然,今年的新机型确实有一些优势。
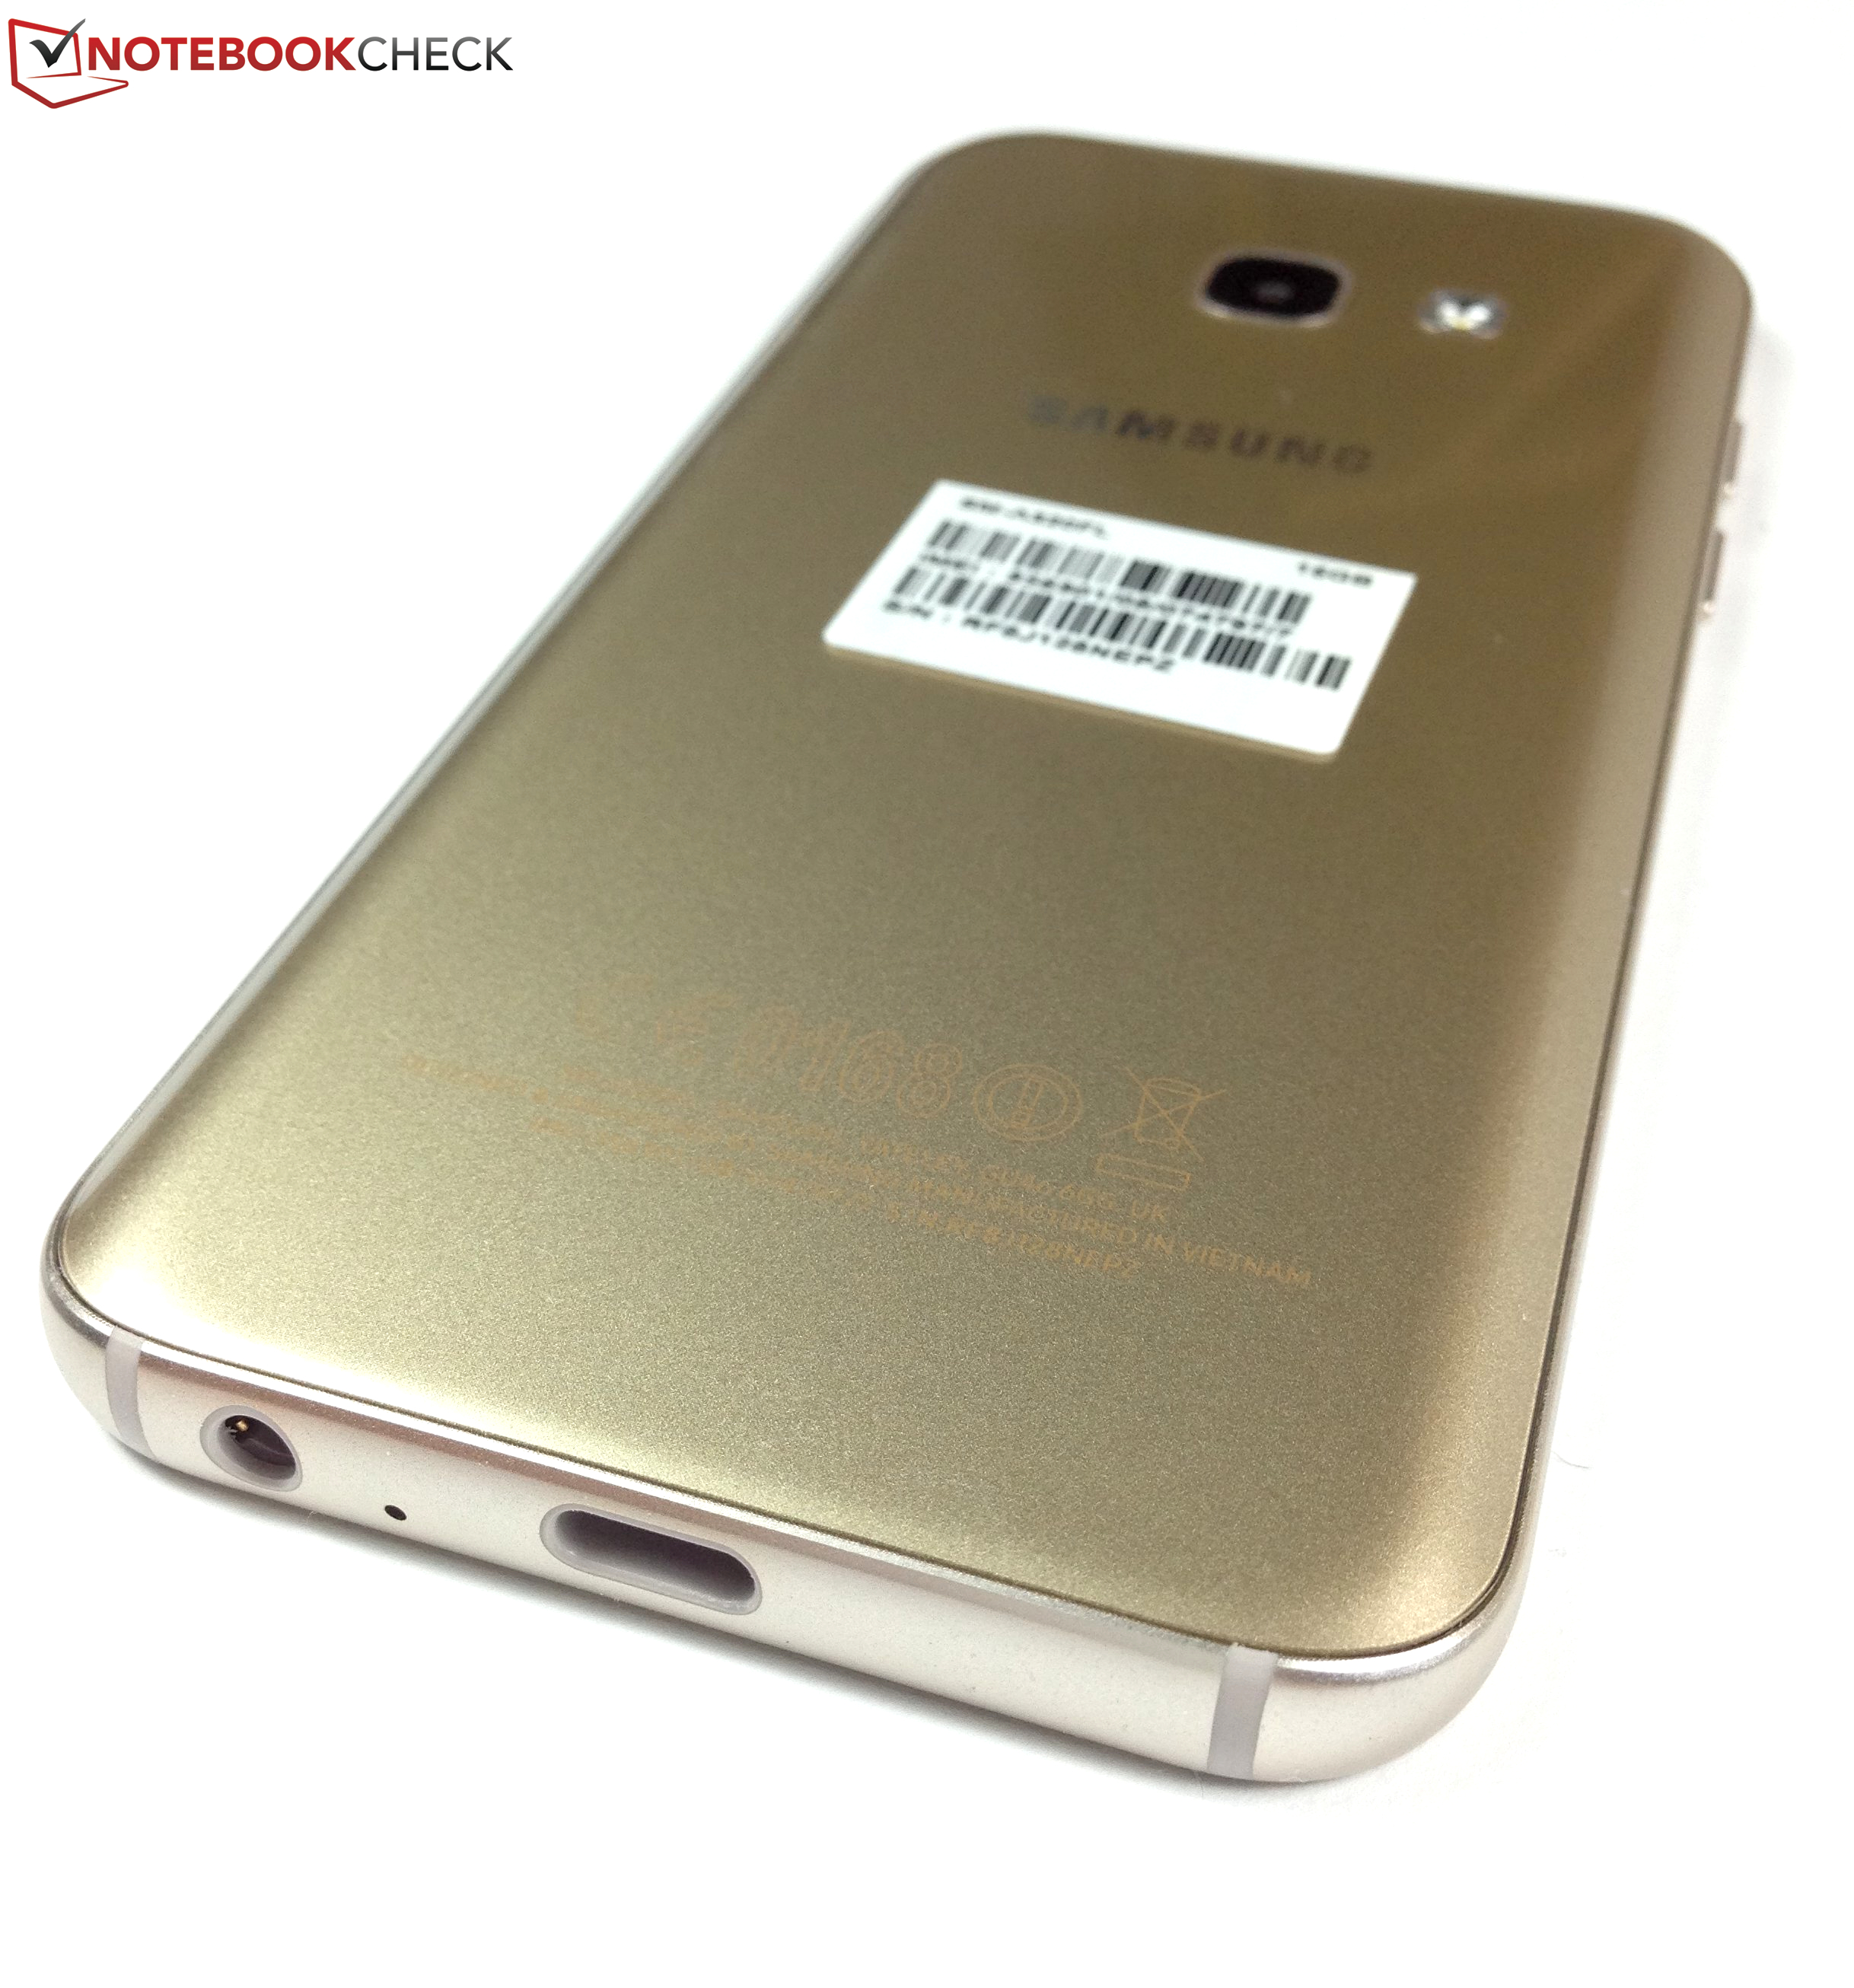
首先,Galaxy A3(2017)现在是IP68级别防尘防水。另外,它具有USB Type-C端口,相机不再从背面突出。由于取消了先前的银色框架,机子看起来显得更加坚固,而且它运行的是最新的Android 6.0.1操作系统。
将处理器升级到更快的Exynos 7870确实对整体性能达到预期的影响。电池续航的改善更重要:由于其惊人的电源效率,Galaxy A3(2017)是一款非常耐用的机器。两个摄像头也得到了改善,在低光条件下拍摄效果更好。前置摄像头已经完成从500到800万像素的更新。
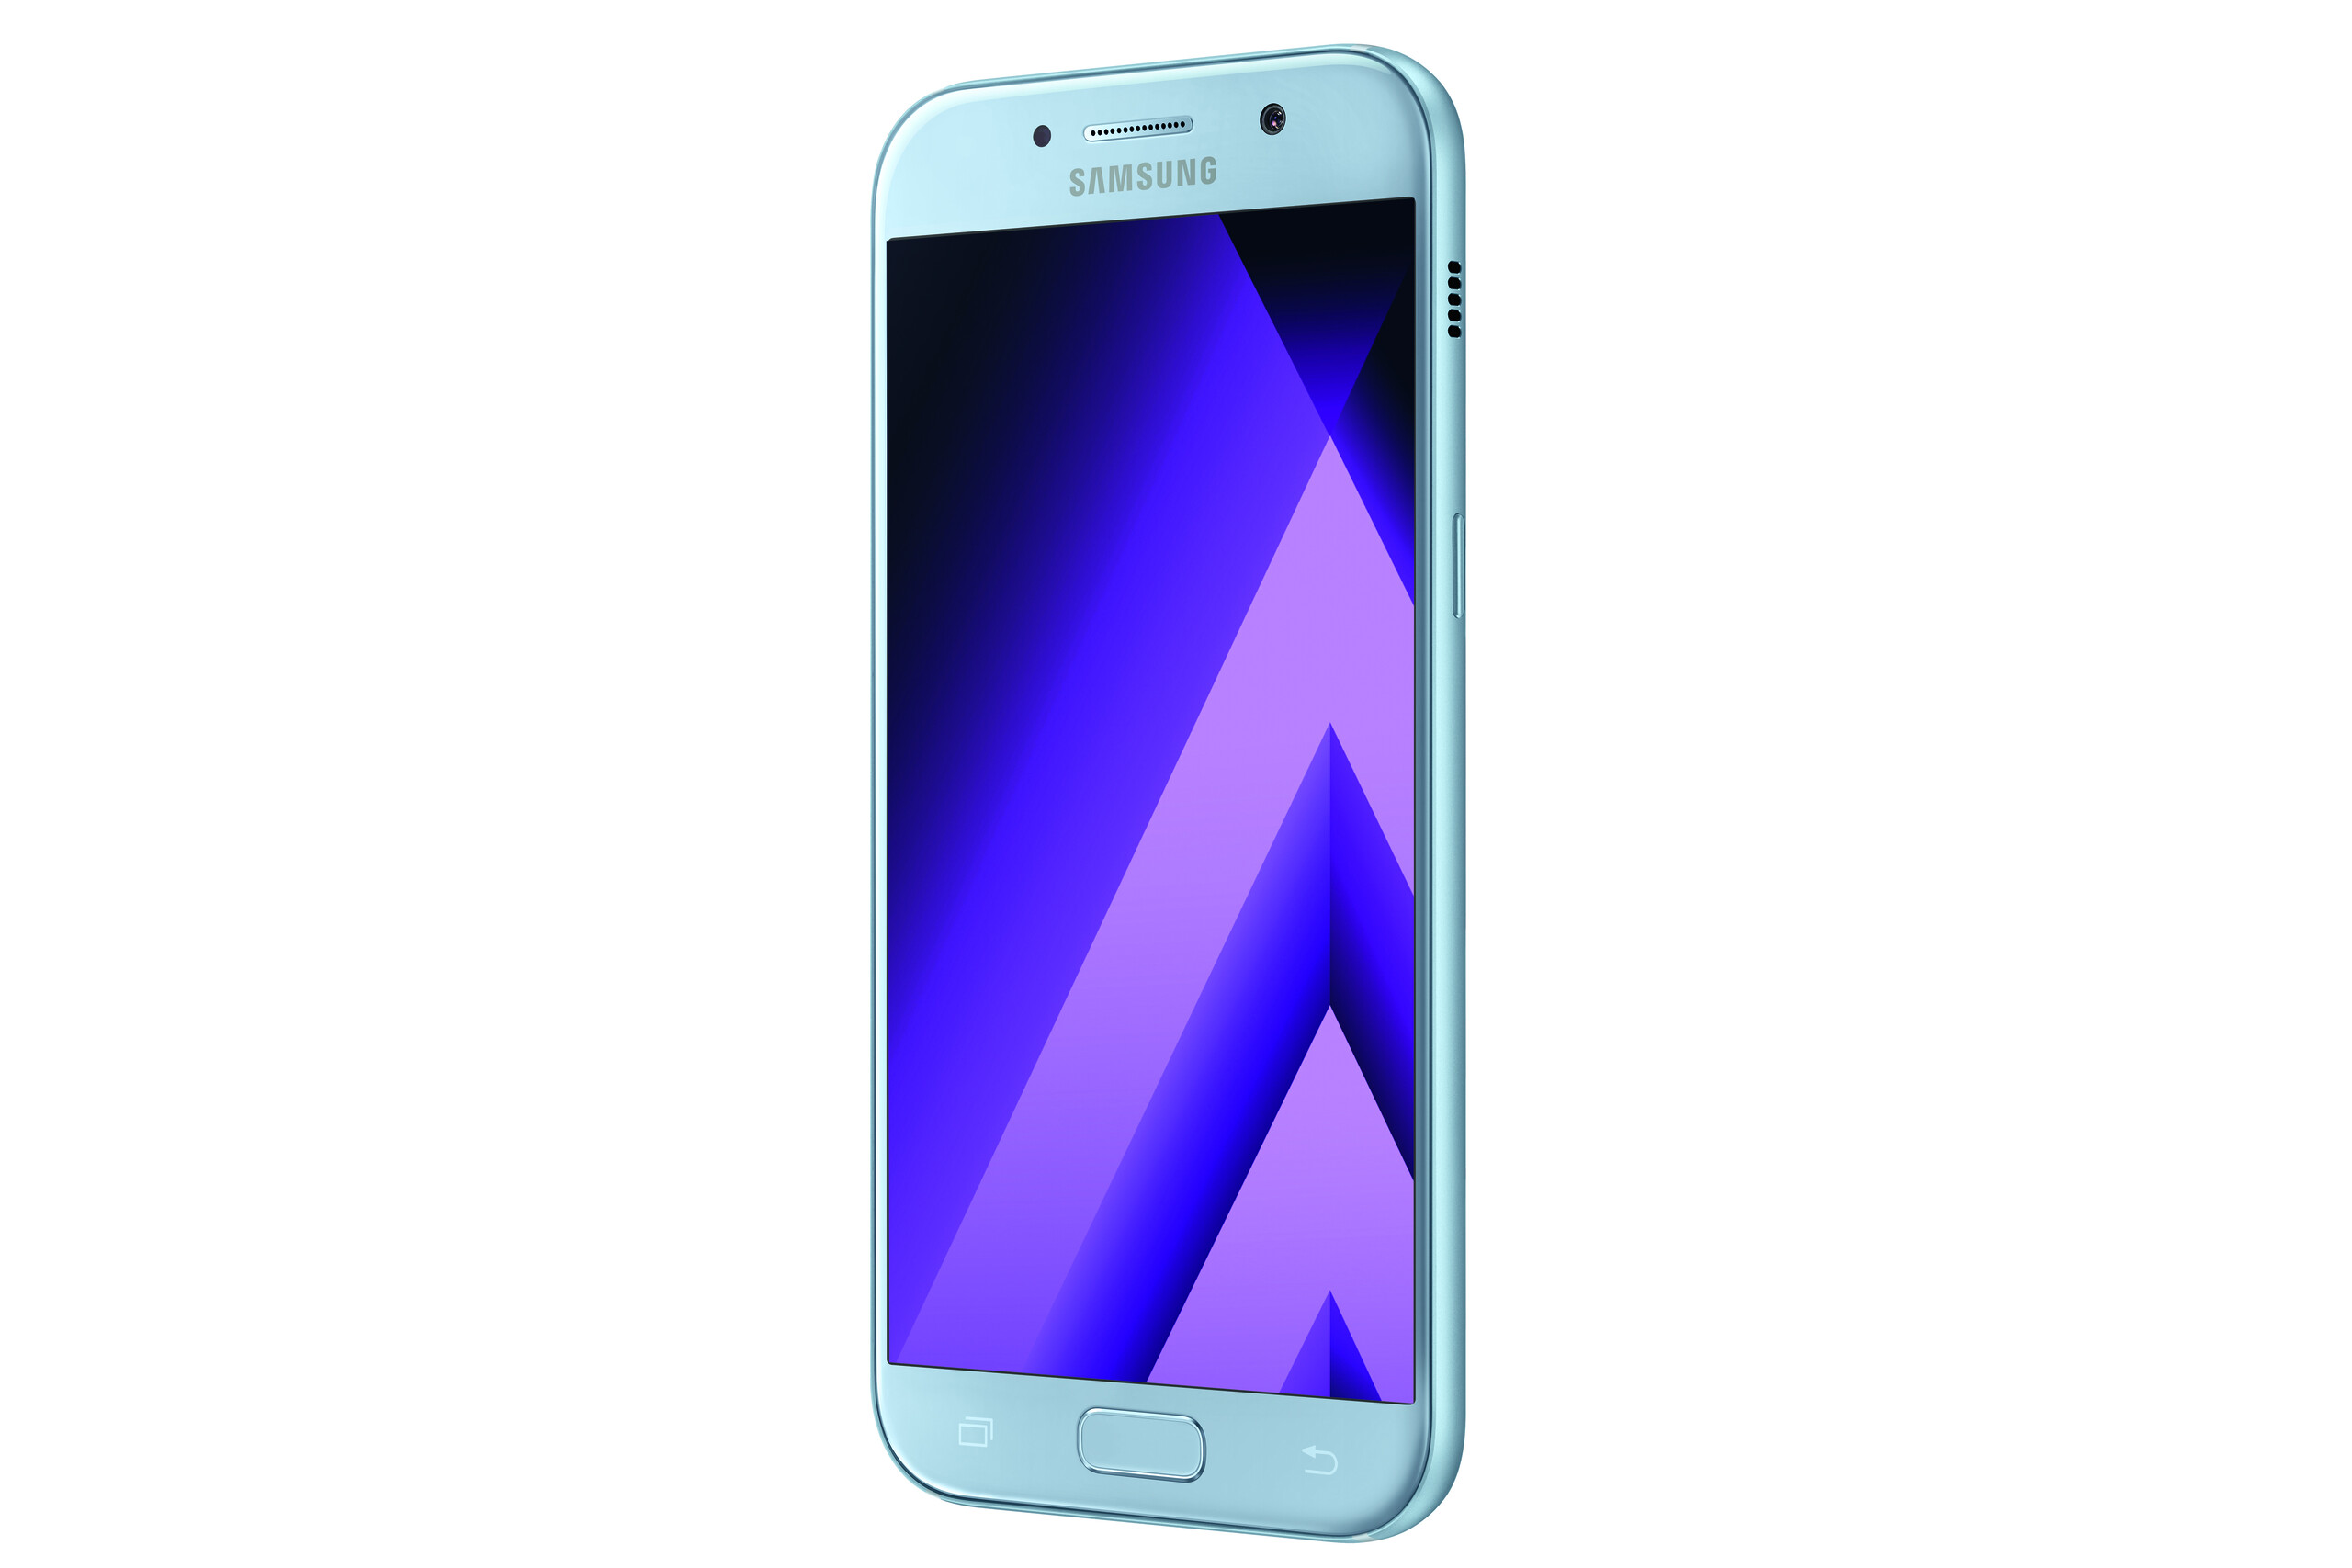
Galaxy A3(2017)并没有做出大跃进,相反,它的迭代与改进是温和有效的。
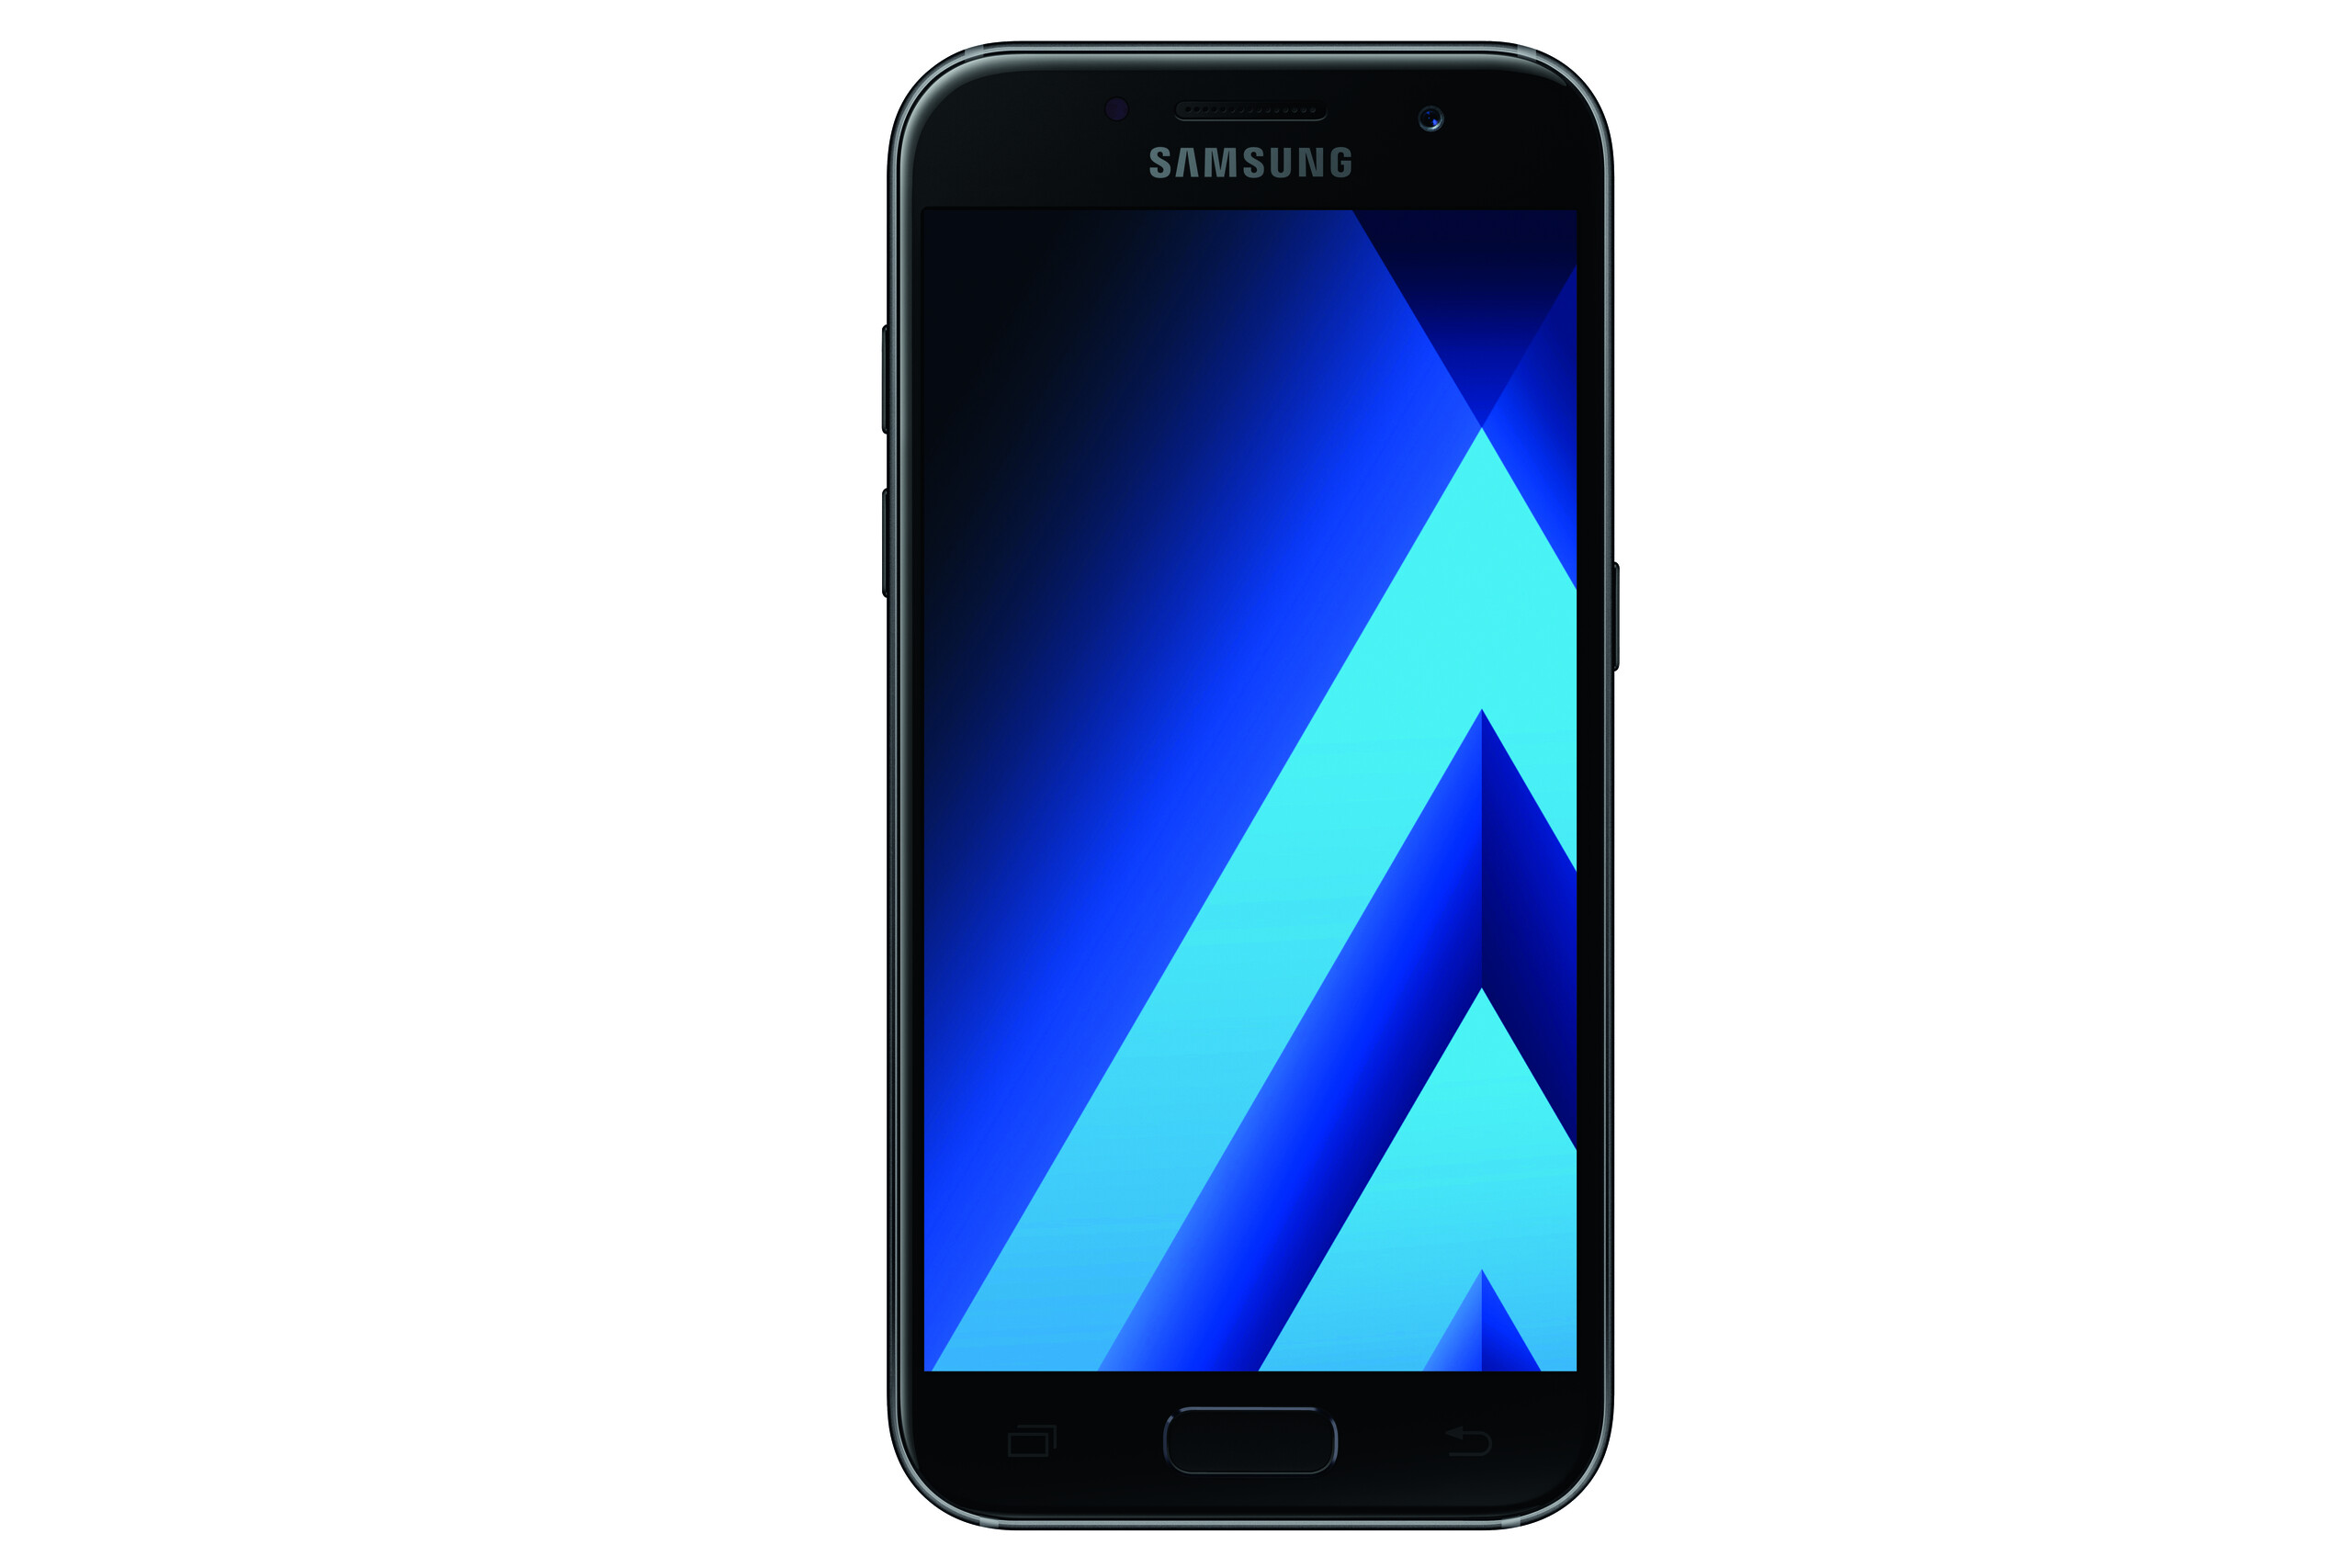
尽管4.7英寸大小易于掌控,但光滑的背面可能会引起一些用户的不满。你唯一可以做的就是去体验一下,判断手机是否太滑。作为个人,我不介意玻璃后盖。然而,该手机的缺点无法被掩饰:没有高清影音标准接口,没有双SIM卡支持,没有光学防抖。有些用户还可能会注意到亮度低于92%时的屏幕闪烁。尽管有这些限制,Galaxy A3(2017)仍然是一个质量坚实而让人尊敬的中档智能手机,很少有值得抱怨的地方。
注:本文是基于完整评测的缩减版本,阅读完整的英文评测,请点击这里。
Samsung Galaxy A3 2017
- 09/03/2022 v7 (old)
Manuel Masiero