三星 Galaxy J7 (2016) 智能手机简短评测
Case
| Networking | |
| iperf3 transmit AX12 | |
| Samsung Galaxy J7 2016 | |
| iperf3 receive AX12 | |
| Samsung Galaxy J7 2016 | |

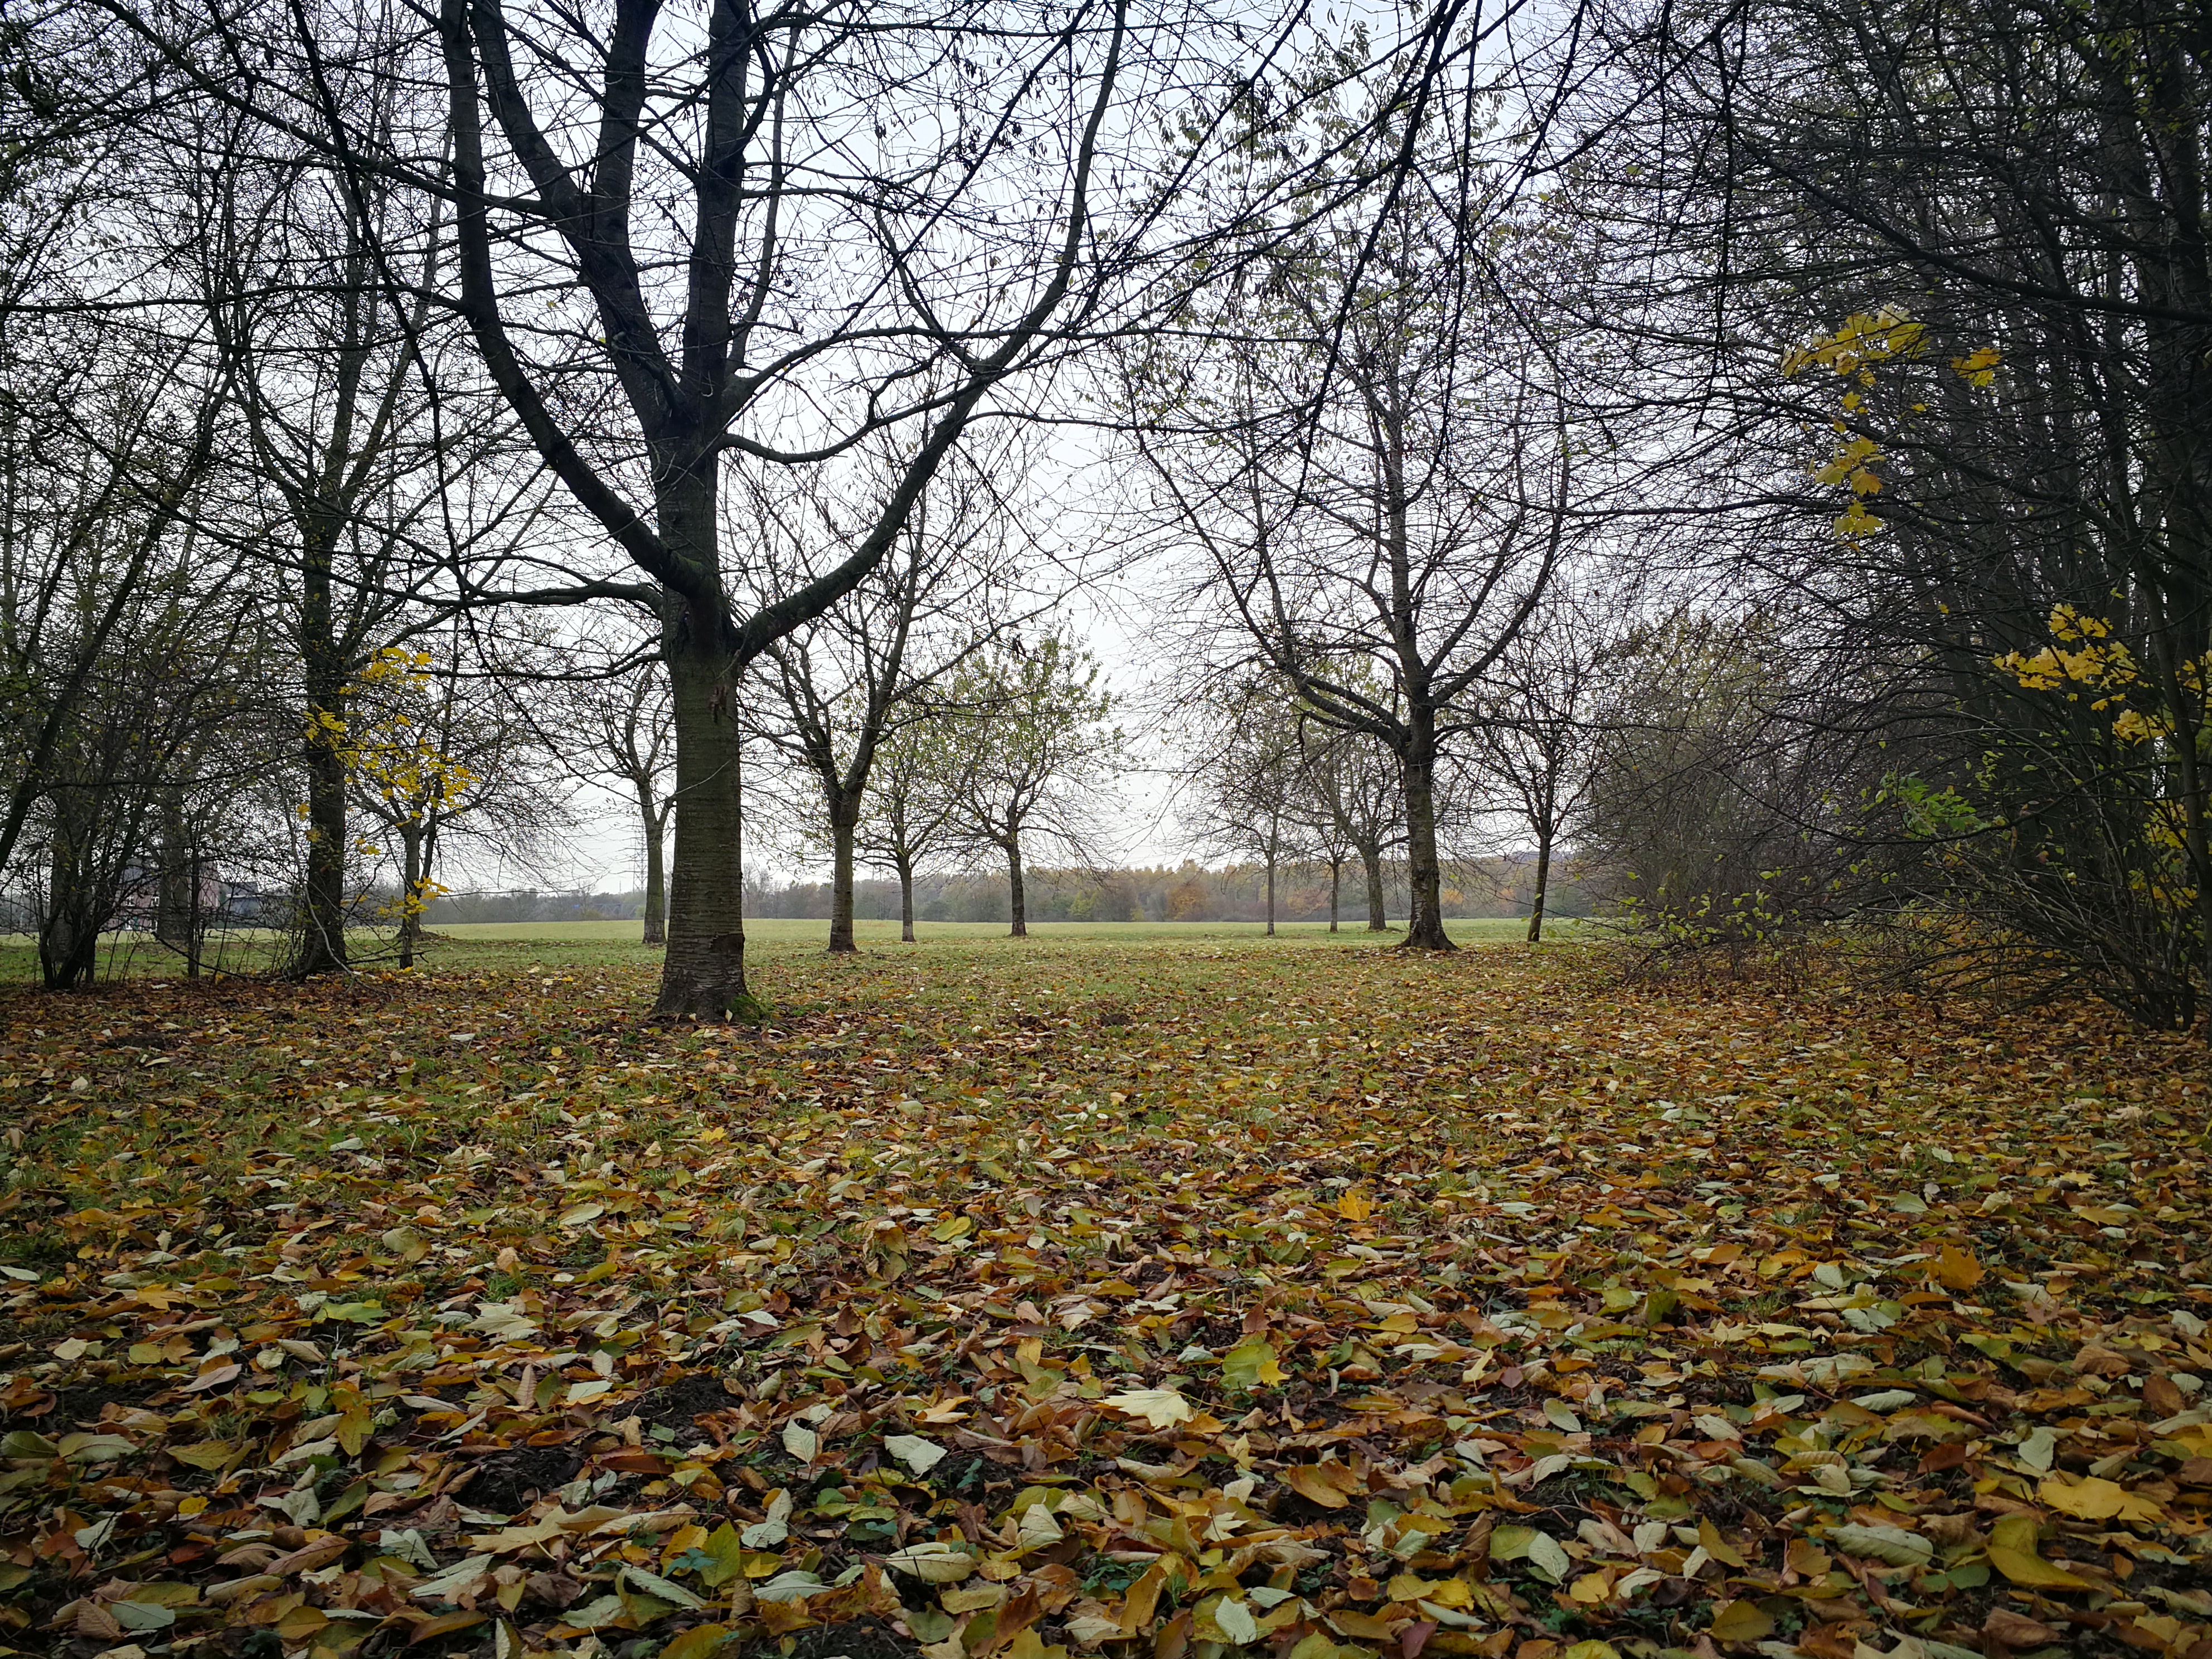


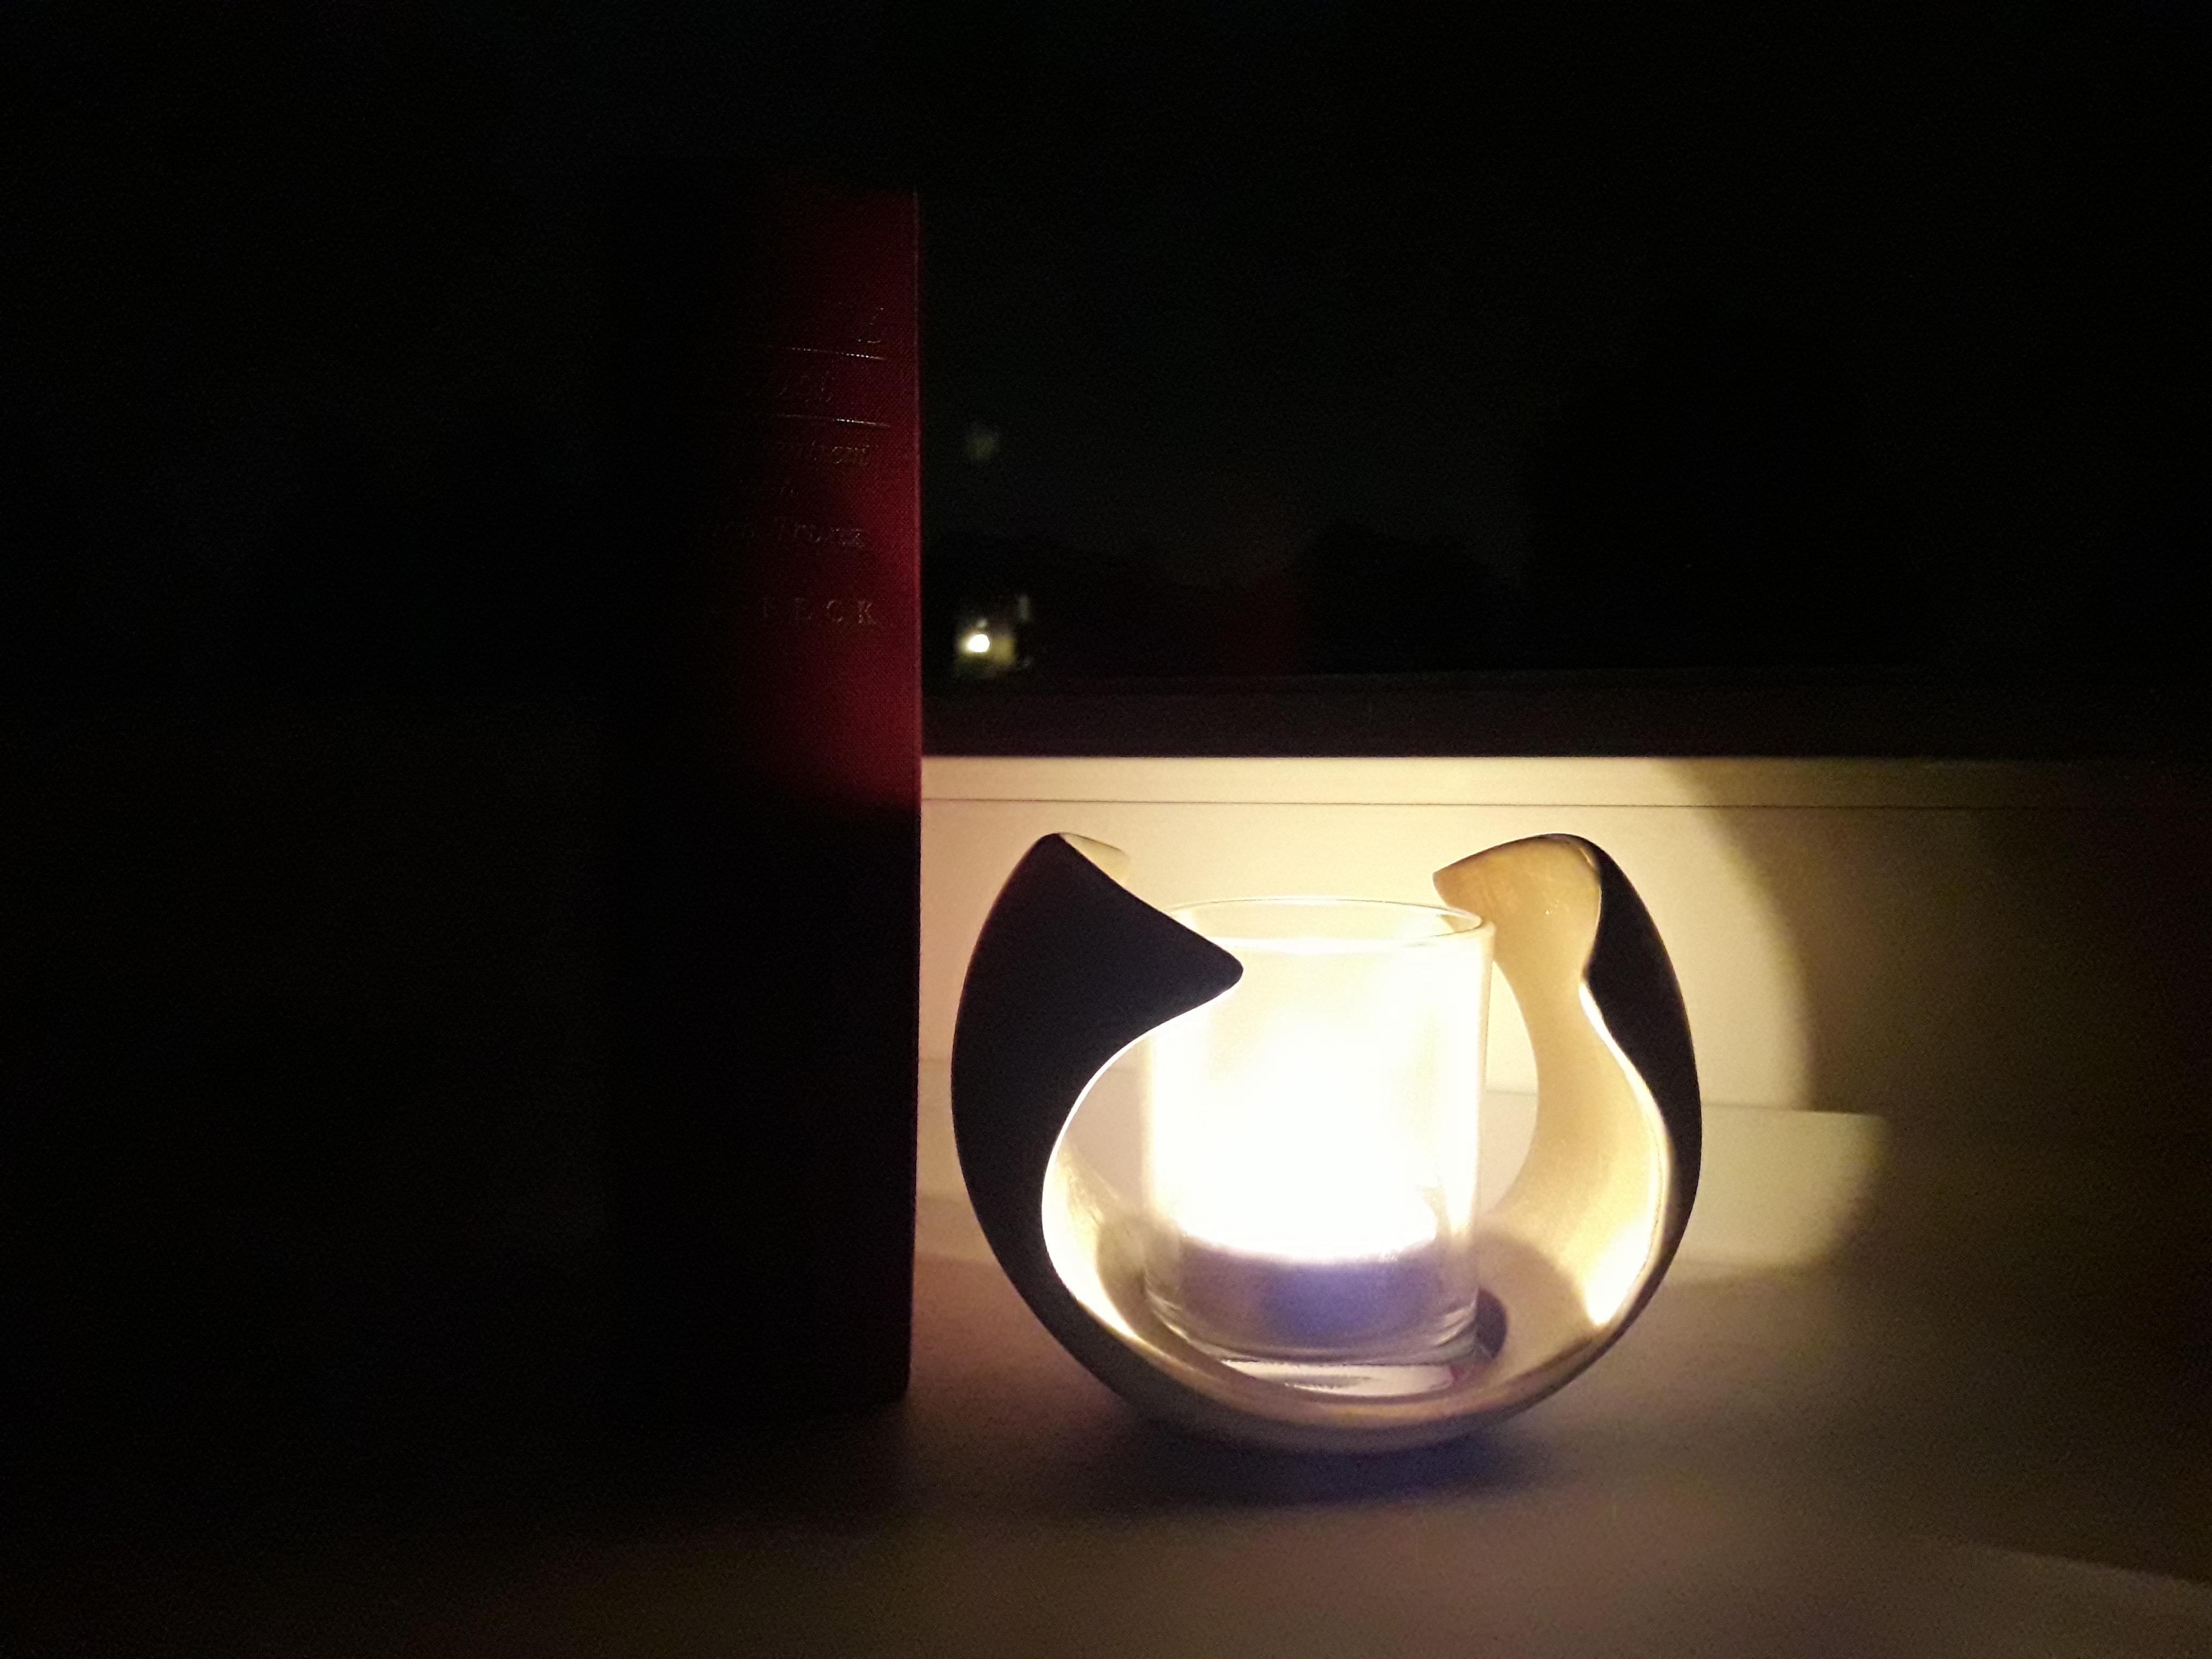
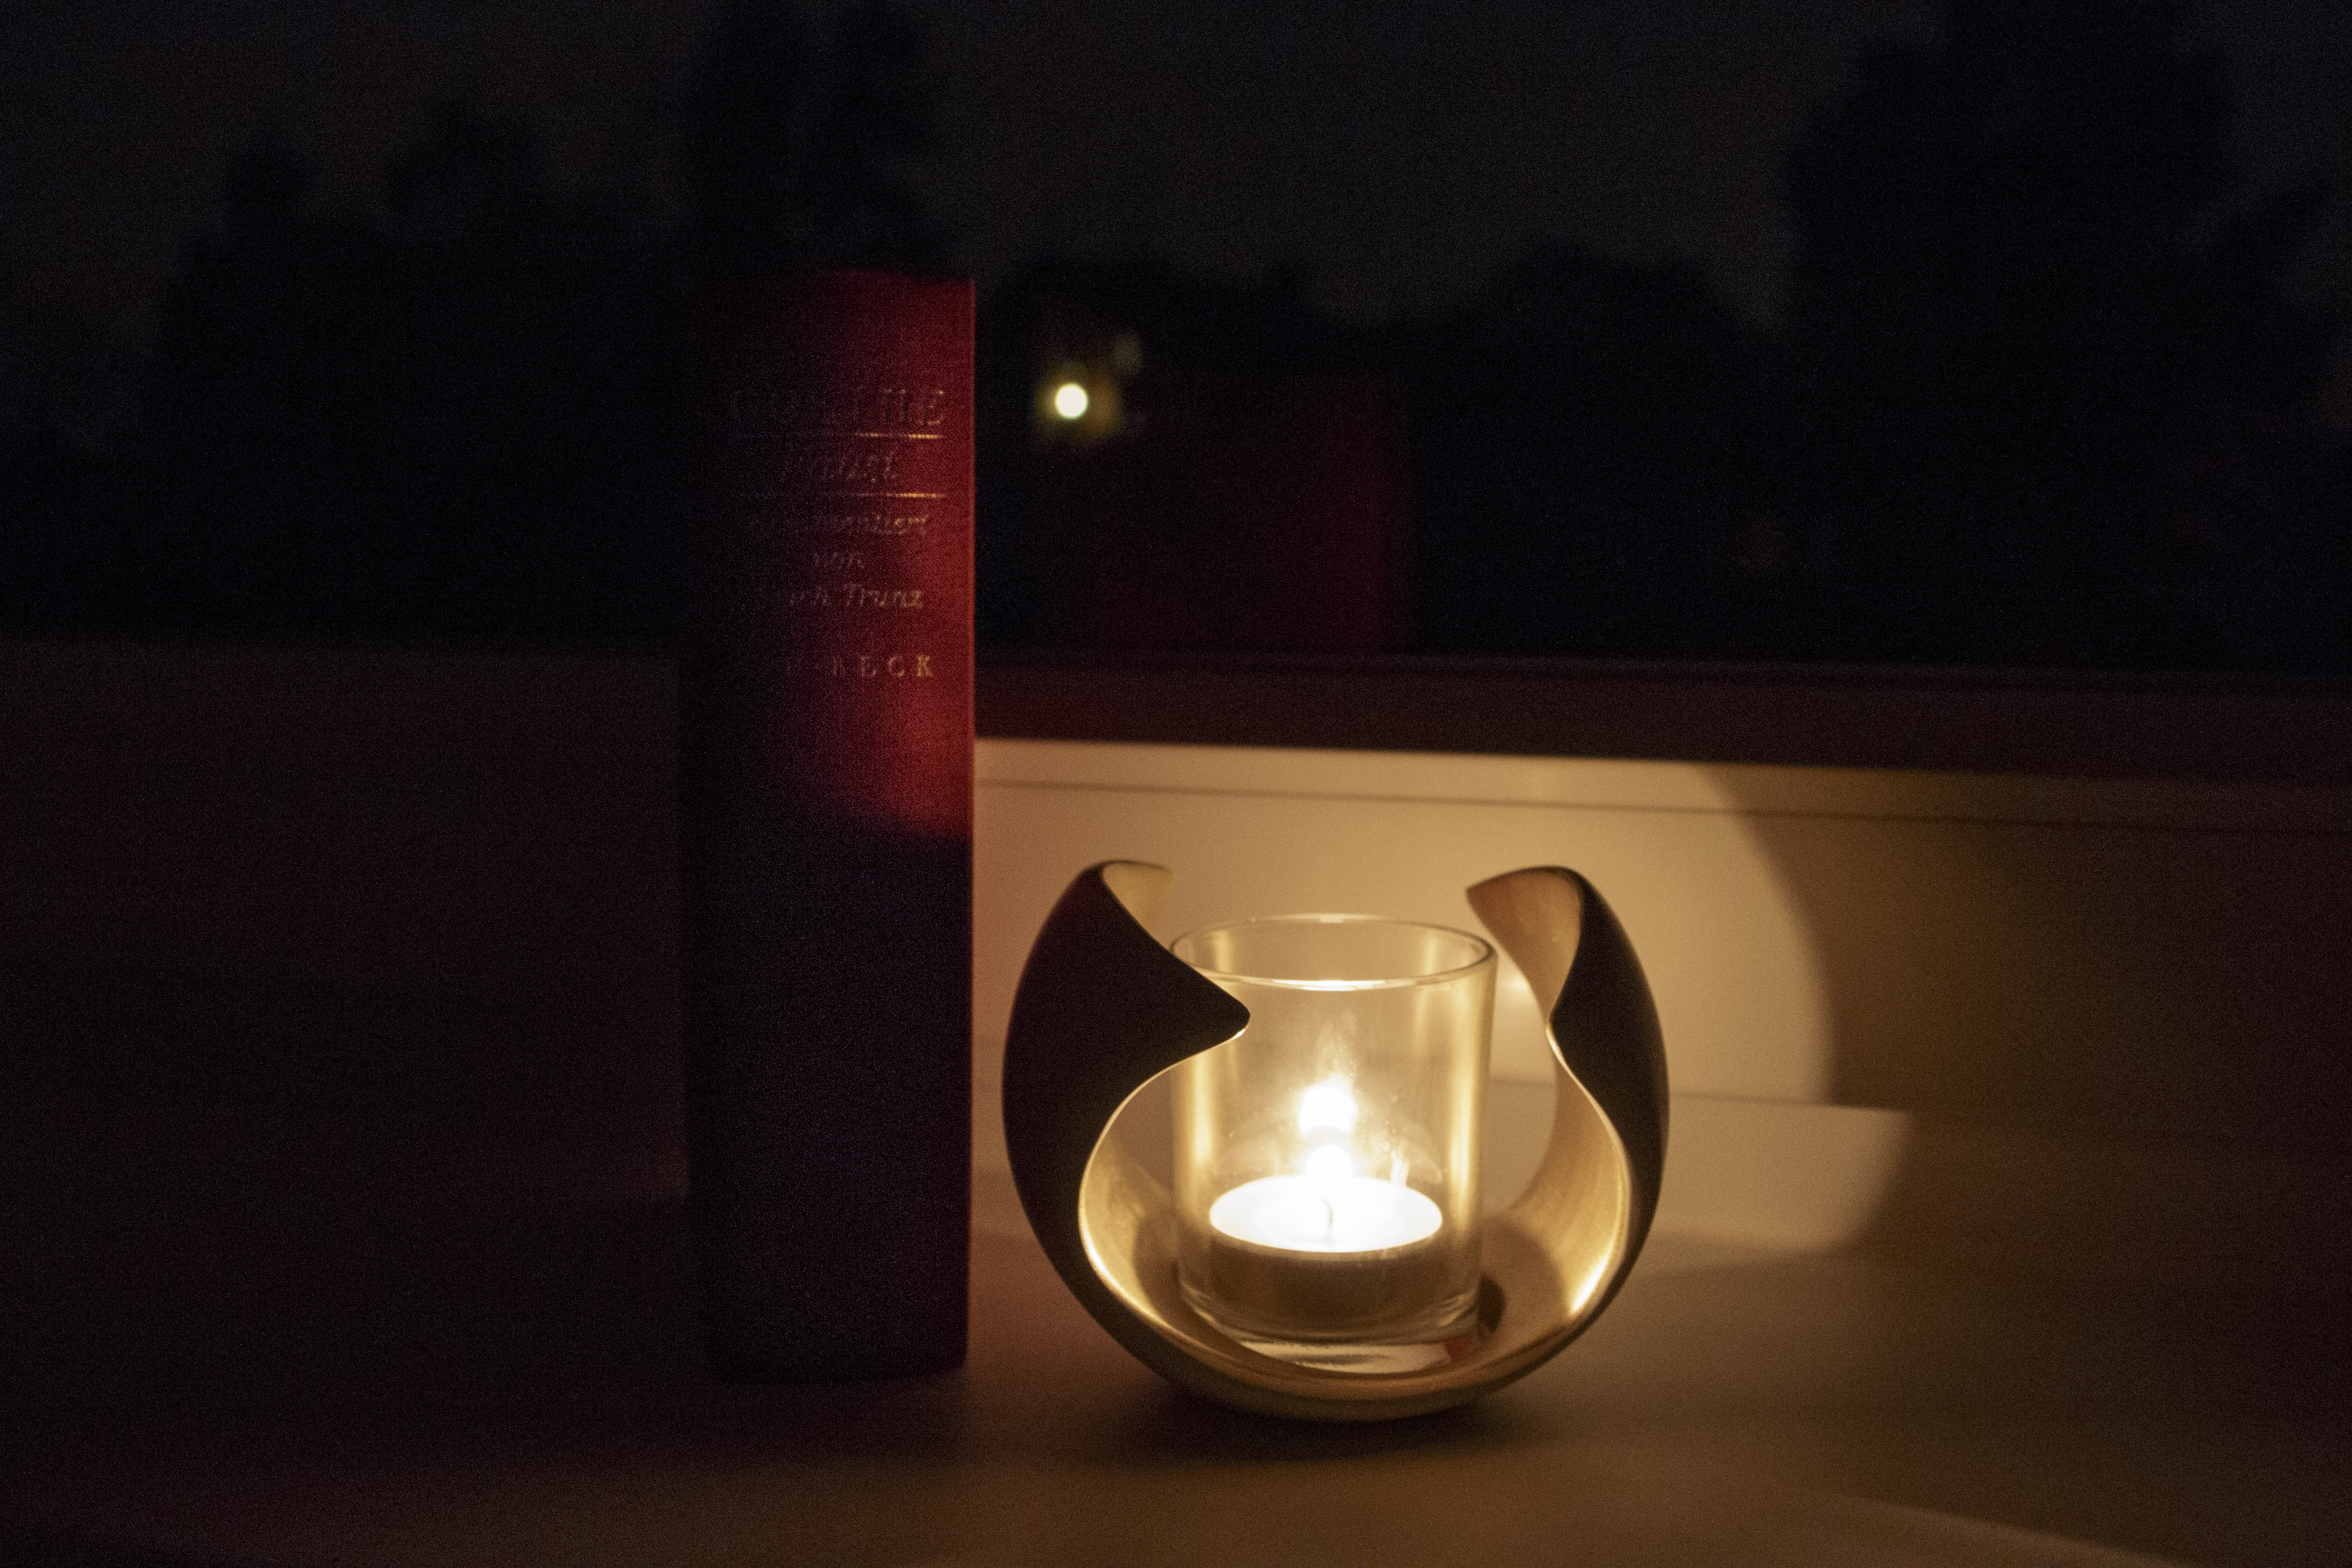
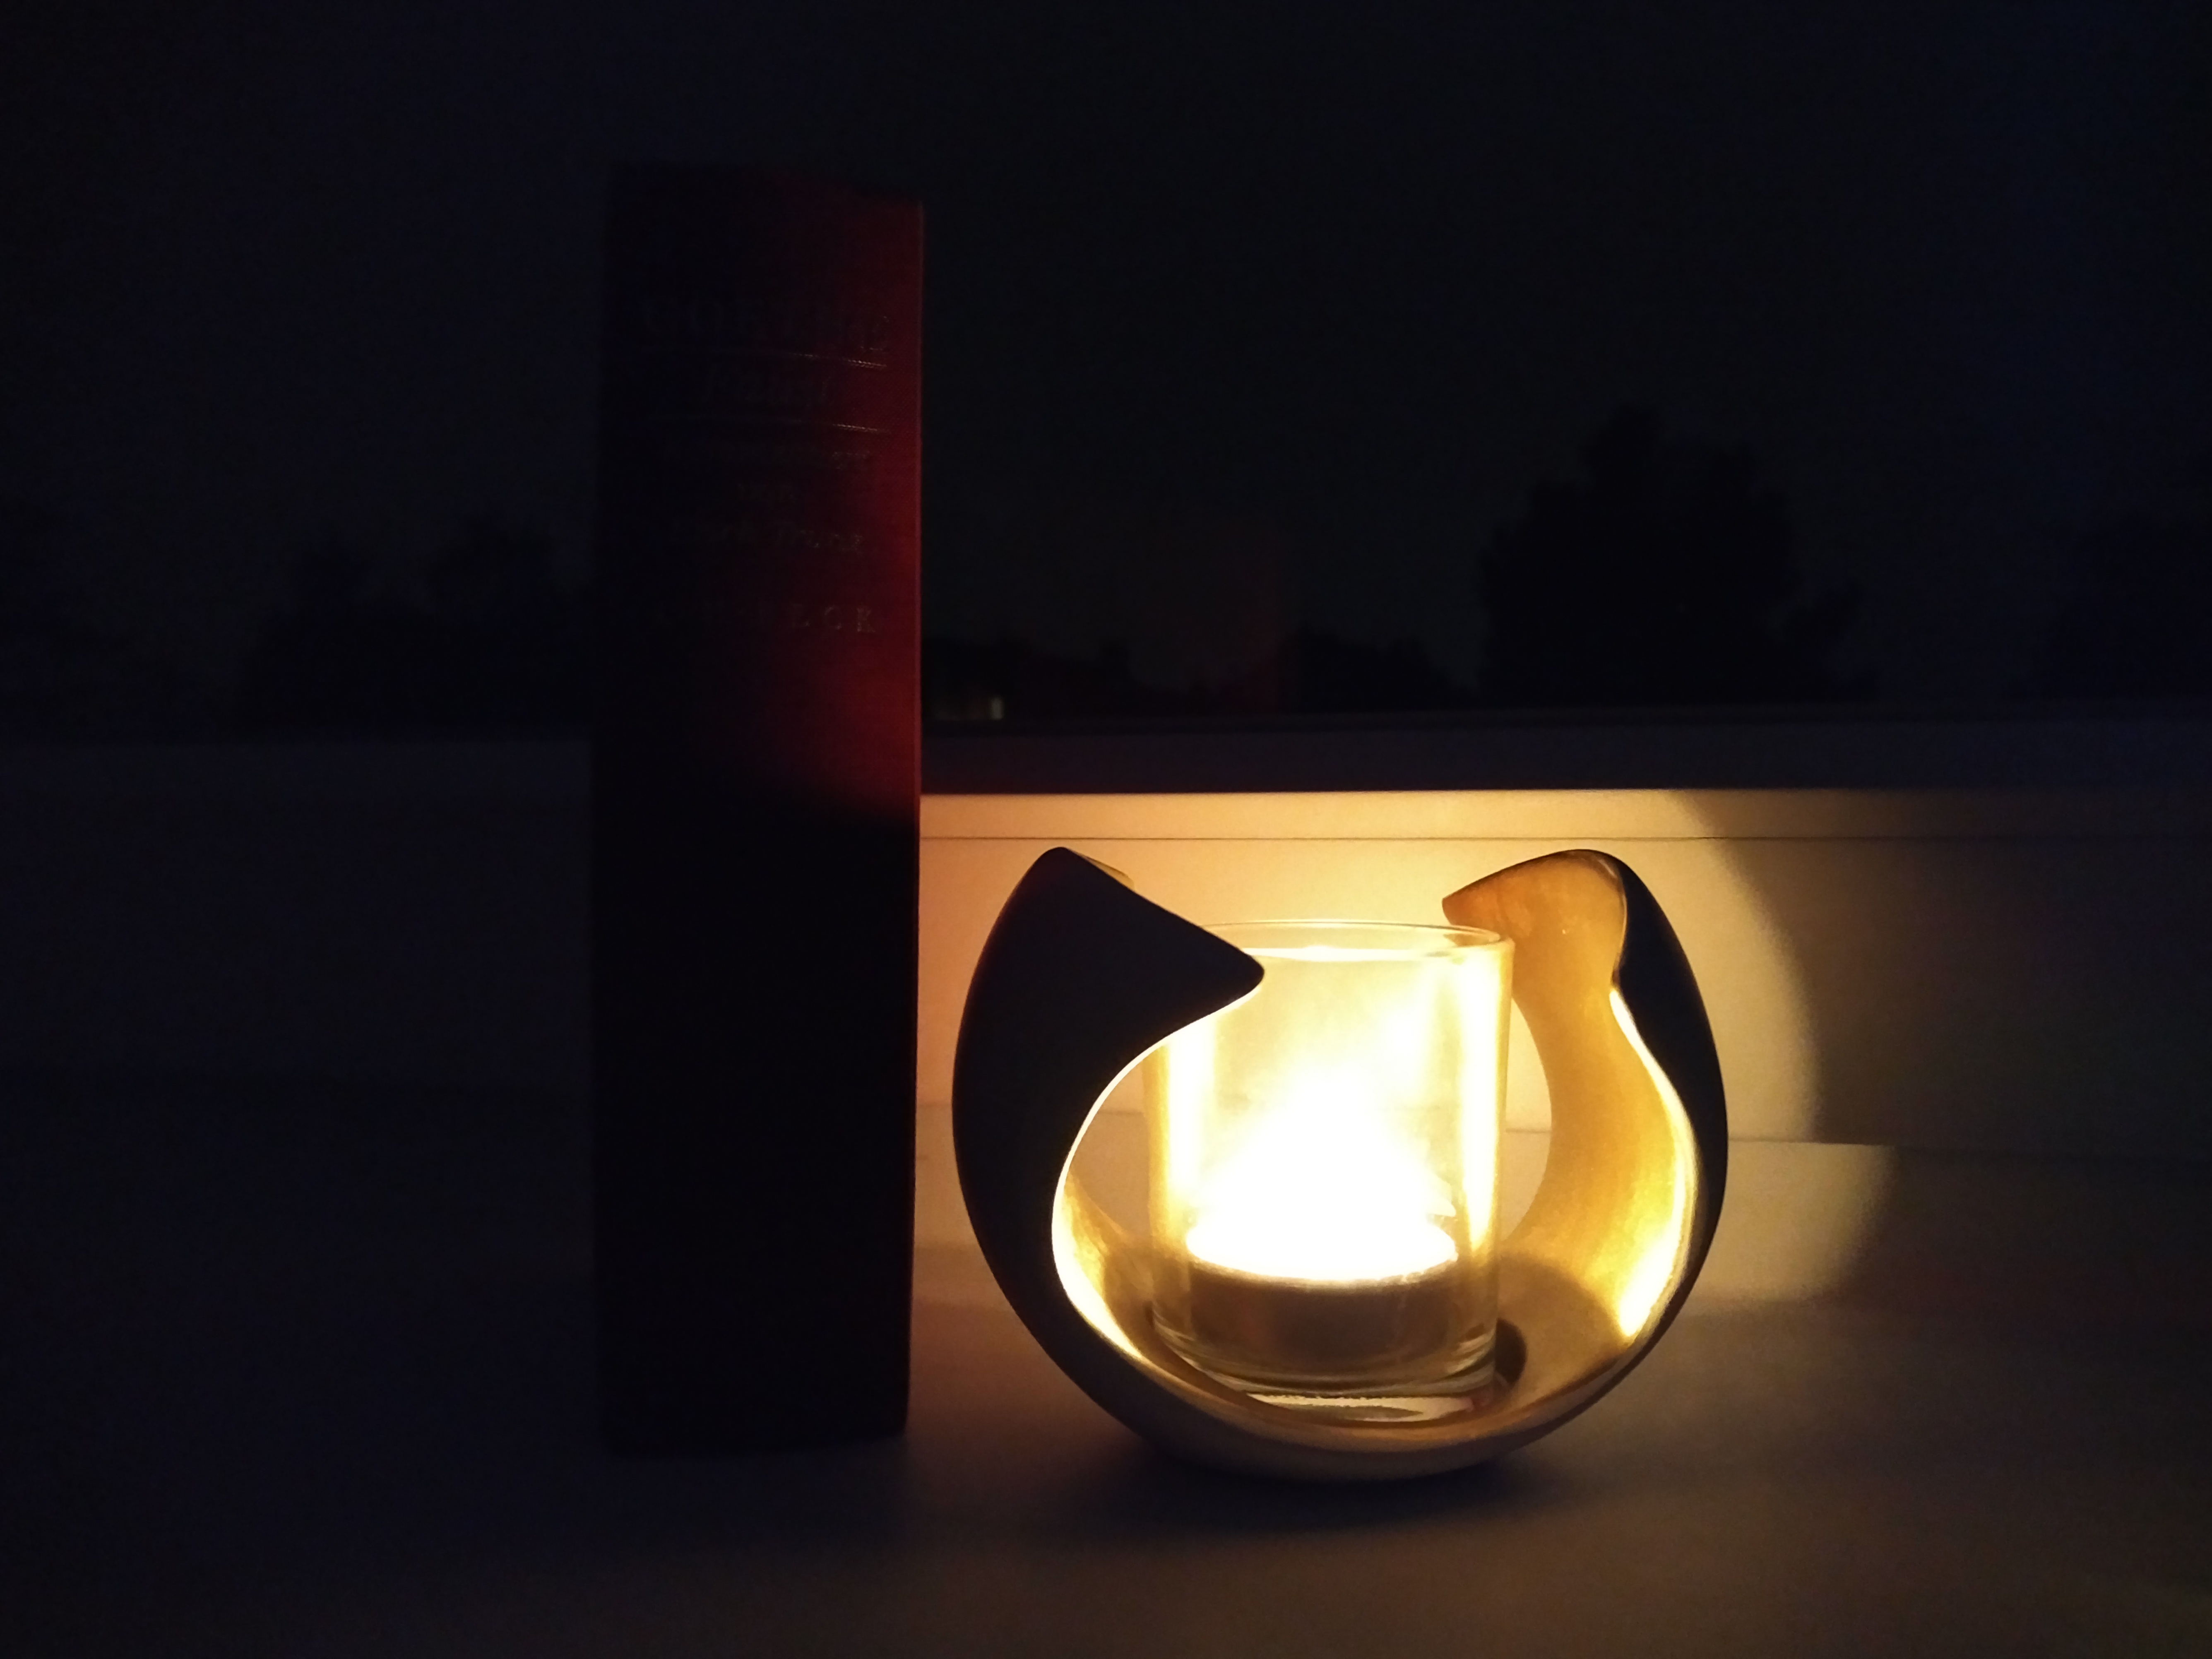
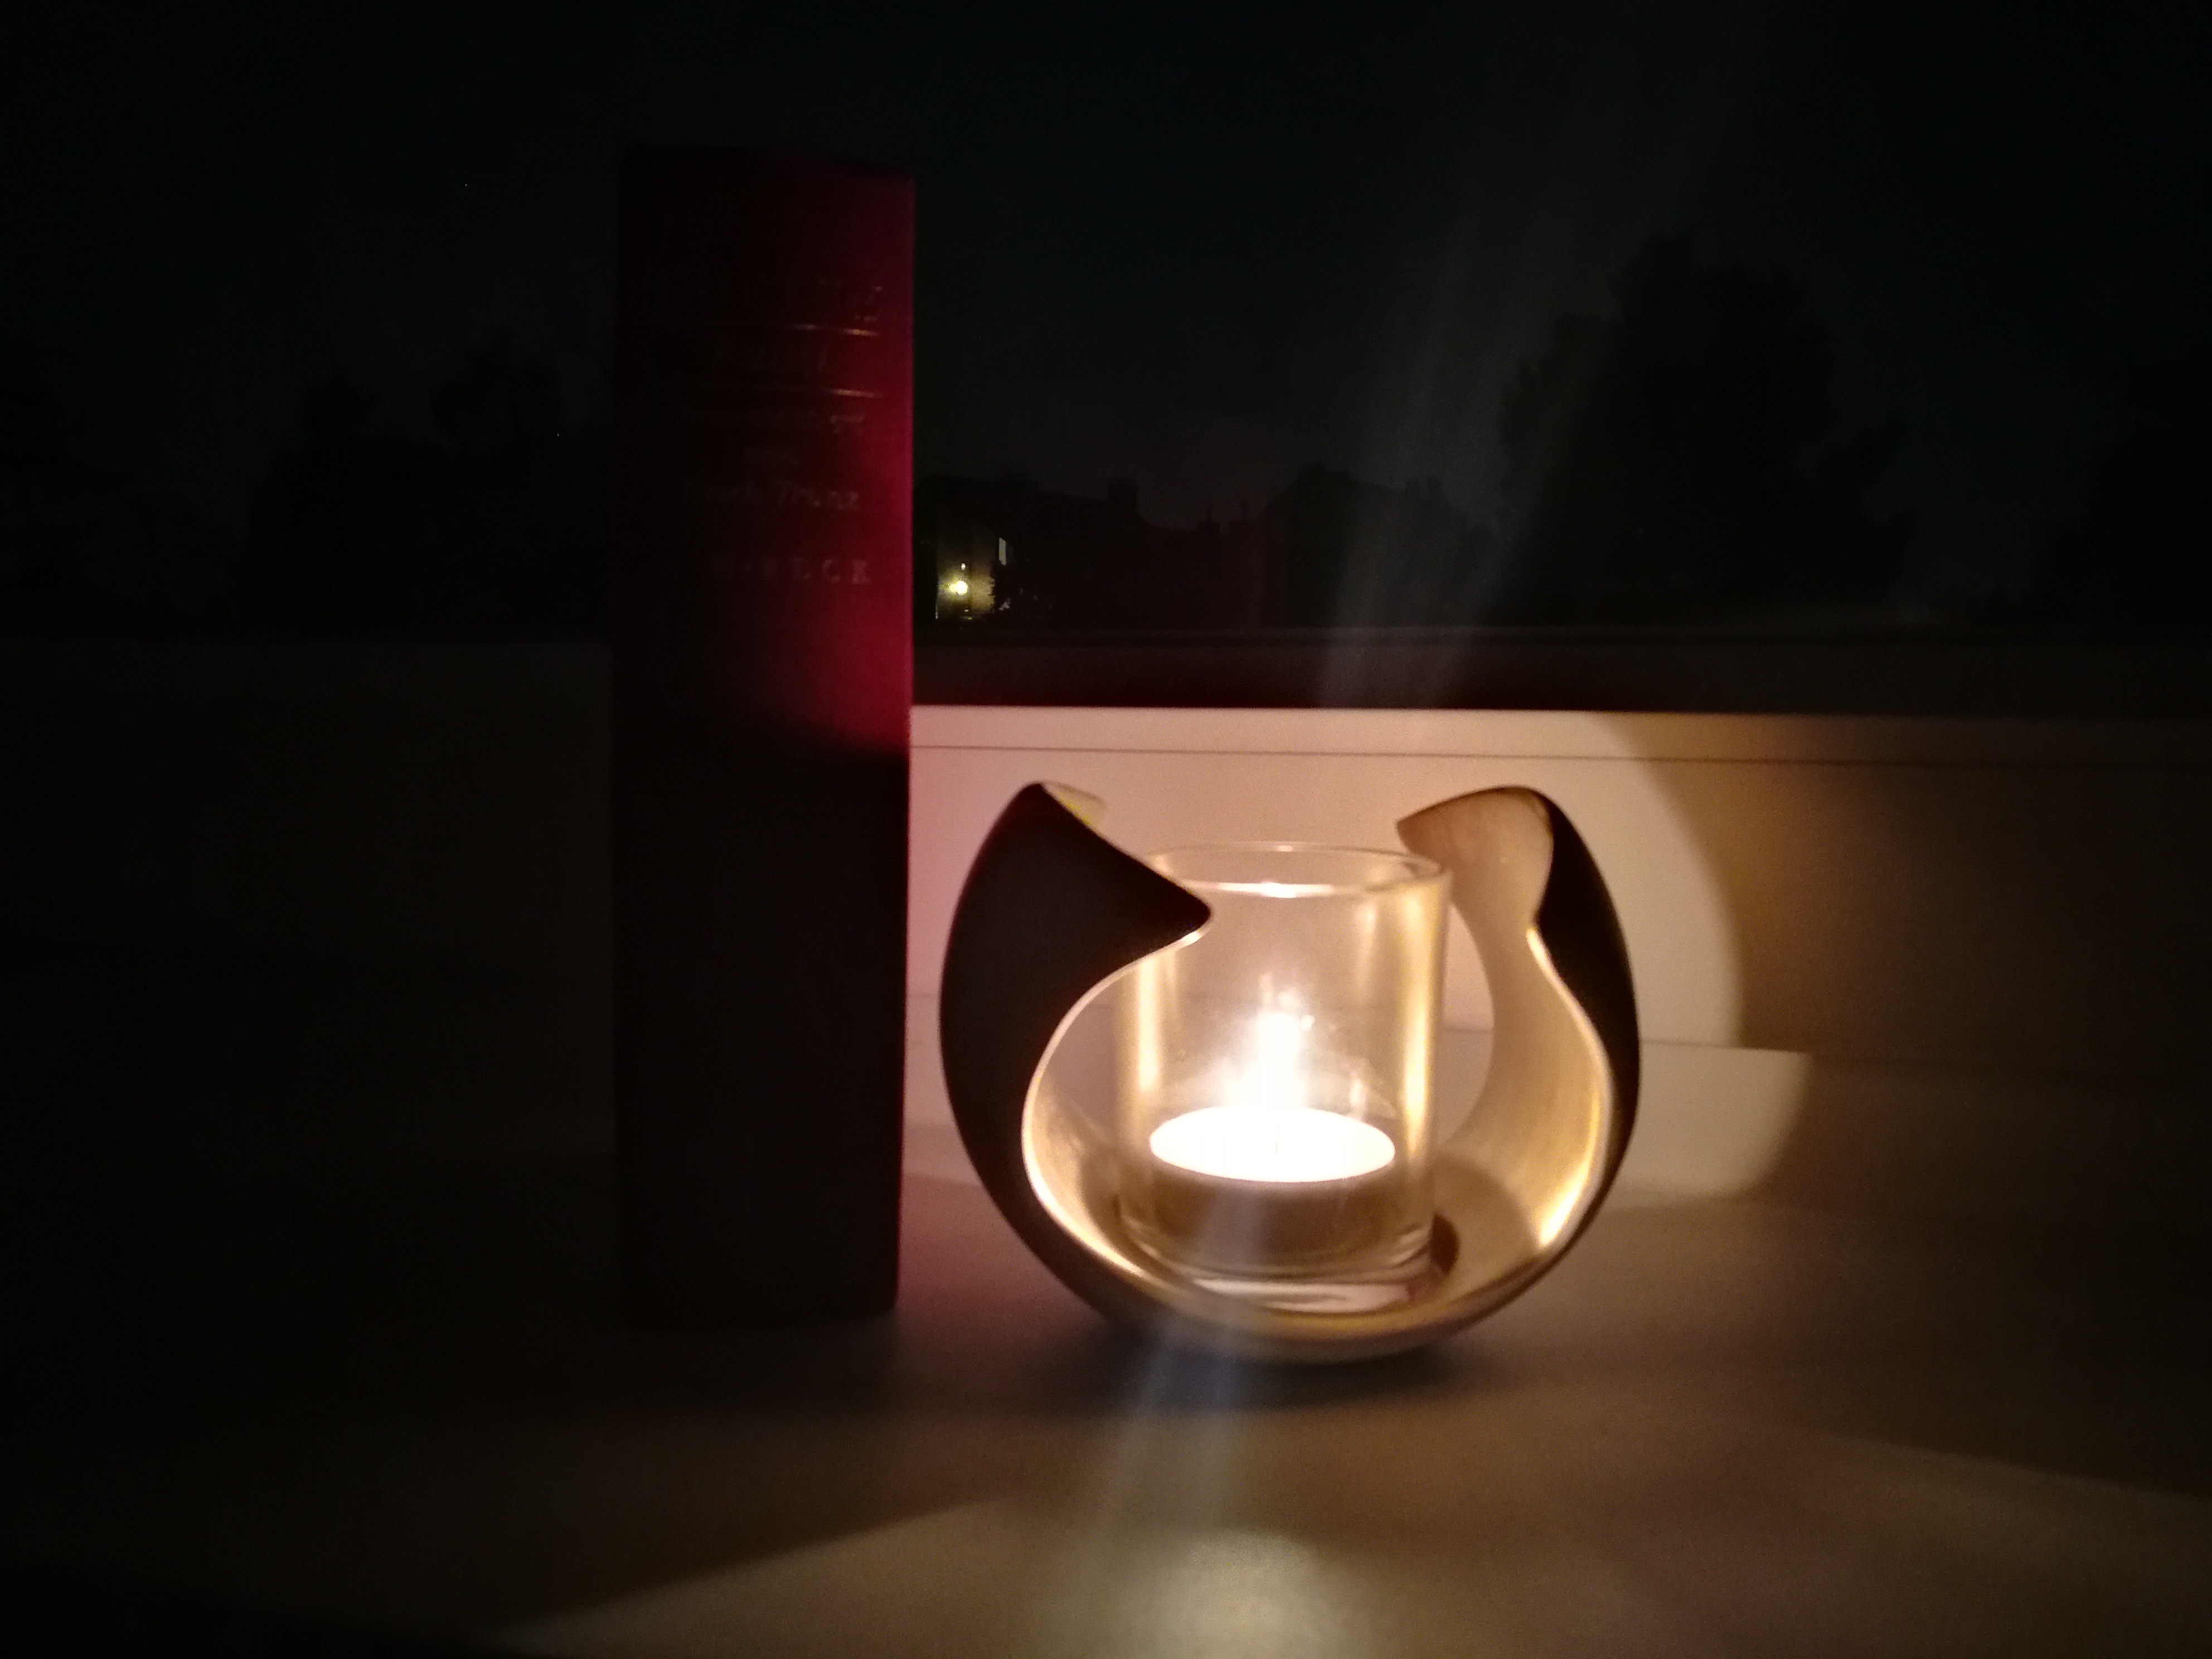
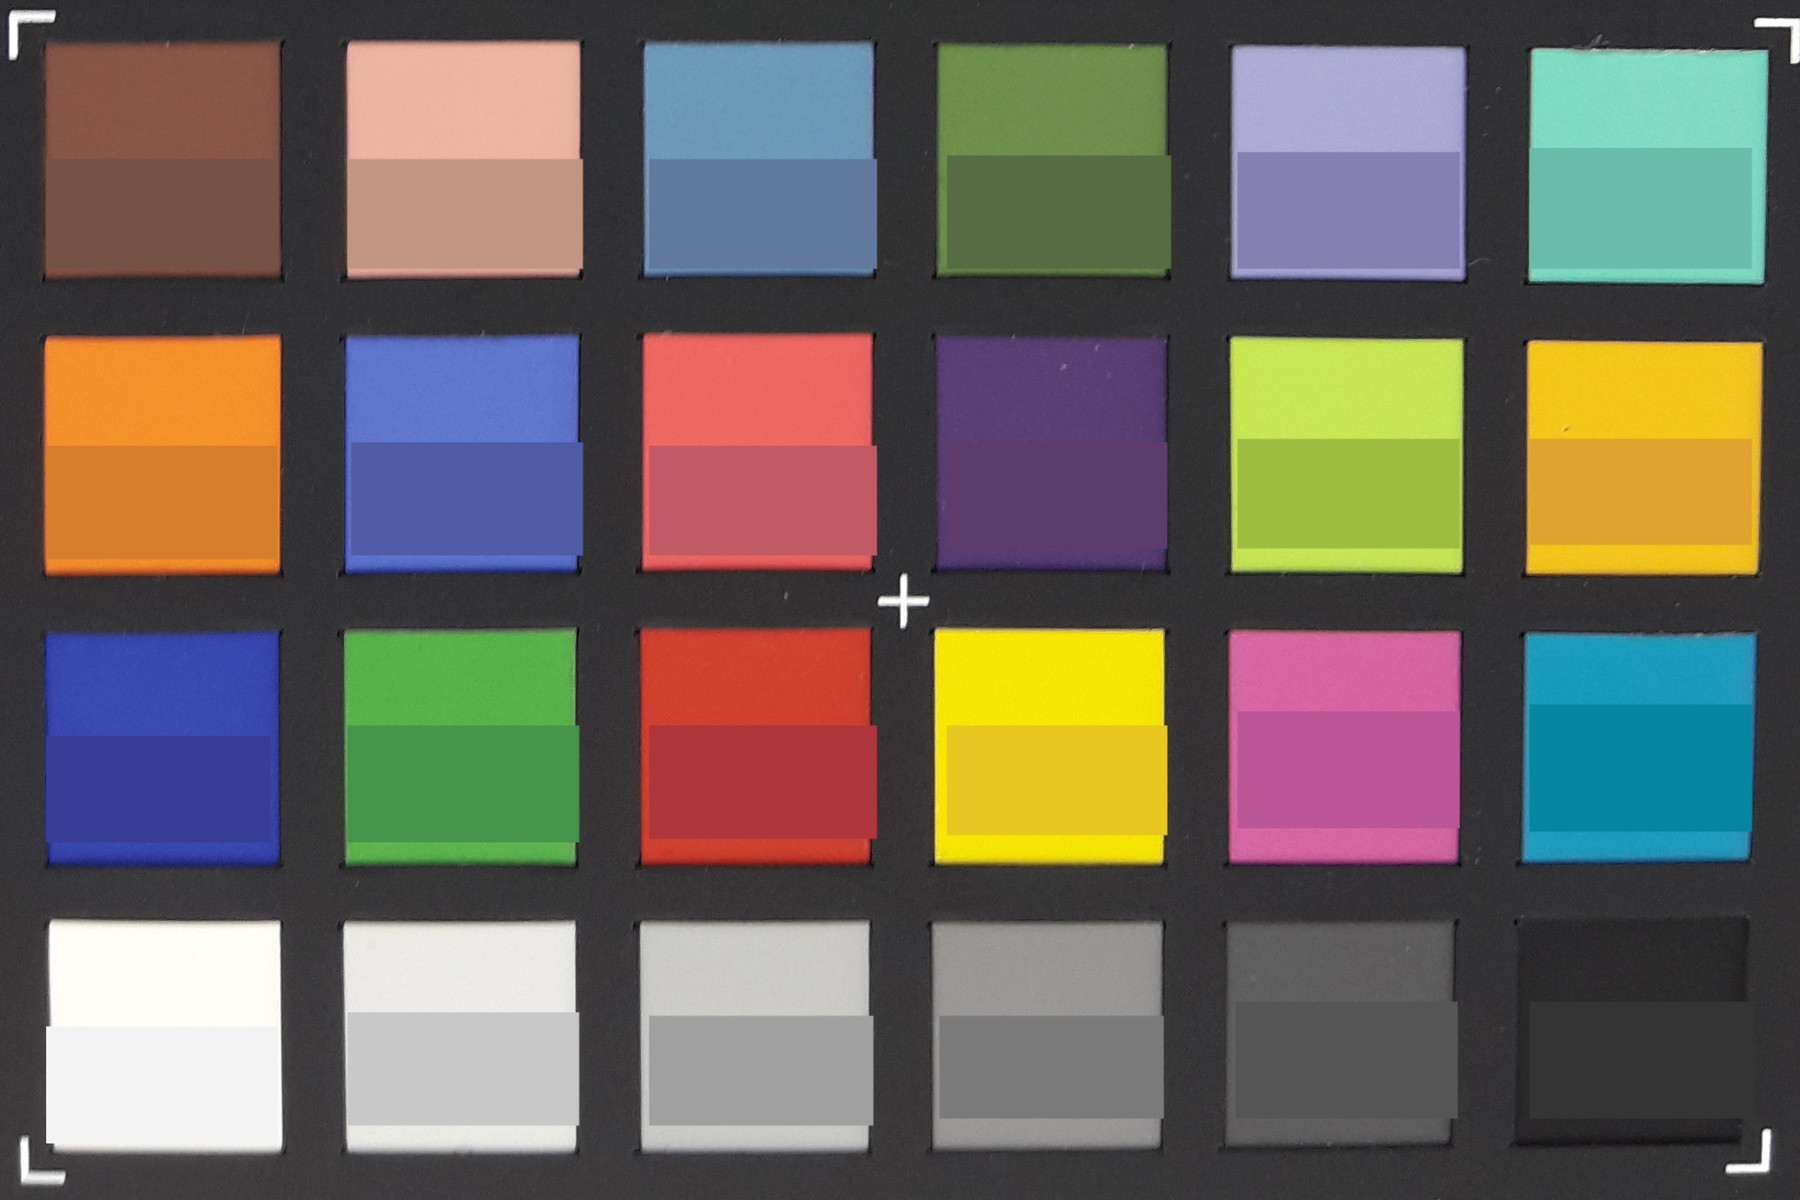
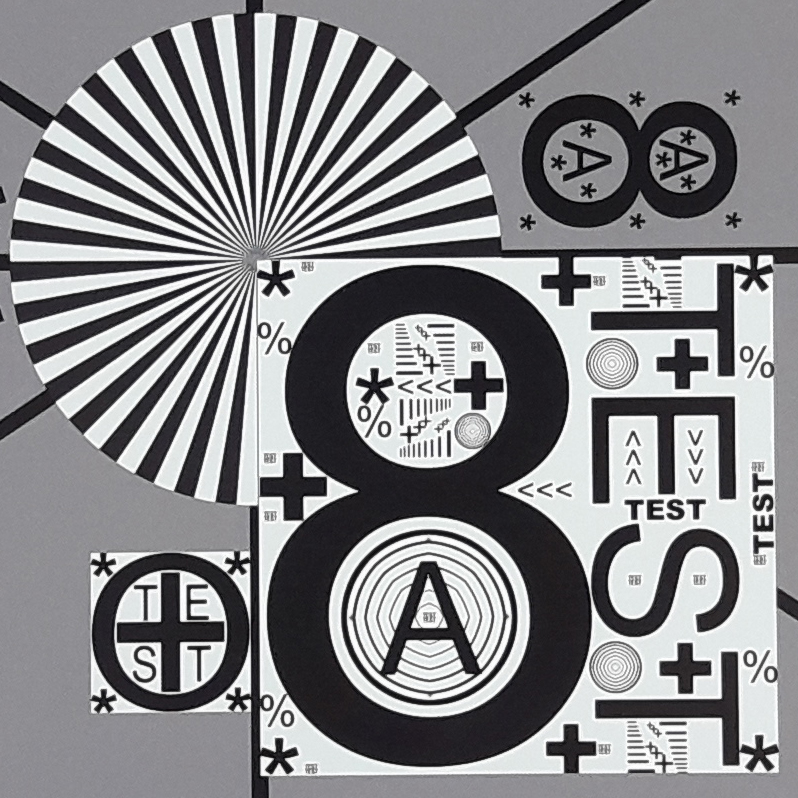
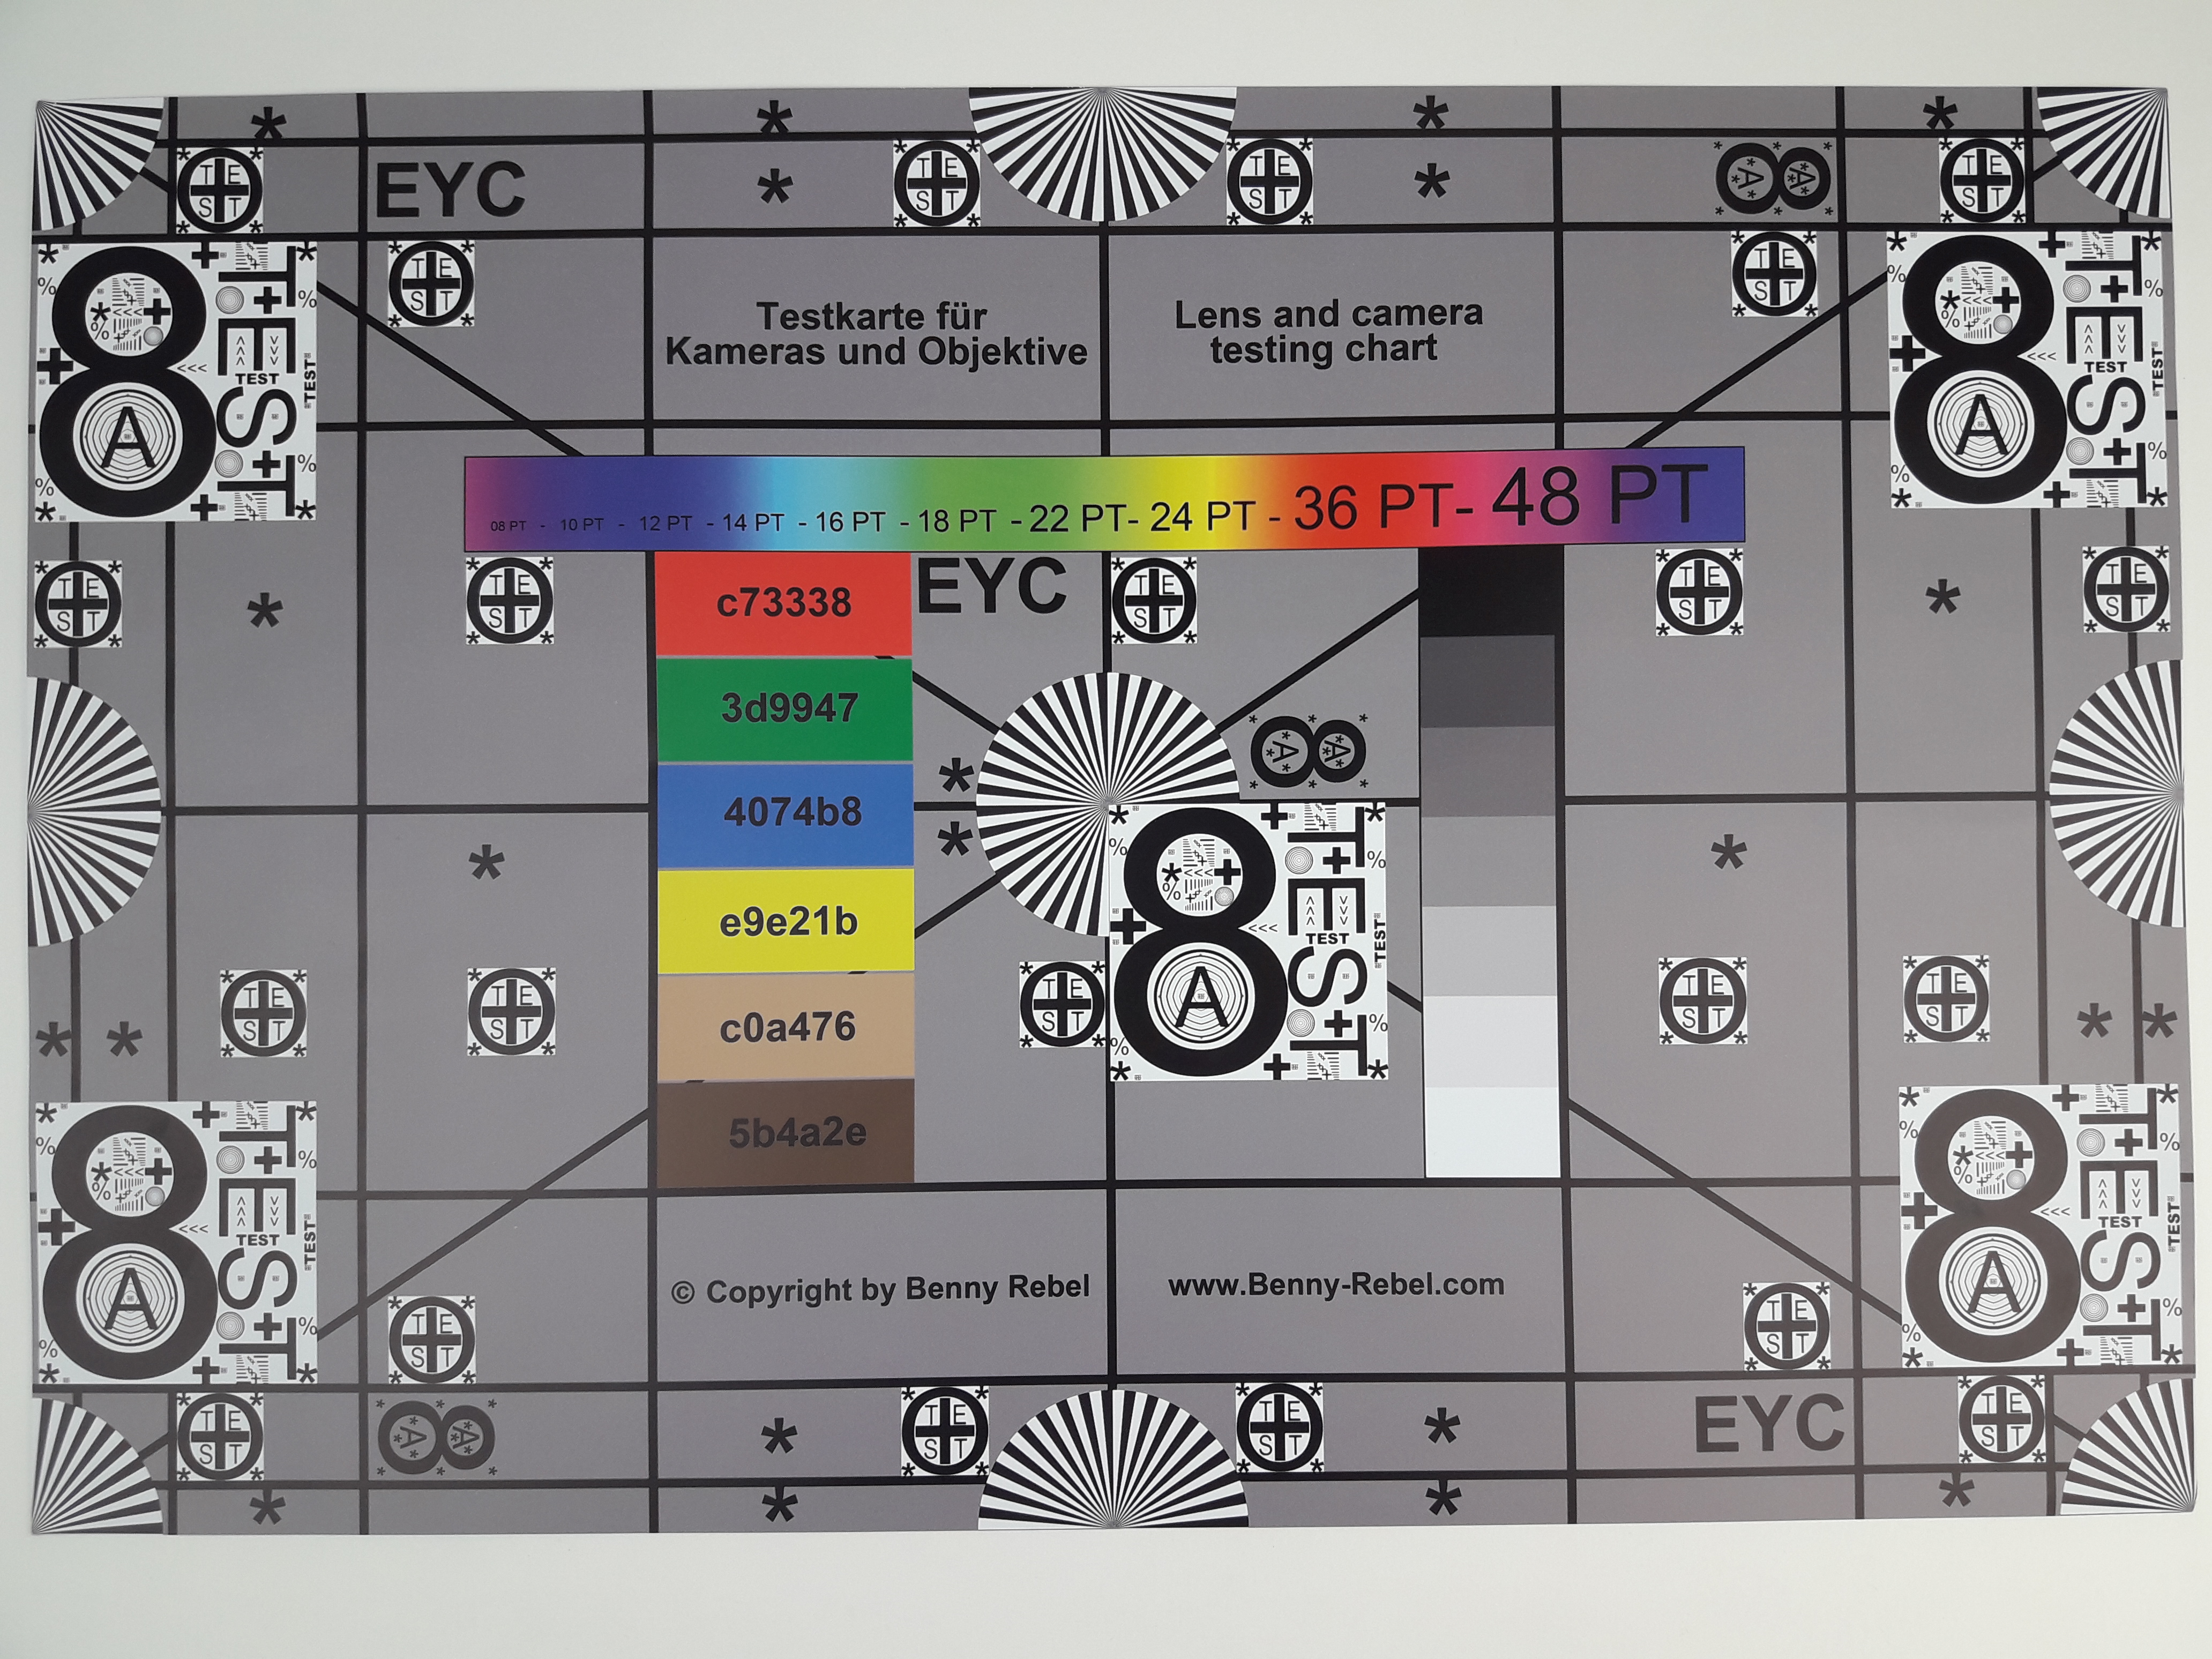
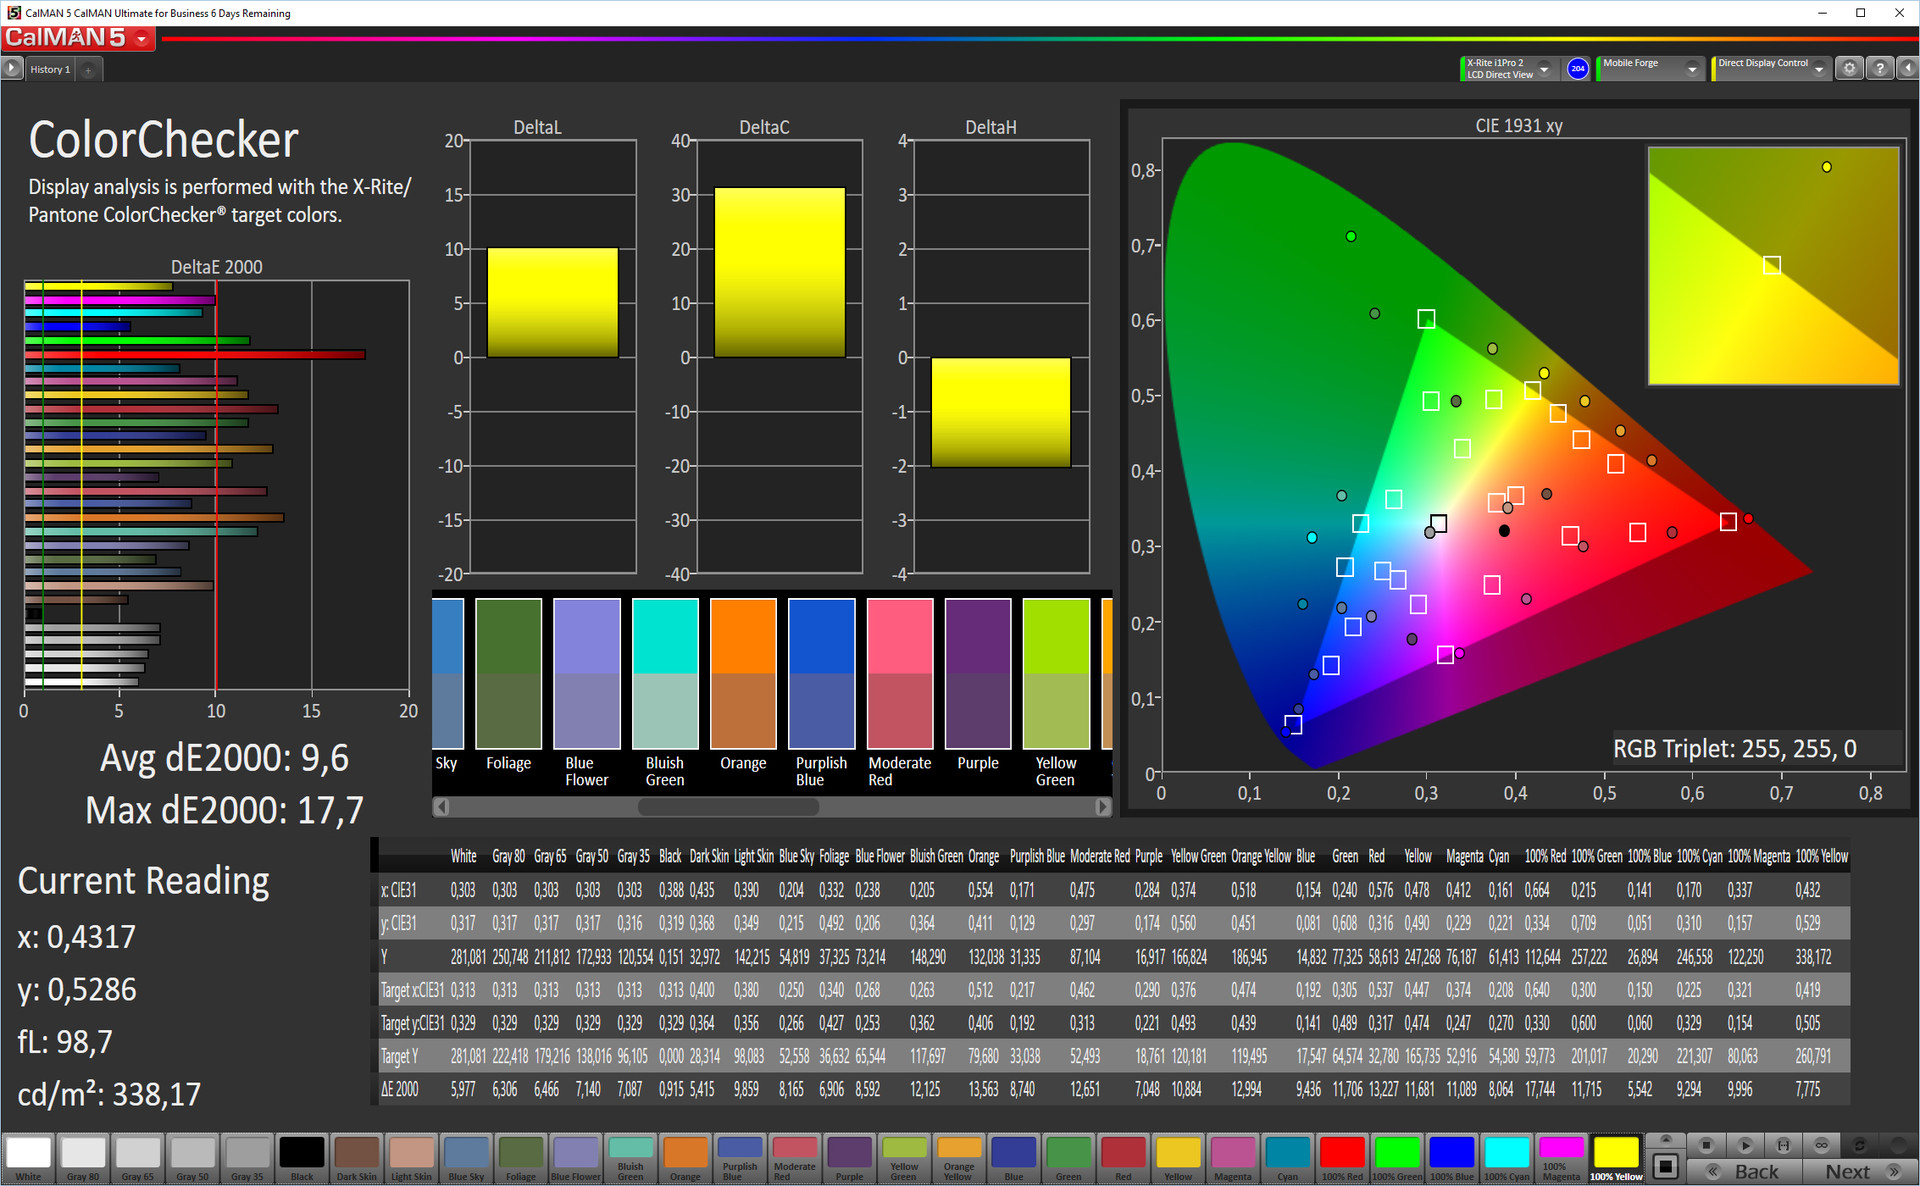
In addition to our test shots, we also test the sharpness and colors under controlled lighting conditions. For this we take a picture of the ColorChecker passport and our test chart. We do not edit the pictures. Colors reproduced by the Galaxy J7 (2016) are a touch too strong and bright. The test chart is sharp in the middle, but the brightness and sharpness decrease towards the edges. However, this can also happen with professional cameras.
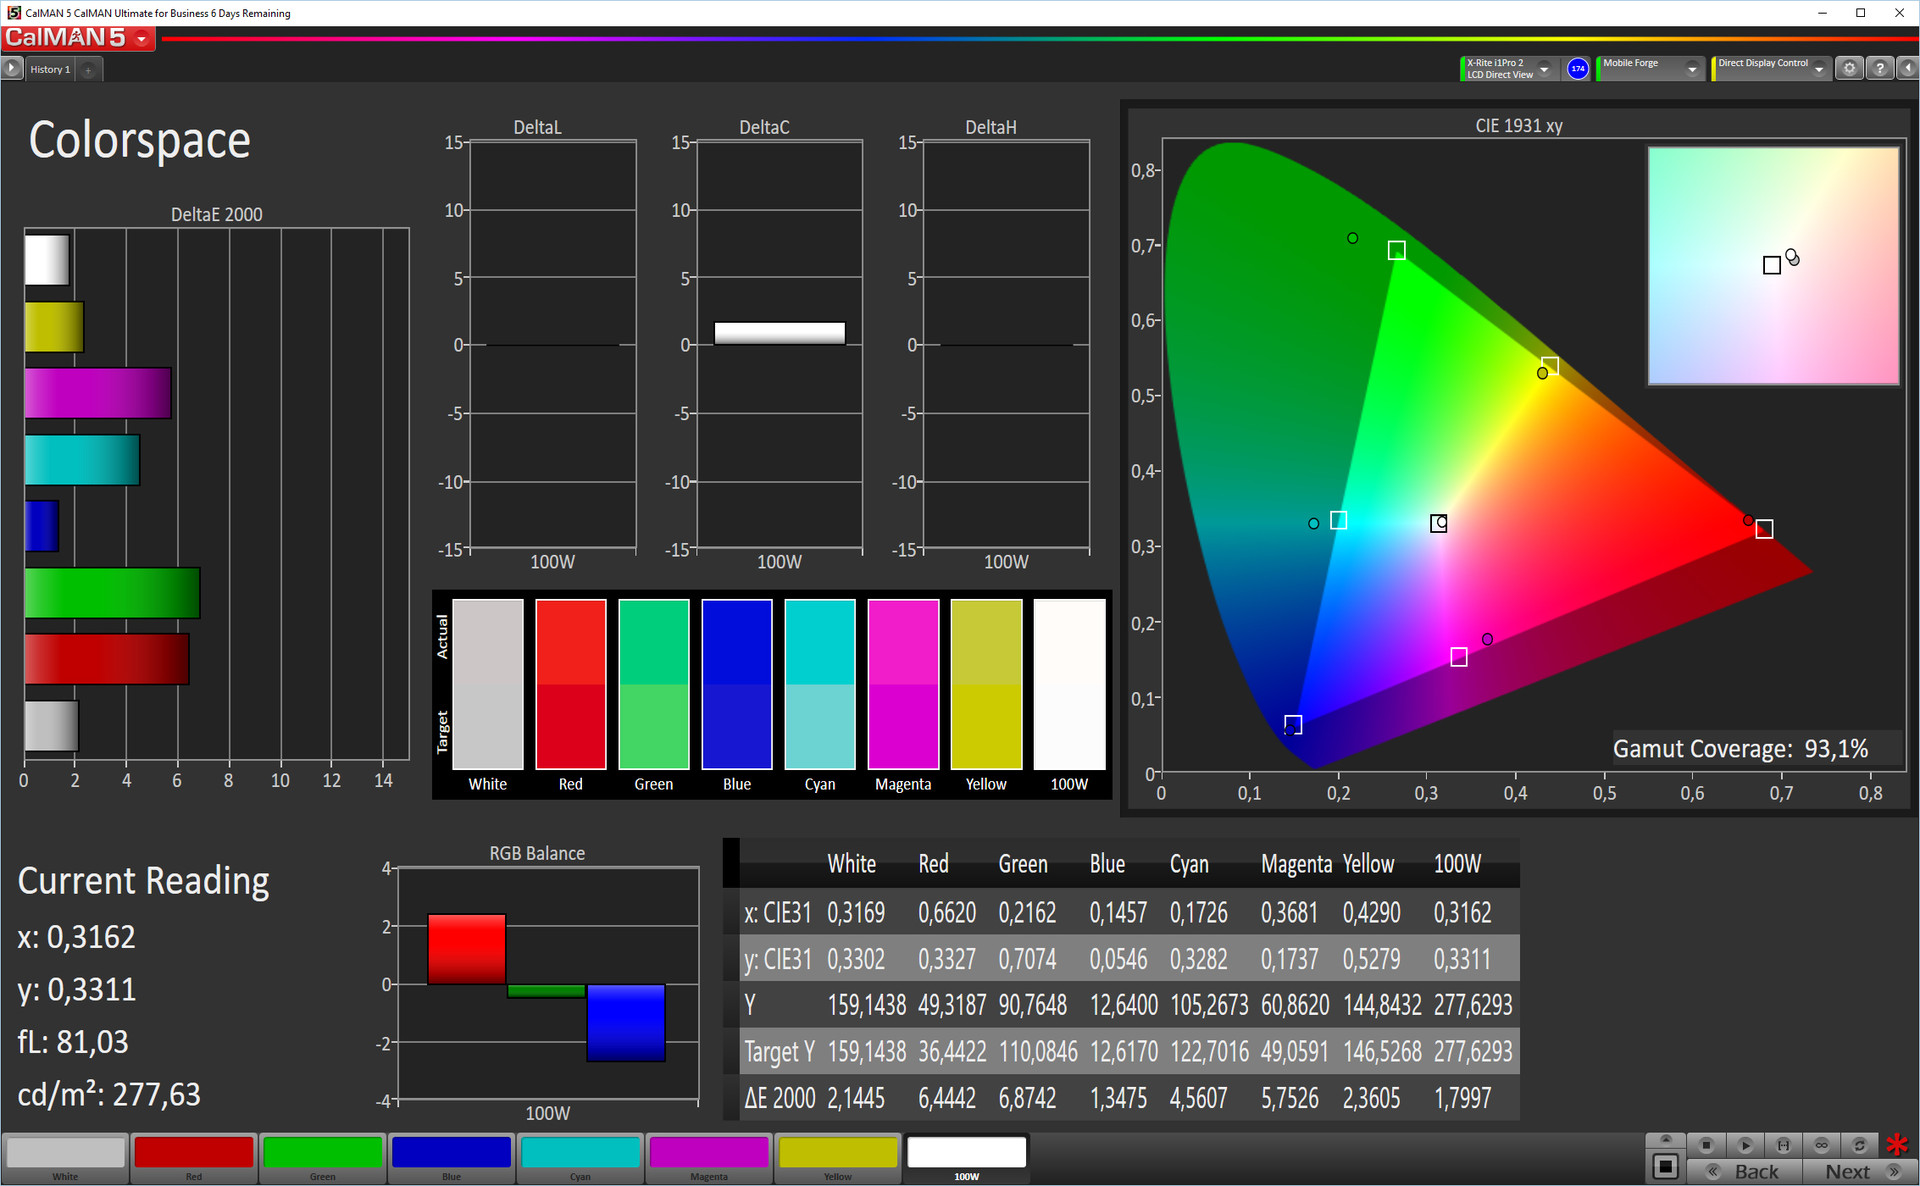
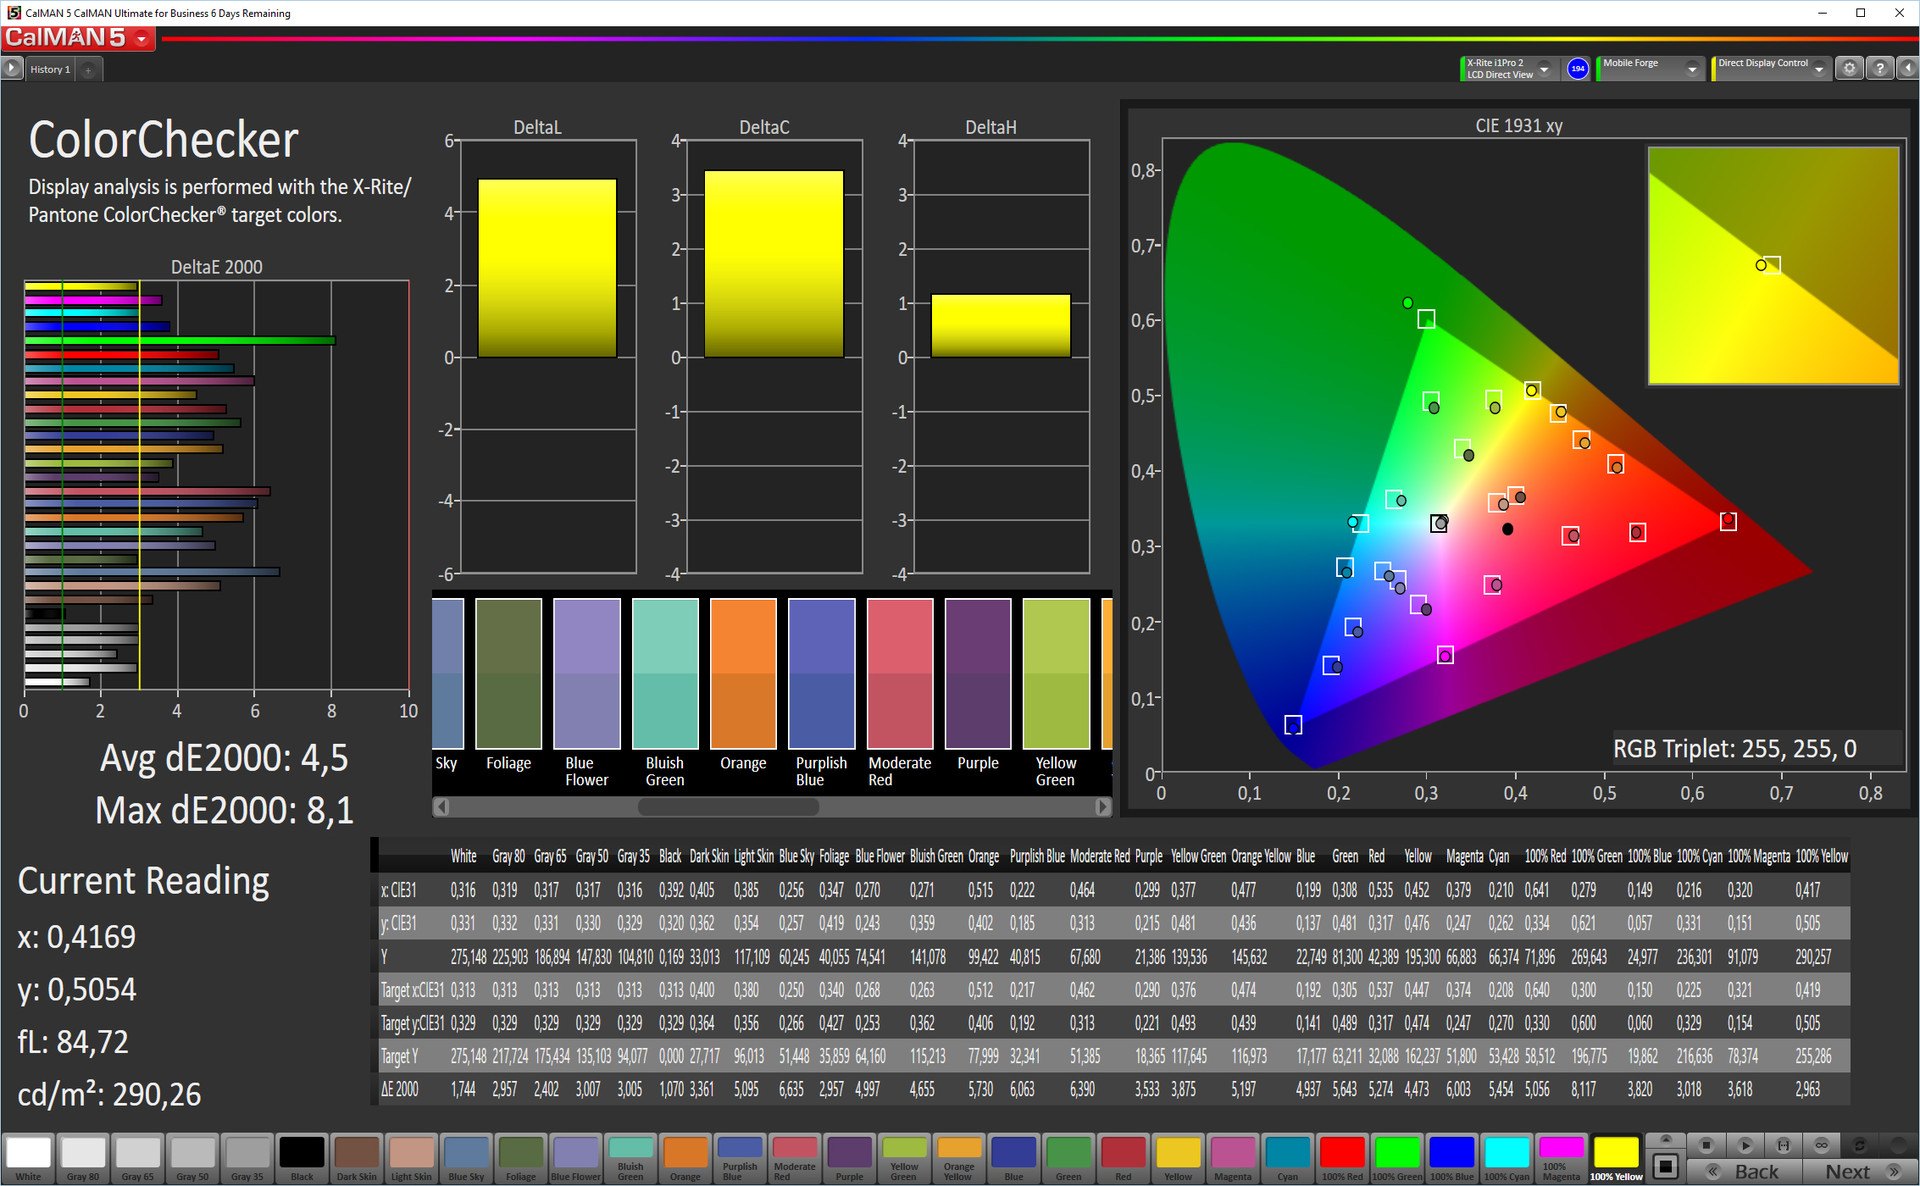
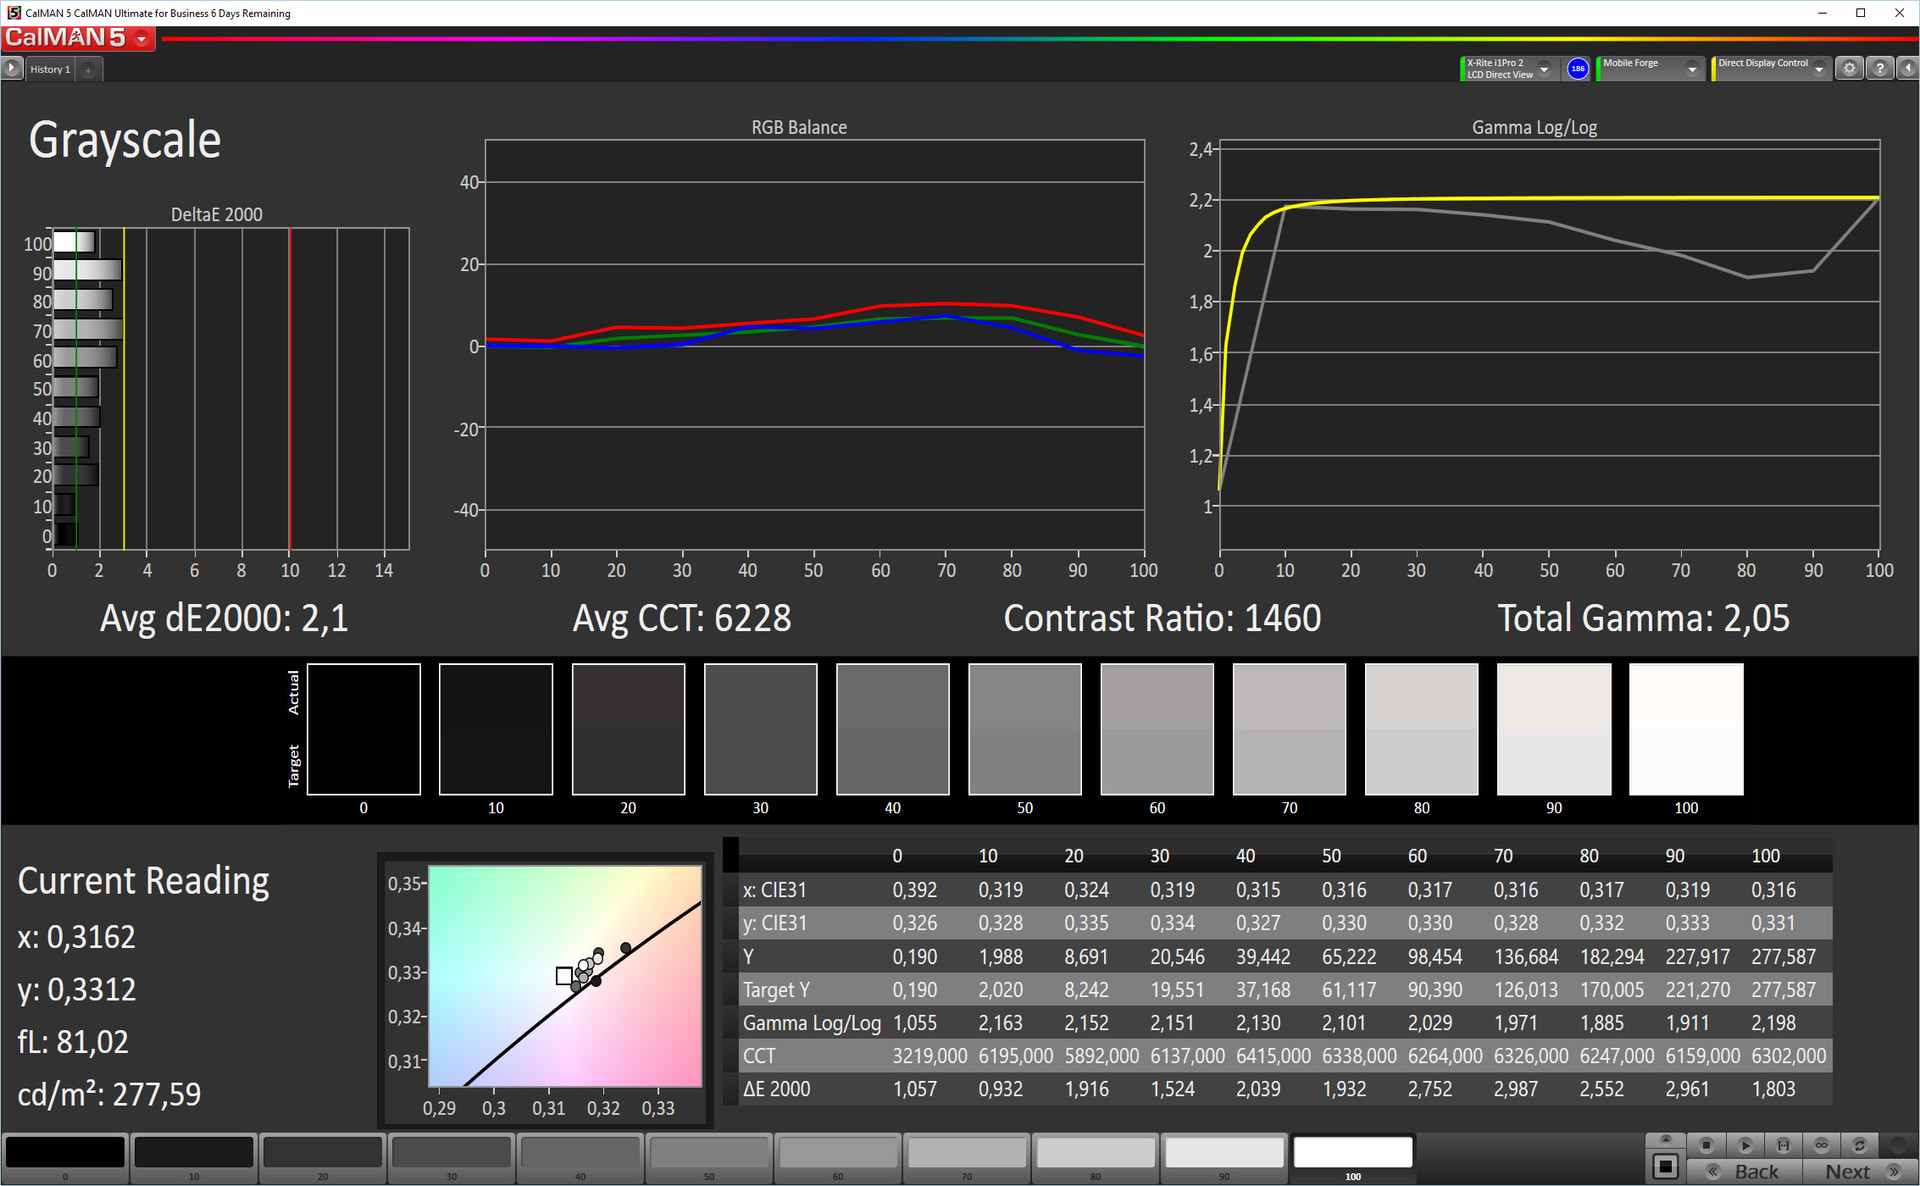
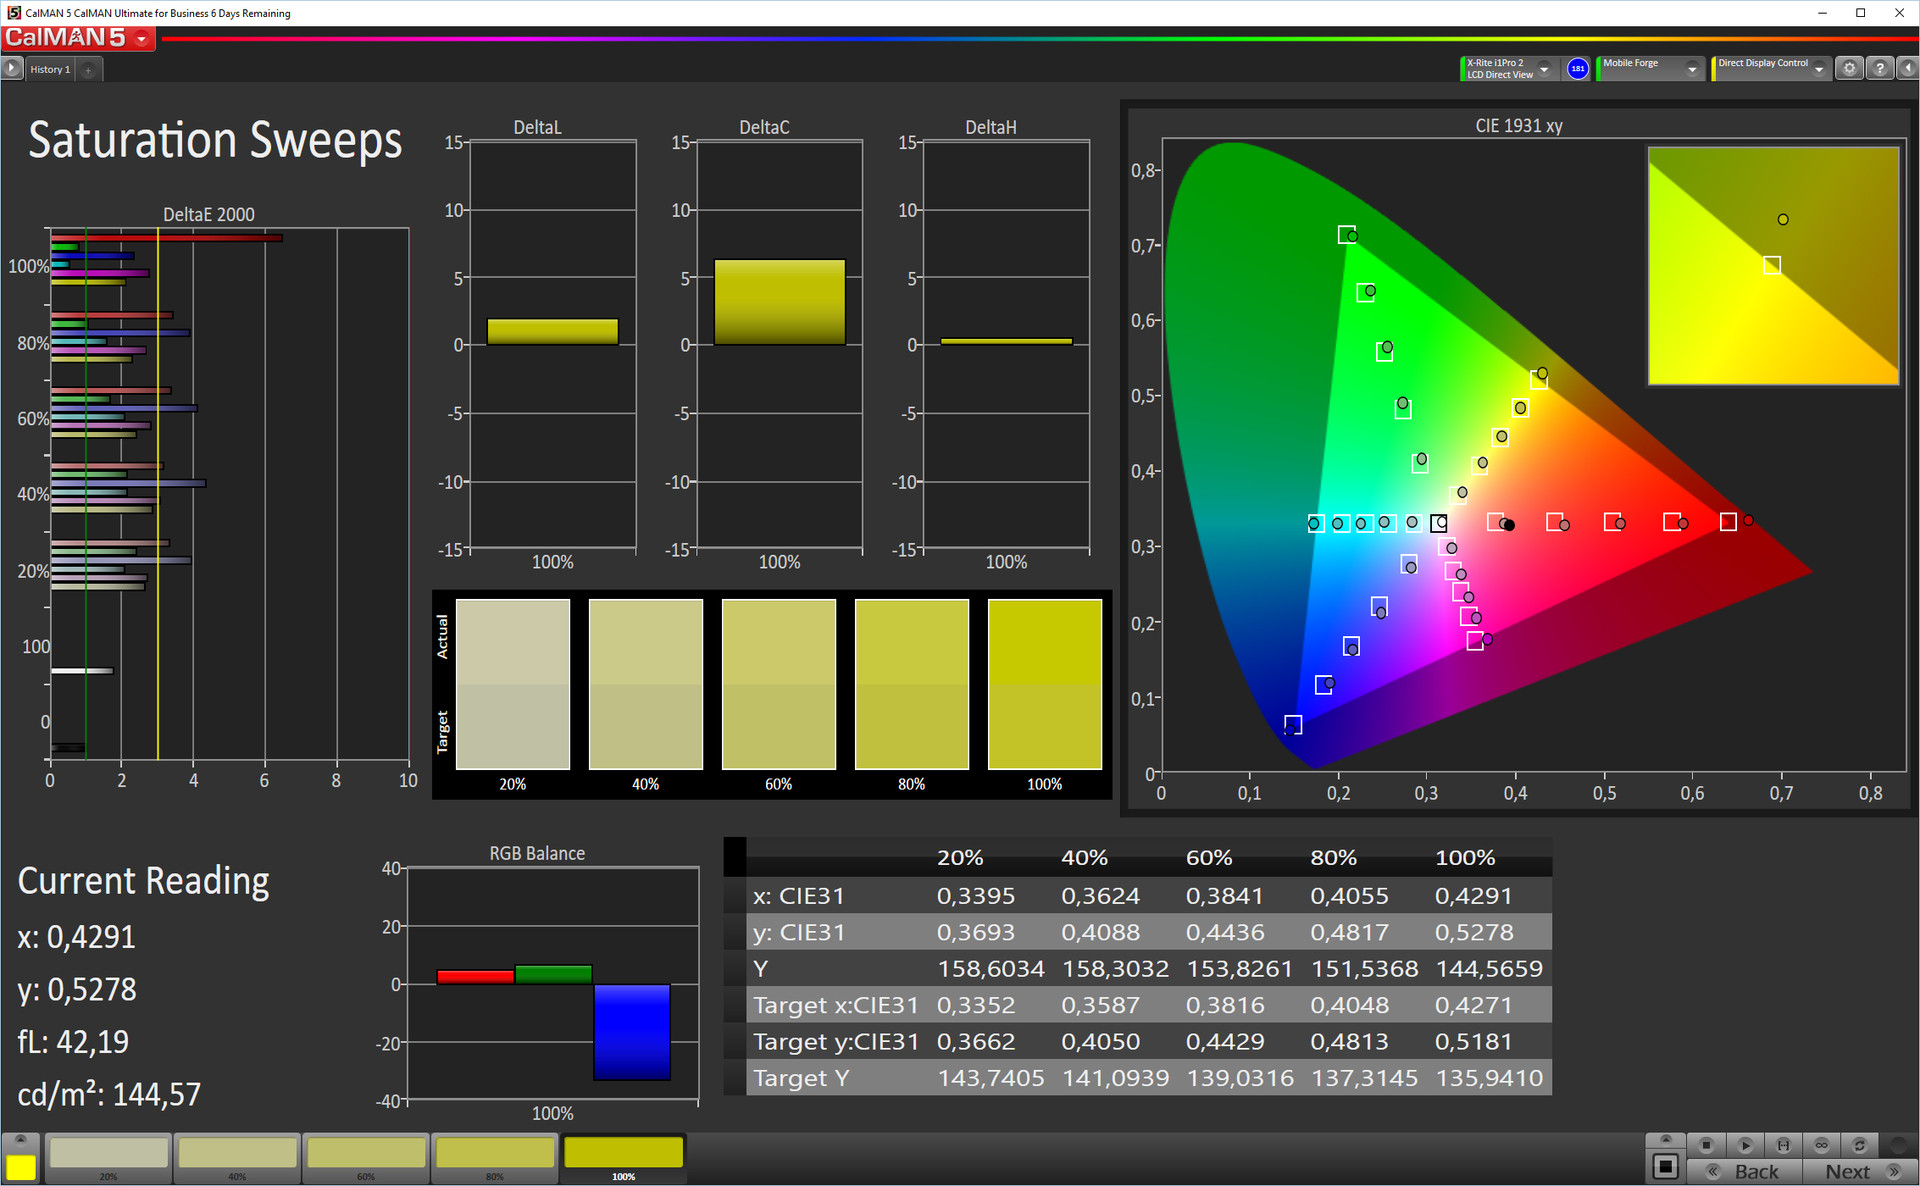
Display
| |||||||||||||||||||||||||
Brightness Distribution: 91 %
Center on Battery: 287 cd/m²
Contrast: ∞:1 (Black: 0 cd/m²)
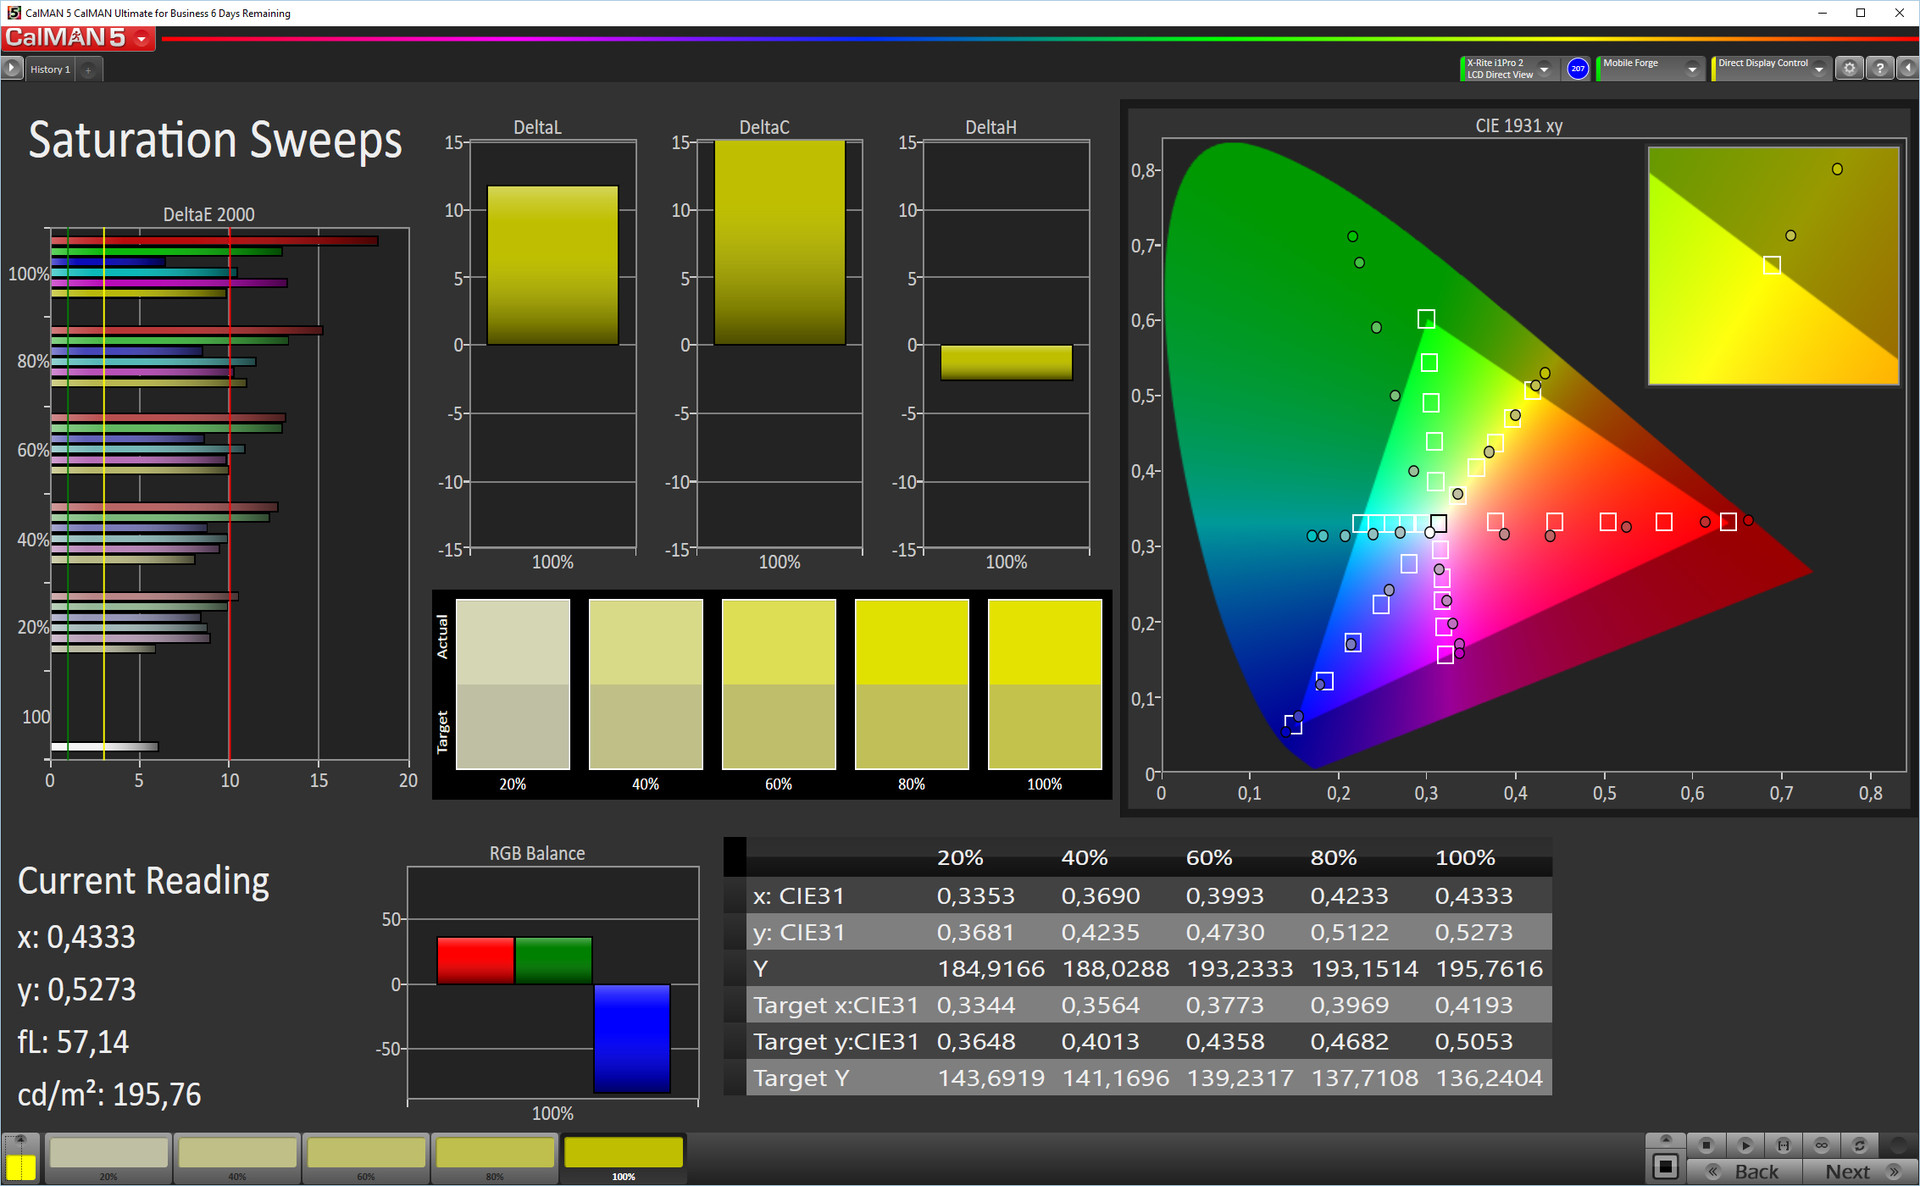
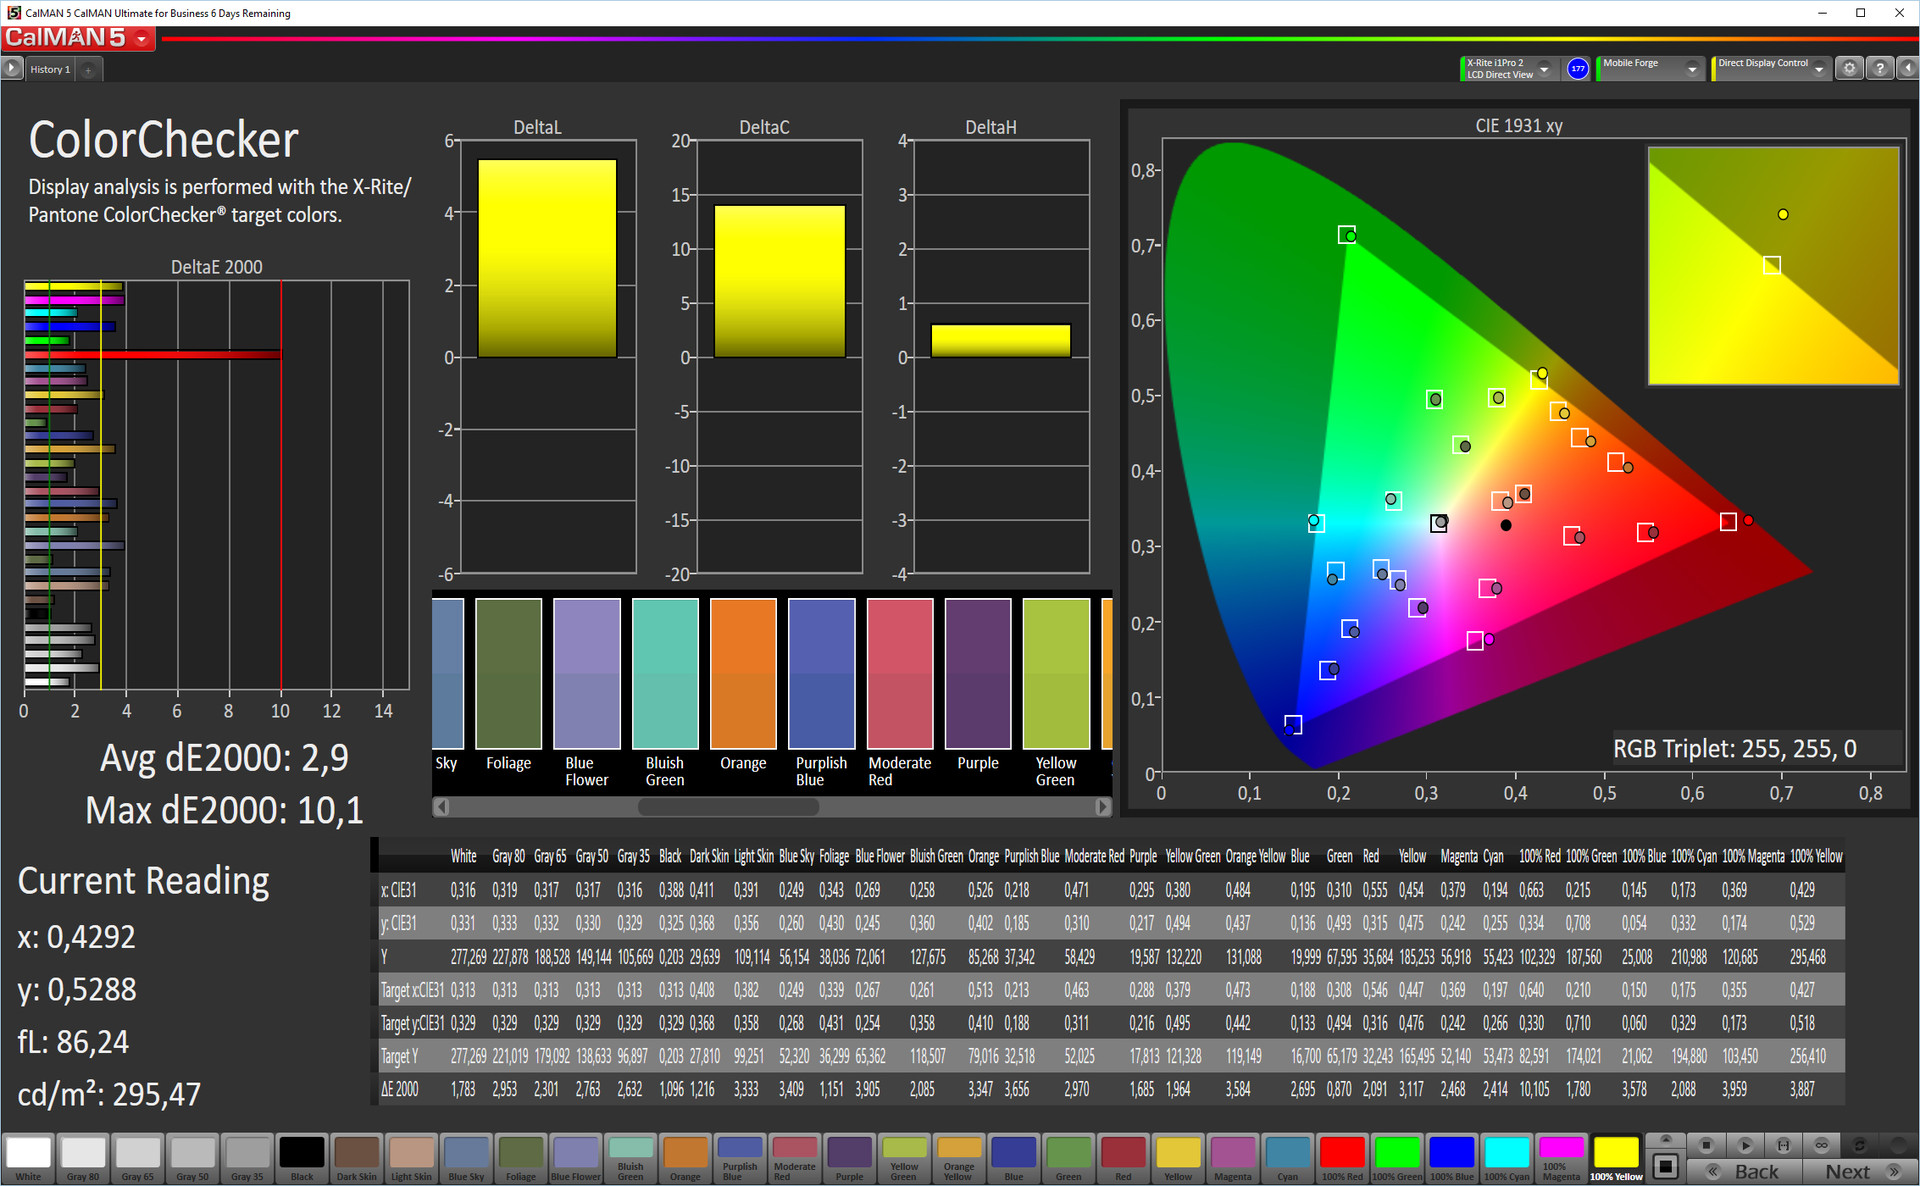
ΔE ColorChecker Calman: 2.9 | ∀{0.5-29.43 Ø4.71}
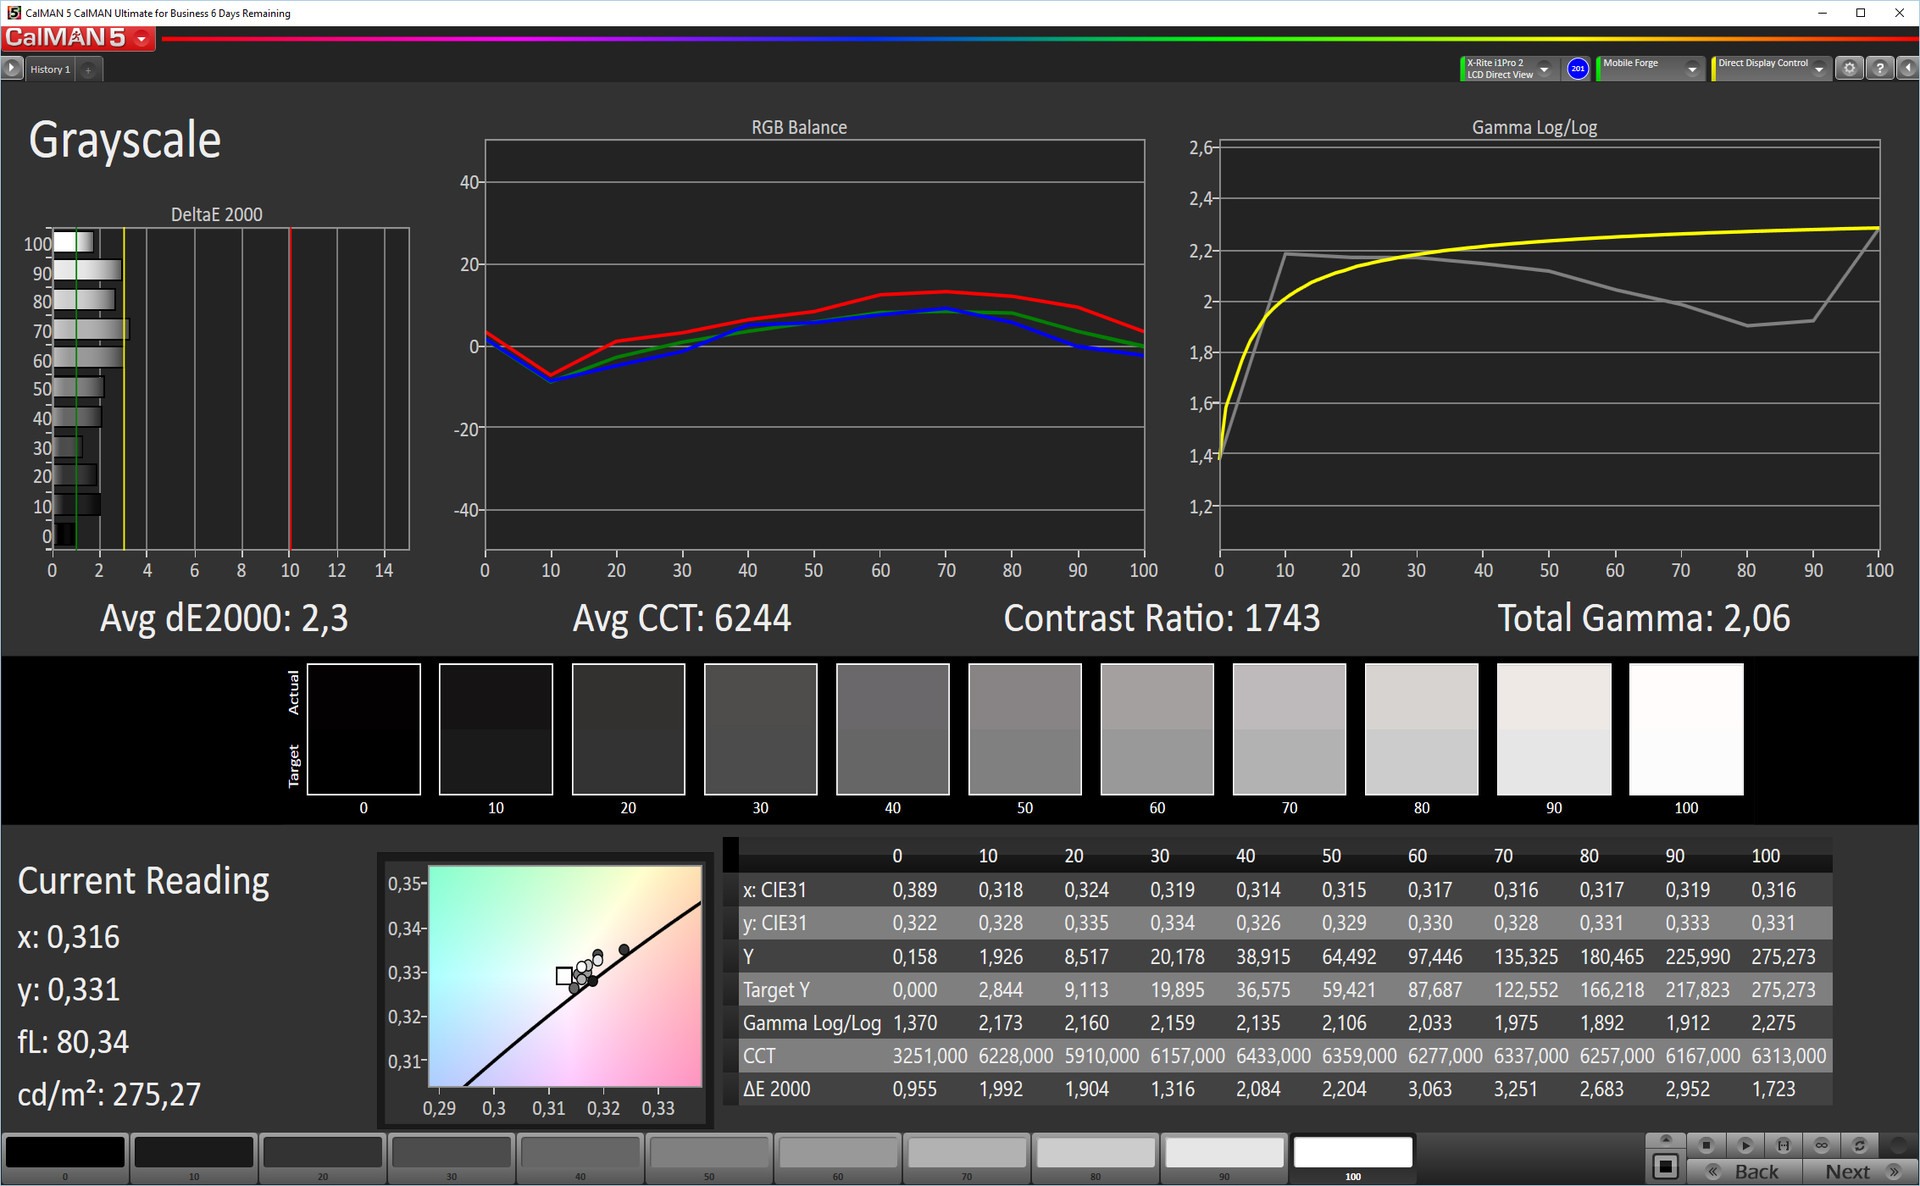
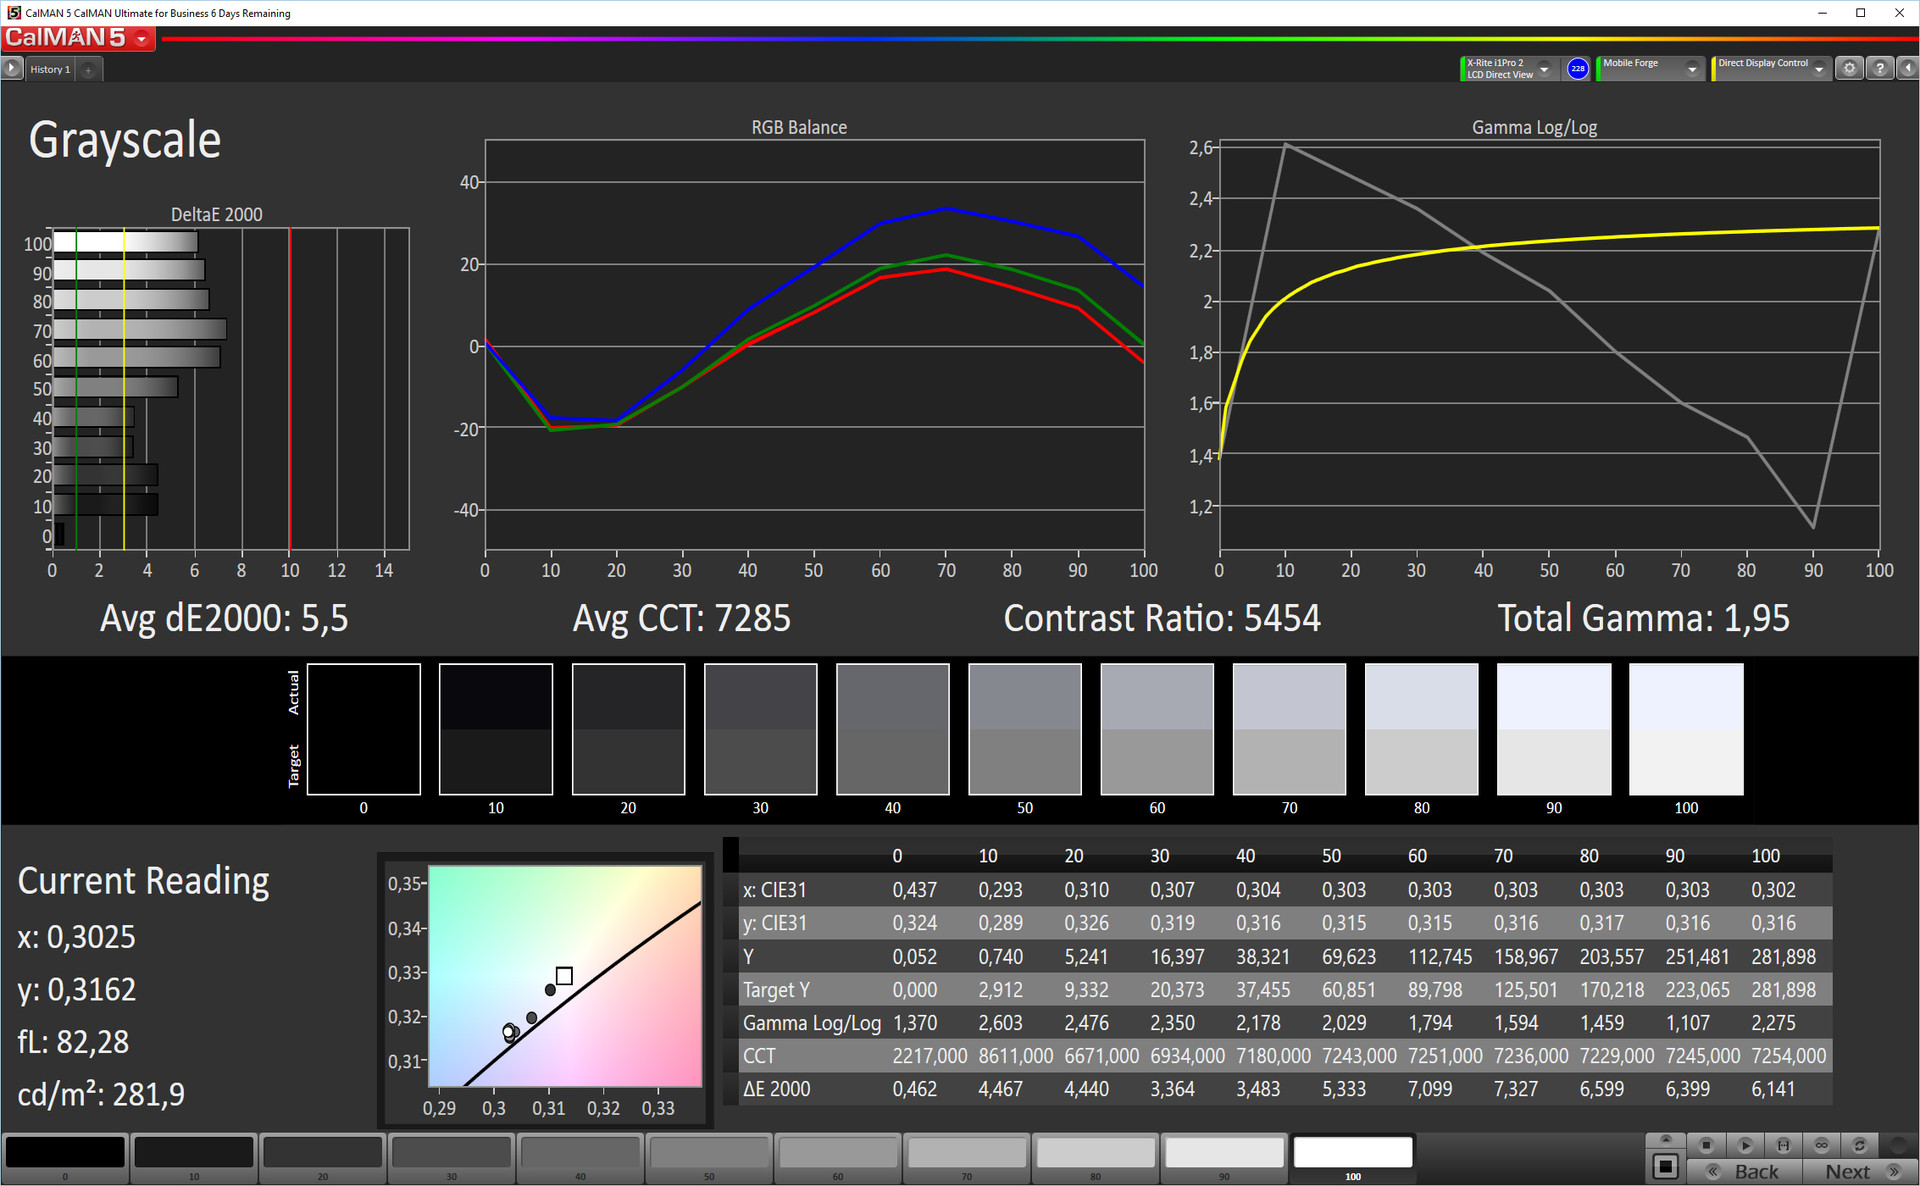
ΔE Greyscale Calman: 2.1 | ∀{0.09-98 Ø4.96}
Gamma: 2.05
CCT: 6228 K
| Samsung Galaxy J7 2016 Super AMOLED, 1280x720, 5.5" | Honor 5X IPS, 1920x1080, 5.5" | Huawei P9 Lite IPS, 1920x1080, 5.2" | Sony Xperia XA IPS, 1280x720, 5" | Samsung Galaxy J5 2016 AMOLED, 1280x720, 5.2" | |
|---|---|---|---|---|---|
| Screen | -7% | 1% | -41% | -12% | |
| Brightness middle (cd/m²) | 287 | 535 86% | 505 76% | 518 80% | 289 1% |
| Brightness (cd/m²) | 289 | 521 80% | 468 62% | 475 64% | 291 1% |
| Brightness Distribution (%) | 91 | 85 -7% | 88 -3% | 81 -11% | 96 5% |
| Black Level * (cd/m²) | 0.43 | 0.74 | 0.61 | ||
| Colorchecker dE 2000 * | 2.9 | 4.88 -68% | 4.1 -41% | 6.8 -134% | 4.7 -62% |
| Colorchecker dE 2000 max. * | 10.1 | 8.66 14% | 5.8 43% | 11.4 -13% | 7.3 28% |
| Greyscale dE 2000 * | 2.1 | 5.2 -148% | 4.9 -133% | 7 -233% | 3 -43% |
| Gamma | 2.05 107% | 2.26 97% | 2.5 88% | 2.35 94% | 2.03 108% |
| CCT | 6228 104% | 7766 84% | 7116 91% | 8151 80% | 6291 103% |
| Contrast (:1) | 1244 | 682 | 849 |
* ... smaller is better


Screen Flickering / PWM (Pulse-Width Modulation)
| Screen flickering / PWM detected | 238.1 Hz | 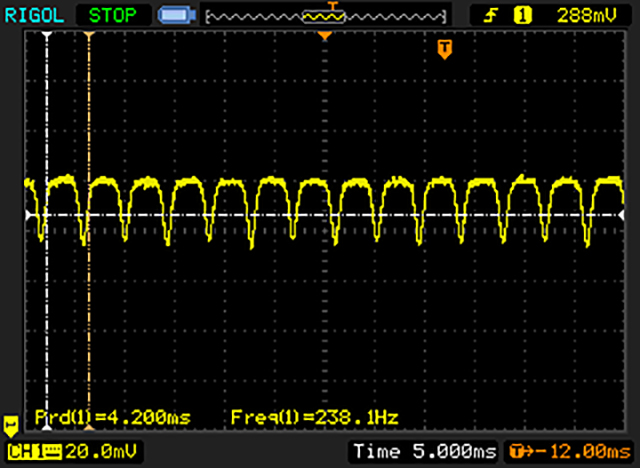 | |
The display backlight flickers at 238.1 Hz (worst case, e.g., utilizing PWM) . The frequency of 238.1 Hz is relatively low, so sensitive users will likely notice flickering and experience eyestrain at the stated brightness setting and below. In comparison: 52 % of all tested devices do not use PWM to dim the display. If PWM was detected, an average of 7754 (minimum: 5 - maximum: 343500) Hz was measured. | |||
Display Response Times
| ↔ Response Time Black to White | ||
|---|---|---|
| 6 ms ... rise ↗ and fall ↘ combined | ↗ 3 ms rise | 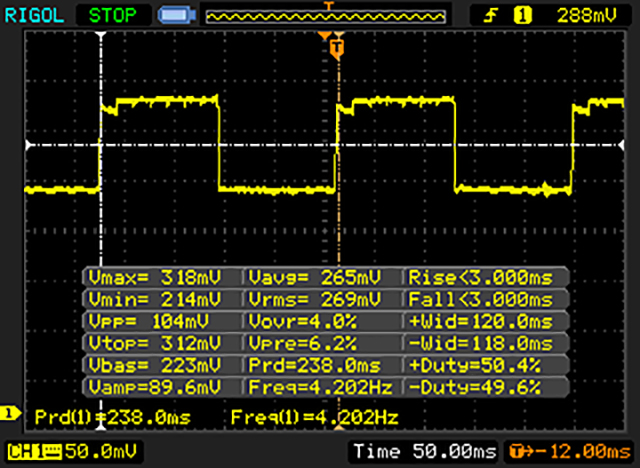 |
| ↘ 3 ms fall | ||
| The screen shows very fast response rates in our tests and should be very well suited for fast-paced gaming. In comparison, all tested devices range from 0.1 (minimum) to 240 (maximum) ms. » 19 % of all devices are better. This means that the measured response time is better than the average of all tested devices (19.8 ms). | ||
| ↔ Response Time 50% Grey to 80% Grey | ||
| 40 ms ... rise ↗ and fall ↘ combined | ↗ 21 ms rise | 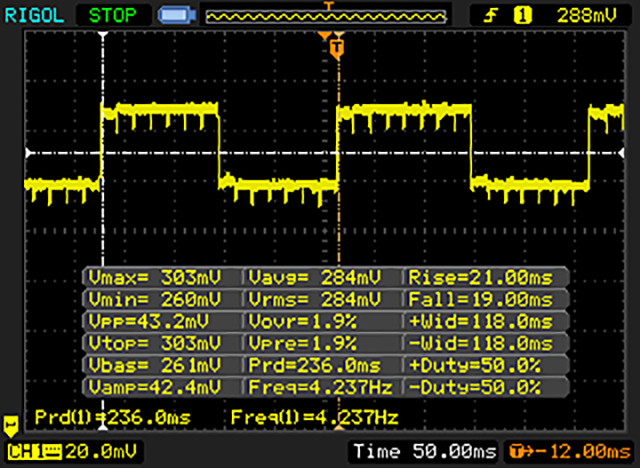 |
| ↘ 19 ms fall | ||
| The screen shows slow response rates in our tests and will be unsatisfactory for gamers. In comparison, all tested devices range from 0.165 (minimum) to 636 (maximum) ms. » 61 % of all devices are better. This means that the measured response time is worse than the average of all tested devices (31 ms). | ||
Performance
| AnTuTu v6 - Total Score (sort by value) | |
| Samsung Galaxy J7 2016 | |
| Honor 5X | |
| Huawei P9 Lite | |
| Sony Xperia XA | |
| Samsung Galaxy J5 2016 | |
| Geekbench 4.0 | |
| 64 Bit Single-Core Score (sort by value) | |
| Samsung Galaxy J7 2016 | |
| 64 Bit Multi-Core Score (sort by value) | |
| Samsung Galaxy J7 2016 | |
| GFXBench (DX / GLBenchmark) 2.7 | |
| T-Rex Onscreen (sort by value) | |
| Samsung Galaxy J7 2016 | |
| Honor 5X | |
| Huawei P9 Lite | |
| Sony Xperia XA | |
| Samsung Galaxy J5 2016 | |
| 1920x1080 T-Rex Offscreen (sort by value) | |
| Samsung Galaxy J7 2016 | |
| Honor 5X | |
| Huawei P9 Lite | |
| Sony Xperia XA | |
| Samsung Galaxy J5 2016 | |
| GFXBench 3.0 | |
| on screen Manhattan Onscreen OGL (sort by value) | |
| Samsung Galaxy J7 2016 | |
| Honor 5X | |
| Huawei P9 Lite | |
| Sony Xperia XA | |
| Samsung Galaxy J5 2016 | |
| 1920x1080 1080p Manhattan Offscreen (sort by value) | |
| Samsung Galaxy J7 2016 | |
| Honor 5X | |
| Huawei P9 Lite | |
| Sony Xperia XA | |
| Samsung Galaxy J5 2016 | |
| GFXBench 3.1 | |
| on screen Manhattan ES 3.1 Onscreen (sort by value) | |
| Samsung Galaxy J7 2016 | |
| Huawei P9 Lite | |
| Sony Xperia XA | |
| Samsung Galaxy J5 2016 | |
| 1920x1080 Manhattan ES 3.1 Offscreen (sort by value) | |
| Samsung Galaxy J7 2016 | |
| Huawei P9 Lite | |
| Sony Xperia XA | |
| Samsung Galaxy J5 2016 | |
| PCMark for Android - Work performance score (sort by value) | |
| Samsung Galaxy J7 2016 | |
| Honor 5X | |
| Huawei P9 Lite | |
| Sony Xperia XA | |
| Samsung Galaxy J5 2016 | |
The results of the browser tests put the smartphones in the same order as the synthetic benchmarks: At the top, the Huawei P9 Lite and the Sony Xperia XA, this time, however, closely followed by the Galaxy J7 (2016). The Honor 5X and the Galaxy J5 (2016) finish last.
| Octane V2 - Total Score (sort by value) | |
| Samsung Galaxy J7 2016 | |
| Honor 5X | |
| Huawei P9 Lite | |
| Sony Xperia XA | |
| Samsung Galaxy J5 2016 | |
| Mozilla Kraken 1.1 - Total (sort by value) | |
| Samsung Galaxy J7 2016 | |
| Honor 5X | |
| Huawei P9 Lite | |
| Sony Xperia XA | |
| Samsung Galaxy J5 2016 | |
| WebXPRT 2015 - Overall (sort by value) | |
| Samsung Galaxy J7 2016 | |
| Honor 5X | |
| Huawei P9 Lite | |
| Sony Xperia XA | |
| Samsung Galaxy J5 2016 | |
| JetStream 1.1 - 1.1 Total (sort by value) | |
| Samsung Galaxy J7 2016 | |
| Honor 5X | |
| Huawei P9 Lite | |
| Sony Xperia XA | |
| Samsung Galaxy J5 2016 | |
* ... smaller is better
| Samsung Galaxy J7 2016 | Honor 5X | Huawei P9 Lite | Sony Xperia XA | Samsung Galaxy J5 2016 | |
|---|---|---|---|---|---|
| AndroBench 3-5 | 5% | 16% | 11% | 5% | |
| Sequential Read 256KB (MB/s) | 189.4 | 144 -24% | 283.5 50% | 240.4 27% | 147 -22% |
| Sequential Write 256KB (MB/s) | 46.24 | 78 69% | 46.24 0% | 68.6 48% | 72 56% |
| Random Read 4KB (MB/s) | 22.33 | 17 -24% | 38.22 71% | 22.05 -1% | 21 -6% |
| Random Write 4KB (MB/s) | 10.11 | 10 -1% | 15.35 52% | 10.6 5% | 11.6 15% |
| Sequential Read 256KB SDCard (MB/s) | 75.5 | 60.8 -19% | 72.9 -3% | 79.8 6% | |
| Sequential Write 256KB SDCard (MB/s) | 58.2 | 25.1 -57% | 50.7 -13% | 46.61 -20% |
| Asphalt 8: Airborne | |||
| Settings | Value | ||
| high | 30 fps | ||
| very low | 30 fps | ||
| Dead Trigger 2 | |||
| Settings | Value | ||
| high | 30 fps | ||
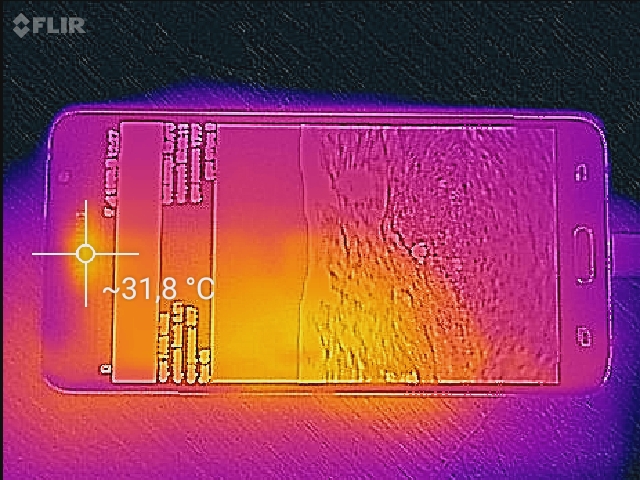
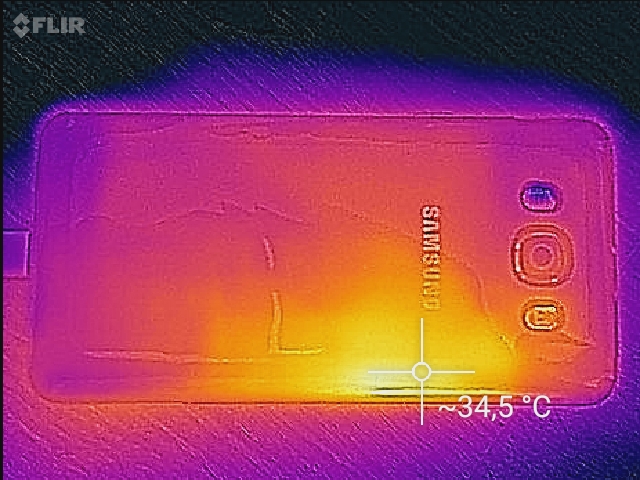
Emissions
(+) The maximum temperature on the upper side is 30.1 °C / 86 F, compared to the average of 35.3 °C / 96 F, ranging from 21.9 to 247 °C for the class Smartphone.
(+) The bottom heats up to a maximum of 31 °C / 88 F, compared to the average of 34 °C / 93 F
(+) In idle usage, the average temperature for the upper side is 29 °C / 84 F, compared to the device average of 33 °C / 91 F.
Samsung Galaxy J7 2016 audio analysis
(+) | speakers can play relatively loud (87.5 dB)
Bass 100 - 315 Hz
(-) | nearly no bass - on average 32.7% lower than median
(±) | linearity of bass is average (10.2% delta to prev. frequency)
Mids 400 - 2000 Hz
(±) | reduced mids - on average 5.8% lower than median
(+) | mids are linear (6.1% delta to prev. frequency)
Highs 2 - 16 kHz
(±) | higher highs - on average 7% higher than median
(+) | highs are linear (5.5% delta to prev. frequency)
Overall 100 - 16.000 Hz
(±) | linearity of overall sound is average (25.5% difference to median)
Compared to same class
» 64% of all tested devices in this class were better, 6% similar, 30% worse
» The best had a delta of 11%, average was 34%, worst was 134%
Compared to all devices tested
» 78% of all tested devices were better, 4% similar, 17% worse
» The best had a delta of 4%, average was 23%, worst was 134%
Samsung Galaxy J5 2016 audio analysis
(+) | speakers can play relatively loud (84.1 dB)
Bass 100 - 315 Hz
(-) | nearly no bass - on average 32.6% lower than median
(±) | linearity of bass is average (7.1% delta to prev. frequency)
Mids 400 - 2000 Hz
(±) | higher mids - on average 7.6% higher than median
(±) | linearity of mids is average (10.9% delta to prev. frequency)
Highs 2 - 16 kHz
(±) | higher highs - on average 6.1% higher than median
(+) | highs are linear (6.5% delta to prev. frequency)
Overall 100 - 16.000 Hz
(-) | overall sound is not linear (30.2% difference to median)
Compared to same class
» 79% of all tested devices in this class were better, 4% similar, 17% worse
» The best had a delta of 11%, average was 34%, worst was 134%
Compared to all devices tested
» 88% of all tested devices were better, 3% similar, 9% worse
» The best had a delta of 4%, average was 23%, worst was 134%
Huawei P9 Lite audio analysis
(+) | speakers can play relatively loud (88.4 dB)
Bass 100 - 315 Hz
(-) | nearly no bass - on average 31% lower than median
(±) | linearity of bass is average (9.2% delta to prev. frequency)
Mids 400 - 2000 Hz
(+) | balanced mids - only 4.4% away from median
(+) | mids are linear (4.2% delta to prev. frequency)
Highs 2 - 16 kHz
(±) | higher highs - on average 5.2% higher than median
(+) | highs are linear (2.2% delta to prev. frequency)
Overall 100 - 16.000 Hz
(±) | linearity of overall sound is average (21% difference to median)
Compared to same class
» 39% of all tested devices in this class were better, 8% similar, 53% worse
» The best had a delta of 11%, average was 34%, worst was 134%
Compared to all devices tested
» 58% of all tested devices were better, 7% similar, 35% worse
» The best had a delta of 4%, average was 23%, worst was 134%
Frequency comparison diagram (checkboxes selectable/deselectable!)
Energy Management
| Off / Standby | |
| Idle | |
| Load |
|
Key:
min: | |
| Samsung Galaxy J7 2016 3300 mAh | Honor 5X 3000 mAh | Huawei P9 Lite 3000 mAh | Sony Xperia XA 2300 mAh | Samsung Galaxy J5 2016 3100 mAh | |
|---|---|---|---|---|---|
| Power Consumption | -57% | -35% | -22% | 8% | |
| Idle Minimum * (Watt) | 0.67 | 0.87 -30% | 0.73 -9% | 0.72 -7% | 0.61 9% |
| Idle Average * (Watt) | 1.71 | 2.08 -22% | 2.09 -22% | 1.5 12% | 1.41 18% |
| Idle Maximum * (Watt) | 1.83 | 2.22 -21% | 2.11 -15% | 1.57 14% | 1.51 17% |
| Load Average * (Watt) | 2.37 | 5.26 -122% | 4.15 -75% | 3.48 -47% | 2.56 -8% |
| Load Maximum * (Watt) | 3.31 | 6.34 -92% | 5.05 -53% | 6.04 -82% | 3.1 6% |
* ... smaller is better
| Samsung Galaxy J7 2016 3300 mAh | Honor 5X 3000 mAh | Huawei P9 Lite 3000 mAh | Sony Xperia XA 2300 mAh | Samsung Galaxy J5 2016 3100 mAh | |
|---|---|---|---|---|---|
| Battery runtime | -54% | -47% | -66% | -36% | |
| Reader / Idle (h) | 33.8 | 17.6 -48% | 23.4 -31% | 12.9 -62% | 26.7 -21% |
| H.264 (h) | 20.3 | 10 -51% | 9.5 -53% | 7.7 -62% | 11 -46% |
| WiFi v1.3 (h) | 17.1 | 10.7 -37% | 10.1 -41% | 5.9 -65% | 10.7 -37% |
| Load (h) | 11.4 | 2.4 -79% | 4.5 -61% | 2.8 -75% | 6.7 -41% |
Pros
Cons
verdict

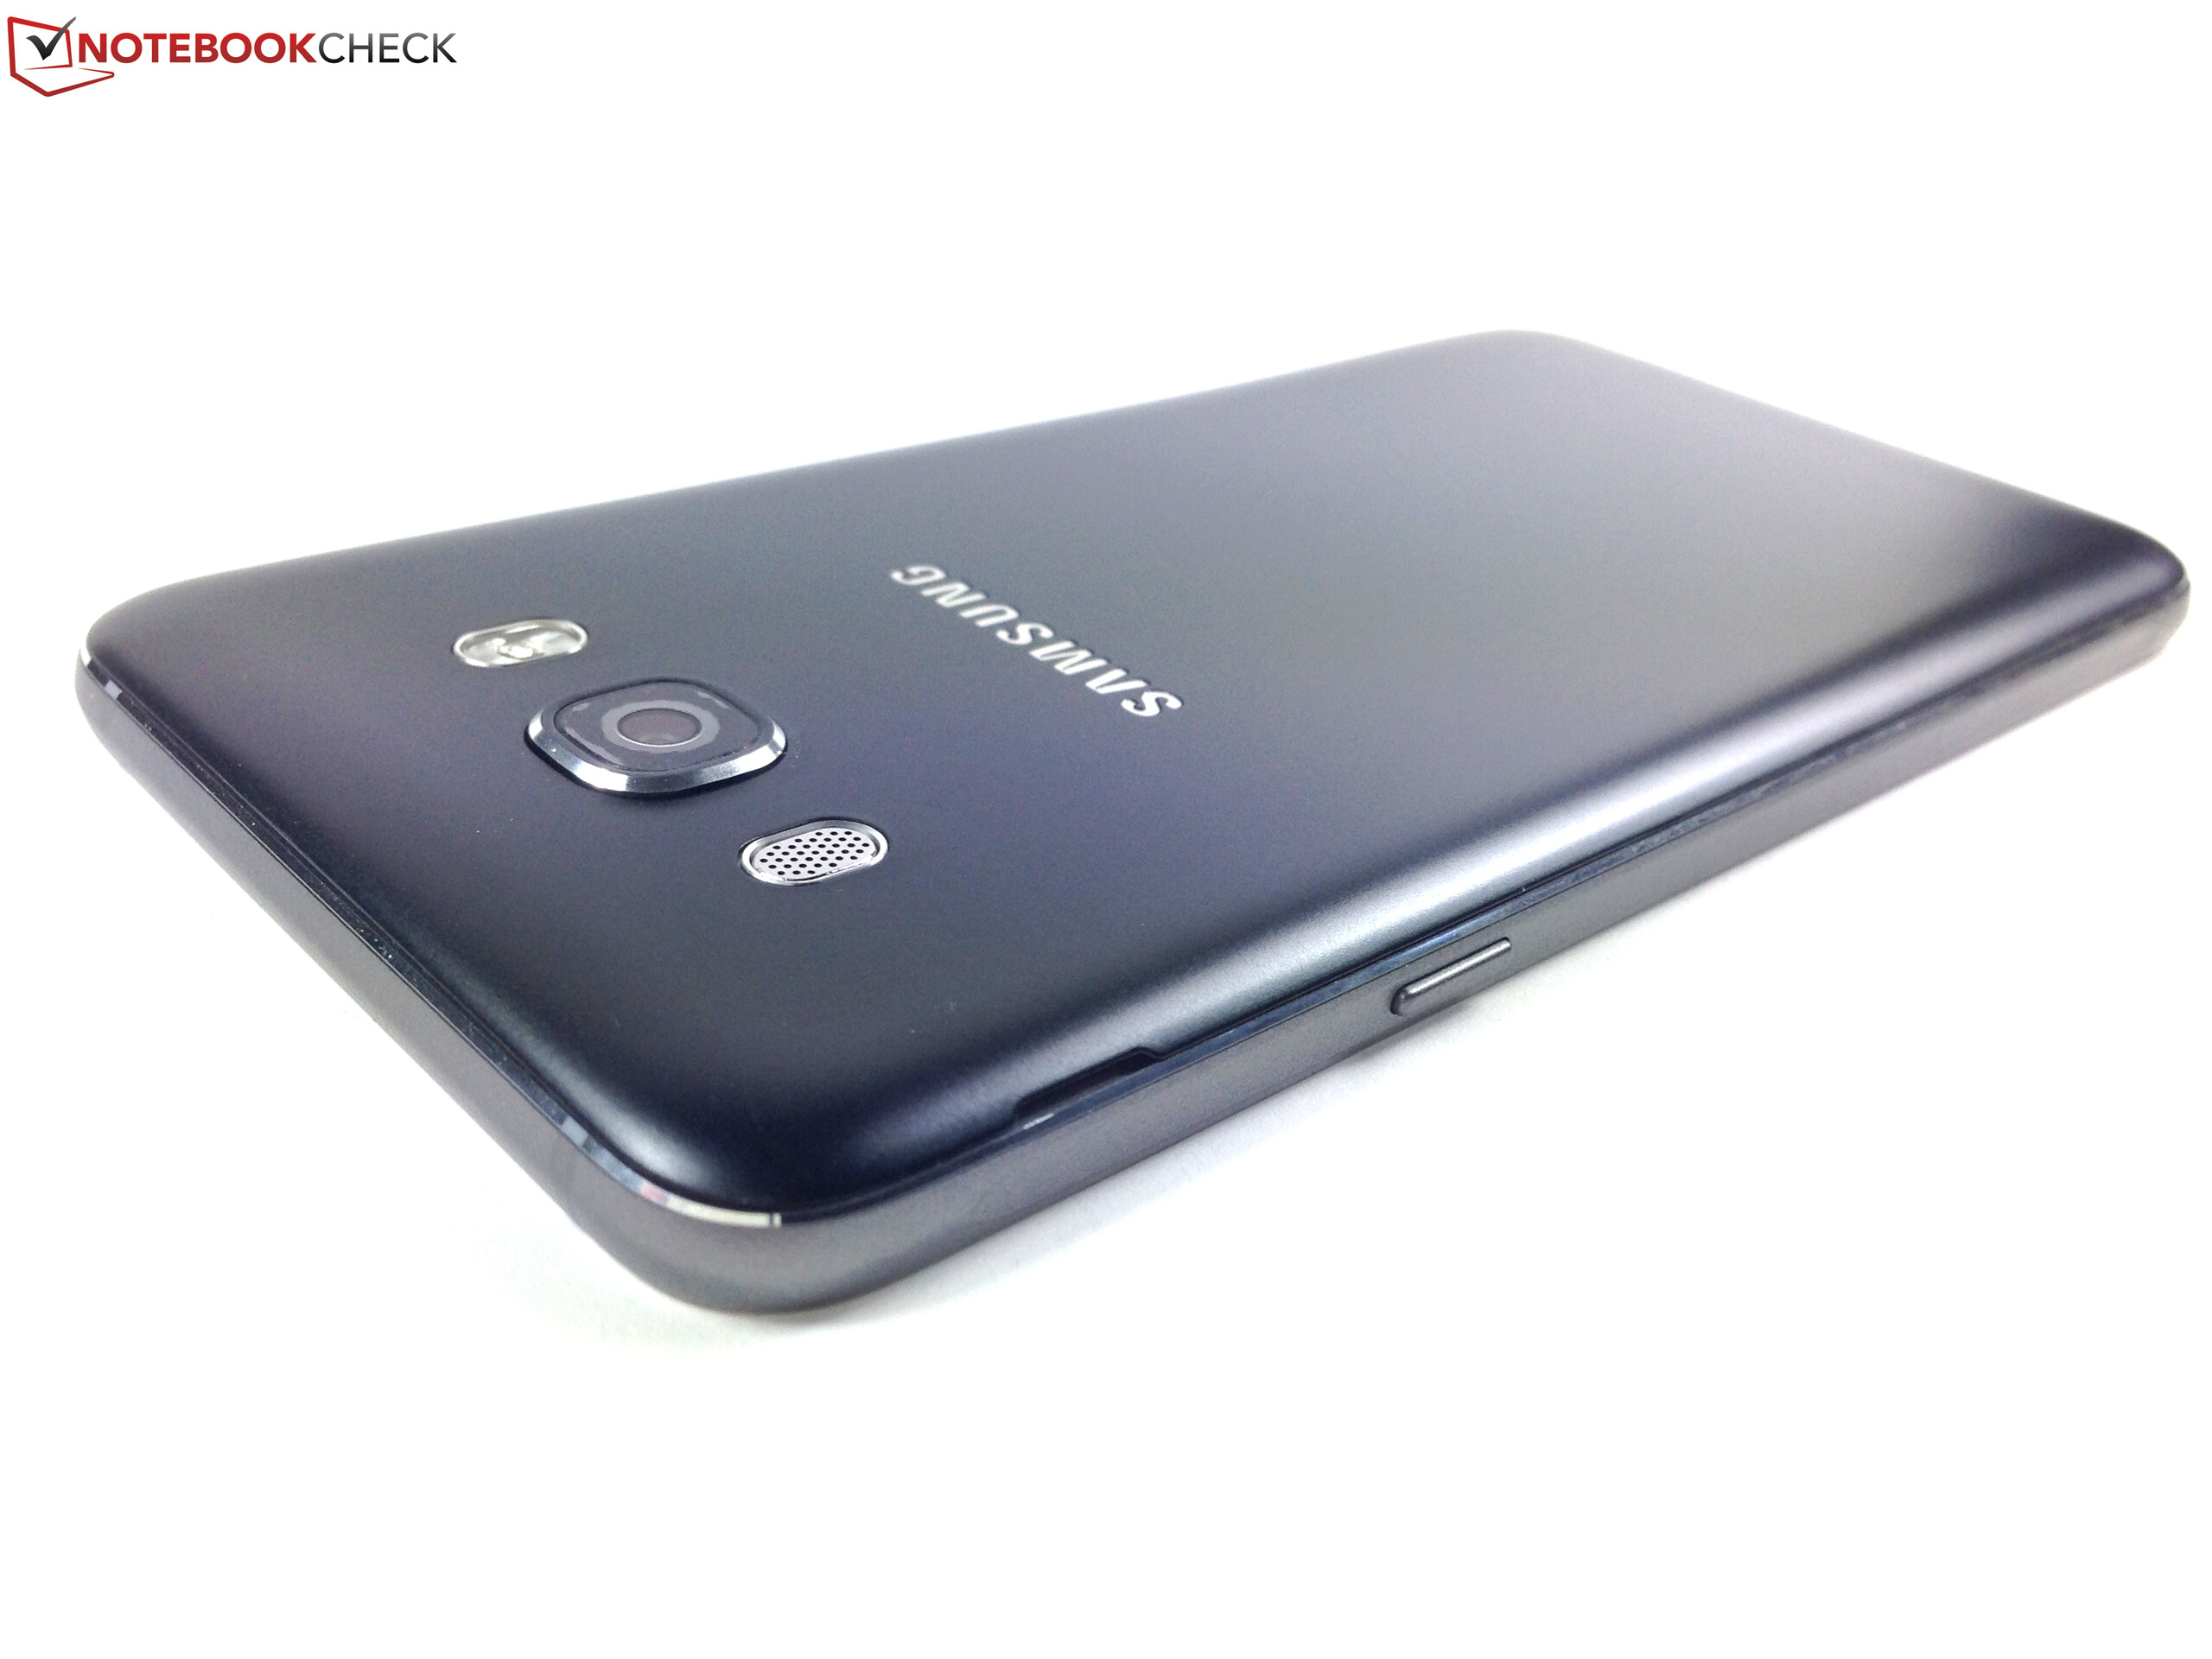
三星用一种微妙却有效的方式改造了它的5.5寸中端智能手机Galaxy J7(2016)。作为2016版的亮点之一的金属外壳与前代机型相比,为它提供了更好的质感和更强的坚固性。从八核骁龙615处理器到三星Exynos 7870的转换,和从1.5到2GB的内存升级,让它性能得到了突破。另一个加分项:新版本配备了更为先进的安卓6.0.1 Marshmallow操作系统,而不是安卓5.1。
这个升级物有所值:如果你正在寻找一台物美价廉的中端智能手机,那么Galaxy J7(2016)会是正确的选择。
前代产品的优点,比方说,Super AMOLED显示屏,1500万像素后置摄像头,500万像素的前置摄像头和可拆卸电池都被保留了下来。而后者在Galaxy J7(2016)上具备了更大的容量,给予了这台智能手机更优异的续航能力。
可惜Galaxy J7(2016)也有几个弱点。在这里必须提到的是:缓慢的Wi-Fi速度,亮度传感器的缺失,平庸的通话音质,以及一般般的主相机。在这个价格位上,指纹传感器应该作为标配 。更敏感的用户可能会感受到在设置屏幕亮度偶有发生的闪烁。基本上它和之前的Galaxy J5(2016)所存在的问题十分相似。所以,如果你想节约50欧元(约52美元),而且可以接受稍小的显示屏(5.2,而不是5.5英寸)以及较慢的处理器,那么Galaxy J5(2016)也同样值得考虑。
注:本文是基于完整评测的缩减版本,阅读完整的英文评测,请点击这里。
Samsung Galaxy J7 2016
- 12/06/2016 v6 (old)
Manuel Masiero