Wiko U Feel Prime 智能手机简短评测
| Networking | |
| iperf3 transmit AX12 | |
| Lenovo ZUK Z2 | |
| HTC Desire 10 Lifestyle | |
| Wiko U Feel Prime | |
| iperf3 receive AX12 | |
| Lenovo ZUK Z2 | |
| HTC Desire 10 Lifestyle | |
| Wiko U Feel Prime | |


| |||||||||||||||||||||||||
Brightness Distribution: 86 %
Center on Battery: 411 cd/m²
Contrast: 1142:1 (Black: 0.36 cd/m²)
ΔE ColorChecker Calman: 4.3 | ∀{0.5-29.43 Ø4.71}
ΔE Greyscale Calman: 2.8 | ∀{0.09-98 Ø4.96}
Gamma: 2.53
CCT: 6589 K
| Wiko U Feel Prime IPS, 1920x1080, 5" | Sony Xperia XA IPS, 1280x720, 5" | Lenovo ZUK Z2 IPS, 1920x1080, 5" | Honor 8 IPS, 1920x1080, 5.2" | Samsung Galaxy J5 2016 AMOLED, 1280x720, 5.2" | Wiko U Feel IPS, 1280x720, 5" | |
|---|---|---|---|---|---|---|
| Screen | -38% | -7% | -21% | -9% | -4% | |
| Brightness middle (cd/m²) | 411 | 518 26% | 512 25% | 451 10% | 289 -30% | 500 22% |
| Brightness (cd/m²) | 386 | 475 23% | 502 30% | 443 15% | 291 -25% | 485 26% |
| Brightness Distribution (%) | 86 | 81 -6% | 84 -2% | 93 8% | 96 12% | 83 -3% |
| Black Level * (cd/m²) | 0.36 | 0.61 -69% | 0.58 -61% | 0.4 -11% | 0.22 39% | |
| Contrast (:1) | 1142 | 849 -26% | 883 -23% | 1128 -1% | 2273 99% | |
| Colorchecker dE 2000 * | 4.3 | 6.8 -58% | 3.8 12% | 5.4 -26% | 4.7 -9% | 6.3 -47% |
| Colorchecker dE 2000 max. * | 7.9 | 11.4 -44% | 11.2 -42% | 9.9 -25% | 7.3 8% | 14.4 -82% |
| Greyscale dE 2000 * | 2.8 | 7 -150% | 2.7 4% | 6.7 -139% | 3 -7% | 5.2 -86% |
| Gamma | 2.53 87% | 2.35 94% | 2.09 105% | 2.33 94% | 2.03 108% | 2.17 101% |
| CCT | 6589 99% | 8151 80% | 6076 107% | 8262 79% | 6291 103% | 7536 86% |
* ... smaller is better
Screen Flickering / PWM (Pulse-Width Modulation)
| Screen flickering / PWM detected | 2273 Hz | ≤ 1 % brightness setting | 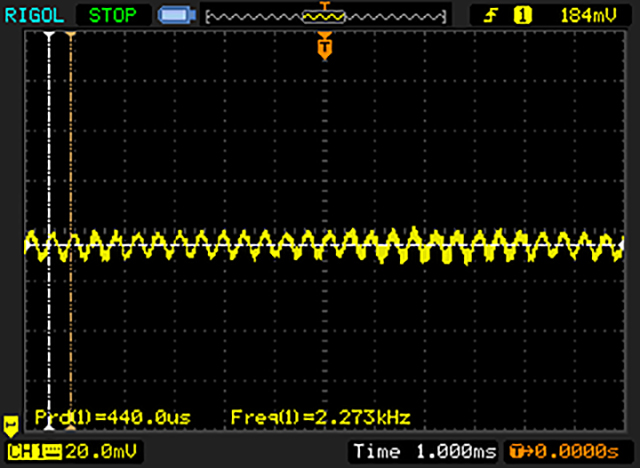 |
The display backlight flickers at 2273 Hz (worst case, e.g., utilizing PWM) Flickering detected at a brightness setting of 1 % and below. There should be no flickering or PWM above this brightness setting. The frequency of 2273 Hz is quite high, so most users sensitive to PWM should not notice any flickering. In comparison: 52 % of all tested devices do not use PWM to dim the display. If PWM was detected, an average of 7748 (minimum: 5 - maximum: 343500) Hz was measured. | |||
Display Response Times
| ↔ Response Time Black to White | ||
|---|---|---|
| 22 ms ... rise ↗ and fall ↘ combined | ↗ 9 ms rise | 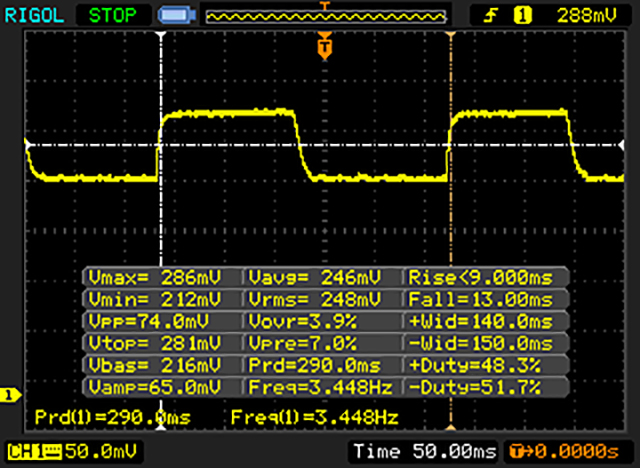 |
| ↘ 13 ms fall | ||
| The screen shows good response rates in our tests, but may be too slow for competitive gamers. In comparison, all tested devices range from 0.1 (minimum) to 240 (maximum) ms. » 49 % of all devices are better. This means that the measured response time is worse than the average of all tested devices (19.8 ms). | ||
| ↔ Response Time 50% Grey to 80% Grey | ||
| 43 ms ... rise ↗ and fall ↘ combined | ↗ 12 ms rise | 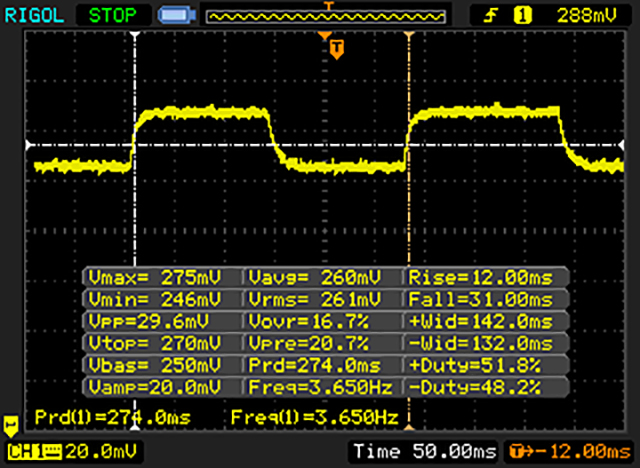 |
| ↘ 31 ms fall | ||
| The screen shows slow response rates in our tests and will be unsatisfactory for gamers. In comparison, all tested devices range from 0.165 (minimum) to 636 (maximum) ms. » 71 % of all devices are better. This means that the measured response time is worse than the average of all tested devices (30.9 ms). | ||
| AnTuTu v6 - Total Score (sort by value) | |
| Wiko U Feel Prime | |
| Sony Xperia XA | |
| Lenovo ZUK Z2 | |
| Honor 8 | |
| Samsung Galaxy J5 2016 | |
| Wiko U Feel | |
| Geekbench 4.0 | |
| 64 Bit Single-Core Score (sort by value) | |
| Wiko U Feel Prime | |
| Honor 8 | |
| 64 Bit Multi-Core Score (sort by value) | |
| Wiko U Feel Prime | |
| Honor 8 | |
| GFXBench (DX / GLBenchmark) 2.7 | |
| T-Rex Onscreen (sort by value) | |
| Wiko U Feel Prime | |
| Sony Xperia XA | |
| Lenovo ZUK Z2 | |
| Honor 8 | |
| Samsung Galaxy J5 2016 | |
| Wiko U Feel | |
| 1920x1080 T-Rex Offscreen (sort by value) | |
| Wiko U Feel Prime | |
| Sony Xperia XA | |
| Lenovo ZUK Z2 | |
| Honor 8 | |
| Samsung Galaxy J5 2016 | |
| Wiko U Feel | |
| GFXBench 3.0 | |
| on screen Manhattan Onscreen OGL (sort by value) | |
| Wiko U Feel Prime | |
| Sony Xperia XA | |
| Lenovo ZUK Z2 | |
| Honor 8 | |
| Samsung Galaxy J5 2016 | |
| Wiko U Feel | |
| 1920x1080 1080p Manhattan Offscreen (sort by value) | |
| Wiko U Feel Prime | |
| Sony Xperia XA | |
| Lenovo ZUK Z2 | |
| Honor 8 | |
| Samsung Galaxy J5 2016 | |
| Wiko U Feel | |
| GFXBench 3.1 | |
| on screen Manhattan ES 3.1 Onscreen (sort by value) | |
| Wiko U Feel Prime | |
| Sony Xperia XA | |
| Lenovo ZUK Z2 | |
| Honor 8 | |
| Samsung Galaxy J5 2016 | |
| Wiko U Feel | |
| 1920x1080 Manhattan ES 3.1 Offscreen (sort by value) | |
| Wiko U Feel Prime | |
| Sony Xperia XA | |
| Lenovo ZUK Z2 | |
| Honor 8 | |
| Samsung Galaxy J5 2016 | |
| Wiko U Feel | |
| PCMark for Android - Work performance score (sort by value) | |
| Wiko U Feel Prime | |
| Sony Xperia XA | |
| Lenovo ZUK Z2 | |
| Honor 8 | |
| Samsung Galaxy J5 2016 | |
| Wiko U Feel | |
| Octane V2 - Total Score (sort by value) | |
| Wiko U Feel Prime | |
| Sony Xperia XA | |
| Lenovo ZUK Z2 | |
| Honor 8 | |
| Samsung Galaxy J5 2016 | |
| Wiko U Feel | |
| Mozilla Kraken 1.1 - Total (sort by value) | |
| Wiko U Feel Prime | |
| Sony Xperia XA | |
| Lenovo ZUK Z2 | |
| Honor 8 | |
| Samsung Galaxy J5 2016 | |
| Wiko U Feel | |
| JetStream 1.1 - 1.1 Total (sort by value) | |
| Wiko U Feel Prime | |
| Sony Xperia XA | |
| Lenovo ZUK Z2 | |
| Honor 8 | |
| Samsung Galaxy J5 2016 | |
| Wiko U Feel | |
* ... smaller is better
| AndroBench 3-5 | |
| Sequential Read 256KB (sort by value) | |
| Wiko U Feel Prime | |
| Sony Xperia XA | |
| Lenovo ZUK Z2 | |
| Honor 8 | |
| Samsung Galaxy J5 2016 | |
| Wiko U Feel | |
| Sequential Write 256KB (sort by value) | |
| Wiko U Feel Prime | |
| Sony Xperia XA | |
| Lenovo ZUK Z2 | |
| Honor 8 | |
| Samsung Galaxy J5 2016 | |
| Wiko U Feel | |
| Random Read 4KB (sort by value) | |
| Wiko U Feel Prime | |
| Sony Xperia XA | |
| Lenovo ZUK Z2 | |
| Honor 8 | |
| Samsung Galaxy J5 2016 | |
| Wiko U Feel | |
| Random Write 4KB (sort by value) | |
| Wiko U Feel Prime | |
| Sony Xperia XA | |
| Lenovo ZUK Z2 | |
| Honor 8 | |
| Samsung Galaxy J5 2016 | |
| Wiko U Feel | |
| Sequential Read 256KB SDCard (sort by value) | |
| Wiko U Feel Prime | |
| Sony Xperia XA | |
| Honor 8 | |
| Samsung Galaxy J5 2016 | |
| Wiko U Feel | |
| Sequential Write 256KB SDCard (sort by value) | |
| Wiko U Feel Prime | |
| Sony Xperia XA | |
| Honor 8 | |
| Samsung Galaxy J5 2016 | |
| Wiko U Feel | |
(+) The maximum temperature on the upper side is 37.8 °C / 100 F, compared to the average of 35.3 °C / 96 F, ranging from 21.9 to 247 °C for the class Smartphone.
(+) The bottom heats up to a maximum of 35.8 °C / 96 F, compared to the average of 34 °C / 93 F
(+) In idle usage, the average temperature for the upper side is 29.3 °C / 85 F, compared to the device average of 33 °C / 91 F.
Wiko U Feel Prime audio analysis
(+) | speakers can play relatively loud (85.5 dB)
Bass 100 - 315 Hz
(-) | nearly no bass - on average 30.1% lower than median
(±) | linearity of bass is average (7.4% delta to prev. frequency)
Mids 400 - 2000 Hz
(±) | reduced mids - on average 5.5% lower than median
(+) | mids are linear (6.6% delta to prev. frequency)
Highs 2 - 16 kHz
(±) | higher highs - on average 6.7% higher than median
(+) | highs are linear (6.7% delta to prev. frequency)
Overall 100 - 16.000 Hz
(±) | linearity of overall sound is average (26.1% difference to median)
Compared to same class
» 66% of all tested devices in this class were better, 6% similar, 28% worse
» The best had a delta of 11%, average was 34%, worst was 134%
Compared to all devices tested
» 80% of all tested devices were better, 4% similar, 16% worse
» The best had a delta of 4%, average was 23%, worst was 134%
Samsung Galaxy J5 2016 audio analysis
(+) | speakers can play relatively loud (84.1 dB)
Bass 100 - 315 Hz
(-) | nearly no bass - on average 32.6% lower than median
(±) | linearity of bass is average (7.1% delta to prev. frequency)
Mids 400 - 2000 Hz
(±) | higher mids - on average 7.6% higher than median
(±) | linearity of mids is average (10.9% delta to prev. frequency)
Highs 2 - 16 kHz
(±) | higher highs - on average 6.1% higher than median
(+) | highs are linear (6.5% delta to prev. frequency)
Overall 100 - 16.000 Hz
(-) | overall sound is not linear (30.2% difference to median)
Compared to same class
» 79% of all tested devices in this class were better, 4% similar, 17% worse
» The best had a delta of 11%, average was 34%, worst was 134%
Compared to all devices tested
» 88% of all tested devices were better, 3% similar, 9% worse
» The best had a delta of 4%, average was 23%, worst was 134%
HTC Desire 10 Lifestyle audio analysis
(±) | speaker loudness is average but good (75.3 dB)
Bass 100 - 315 Hz
(-) | nearly no bass - on average 20.2% lower than median
(-) | bass is not linear (18.5% delta to prev. frequency)
Mids 400 - 2000 Hz
(+) | balanced mids - only 3.3% away from median
(+) | mids are linear (4.1% delta to prev. frequency)
Highs 2 - 16 kHz
(+) | balanced highs - only 3.2% away from median
(+) | highs are linear (4.4% delta to prev. frequency)
Overall 100 - 16.000 Hz
(±) | linearity of overall sound is average (20.7% difference to median)
Compared to same class
» 37% of all tested devices in this class were better, 8% similar, 54% worse
» The best had a delta of 11%, average was 34%, worst was 134%
Compared to all devices tested
» 56% of all tested devices were better, 8% similar, 36% worse
» The best had a delta of 4%, average was 23%, worst was 134%
| Off / Standby | |
| Idle | |
| Load |
|
Key:
min: | |
| Wiko U Feel Prime 3000 mAh | Sony Xperia XA 2300 mAh | Lenovo ZUK Z2 3500 mAh | Honor 8 3000 mAh | Samsung Galaxy J5 2016 3100 mAh | Wiko U Feel 2500 mAh | |
|---|---|---|---|---|---|---|
| Power Consumption | -6% | -53% | -28% | 17% | -33% | |
| Idle Minimum * (Watt) | 0.66 | 0.72 -9% | 1.31 -98% | 0.78 -18% | 0.61 8% | 0.82 -24% |
| Idle Average * (Watt) | 1.66 | 1.5 10% | 2.03 -22% | 1.89 -14% | 1.41 15% | 1.61 3% |
| Idle Maximum * (Watt) | 1.76 | 1.57 11% | 2.08 -18% | 2.02 -15% | 1.51 14% | 1.8 -2% |
| Load Average * (Watt) | 2.85 | 3.48 -22% | 5.45 -91% | 5.28 -85% | 2.56 10% | 5.99 -110% |
| Load Maximum * (Watt) | 5.01 | 6.04 -21% | 6.75 -35% | 5.44 -9% | 3.1 38% | 6.7 -34% |
* ... smaller is better
| Wiko U Feel Prime 3000 mAh | Sony Xperia XA 2300 mAh | Lenovo ZUK Z2 3500 mAh | Honor 8 3000 mAh | Samsung Galaxy J5 2016 3100 mAh | Wiko U Feel 2500 mAh | |
|---|---|---|---|---|---|---|
| Battery runtime | -39% | -5% | 3% | 20% | -4% | |
| Reader / Idle (h) | 20.9 | 12.9 -38% | 24.8 19% | 26.7 28% | ||
| WiFi v1.3 (h) | 9.6 | 5.9 -39% | 9.1 -5% | 8.3 -14% | 10.7 11% | 9.2 -4% |
| H.264 (h) | 7.7 | 8.8 | 11 | |||
| Load (h) | 2.8 | 4.3 | 6.7 |
Pros
Cons
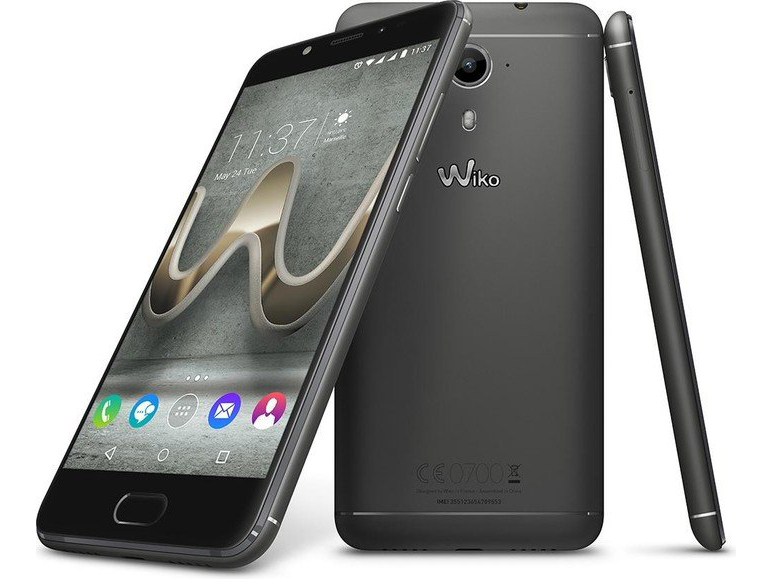
虽然相较于Wiko’s U Feel贵70欧元(约74美元),但十分值得:Wiko’s U Feel Prime在几乎所有的测试中都完胜同系列低配款。他们的电池续航能力相当,但Wiko’s U Feel Prime有更高的分辨率,且内存配置更好,更不用说性能了。
Wiko U Feel Prime 在和其他手机的竞争中也有一些自己的优势。但在稍高一点的价位上,相比起Wiko U Feel Prime来说,荣耀8和联想ZUK2有着客观的性能提升。
但较低的屏幕亮度与轻微的亮度不均匀是一大遗憾。麦克风仍是老旧的型号,导致我们的声音在对方听来很小声。摄像头本可以有更好的素质,特别是主摄像头的锐利度堪忧。
用户将会以不到300欧元(约合316美元)的价格得到一台有着金属外壳,全高清屏幕和出色性能的手机。Wiko U Feel Prime给我们留下了良好的印象并有着出色的性价比。
总之, 在众多中低端手机中,Wiko’s U Feel Prime是一款值得推荐的手机。
注:本文是基于完整评测的缩减版本,阅读完整的英文评测,请点击这里。
Wiko U Feel Prime
- 12/29/2016 v6 (old)
Florian Wimmer