Acer Swift 3X 笔记本电脑的回顾。英特尔Iris Xe MAX结合了高电池寿命和游戏性能
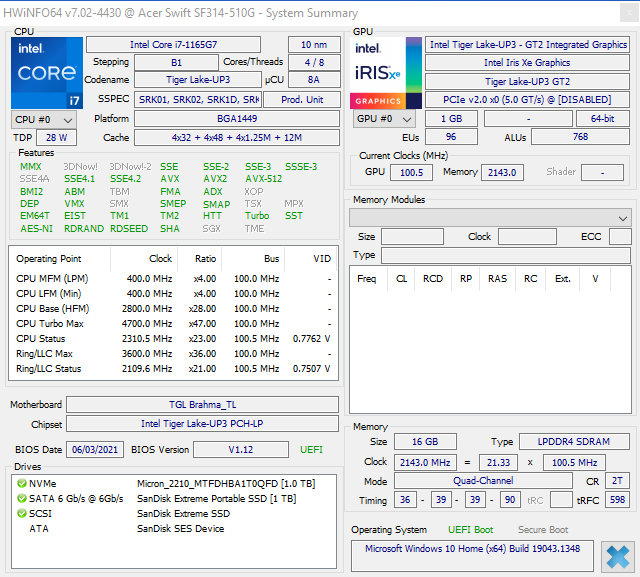
通过14英寸的Swift 3X,宏碁为其传统的Swift 3型号提供了一个更强大的变体,价格约为1100欧元(约合1245美元)。除了英特尔酷睿i7-1165G7 Tiger Lake 处理器,制造商还安装了专用的英特尔Iris Xe MAX显卡,而不是仅仅依靠处理器的板载GPU。此外,我们的宏碁Swift 3X SF314-510G-70DW测试设备配备了双通道模式的16GB LPDDR4X内存,以及1TB的SSD存储空间。
在我们的测试中,宏碁Swift 3X SF314-510G-70DW需要面对的是戴尔 Inspiron 15 7000 7506具有相同的CPU/GPU配置,以及其他。还有两个拥有相同处理器和不同专用GPU的竞争者,即华硕Vivobook 15 K513EQ配备了GeForce MX350和微星现代14 B11SB-085使用GeForce MX450。其他两款宏碁Swift机型使比较领域更加完善--14英寸的宏碁Swift 5 SF514-55T-58DN配备英特尔酷睿i5-1135G7和Iris Xe G7(80EUs),以及Acer Swift 3 SF316-51配备英特尔酷睿i7-11370H和Iris Xe G7(96EUs)的宏碁Swift 3 SF316-51以及联想ThinkPad L14第二代配有AMD R7 PRO 5850U。
Potential Competitors in Comparison
Rating | Date | Model | Weight | Height | Size | Resolution | Price |
|---|---|---|---|---|---|---|---|
| 86.1 % v7 (old) | 12 / 2021 | Acer Swift 3X SF314-510G-70DW i7-1165G7, Xe MAX | 1.4 kg | 17.9 mm | 14.00" | 1920x1080 | |
| 80.6 % v7 (old) | 11 / 2021 | Asus Vivobook 15 K513EQ i7-1165G7, GeForce MX350 | 1.6 kg | 17.9 mm | 15.60" | 1920x1080 | |
| 82.4 % v7 (old) | 02 / 2021 | Dell Inspiron 15 7000 7506 2-in-1 Black Edition i7-1165G7, Xe MAX | 1.9 kg | 17.94 mm | 15.60" | 3840x2160 | |
| 86.1 % v7 (old) | 08 / 2021 | Lenovo ThinkPad L14 G2 AMD R7 PRO 5850U, Vega 8 | 1.7 kg | 20.4 mm | 14.00" | 1920x1080 | |
| 86.4 % v7 (old) | 10 / 2021 | Acer Swift 3 SF316-51 i7-11370H, Iris Xe G7 96EUs | 1.7 kg | 15.9 mm | 16.10" | 1920x1080 | |
| 85.2 % v7 (old) | 04 / 2021 | Acer Swift 5 SF514-55T-58DN i5-1135G7, Iris Xe G7 80EUs | 1 kg | 14.95 mm | 14.00" | 1920x1080 | |
| 82.2 % v7 (old) | MSI Modern 14 B11SB-085 i7-1165G7, GeForce MX450 | 1.3 kg | 16.9 mm | 14.00" | 1920x1080 |
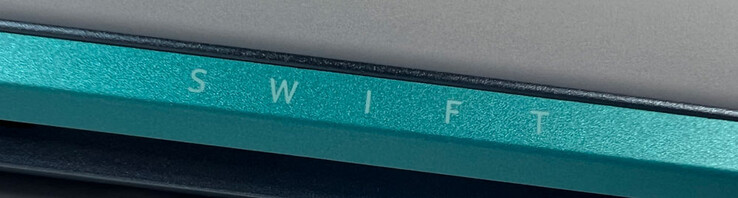
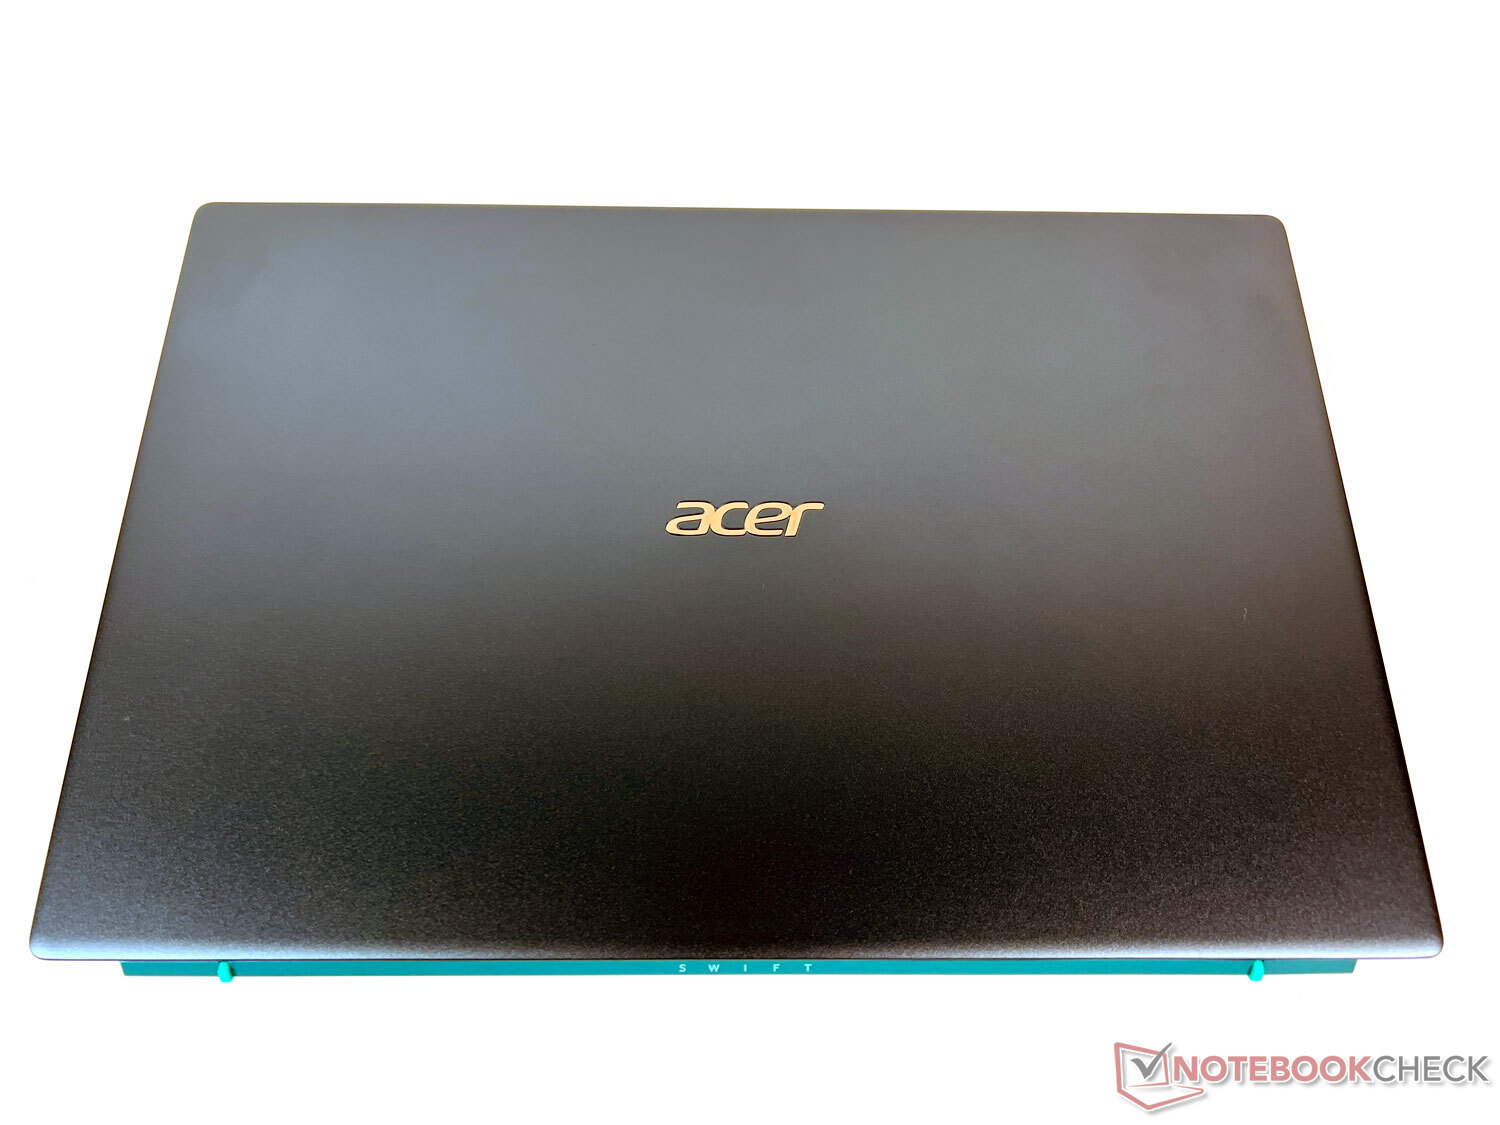
优雅的笔记本电脑包,绿松石色吸引眼球,重量较轻
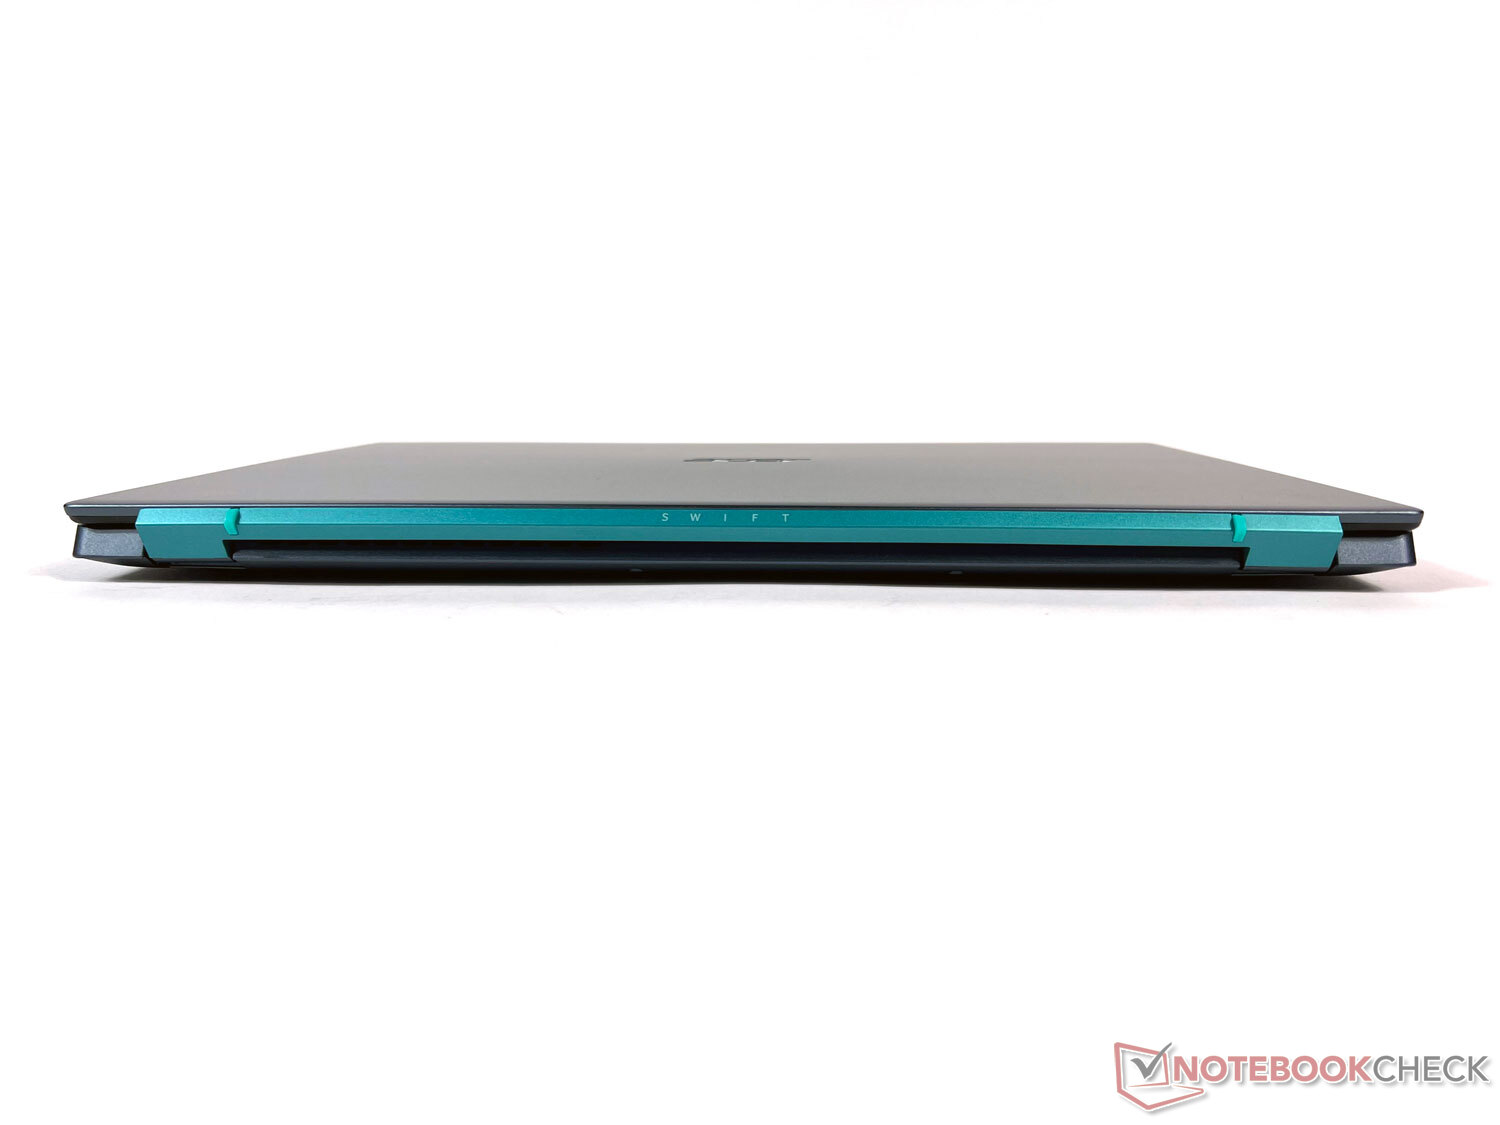
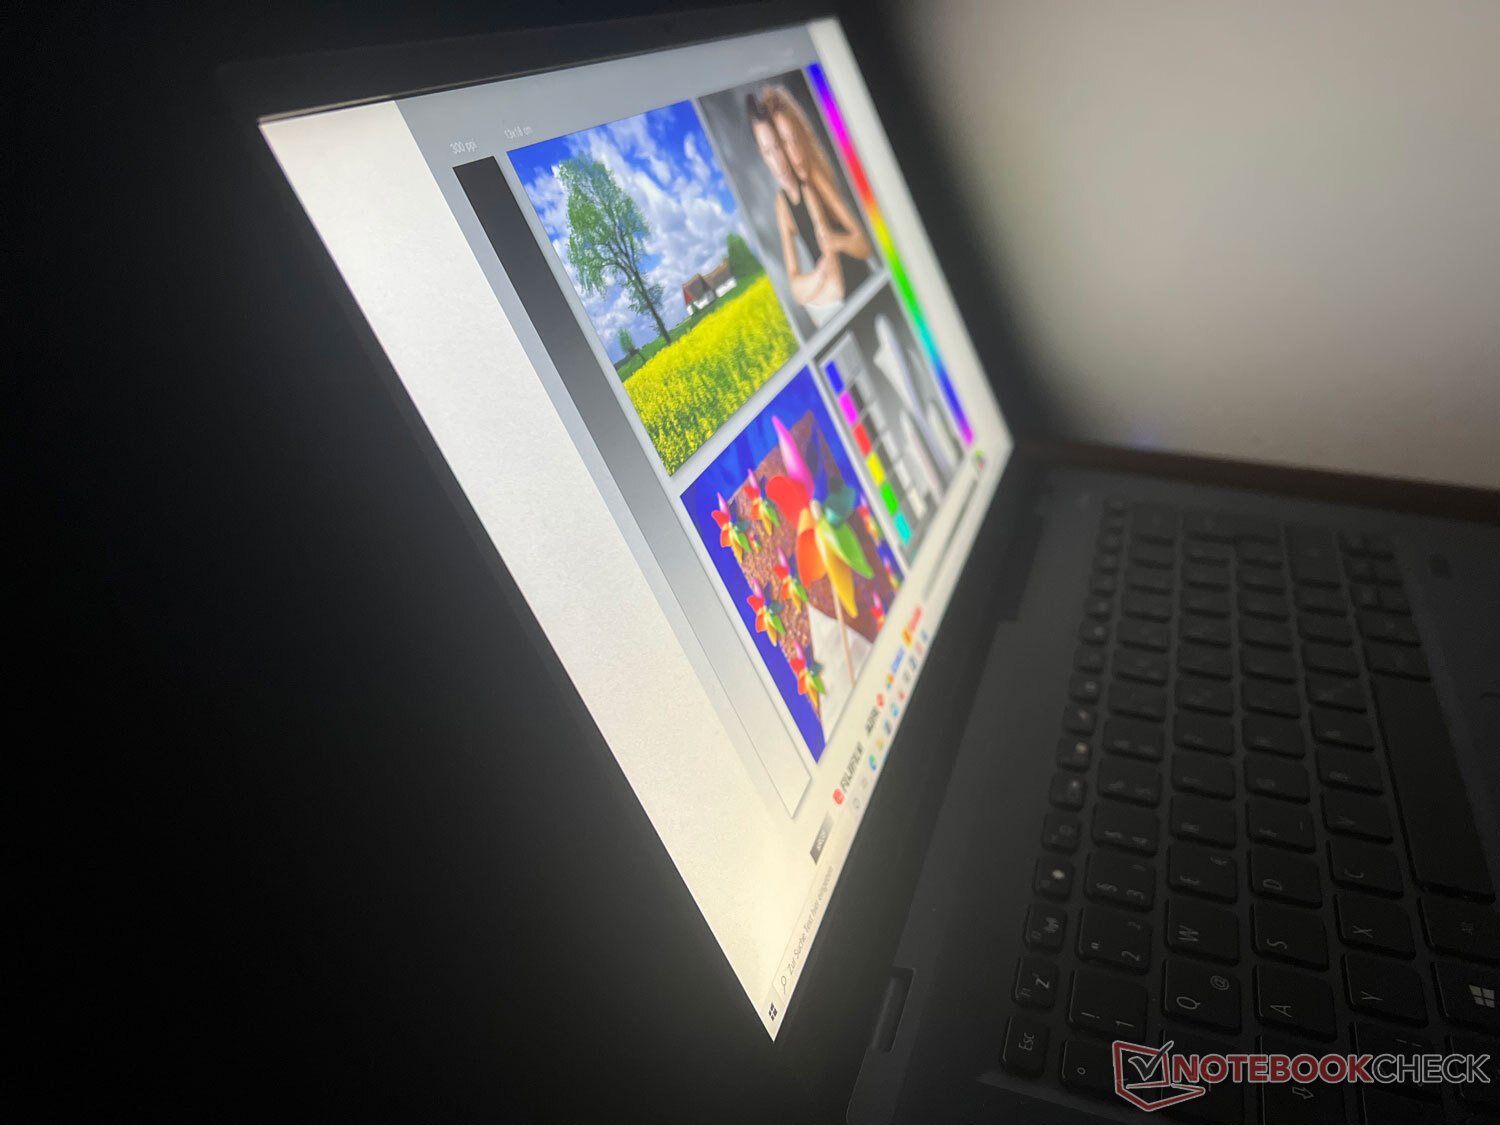
宏碁提供了Swift 3X SF314的两种颜色版本。Safari Gold和Steam Blue。我们测试的是更低调的灰蓝色型号,它至少提供了一个小的吸引眼球的东西,它的松石绿色条纹包括两个铰链之间的Swift标志。
除此之外,高质量的铝镁合金外壳具有相当内敛的设计和优雅的触觉效果。底座具有抗扭性,可以很容易地用一个角来搬运。
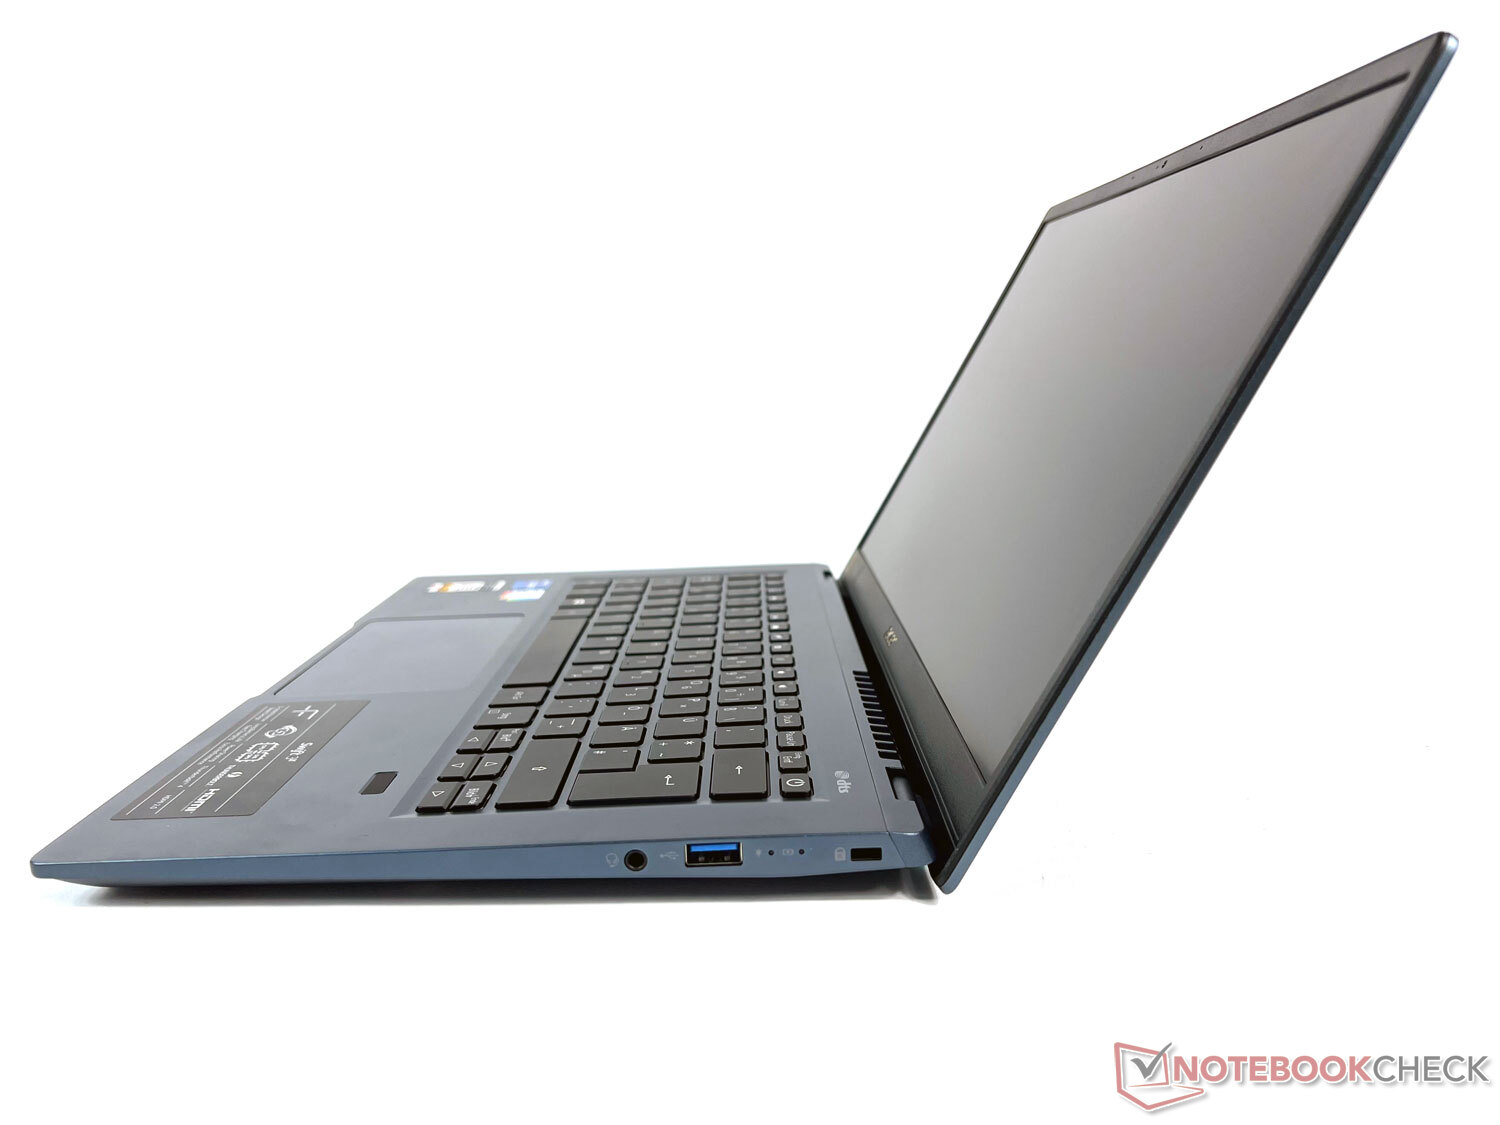
两个铰链将屏幕牢牢固定在位置上。这确保了在移动笔记本电脑时只有很小的晃动,但却使得用一只手打开盖子很困难。此外,在我们的测试设备中,有轻微的吱吱声。


这款14英寸的笔记本电脑并不像许多次笔记本那样轻,只有不到1.4公斤,但它在我们的比较领域不需要避讳。特别轻薄的宏碁Swift 5 SF514要轻得多,大约1公斤。同样配备14英寸显示屏的微星Modern 14的重量差不多,而联想ThinkPad L14 G2则明显更重。
宏碁Swift 3X的厚度略低于18毫米,在此也与微星的竞争对手持平,但它比其他两款Swift对比机型要厚两到三毫米。总的来说,该设备的尺寸使其成为一个令人愉快的紧凑型伴侣,可以存放在公文包、背包或行李中,而不会占用太多空间。
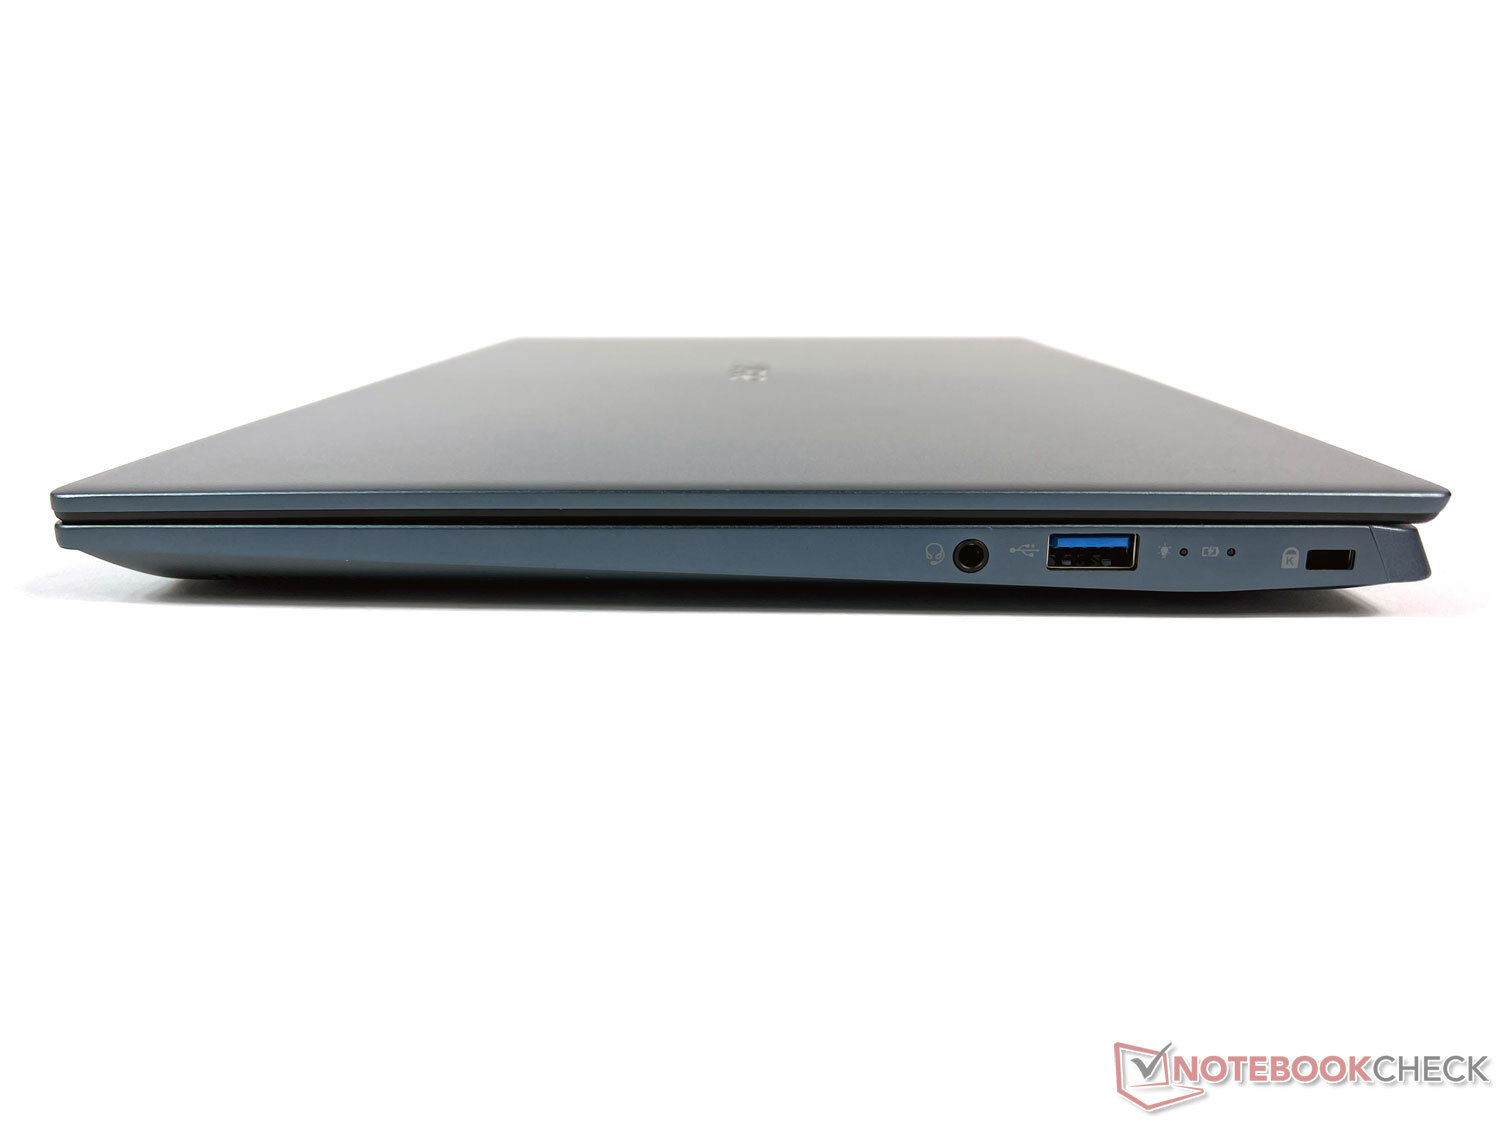
宏碁Swift 3X的连接性不强,但Wi-Fi速度很快
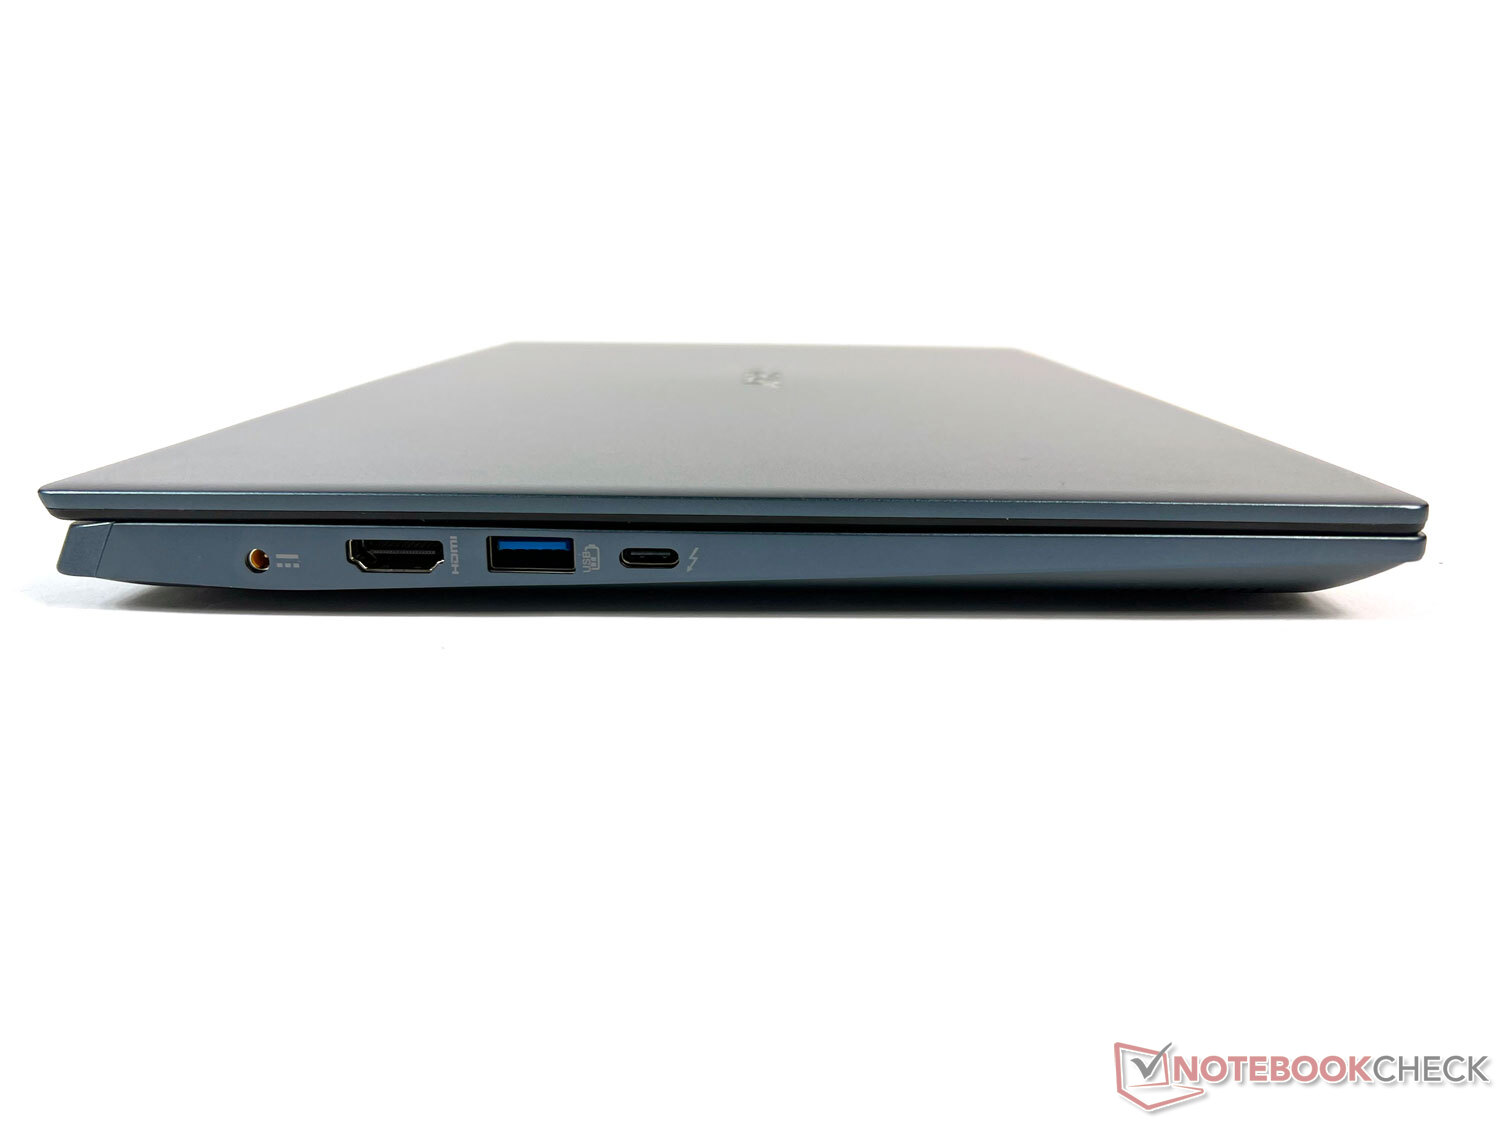
由于宏碁Swift 3X不像其他Swift型号那样超薄,宏碁实际上在这里会有足够的空间来建立一个全面的端口库。但制造商只为该设备提供了两个USB Type-A(5Gb/s)和一个USB Type-C(10Gb/s)与Thunderbolt 4。还有一个用于外部显示器的HDMI端口,但LAN端口和读卡器却没有。
所有的端口都分布在左右两边。在左边,它们之间的距离足够远,即使是较大的USB-A棒也不会干扰到邻近的端口。


沟通
集成的英特尔Wi-Fi 6 AX201 Wi-Fi模块显示出令人尊敬的平均性能。这意味着宏碁Swift 3X不仅能够领先于平均水平,而且还能在发送和接收数据的竞争中确保前三名的位置。然而,测量的速度随着时间的推移而波动得比较厉害。
网络摄像头
这款高清网络摄像头对色彩的捕捉相当准确,这反映在ΔE值上,它是比较领域中第二低的数值。无论是在良好的还是较差的照明条件下,图像都是合格的,对于笔记本摄像头的预期目的来说,它是足够的。


安全问题
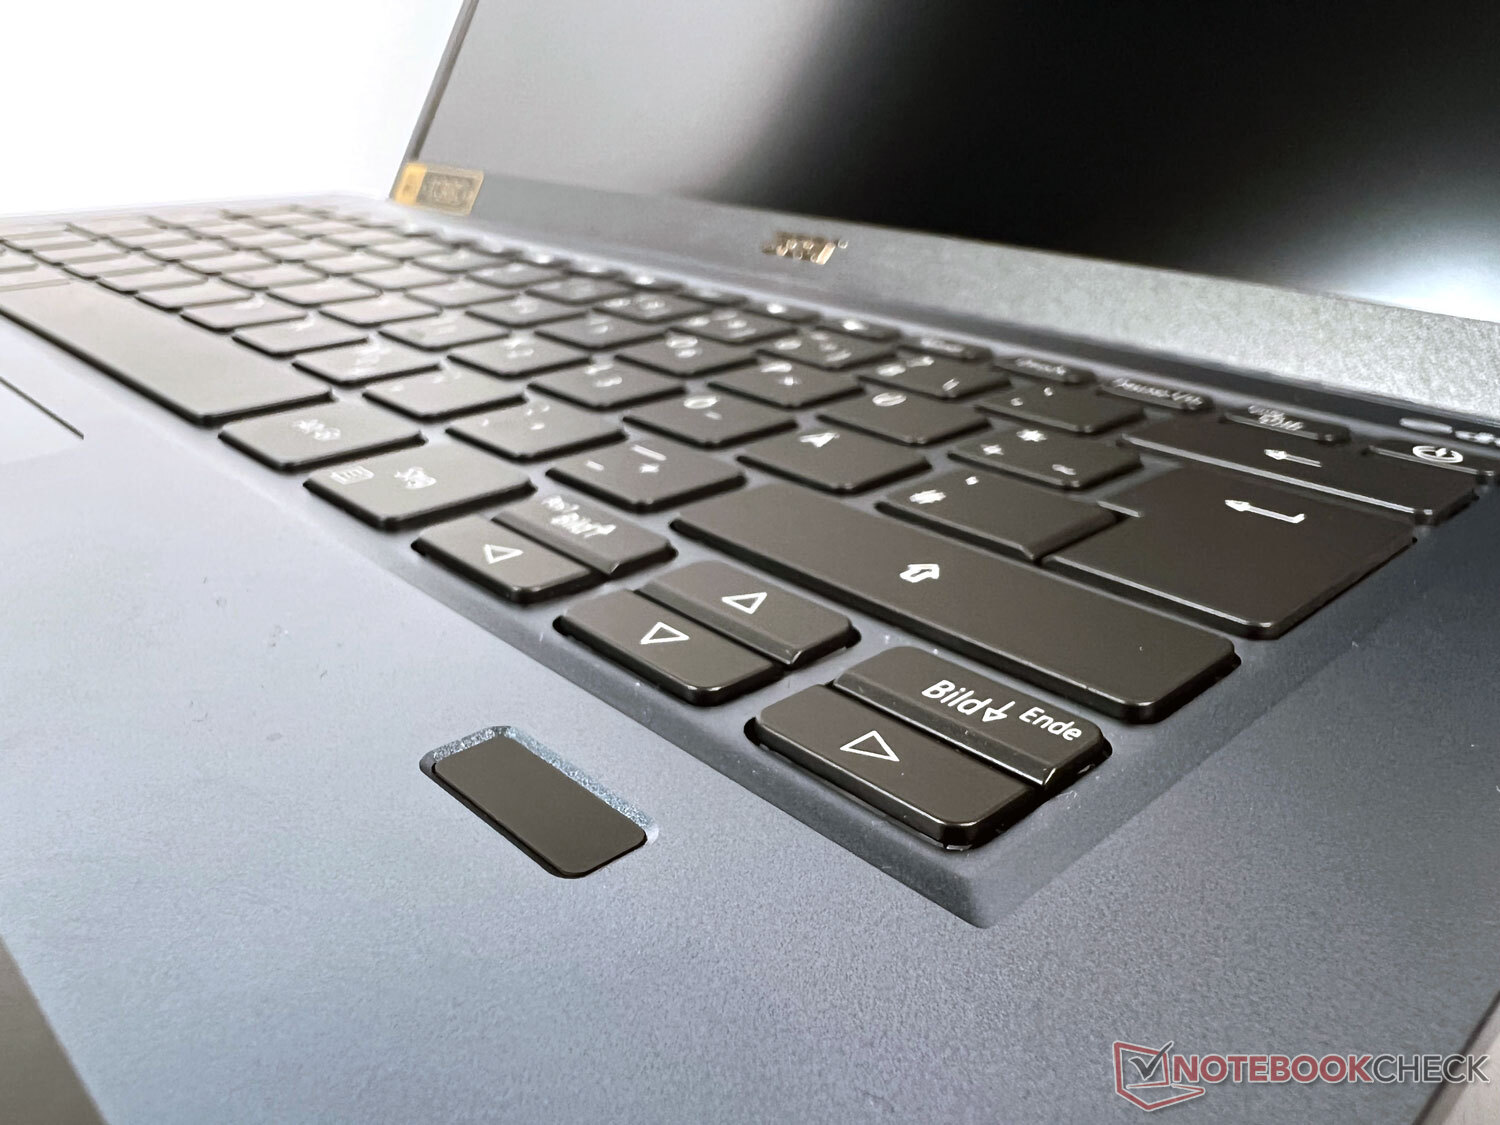
除了一个指纹扫描仪和一个肯辛顿锁的插槽,没有其他安全功能。
辅料
宏碁只在Swift 3X SF314-510G-70DW中包含一个65瓦的电源适配器。其他配件不包括在盒子里。可选择的是,制造商在其在线商店提供一系列通用适配器、便携箱等。
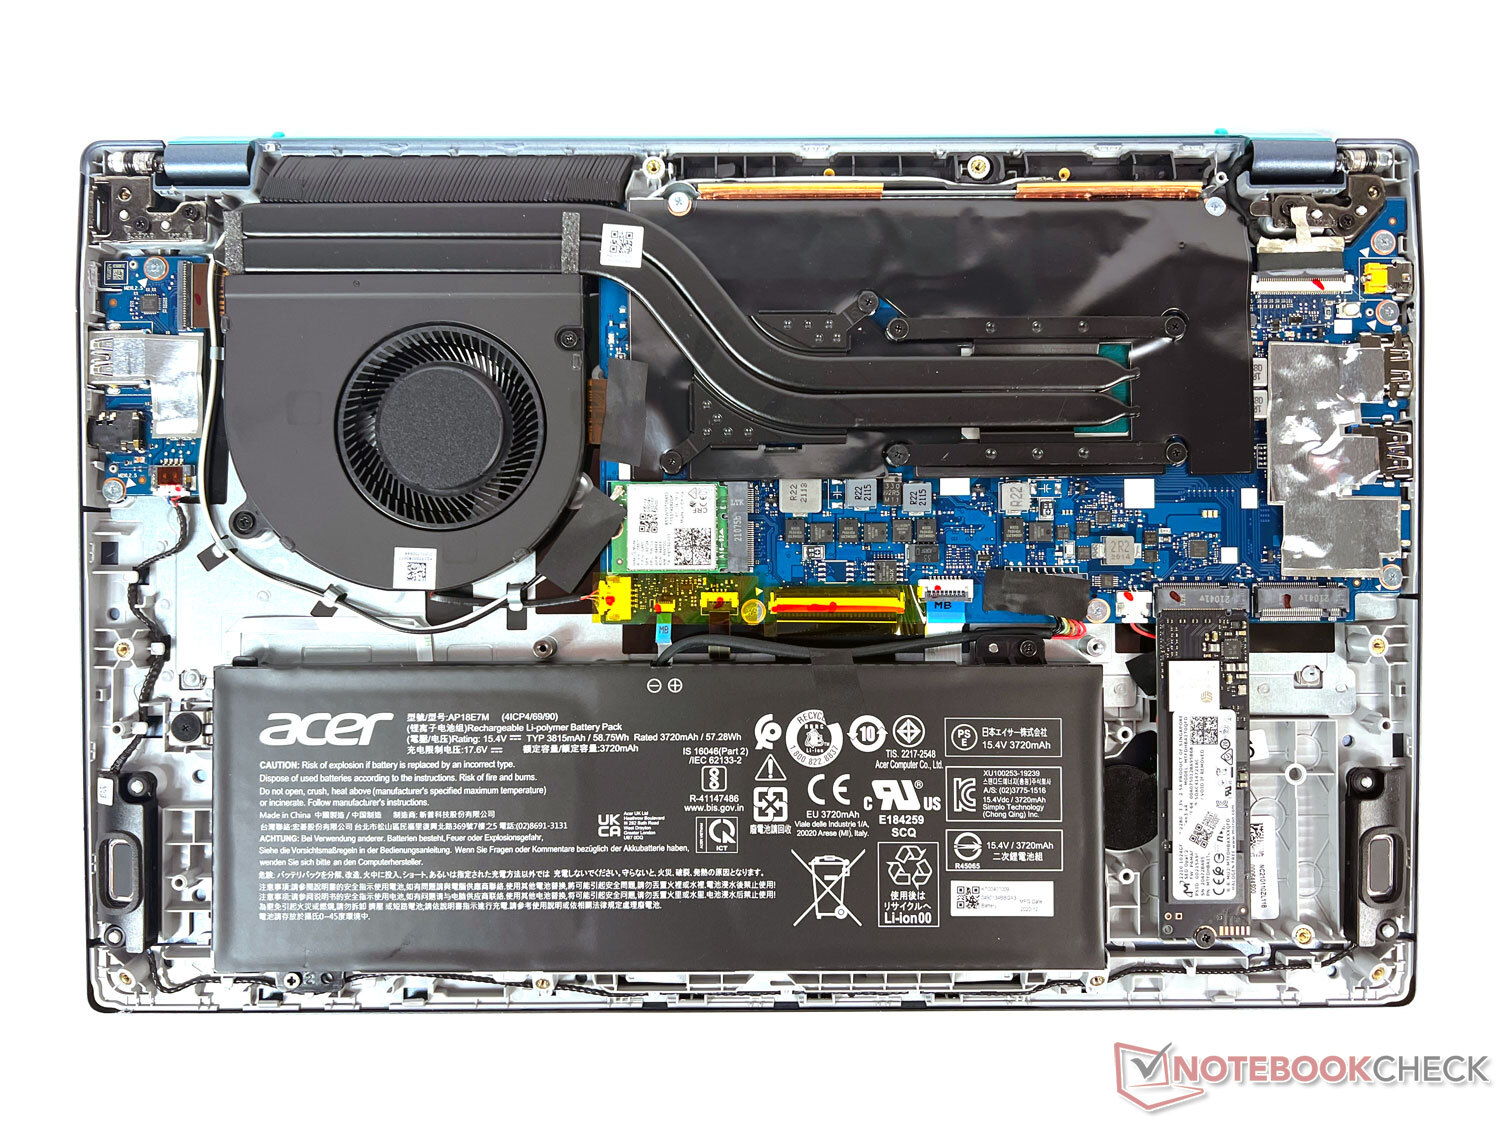
维护
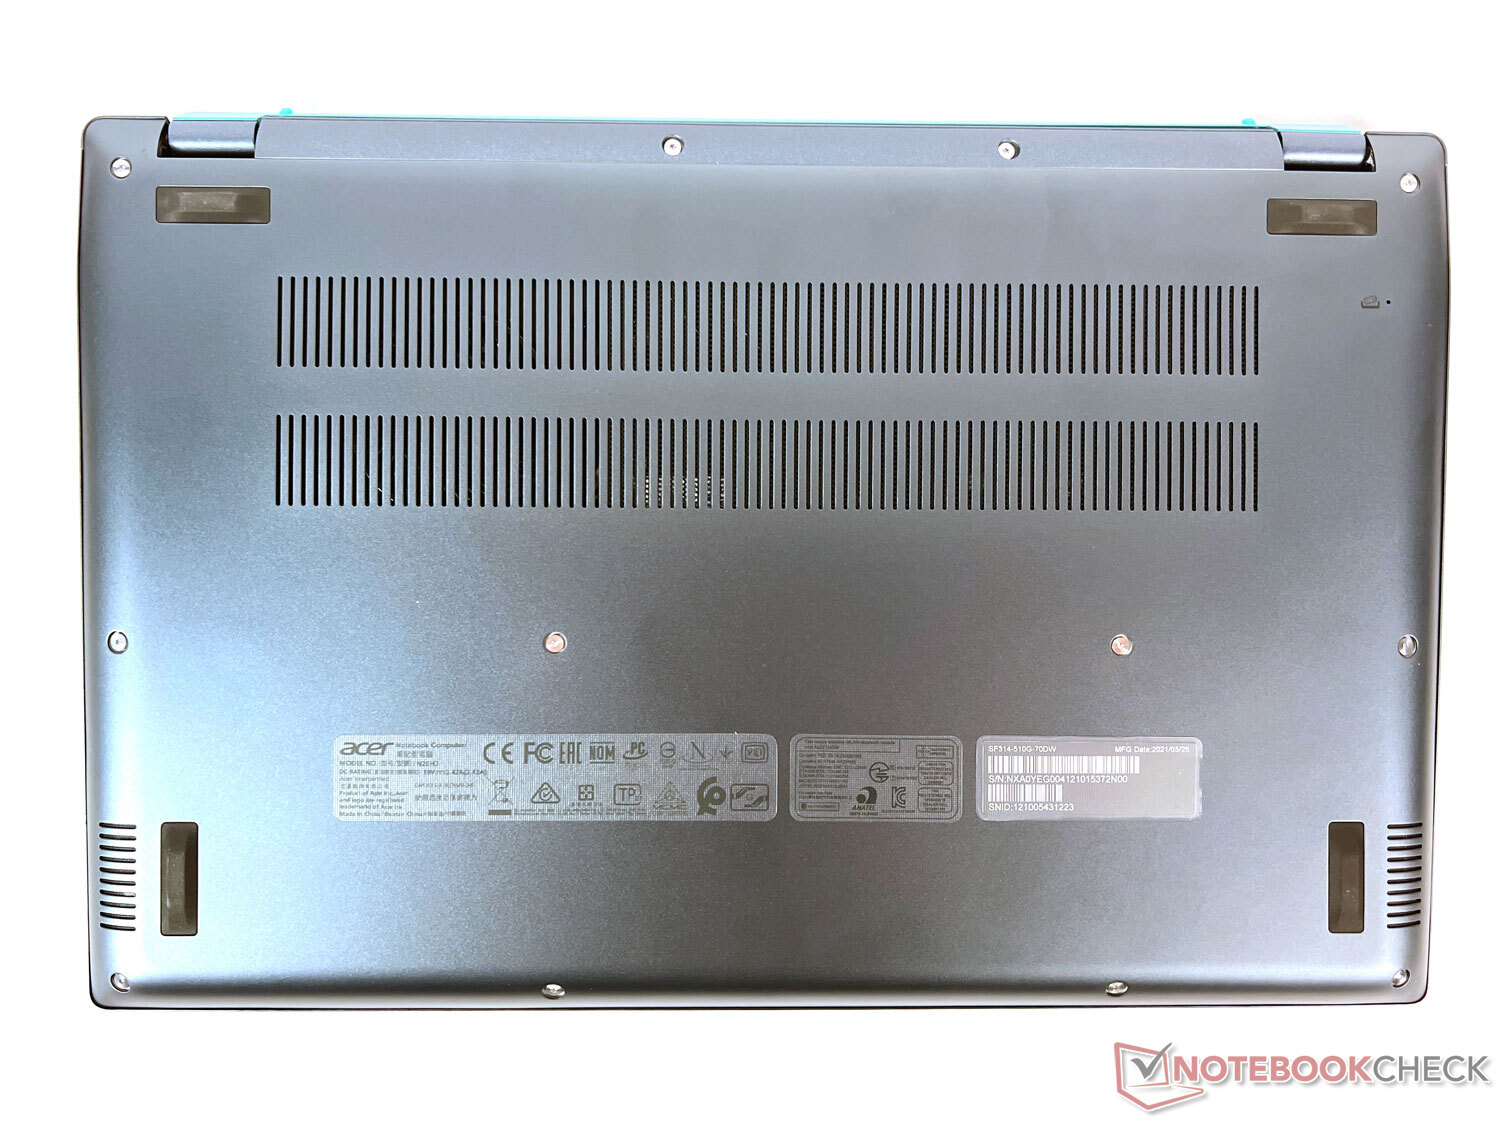
卸下12颗细小的Torx螺丝后,可以进入内部,但只能清洁风扇或更换电池和SSD。对于普通用户来说,没有其他维护选项。
担保
宏碁为其Swift机型提供通常的24个月制造商保修,包括送检和退货服务。可选的服务延期从50欧元(约57美元)开始。
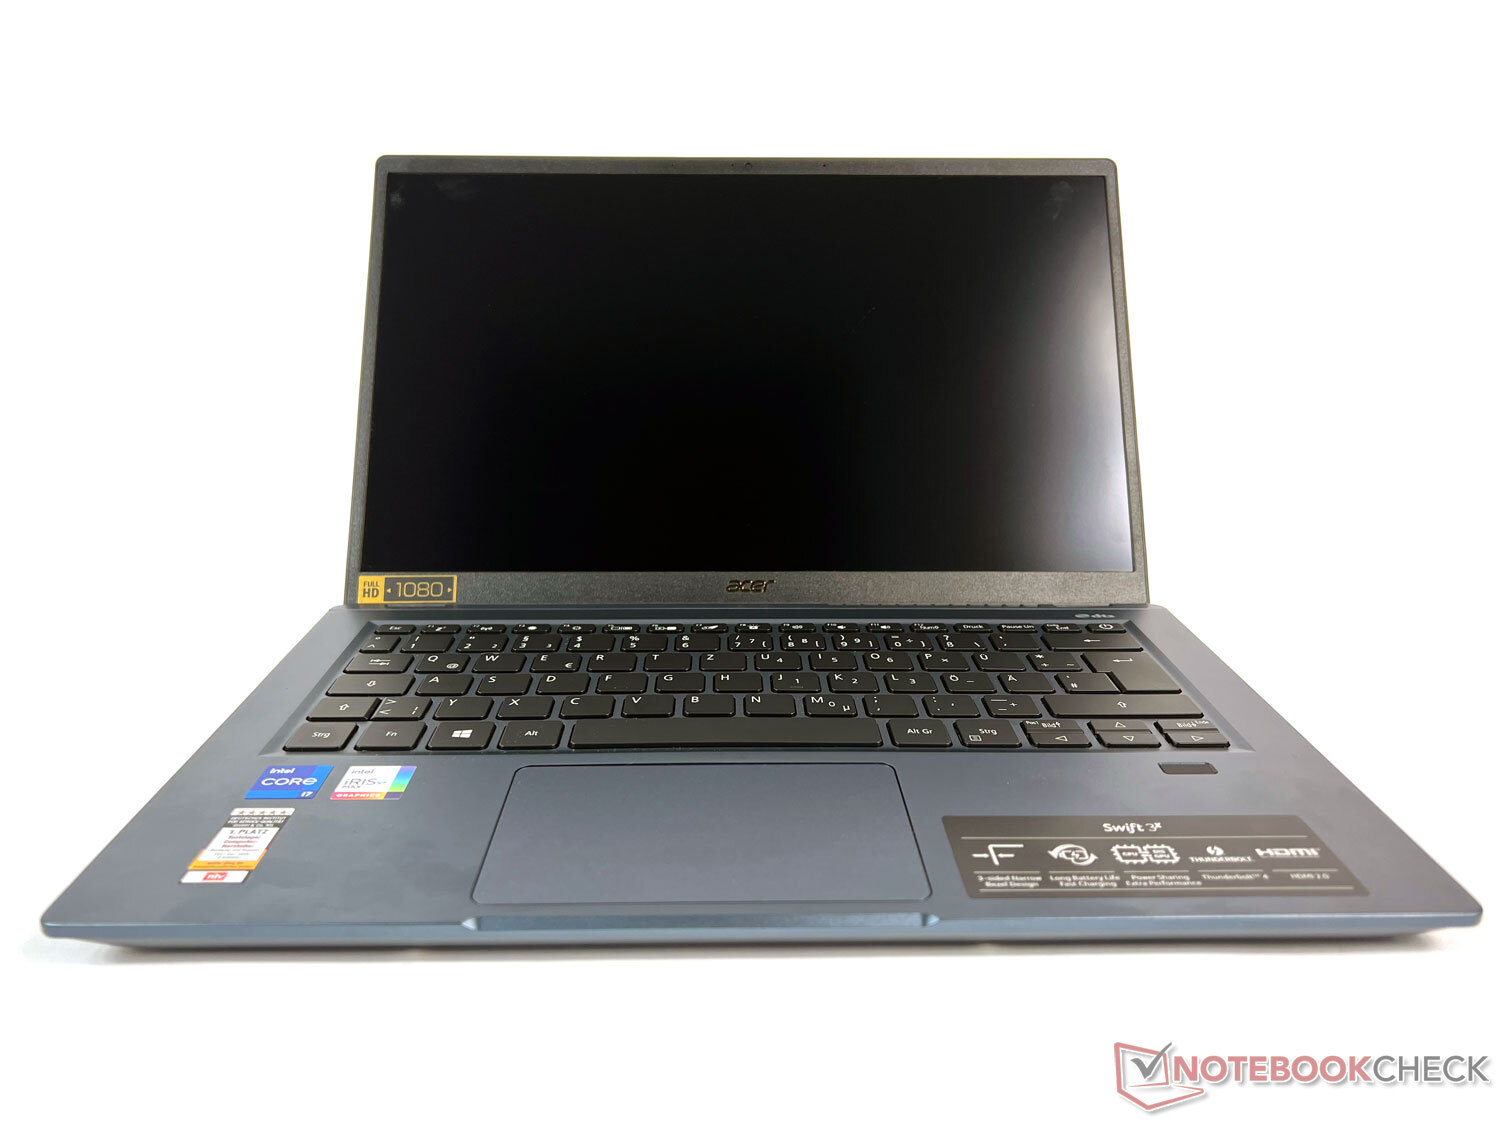
输入设备。宏碁笔记本电脑,配有安静的键盘和指纹扫描仪
由于其14英寸的显示屏,宏碁Swift 3X提供了一个足够大的外壳,适合一个坚固尺寸的键盘。除了左右两边近2.5厘米宽的边缘外,它占据了整个宽度。触摸板几乎位于键盘下方的中心位置,指纹扫描仪位于右侧的方向键下方。
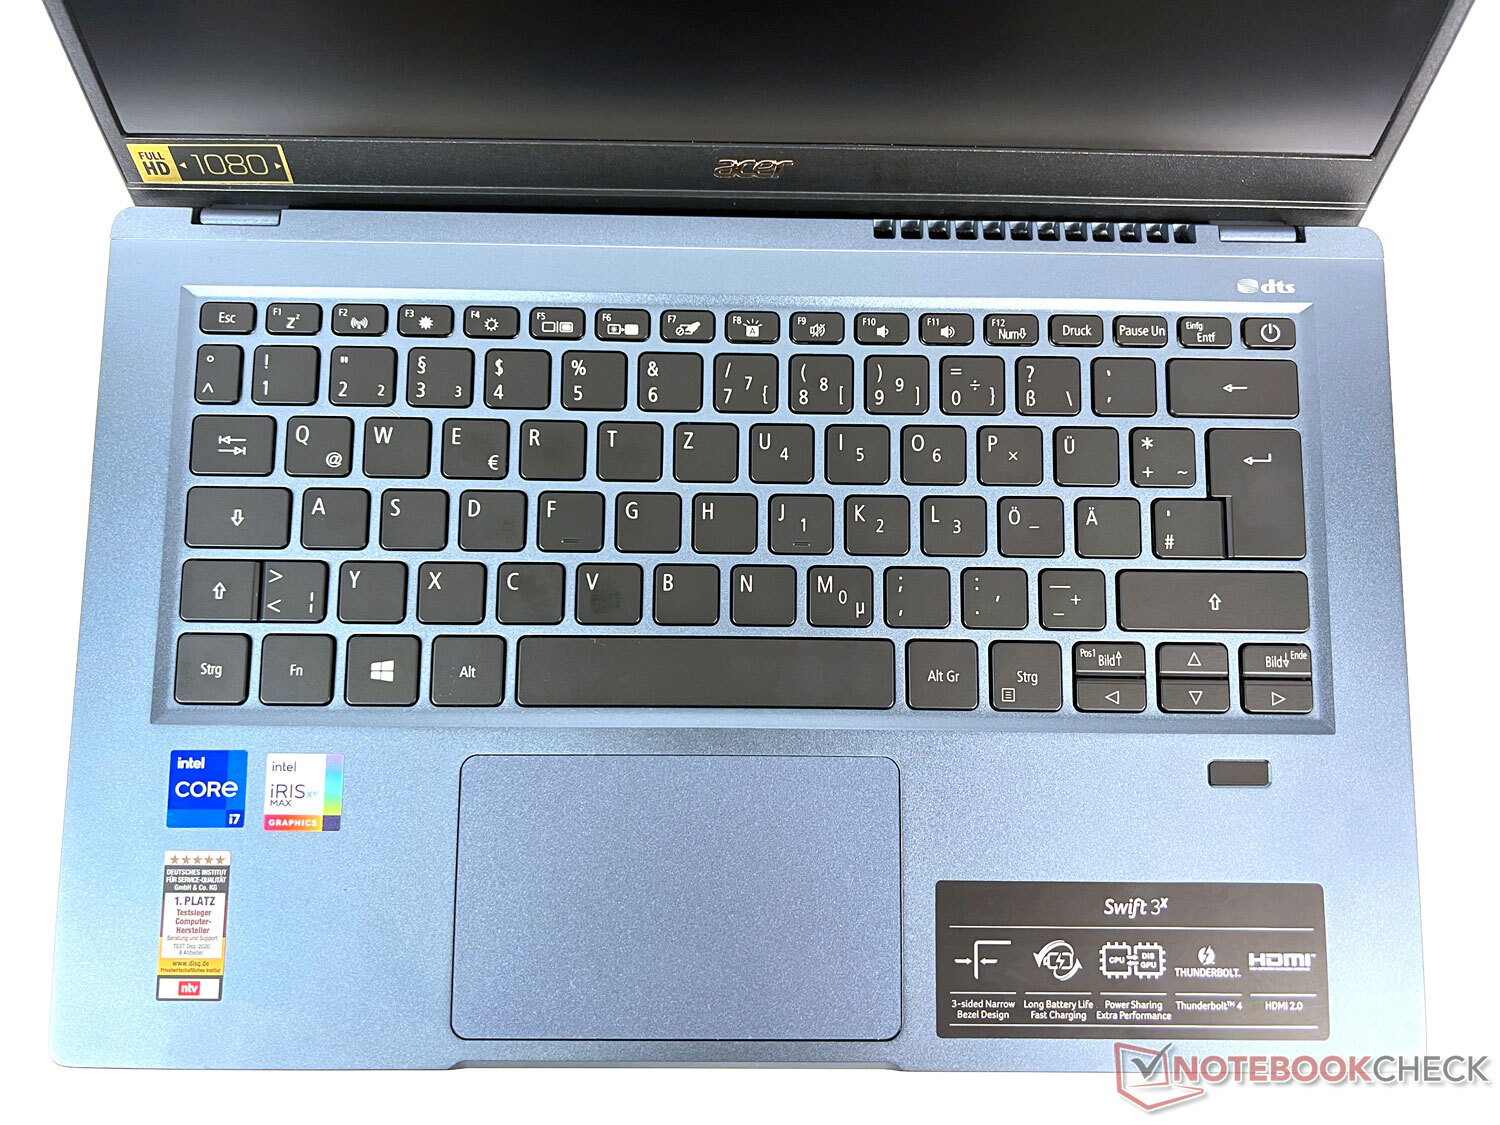

键盘
由于其大约1.5 x 1.5厘米的按键和坚实的行程,在短暂的适应期后,键盘可以很好地使用,而且它也是令人愉快的安静。这一点也适用于空格键,尽管它给人的印象是有点哗哗的。用很大的力气按下这些键会使外壳在中心处略微弯曲。
宏碁将F1至F12键用于某些功能,如打开和关闭Wi-Fi,管理外部显示器设置,以及切换键盘背光。但是,键盘的照明不能调暗。
触摸板
触摸板在空格键下稍稍向左偏移,尺寸约为10.5 x 6.5厘米。其尺寸足够大,手感舒适,使用起来很方便。下部区域的两个集成鼠标按钮在触觉上没有分离,使用时很安静,令人愉快。
明亮的哑光显示屏将宏碁Swift 3X变成一个良好的户外设备
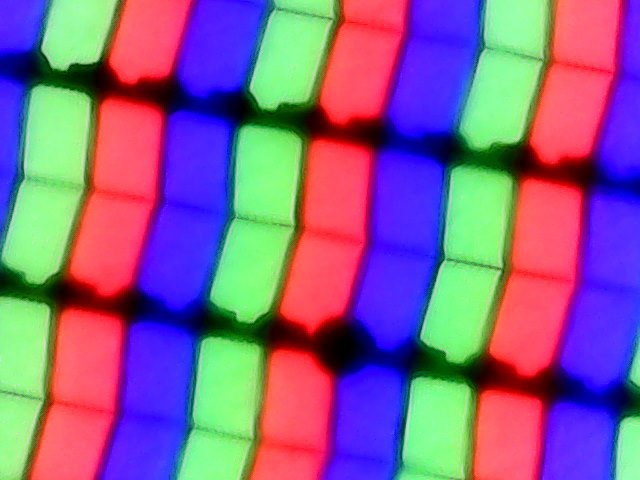

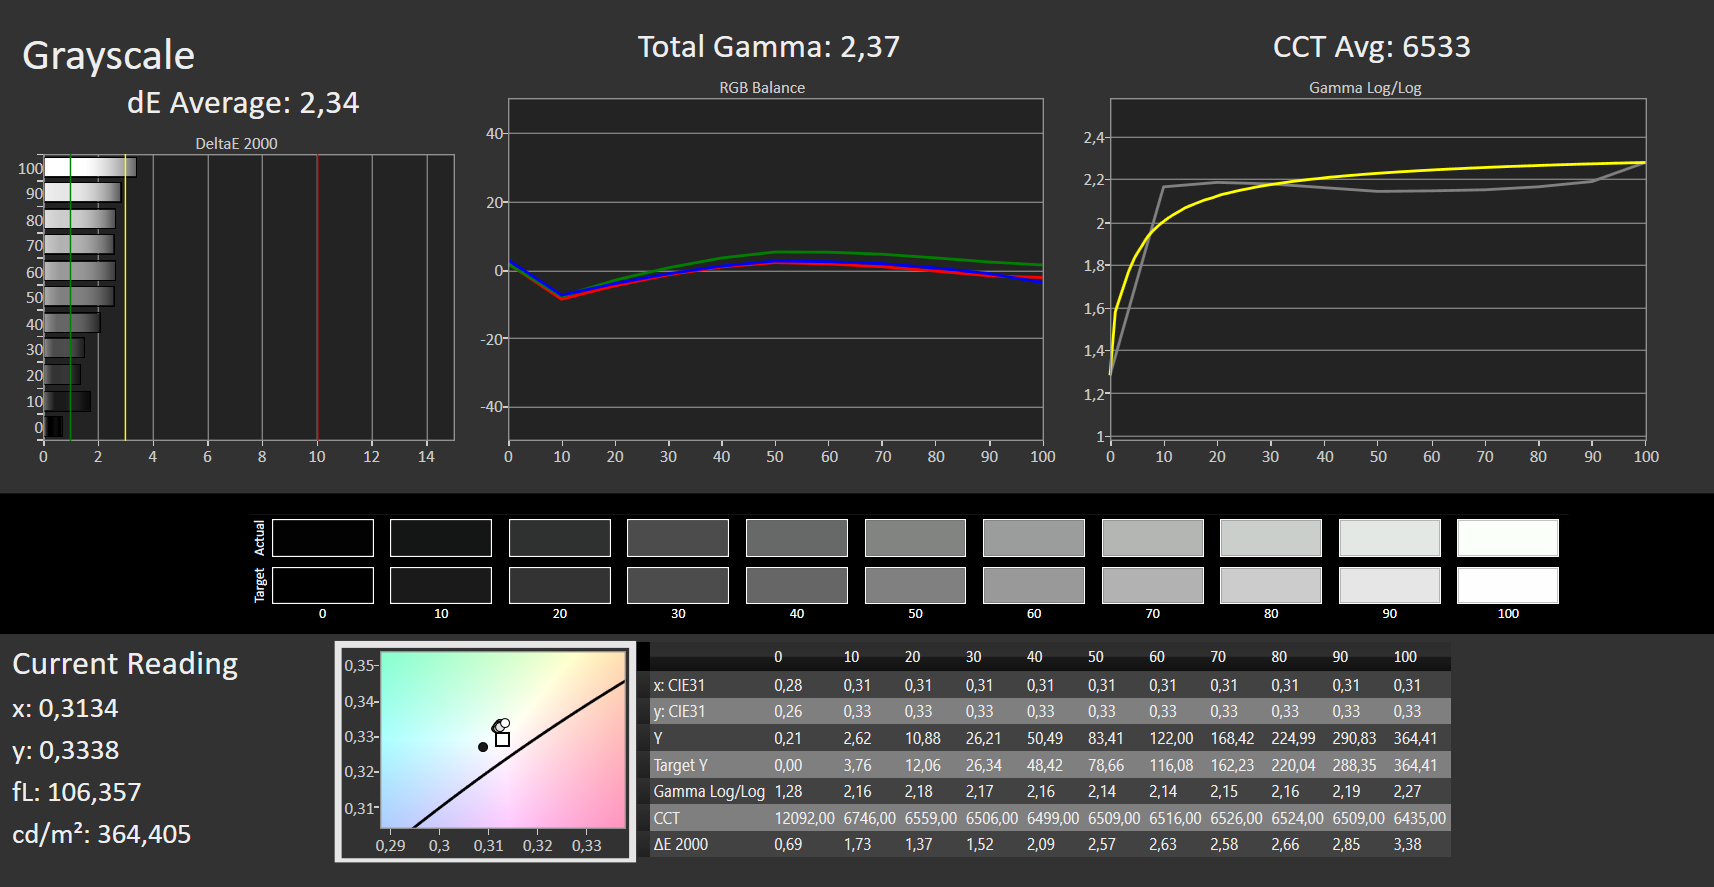
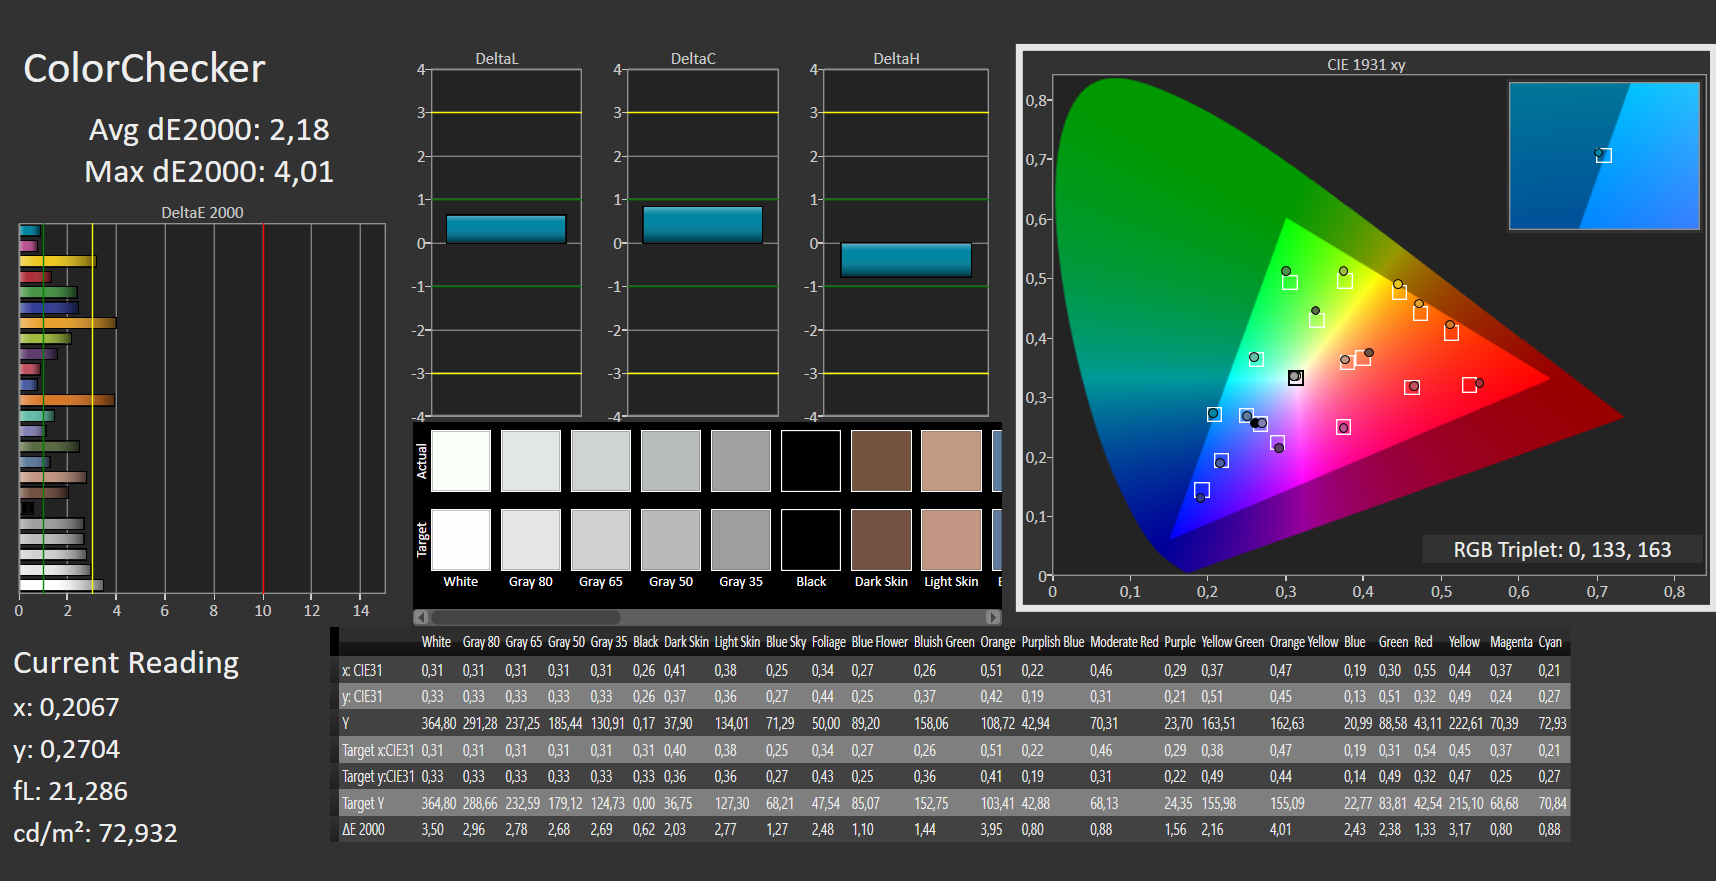
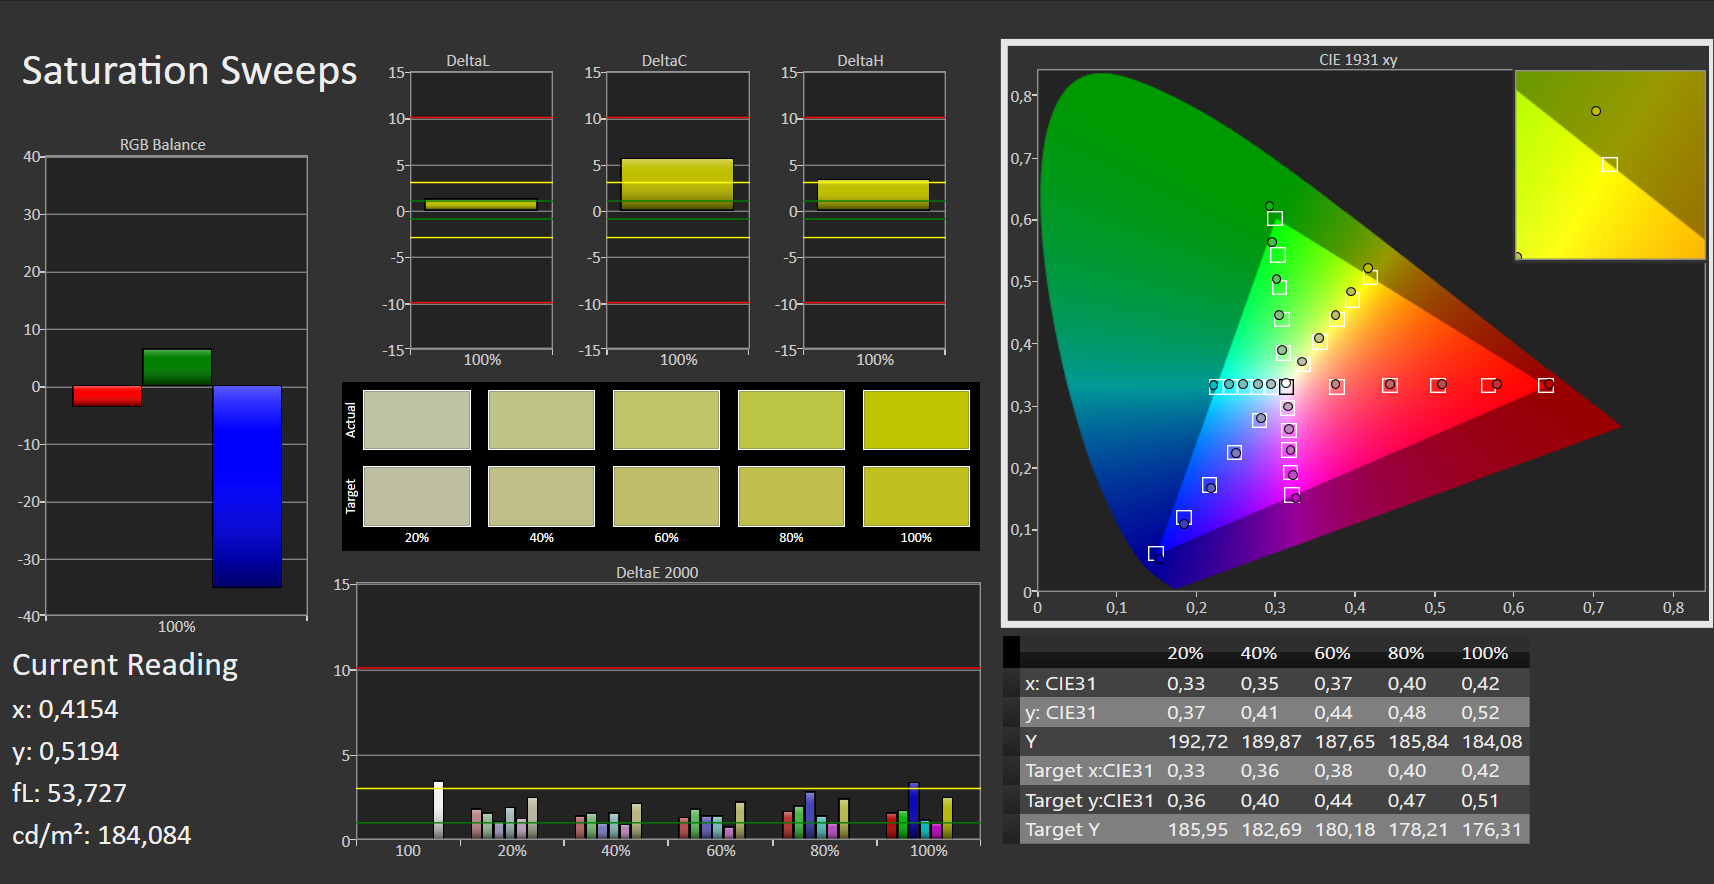
宏碁安装了一块来自友达光电的14英寸、16:9格式的哑光IPS面板。它的分辨率为1920x1080像素(全高清)。主观上,设备的显示质量是令人愉快的,这可以通过测量值客观地证实。
虽然该面板在响应时间方面的得分比大多数对比型号要差,但许多其他方面看起来明显更好。宏碁Swift 3X的平均亮度为372cd/m²,提供了一个令人愉快的明亮显示屏,其照明也相对均匀。然而,在边缘有轻微的混浊以及IPS光晕,这只有在显示完全黑暗的背景时才会看到。
黑度、灰度和颜色都显示得很扎实,DeltaE值刚刚超过2就证明了这一点,除此之外。对比度是仅次于微星对手的第二高。
| |||||||||||||||||||||||||
Brightness Distribution: 89 %
Center on Battery: 364 cd/m²
Contrast: 1916:1 (Black: 0.19 cd/m²)
ΔE ColorChecker Calman: 2.18 | ∀{0.5-29.43 Ø4.71}
ΔE Greyscale Calman: 2.34 | ∀{0.09-98 Ø4.96}
72.5% AdobeRGB 1998 (Argyll 3D)
99% sRGB (Argyll 3D)
71.5% Display P3 (Argyll 3D)
Gamma: 2.37
CCT: 6533 K
| Acer Swift 3X SF314-510G-70DW AU Optronics AUO683D, IPS, 1920x1080, 14" | Asus Vivobook 15 K513EQ Samsung ATNA56YX03-0, OLED, 1920x1080, 15.6" | Dell Inspiron 15 7000 7506 2-in-1 Black Edition AU Optronics B156ZAN, IPS, 3840x2160, 15.6" | Lenovo ThinkPad L14 G2 AMD B140HAN04.0, IPS LED, 1920x1080, 14" | Acer Swift 3 SF316-51 Chi Mei CMN160B, IPS, 1920x1080, 16.1" | Acer Swift 5 SF514-55T-58DN AU Optronics AUO7490, IPS, 1920x1080, 14" | MSI Modern 14 B11SB-085 BOE CQ NV140FHM-N4V, IPS, 1920x1080, 14" | |
|---|---|---|---|---|---|---|---|
| Display | 26% | 2% | -46% | -4% | -4% | -43% | |
| Display P3 Coverage (%) | 71.5 | 99.9 40% | 74.3 4% | 37.5 -48% | 66.6 -7% | 67 -6% | 39.9 -44% |
| sRGB Coverage (%) | 99 | 100 1% | 99 0% | 56.3 -43% | 99.5 1% | 98.3 -1% | 58.8 -41% |
| AdobeRGB 1998 Coverage (%) | 72.5 | 99.9 38% | 74.6 3% | 38.7 -47% | 68.5 -6% | 68.3 -6% | 41.2 -43% |
| Response Times | 93% | -18% | 16% | 31% | 44% | 46% | |
| Response Time Grey 50% / Grey 80% * (ms) | 48 ? | 2.2 ? 95% | 55.2 ? -15% | 36 ? 25% | 32 ? 33% | 30 ? 37% | 25 ? 48% |
| Response Time Black / White * (ms) | 28 ? | 2.9 ? 90% | 34 ? -21% | 26 ? 7% | 20 ? 29% | 14 ? 50% | 16 ? 43% |
| PWM Frequency (Hz) | 59.5 ? | 2500 ? | 92 ? | ||||
| Screen | -3% | -64% | -105% | 0% | 6% | -46% | |
| Brightness middle (cd/m²) | 364 | 384.5 6% | 303.8 -17% | 278 -24% | 304 -16% | 404 11% | 347 -5% |
| Brightness (cd/m²) | 372 | 388 4% | 296 -20% | 255 -31% | 284 -24% | 377 1% | 311 -16% |
| Brightness Distribution (%) | 89 | 98 10% | 93 4% | 86 -3% | 88 -1% | 79 -11% | 81 -9% |
| Black Level * (cd/m²) | 0.19 | 0.24 -26% | 0.33 -74% | 0.165 13% | 0.25 -32% | 0.12 37% | |
| Contrast (:1) | 1916 | 1266 -34% | 842 -56% | 1842 -4% | 1616 -16% | 2892 51% | |
| Colorchecker dE 2000 * | 2.18 | 2.53 -16% | 4.58 -110% | 5.9 -171% | 1.44 34% | 1.47 33% | 5.05 -132% |
| Colorchecker dE 2000 max. * | 4.01 | 6.16 -54% | 9.4 -134% | 20.2 -404% | 3.62 10% | 2.6 35% | 16.98 -323% |
| Greyscale dE 2000 * | 2.34 | 1.6 32% | 6.4 -174% | 4.1 -75% | 2.6 -11% | 1.7 27% | 1.63 30% |
| Gamma | 2.37 93% | 2.24 98% | 2.3 96% | 2.15 102% | 2.41 91% | 2.35 94% | 2.3 96% |
| CCT | 6533 99% | 6464 101% | 7414 88% | 7224 90% | 6527 100% | 6662 98% | 6666 98% |
| Colorchecker dE 2000 calibrated * | 2.17 | 4.5 | 0.84 | ||||
| Color Space (Percent of AdobeRGB 1998) (%) | 66.7 | 68.5 | 63 | 38 | |||
| Color Space (Percent of sRGB) (%) | 99 | 99.5 | 98 | 58 | |||
| Total Average (Program / Settings) | 39% /
22% | -27% /
-42% | -45% /
-73% | 9% /
4% | 15% /
9% | -14% /
-31% |
* ... smaller is better
宏碁Swift 3X的显示屏覆盖99%的sRGB色彩空间。DCI-P3和AdobeRGB 1998的数值刚刚超过70%,这使得该设备相当不适合专业图形编辑。
Display Response Times
| ↔ Response Time Black to White | ||
|---|---|---|
| 28 ms ... rise ↗ and fall ↘ combined | ↗ 14 ms rise |  |
| ↘ 14 ms fall | ||
| The screen shows relatively slow response rates in our tests and may be too slow for gamers. In comparison, all tested devices range from 0.1 (minimum) to 240 (maximum) ms. » 71 % of all devices are better. This means that the measured response time is worse than the average of all tested devices (19.8 ms). | ||
| ↔ Response Time 50% Grey to 80% Grey | ||
| 48 ms ... rise ↗ and fall ↘ combined | ↗ 21 ms rise |  |
| ↘ 27 ms fall | ||
| The screen shows slow response rates in our tests and will be unsatisfactory for gamers. In comparison, all tested devices range from 0.165 (minimum) to 636 (maximum) ms. » 82 % of all devices are better. This means that the measured response time is worse than the average of all tested devices (30.9 ms). | ||
Screen Flickering / PWM (Pulse-Width Modulation)
| Screen flickering / PWM not detected |  | ||
In comparison: 52 % of all tested devices do not use PWM to dim the display. If PWM was detected, an average of 7741 (minimum: 5 - maximum: 343500) Hz was measured. | |||
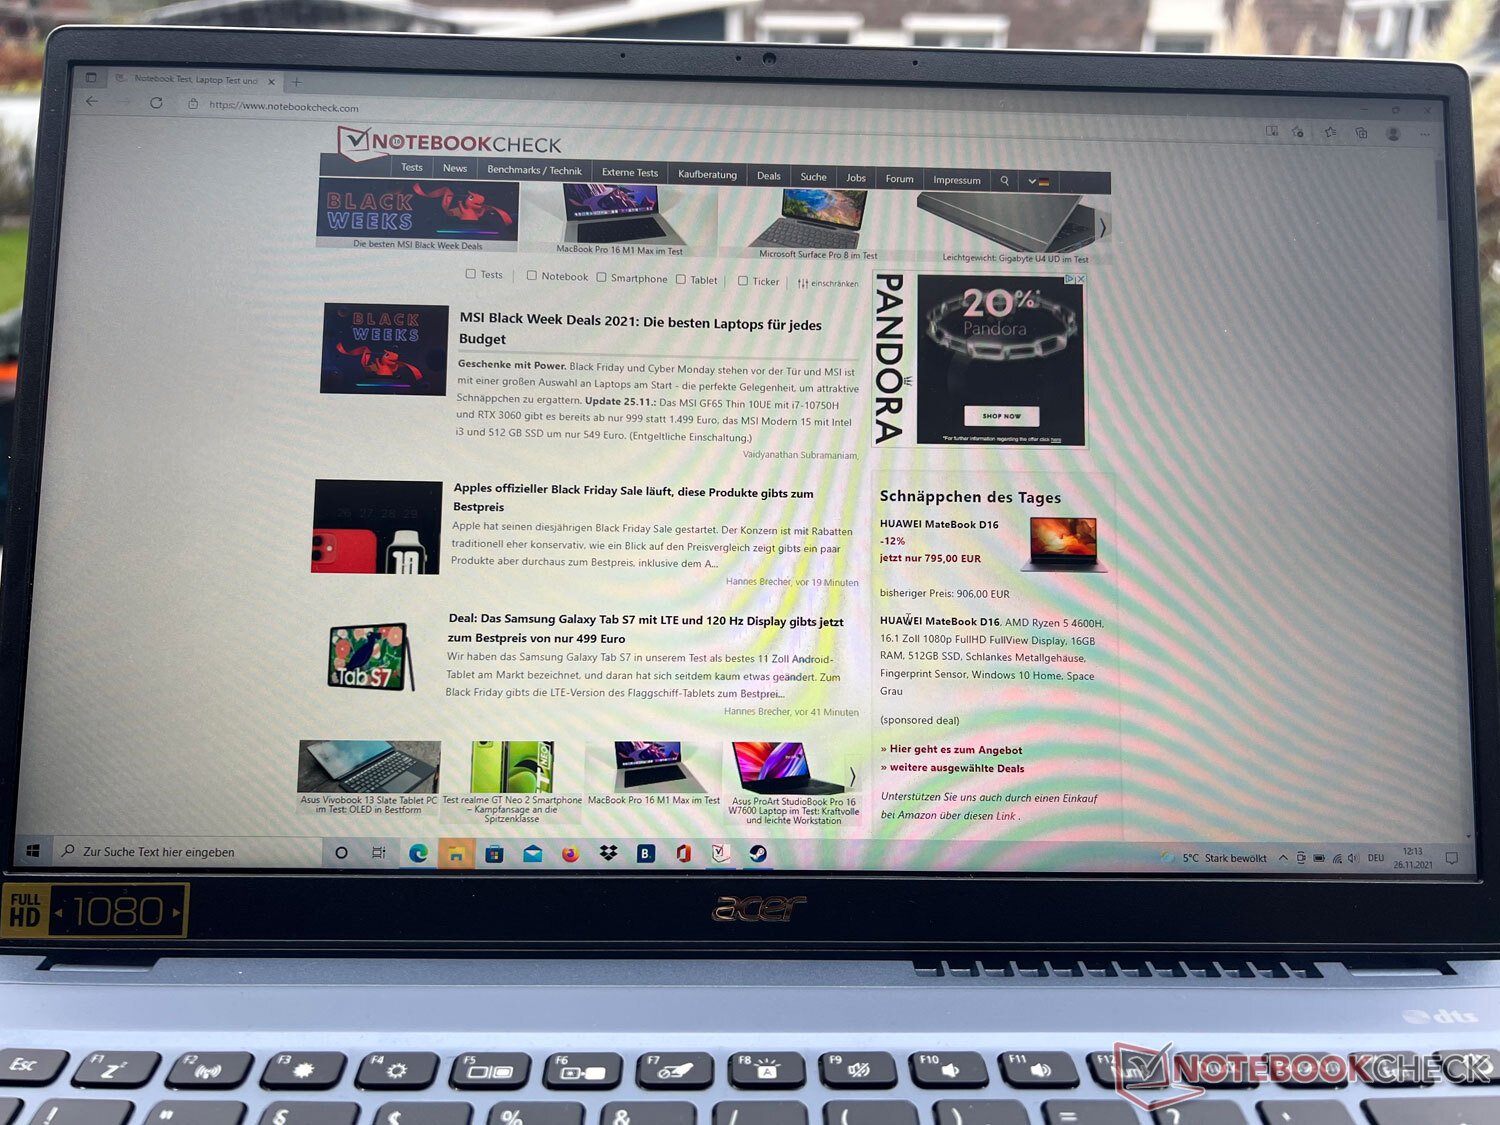
由于哑光显示屏具有相当高的亮度,宏碁Swift 3X SF314-510G-70DW也很适合在户外使用。与大多数笔记本电脑一样,在阳光直射下能见度会变差。然而,该设备在户外的阴凉处使用也没有问题。
此外,显示屏的视角非常稳定,正如IPS面板所预期的那样。因此,从非常倾斜的视角仍然可以很好地识别内容。
专用的GPU和快速的CPU带来了最大的性能
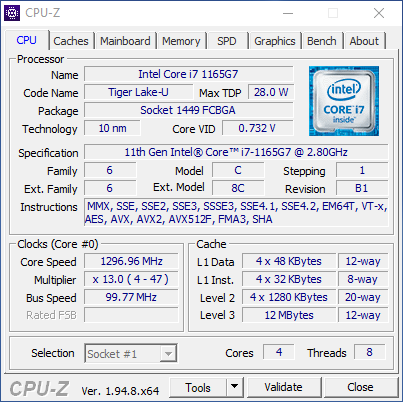
我们评测的宏碁Swift 3X的型号为SF314-510G-70DW,配备了广泛使用的英特尔酷睿i7-1165G7从Tiger Lake 代的处理器,专用的英特尔Iris Xe MAXGPU,4GB板载内存,以及双通道模式的16GB LPDDR4X内存和1TB SSD。有了这个配置,该设备应该可以胜任办公和多媒体设备的所有常规任务,也应该适合偶尔的游戏。下面的基准测试将揭示这一点是否得到证实,以及该设备是否能发挥其理论潜力。
另外,宏碁提供Swift 3X SF314-510G的其他配置,包括较弱的i5-1135G7和一半的内存。英特尔Iris Xe Max图形总是在机上。
测试条件
性能测量是使用 "最佳性能 "的Windows电源计划进行的。制造商并没有通过宏碁护理中心提供自己的性能模式。CPU的最大TDP为28瓦。当电源适配器插入Swift 3X时,宏碁在短期内为处理器提供高达64瓦(PL2)的电源,在长期负载下提供12瓦(PL1)。在电池供电的情况下,PL1值最小降至11.5瓦。
处理器
内置的英特尔酷睿i7-1165G7由四个核心组成,基本时钟频率为2.8GHz,加速时钟速度为4.7GHz(所有核心为4.1GHz)。在我们的CPU基准测试中,宏碁Swift 3X在竞争者中一直排名前三,尽管它从未进入最前列。正如预期的那样,这通常是配备AMD Ryzen 7 PRO 5850U(其多核性能高得多)或更强的英特尔Core i7-11370H的设备。然而,与后者的差距相当小。
另一方面,Swift 3X经常将拥有相同CPU的其他对比机型甩在后面,它的定位总是高于英特尔酷睿i7-1165G7的平均得分。在Cinebench多核测试中,在一个短暂的初始峰值之后,性能随着时间的推移保持非常稳定,这意味着即使在长时间的负载中,CPU的性能也不会波动或下降。在电池供电的情况下,处理器性能下降了约20%至30%。
Cinebench R15 Multi endurance test
Cinebench R23: Multi Core | Single Core
Cinebench R20: CPU (Multi Core) | CPU (Single Core)
Cinebench R15: CPU Multi 64Bit | CPU Single 64Bit
Blender: v2.79 BMW27 CPU
7-Zip 18.03: 7z b 4 | 7z b 4 -mmt1
Geekbench 5.5: Multi-Core | Single-Core
HWBOT x265 Benchmark v2.2: 4k Preset
LibreOffice : 20 Documents To PDF
R Benchmark 2.5: Overall mean
| CPU Performance rating | |
| Average of class Multimedia | |
| Lenovo ThinkPad L14 G2 AMD | |
| Acer Swift 3 SF316-51 | |
| Acer Swift 3X SF314-510G-70DW | |
| Asus Vivobook 15 K513EQ -2! | |
| MSI Modern 14 B11SB-085 | |
| Average Intel Core i7-1165G7 | |
| Dell Inspiron 15 7000 7506 2-in-1 Black Edition -1! | |
| Acer Swift 5 SF514-55T-58DN -2! | |
| Cinebench R23 / Multi Core | |
| Average of class Multimedia (4861 - 33362, n=65, last 2 years) | |
| Lenovo ThinkPad L14 G2 AMD | |
| Acer Swift 3 SF316-51 | |
| Acer Swift 3X SF314-510G-70DW | |
| Asus Vivobook 15 K513EQ | |
| MSI Modern 14 B11SB-085 | |
| Average Intel Core i7-1165G7 (2525 - 6862, n=64) | |
| Dell Inspiron 15 7000 7506 2-in-1 Black Edition | |
| Cinebench R23 / Single Core | |
| Average of class Multimedia (1128 - 2459, n=64, last 2 years) | |
| Acer Swift 3 SF316-51 | |
| Acer Swift 3X SF314-510G-70DW | |
| MSI Modern 14 B11SB-085 | |
| Asus Vivobook 15 K513EQ | |
| Average Intel Core i7-1165G7 (1110 - 1539, n=59) | |
| Lenovo ThinkPad L14 G2 AMD | |
| Cinebench R20 / CPU (Multi Core) | |
| Average of class Multimedia (1887 - 12912, n=56, last 2 years) | |
| Lenovo ThinkPad L14 G2 AMD | |
| Acer Swift 3 SF316-51 | |
| Acer Swift 3X SF314-510G-70DW | |
| Asus Vivobook 15 K513EQ | |
| MSI Modern 14 B11SB-085 | |
| Acer Swift 5 SF514-55T-58DN | |
| Average Intel Core i7-1165G7 (1060 - 2657, n=81) | |
| Dell Inspiron 15 7000 7506 2-in-1 Black Edition | |
| Cinebench R20 / CPU (Single Core) | |
| Average of class Multimedia (425 - 853, n=56, last 2 years) | |
| Acer Swift 3 SF316-51 | |
| Acer Swift 3X SF314-510G-70DW | |
| MSI Modern 14 B11SB-085 | |
| Asus Vivobook 15 K513EQ | |
| Average Intel Core i7-1165G7 (442 - 589, n=81) | |
| Lenovo ThinkPad L14 G2 AMD | |
| Acer Swift 5 SF514-55T-58DN | |
| Dell Inspiron 15 7000 7506 2-in-1 Black Edition | |
| Cinebench R15 / CPU Multi 64Bit | |
| Average of class Multimedia (856 - 5224, n=60, last 2 years) | |
| Lenovo ThinkPad L14 G2 AMD | |
| Acer Swift 3 SF316-51 | |
| Acer Swift 3X SF314-510G-70DW | |
| Acer Swift 5 SF514-55T-58DN | |
| MSI Modern 14 B11SB-085 | |
| Asus Vivobook 15 K513EQ | |
| Average Intel Core i7-1165G7 (553 - 1027, n=86) | |
| Dell Inspiron 15 7000 7506 2-in-1 Black Edition | |
| Cinebench R15 / CPU Single 64Bit | |
| Average of class Multimedia (184.8 - 326, n=58, last 2 years) | |
| Acer Swift 3 SF316-51 | |
| Acer Swift 3X SF314-510G-70DW | |
| Lenovo ThinkPad L14 G2 AMD | |
| Asus Vivobook 15 K513EQ | |
| Average Intel Core i7-1165G7 (115 - 230, n=78) | |
| Dell Inspiron 15 7000 7506 2-in-1 Black Edition | |
| MSI Modern 14 B11SB-085 | |
| Acer Swift 5 SF514-55T-58DN | |
| Blender / v2.79 BMW27 CPU | |
| Average Intel Core i7-1165G7 (468 - 1138, n=80) | |
| Dell Inspiron 15 7000 7506 2-in-1 Black Edition | |
| Acer Swift 5 SF514-55T-58DN | |
| MSI Modern 14 B11SB-085 | |
| Asus Vivobook 15 K513EQ | |
| Acer Swift 3X SF314-510G-70DW | |
| Acer Swift 3 SF316-51 | |
| Lenovo ThinkPad L14 G2 AMD | |
| Average of class Multimedia (100 - 557, n=57, last 2 years) | |
| 7-Zip 18.03 / 7z b 4 | |
| Average of class Multimedia (26062 - 130368, n=54, last 2 years) | |
| Lenovo ThinkPad L14 G2 AMD | |
| Acer Swift 3 SF316-51 | |
| Acer Swift 3X SF314-510G-70DW | |
| Asus Vivobook 15 K513EQ | |
| Acer Swift 5 SF514-55T-58DN | |
| MSI Modern 14 B11SB-085 | |
| Dell Inspiron 15 7000 7506 2-in-1 Black Edition | |
| Average Intel Core i7-1165G7 (15347 - 27405, n=80) | |
| 7-Zip 18.03 / 7z b 4 -mmt1 | |
| Average of class Multimedia (3666 - 7545, n=55, last 2 years) | |
| Acer Swift 3 SF316-51 | |
| Acer Swift 3X SF314-510G-70DW | |
| Asus Vivobook 15 K513EQ | |
| MSI Modern 14 B11SB-085 | |
| Average Intel Core i7-1165G7 (4478 - 5507, n=80) | |
| Dell Inspiron 15 7000 7506 2-in-1 Black Edition | |
| Lenovo ThinkPad L14 G2 AMD | |
| Acer Swift 5 SF514-55T-58DN | |
| Geekbench 5.5 / Multi-Core | |
| Average of class Multimedia (4652 - 20422, n=55, last 2 years) | |
| Acer Swift 3 SF316-51 | |
| Acer Swift 3X SF314-510G-70DW | |
| Acer Swift 5 SF514-55T-58DN | |
| Dell Inspiron 15 7000 7506 2-in-1 Black Edition | |
| Average Intel Core i7-1165G7 (3078 - 5926, n=77) | |
| Lenovo ThinkPad L14 G2 AMD | |
| MSI Modern 14 B11SB-085 | |
| Geekbench 5.5 / Single-Core | |
| Average of class Multimedia (805 - 2974, n=55, last 2 years) | |
| Acer Swift 3 SF316-51 | |
| Acer Swift 3X SF314-510G-70DW | |
| Average Intel Core i7-1165G7 (1302 - 1595, n=77) | |
| MSI Modern 14 B11SB-085 | |
| Dell Inspiron 15 7000 7506 2-in-1 Black Edition | |
| Acer Swift 5 SF514-55T-58DN | |
| Lenovo ThinkPad L14 G2 AMD | |
| HWBOT x265 Benchmark v2.2 / 4k Preset | |
| Average of class Multimedia (5.26 - 36.1, n=55, last 2 years) | |
| Lenovo ThinkPad L14 G2 AMD | |
| Acer Swift 3 SF316-51 | |
| Acer Swift 3X SF314-510G-70DW | |
| Asus Vivobook 15 K513EQ | |
| MSI Modern 14 B11SB-085 | |
| Dell Inspiron 15 7000 7506 2-in-1 Black Edition | |
| Acer Swift 5 SF514-55T-58DN | |
| Average Intel Core i7-1165G7 (1.39 - 8.47, n=80) | |
| LibreOffice / 20 Documents To PDF | |
| Lenovo ThinkPad L14 G2 AMD | |
| MSI Modern 14 B11SB-085 | |
| Acer Swift 5 SF514-55T-58DN | |
| Average of class Multimedia (23.9 - 146.7, n=56, last 2 years) | |
| Average Intel Core i7-1165G7 (21.5 - 88.1, n=78) | |
| Dell Inspiron 15 7000 7506 2-in-1 Black Edition | |
| Asus Vivobook 15 K513EQ | |
| Acer Swift 3X SF314-510G-70DW | |
| Acer Swift 3 SF316-51 | |
| R Benchmark 2.5 / Overall mean | |
| Acer Swift 5 SF514-55T-58DN | |
| Dell Inspiron 15 7000 7506 2-in-1 Black Edition | |
| Average Intel Core i7-1165G7 (0.552 - 1.002, n=80) | |
| MSI Modern 14 B11SB-085 | |
| Asus Vivobook 15 K513EQ | |
| Acer Swift 3X SF314-510G-70DW | |
| Lenovo ThinkPad L14 G2 AMD | |
| Acer Swift 3 SF316-51 | |
| Average of class Multimedia (0.3604 - 0.947, n=55, last 2 years) | |
* ... smaller is better
AIDA64: FP32 Ray-Trace | FPU Julia | CPU SHA3 | CPU Queen | FPU SinJulia | FPU Mandel | CPU AES | CPU ZLib | FP64 Ray-Trace | CPU PhotoWorxx
| Performance rating | |
| Average of class Multimedia | |
| Lenovo ThinkPad L14 G2 AMD | |
| Acer Swift 3X SF314-510G-70DW | |
| Asus Vivobook 15 K513EQ | |
| Average Intel Core i7-1165G7 | |
| MSI Modern 14 B11SB-085 | |
| Acer Swift 5 SF514-55T-58DN -9! | |
| AIDA64 / FP32 Ray-Trace | |
| Average of class Multimedia (2214 - 50388, n=53, last 2 years) | |
| Lenovo ThinkPad L14 G2 AMD | |
| Acer Swift 3X SF314-510G-70DW | |
| Asus Vivobook 15 K513EQ | |
| MSI Modern 14 B11SB-085 | |
| Average Intel Core i7-1165G7 (3933 - 8184, n=58) | |
| AIDA64 / FPU Julia | |
| Average of class Multimedia (12867 - 201874, n=53, last 2 years) | |
| Lenovo ThinkPad L14 G2 AMD | |
| Acer Swift 3X SF314-510G-70DW | |
| Asus Vivobook 15 K513EQ | |
| MSI Modern 14 B11SB-085 | |
| Average Intel Core i7-1165G7 (17720 - 34369, n=58) | |
| AIDA64 / CPU SHA3 | |
| Average of class Multimedia (626 - 8623, n=53, last 2 years) | |
| Acer Swift 3X SF314-510G-70DW | |
| Lenovo ThinkPad L14 G2 AMD | |
| Asus Vivobook 15 K513EQ | |
| MSI Modern 14 B11SB-085 | |
| Average Intel Core i7-1165G7 (958 - 2338, n=58) | |
| AIDA64 / CPU Queen | |
| Lenovo ThinkPad L14 G2 AMD | |
| Average of class Multimedia (13483 - 181505, n=40, last 2 years) | |
| Acer Swift 3X SF314-510G-70DW | |
| Asus Vivobook 15 K513EQ | |
| Average Intel Core i7-1165G7 (44161 - 50624, n=58) | |
| MSI Modern 14 B11SB-085 | |
| AIDA64 / FPU SinJulia | |
| Lenovo ThinkPad L14 G2 AMD | |
| Average of class Multimedia (886 - 28794, n=53, last 2 years) | |
| Acer Swift 3X SF314-510G-70DW | |
| Asus Vivobook 15 K513EQ | |
| MSI Modern 14 B11SB-085 | |
| Average Intel Core i7-1165G7 (3183 - 4796, n=58) | |
| AIDA64 / FPU Mandel | |
| Average of class Multimedia (6395 - 105740, n=53, last 2 years) | |
| Lenovo ThinkPad L14 G2 AMD | |
| Acer Swift 3X SF314-510G-70DW | |
| Asus Vivobook 15 K513EQ | |
| MSI Modern 14 B11SB-085 | |
| Average Intel Core i7-1165G7 (11876 - 20468, n=58) | |
| AIDA64 / CPU AES | |
| Lenovo ThinkPad L14 G2 AMD | |
| Asus Vivobook 15 K513EQ | |
| Acer Swift 3X SF314-510G-70DW | |
| Average of class Multimedia (8171 - 126790, n=53, last 2 years) | |
| Average Intel Core i7-1165G7 (29506 - 73387, n=58) | |
| MSI Modern 14 B11SB-085 | |
| AIDA64 / CPU ZLib | |
| Average of class Multimedia (143.8 - 2022, n=53, last 2 years) | |
| Lenovo ThinkPad L14 G2 AMD | |
| Acer Swift 3X SF314-510G-70DW | |
| Asus Vivobook 15 K513EQ | |
| MSI Modern 14 B11SB-085 | |
| Average Intel Core i7-1165G7 (169 - 402, n=65) | |
| Acer Swift 5 SF514-55T-58DN | |
| AIDA64 / FP64 Ray-Trace | |
| Average of class Multimedia (1014 - 26875, n=53, last 2 years) | |
| Lenovo ThinkPad L14 G2 AMD | |
| Acer Swift 3X SF314-510G-70DW | |
| Asus Vivobook 15 K513EQ | |
| MSI Modern 14 B11SB-085 | |
| Average Intel Core i7-1165G7 (2033 - 4461, n=58) | |
| AIDA64 / CPU PhotoWorxx | |
| Average of class Multimedia (8187 - 88154, n=53, last 2 years) | |
| Acer Swift 3X SF314-510G-70DW | |
| Average Intel Core i7-1165G7 (12392 - 45694, n=58) | |
| Asus Vivobook 15 K513EQ | |
| MSI Modern 14 B11SB-085 | |
| Lenovo ThinkPad L14 G2 AMD | |
系统性能
不幸的是,尽管有快速的内存,但在系统性能方面,宏碁笔记本电脑并没有能够充分利用CPU。最重要的是,缓慢的固态硬盘(我们将在下文中详细讨论)显示出它是一个制动器。最后的分数波动很大,但它们一般都在中场。然而,在我们的测试中,我们没有注意到该设备在日常使用中的任何问题。
| PCMark 10 / Score | |
| Average of class Multimedia (4325 - 10386, n=51, last 2 years) | |
| Lenovo ThinkPad L14 G2 AMD | |
| Acer Swift 3 SF316-51 | |
| Asus Vivobook 15 K513EQ | |
| Dell Inspiron 15 7000 7506 2-in-1 Black Edition | |
| Average Intel Core i7-1165G7, Intel Iris Xe MAX Graphics (4912 - 5020, n=2) | |
| Acer Swift 3X SF314-510G-70DW | |
| MSI Modern 14 B11SB-085 | |
| Acer Swift 5 SF514-55T-58DN | |
| PCMark 10 / Essentials | |
| Average of class Multimedia (8025 - 11664, n=50, last 2 years) | |
| Acer Swift 3 SF316-51 | |
| Lenovo ThinkPad L14 G2 AMD | |
| Acer Swift 3X SF314-510G-70DW | |
| Average Intel Core i7-1165G7, Intel Iris Xe MAX Graphics (9666 - 10086, n=2) | |
| Acer Swift 5 SF514-55T-58DN | |
| Dell Inspiron 15 7000 7506 2-in-1 Black Edition | |
| Asus Vivobook 15 K513EQ | |
| MSI Modern 14 B11SB-085 | |
| PCMark 10 / Productivity | |
| Average of class Multimedia (7323 - 18233, n=50, last 2 years) | |
| Lenovo ThinkPad L14 G2 AMD | |
| Asus Vivobook 15 K513EQ | |
| MSI Modern 14 B11SB-085 | |
| Acer Swift 3 SF316-51 | |
| Dell Inspiron 15 7000 7506 2-in-1 Black Edition | |
| Acer Swift 5 SF514-55T-58DN | |
| Average Intel Core i7-1165G7, Intel Iris Xe MAX Graphics (6365 - 6568, n=2) | |
| Acer Swift 3X SF314-510G-70DW | |
| PCMark 10 / Digital Content Creation | |
| Average of class Multimedia (3651 - 16240, n=50, last 2 years) | |
| Acer Swift 3 SF316-51 | |
| Dell Inspiron 15 7000 7506 2-in-1 Black Edition | |
| Average Intel Core i7-1165G7, Intel Iris Xe MAX Graphics (5013 - 5409, n=2) | |
| Lenovo ThinkPad L14 G2 AMD | |
| Acer Swift 3X SF314-510G-70DW | |
| MSI Modern 14 B11SB-085 | |
| Acer Swift 5 SF514-55T-58DN | |
| Asus Vivobook 15 K513EQ | |
| PCMark 8 Home Score Accelerated v2 | 5391 points | |
| PCMark 8 Creative Score Accelerated v2 | 7093 points | |
| PCMark 8 Work Score Accelerated v2 | 3214 points | |
| PCMark 10 Score | 4912 points | |
Help | ||
| AIDA64 / Memory Copy | |
| Average of class Multimedia (11299 - 132135, n=53, last 2 years) | |
| Acer Swift 3X SF314-510G-70DW | |
| Average Intel Core i7-1165G7 (20032 - 65446, n=58) | |
| Asus Vivobook 15 K513EQ | |
| MSI Modern 14 B11SB-085 | |
| Lenovo ThinkPad L14 G2 AMD | |
| AIDA64 / Memory Read | |
| Average of class Multimedia (11624 - 174586, n=53, last 2 years) | |
| Acer Swift 3X SF314-510G-70DW | |
| Average Intel Core i7-1165G7 (23033 - 64524, n=58) | |
| Asus Vivobook 15 K513EQ | |
| Lenovo ThinkPad L14 G2 AMD | |
| MSI Modern 14 B11SB-085 | |
| AIDA64 / Memory Write | |
| Average of class Multimedia (11755 - 134998, n=53, last 2 years) | |
| Acer Swift 3X SF314-510G-70DW | |
| Average Intel Core i7-1165G7 (21736 - 66791, n=58) | |
| Asus Vivobook 15 K513EQ | |
| Lenovo ThinkPad L14 G2 AMD | |
| MSI Modern 14 B11SB-085 | |
| AIDA64 / Memory Latency | |
| Average of class Multimedia (7 - 535, n=52, last 2 years) | |
| Lenovo ThinkPad L14 G2 AMD | |
| Asus Vivobook 15 K513EQ | |
| Acer Swift 3X SF314-510G-70DW | |
| Average Intel Core i7-1165G7 (69 - 110, n=65) | |
| MSI Modern 14 B11SB-085 | |
| Acer Swift 5 SF514-55T-58DN | |
* ... smaller is better
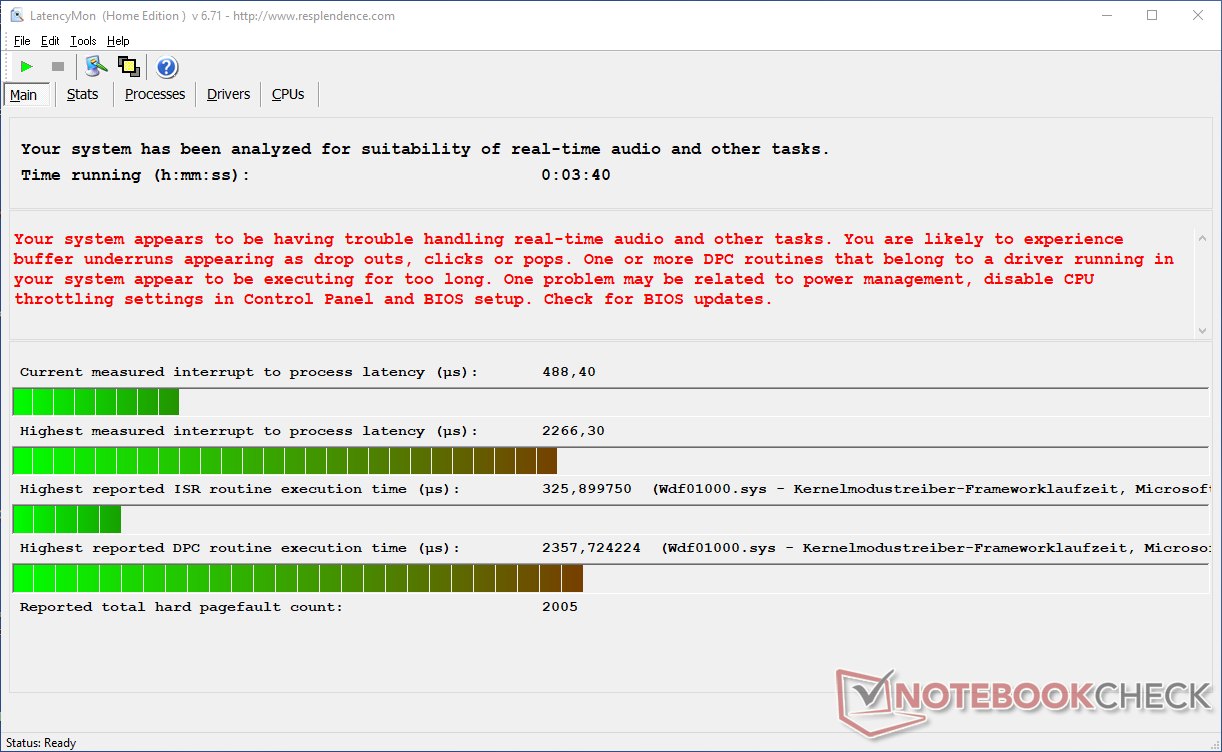
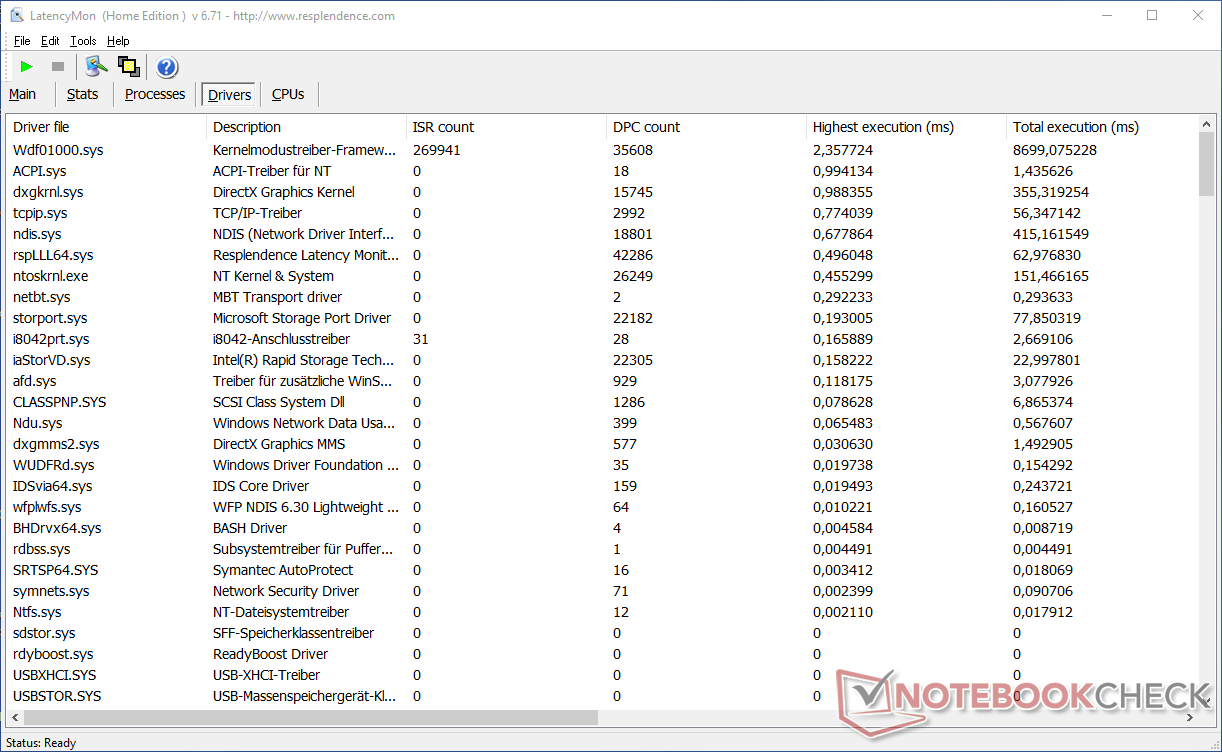
DPC延迟
测得的DPC延迟相对较高,高于大多数其他竞争对手。这可能表明,该设备对于实时音频等来说并不理想。尽管如此,这仍然只是一个瞬间的印象。在日常使用中,我们没能确定任何问题。YouTube上的4K流媒体工作顺利,由iGPU处理。
| DPC Latencies / LatencyMon - interrupt to process latency (max), Web, Youtube, Prime95 | |
| Asus Vivobook 15 K513EQ | |
| Acer Swift 3X SF314-510G-70DW | |
| Lenovo ThinkPad L14 G2 AMD | |
| MSI Modern 14 B11SB-085 | |
| Acer Swift 5 SF514-55T-58DN | |
| Acer Swift 3 SF316-51 | |
| Dell Inspiron 15 7000 7506 2-in-1 Black Edition | |
* ... smaller is better
储存
制造商在选择固态硬盘的时候并没有给自己带来什么大的好处。在我们目前的配置中,它以1TB的容量提供了大量的存储空间。然而,它肯定不是最快的,在各种SSD性能测试中,它通常处于下半部分,有时甚至处于我们比较领域的最底部。

| Drive Performance rating - Percent | |
| Average of class Multimedia | |
| Dell Inspiron 15 7000 7506 2-in-1 Black Edition | |
| Lenovo ThinkPad L14 G2 AMD | |
| Average Micron 2210 MTFDHBA1T0QFD | |
| Acer Swift 3X SF314-510G-70DW | |
| Acer Swift 3 SF316-51 | |
| Acer Swift 5 SF514-55T-58DN -1! | |
| MSI Modern 14 B11SB-085 | |
| Asus Vivobook 15 K513EQ | |
* ... smaller is better
Continuous load read: DiskSpd Read Loop, Queue Depth 8
图形卡
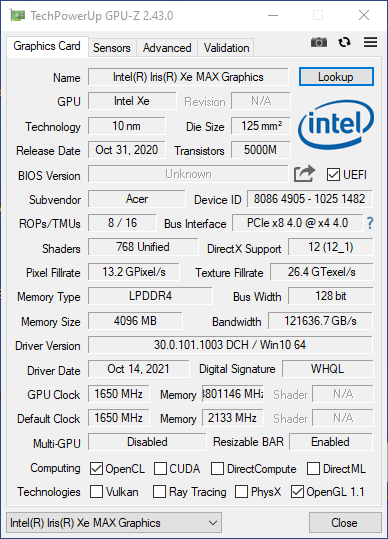
宏碁Swift 3X中使用了两个图形单元。这两个单元是英特尔Iris Xe G7 (96 EUs)集成到处理器中的图形单元在低负荷下处理工作。然而,更强大的英特尔Iris Xe MAX接管更多的任务,如游戏。
这是一款用于笔记本电脑的PCIe 4.0图形卡,基于12代架构(Xe)的96个EUs。与iGPU相比,它不仅提供了更高的时钟频率(1.65 GHz vs. 1.3 GHz),而且还配备了4GB的LPDDR4x显存。
在基准测试中,Swift 3X在各种版本的3DMark中都名列前茅。它只是偶尔被配备GeForce MX450的微星Modern 14击败,但它总是在配备相同GPU的戴尔Inspiron 15 7000前面。
总的来说,测试对象总是提供一个良好的性能,高于这里的GPU平均水平,这意味着宏碁设法利用了专用图形解决方案的潜力。我们测得电池电量的性能略微低了7%。
| 3DMark Performance rating - Percent | |
| Average of class Multimedia | |
| Acer Swift 3X SF314-510G-70DW | |
| Average Intel Iris Xe MAX Graphics | |
| Dell Inspiron 15 7000 7506 2-in-1 Black Edition | |
| Acer Swift 3 SF316-51 | |
| MSI Modern 14 B11SB-085 | |
| Asus Vivobook 15 K513EQ | |
| Acer Swift 5 SF514-55T-58DN -1! | |
| Lenovo ThinkPad L14 G2 AMD -1! | |
| 3DMark 11 Performance | 8594 points | |
| 3DMark Cloud Gate Standard Score | 21799 points | |
| 3DMark Fire Strike Score | 5739 points | |
| 3DMark Time Spy Score | 1939 points | |
Help | ||
游戏性能
由于其专用的图形解决方案,宏碁Swift 3X在我们的测试中为多媒体设备提供了一个体面的游戏性能。我们测试的大多数游戏都可以在中等质量水平下流畅地玩。在某些情况下,使用高图形设置甚至可以达到约30帧或更高的稳定帧率。
在《Witcher 3 》中,该设备通常在我们的比较领域中占据首位,并在四个图形级别中的三个级别中比配备相同CPU和GeForce MX450的微星现代14表现更好。它比基于相同CPU和GPU的戴尔Inspiron 15要好得多,这意味着宏碁对可用潜力的开发要好得多。
此外,图形压力测试的性能几乎保持在98.4%。因此,宏碁Swift 3X也适用于偶尔的游戏环节,但自然无法跟上适当的游戏笔记本电脑。在电池供电情况下测得的帧率比插上电源适配器后观察到的帧率低10%左右。
在TheWitcher 3'sUltra模式下,帧率略低于20 fps,在这种图形水平下,该标题不再是流畅的可玩。然而,随着时间的推移,帧率保持不变,没有出现向上或向下的峰值。
The Witcher 3 FPS diagram
| low | med. | high | ultra | |
|---|---|---|---|---|
| GTA V (2015) | 99.1 | 90.9 | 30.9 | 13.2 |
| The Witcher 3 (2015) | 107.9 | 66.9 | 34.8 | 18.5 |
| Dota 2 Reborn (2015) | 70.1 | 81.6 | 51.3 | 46.6 |
| Rise of the Tomb Raider (2016) | 68.2 | 38.3 | 25.4 | 20.8 |
| Final Fantasy XV Benchmark (2018) | 26.2 | 18.2 | ||
| X-Plane 11.11 (2018) | 39.8 | 34.9 | 28.9 | |
| Strange Brigade (2018) | 98.4 | 41.2 | 33.6 | 28.9 |
| Dirt 5 (2020) | 39.5 | 18.7 | 15.2 | 11.4 |
| Monster Hunter Stories 2 (2021) | 55.8 | 58 | 52.5 |
排放。带有愉快的风扇和扬声器的Windows笔记本电脑
噪声排放
宏碁Swift 3X在空闲状态下是听不到的,因为风扇是不活跃的。当设备受到压力时,风扇转速达到44 dB(A)的噪音水平。一方面,在我们的测试中,具有类似配置的其他笔记本电脑的声音要大得多。另外,风扇从来没有脉冲,所以Swift 3X从来没有变得令人不快的声音或主导前台。我们在测试中没有遇到任何其他噪音。
Noise level
| Idle |
| 25 / 25 / 25 dB(A) |
| Load |
| 44.2 / 44.2 dB(A) |
 | ||
30 dB silent 40 dB(A) audible 50 dB(A) loud |
||
min: | ||
| Acer Swift 3X SF314-510G-70DW Xe MAX, i7-1165G7, Micron 2210 MTFDHBA1T0QFD | Asus Vivobook 15 K513EQ GeForce MX350, i7-1165G7, Intel SSD 660p SSDPEKNW512G8 | Dell Inspiron 15 7000 7506 2-in-1 Black Edition Xe MAX, i7-1165G7, Micron 2300 1TB MTFDHBA1T0TDV | Lenovo ThinkPad L14 G2 AMD Vega 8, R7 PRO 5850U, WDC PC SN730 SDBQNTY-512GB | Acer Swift 3 SF316-51 Iris Xe G7 96EUs, i7-11370H, Micron 2210 MTFDHBA512QFD | Acer Swift 5 SF514-55T-58DN Iris Xe G7 80EUs, i5-1135G7, SK Hynix BC511 HFM512GDJTNI | MSI Modern 14 B11SB-085 GeForce MX450, i7-1165G7, Kingston OM8PCP3512F-AB | |
|---|---|---|---|---|---|---|---|
| Noise | 4% | -8% | 9% | 3% | 7% | -7% | |
| off / environment * (dB) | 25 | 23.4 6% | 27.3 -9% | 25.08 -0% | 26 -4% | 25 -0% | 26 -4% |
| Idle Minimum * (dB) | 25 | 23.6 6% | 27.3 -9% | 25.08 -0% | 26 -4% | 25 -0% | 26 -4% |
| Idle Average * (dB) | 25 | 23.6 6% | 27.3 -9% | 25.08 -0% | 26 -4% | 25 -0% | 26 -4% |
| Idle Maximum * (dB) | 25 | 23.6 6% | 27.3 -9% | 25.08 -0% | 27.7 -11% | 25 -0% | 26 -4% |
| Load Average * (dB) | 44.2 | 41 7% | 47.4 -7% | 26.81 39% | 32.7 26% | 34.7 21% | 46.3 -5% |
| Load Maximum * (dB) | 44.2 | 47 -6% | 47.5 -7% | 37.99 14% | 39 12% | 34 23% | 52.9 -20% |
| Witcher 3 ultra * (dB) | 42.9 | 47.4 | 46.3 |
* ... smaller is better
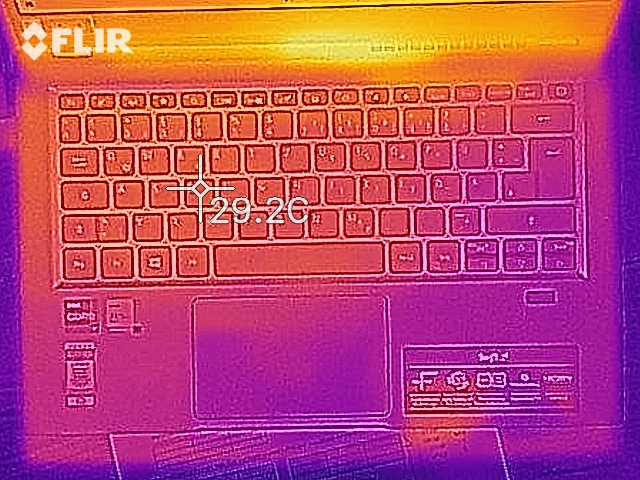
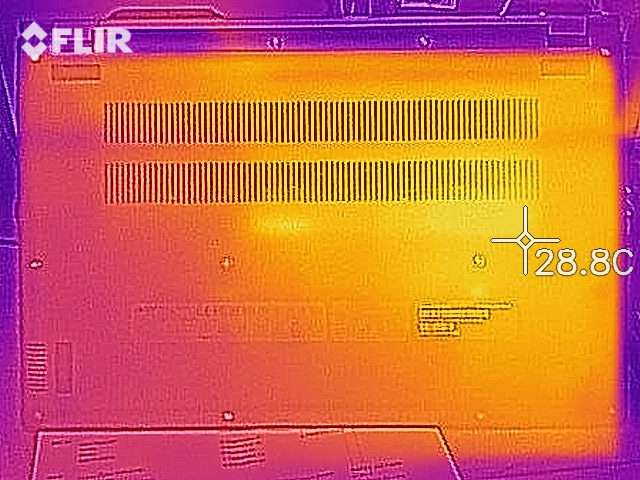
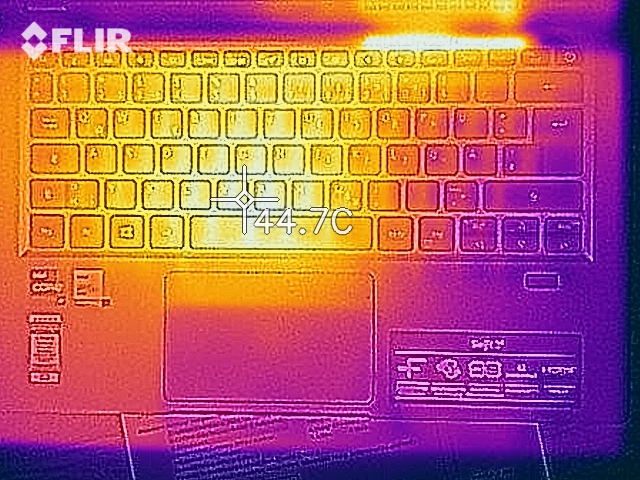
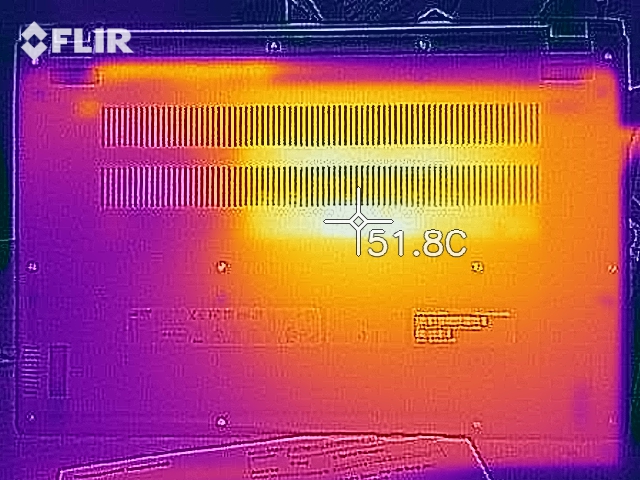
温度
与噪音水平一样,评测样本在闲置温度方面没有显示出任何不规则的情况,而且几乎没有加热到室温以上。在负载情况下,屏幕前面的中心区域在底部加热到45℃(约113°F),在顶部加热到41℃(约106°F)。在使用顶部的按键时,这一点略微明显,但它仍然远远没有达到令人不舒服的温度。
(±) The maximum temperature on the upper side is 40.8 °C / 105 F, compared to the average of 36.8 °C / 98 F, ranging from 21 to 71 °C for the class Multimedia.
(-) The bottom heats up to a maximum of 45.2 °C / 113 F, compared to the average of 39.1 °C / 102 F
(+) In idle usage, the average temperature for the upper side is 24.1 °C / 75 F, compared to the device average of 31.3 °C / 88 F.
(+) The palmrests and touchpad are cooler than skin temperature with a maximum of 31.8 °C / 89.2 F and are therefore cool to the touch.
(-) The average temperature of the palmrest area of similar devices was 28.7 °C / 83.7 F (-3.1 °C / -5.5 F).
| Acer Swift 3X SF314-510G-70DW Intel Core i7-1165G7, Intel Iris Xe MAX Graphics | Asus Vivobook 15 K513EQ Intel Core i7-1165G7, NVIDIA GeForce MX350 | Dell Inspiron 15 7000 7506 2-in-1 Black Edition Intel Core i7-1165G7, Intel Iris Xe MAX Graphics | Lenovo ThinkPad L14 G2 AMD AMD Ryzen 7 PRO 5850U, AMD Radeon RX Vega 8 (Ryzen 4000/5000) | Acer Swift 3 SF316-51 Intel Core i7-11370H, Intel Iris Xe Graphics G7 96EUs | Acer Swift 5 SF514-55T-58DN Intel Core i5-1135G7, Intel Iris Xe Graphics G7 80EUs | MSI Modern 14 B11SB-085 Intel Core i7-1165G7, NVIDIA GeForce MX450 | |
|---|---|---|---|---|---|---|---|
| Heat | -14% | -19% | -7% | -8% | 15% | -25% | |
| Maximum Upper Side * (°C) | 40.8 | 48.8 -20% | 43 -5% | 42.1 -3% | 40 2% | 34.5 15% | 55.6 -36% |
| Maximum Bottom * (°C) | 45.2 | 42 7% | 48.8 -8% | 45.2 -0% | 47 -4% | 35.4 22% | 67.8 -50% |
| Idle Upper Side * (°C) | 29.8 | 30 -1% | 31.6 -6% | 28.6 4% | 30.1 -1% | 23.8 20% | 28.3 5% |
| Idle Bottom * (°C) | 24.7 | 35 -42% | 38.6 -56% | 31.5 -28% | 31.6 -28% | 24 3% | 28.9 -17% |
* ... smaller is better
压力测试
在压力测试中,GPU和CPU被置于负载之下至少一个小时。在通常的初始峰值之后,CPU稳定在1500MHz左右,远远低于基本时钟速度,并且在60°C(约140°F)的条件下。专用的GPU在1200MHz左右持续运行,并略低于80°C(~176°F)。
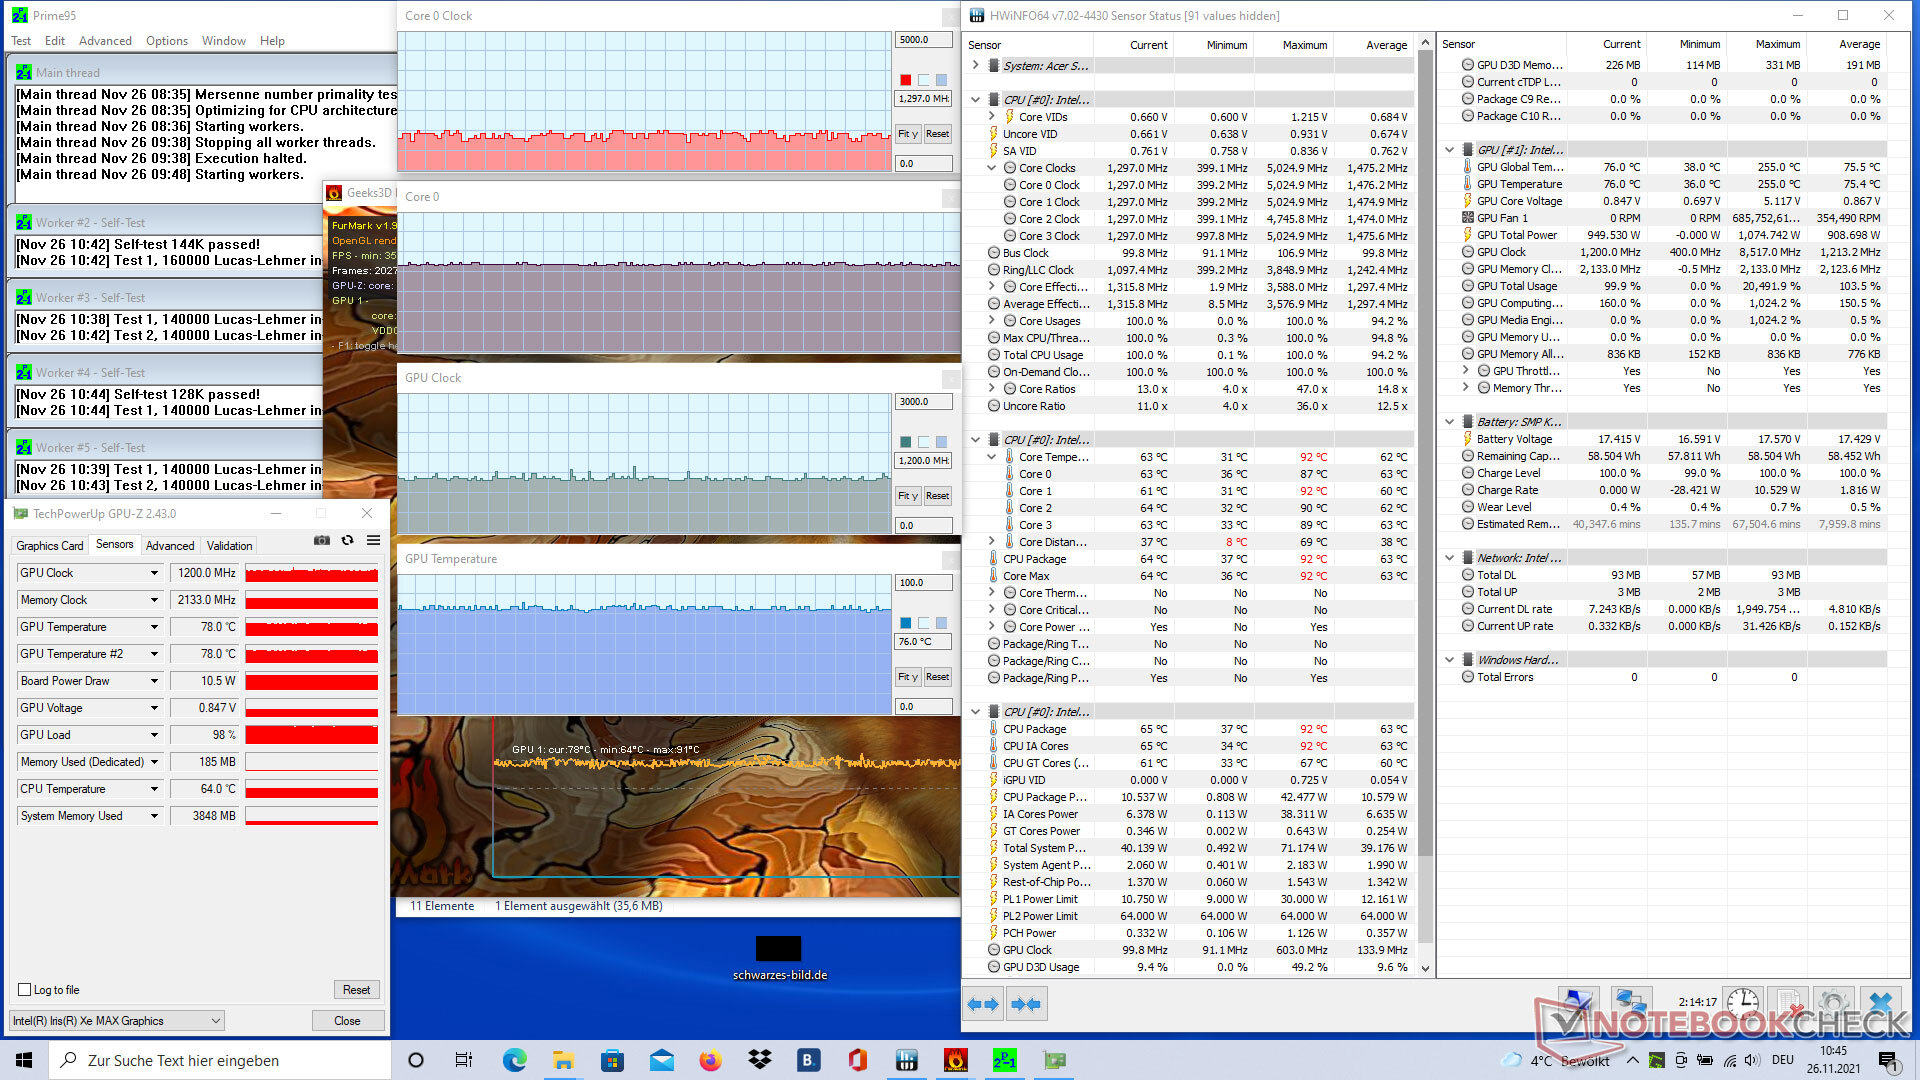
| CPU时钟速率(GHz) | GPU时钟速率(MHz) | CPU平均温度(℃) | GPU平均温度(℃) | |
| 空闲系统 | 1.2 | 100 | 41 | 40 |
| Prime95压力 | 3.1 | 100 | 78 | 79 |
| Prime95 + FurMark压力 | 1.5 | 1200 | 63 | 76 |
| Witcher 3 压力 | 3.7 | 1400 | 63 | 76 |
发言人
立体声扬声器能稳固地再现中音和高音。然而,完全缺乏低音,所以声音的再现非常尖锐和单薄。此外,它们非常安静,即使开到全音量也是如此。它们对视频通话来说是足够的。对于游戏、音乐等,建议通过3.5毫米插孔的扬声器或耳机形式的外部解决方案。
Acer Swift 3X SF314-510G-70DW audio analysis
(±) | speaker loudness is average but good (72 dB)
Bass 100 - 315 Hz
(-) | nearly no bass - on average 31.4% lower than median
(±) | linearity of bass is average (10.8% delta to prev. frequency)
Mids 400 - 2000 Hz
(+) | balanced mids - only 4.9% away from median
(+) | mids are linear (6.6% delta to prev. frequency)
Highs 2 - 16 kHz
(+) | balanced highs - only 4% away from median
(±) | linearity of highs is average (8.2% delta to prev. frequency)
Overall 100 - 16.000 Hz
(±) | linearity of overall sound is average (29.4% difference to median)
Compared to same class
» 95% of all tested devices in this class were better, 2% similar, 3% worse
» The best had a delta of 5%, average was 17%, worst was 45%
Compared to all devices tested
» 87% of all tested devices were better, 2% similar, 10% worse
» The best had a delta of 4%, average was 23%, worst was 134%
Apple MacBook 12 (Early 2016) 1.1 GHz audio analysis
(+) | speakers can play relatively loud (83.6 dB)
Bass 100 - 315 Hz
(±) | reduced bass - on average 11.3% lower than median
(±) | linearity of bass is average (14.2% delta to prev. frequency)
Mids 400 - 2000 Hz
(+) | balanced mids - only 2.4% away from median
(+) | mids are linear (5.5% delta to prev. frequency)
Highs 2 - 16 kHz
(+) | balanced highs - only 2% away from median
(+) | highs are linear (4.5% delta to prev. frequency)
Overall 100 - 16.000 Hz
(+) | overall sound is linear (10.2% difference to median)
Compared to same class
» 7% of all tested devices in this class were better, 2% similar, 90% worse
» The best had a delta of 5%, average was 18%, worst was 53%
Compared to all devices tested
» 5% of all tested devices were better, 1% similar, 94% worse
» The best had a delta of 4%, average was 23%, worst was 134%
能源管理。Swift 3X提供近18小时的续航时间
能源消耗
在能源消耗方面,宏碁Swift 3X凭借其58Wh的电池在该组中表现良好。其余带有专用显卡的机型都消耗更多的能量,有时甚至是相当多的能量。采用相同CPU/GPU组合的戴尔Inspiron 15在这里特别引人注目。它在闲置时消耗的能量是两倍多,但它也有一个更高分辨率的触摸屏。
正如预期的那样,比较领域中配备板载GPU的三个竞争者消耗的功率略低。我们的评测样品在负载下最多消耗58瓦,因此65瓦的电源适配器有足够的容量。
在我们的TheWitcher 3测试中,随着时间的推移,功耗稳定在54瓦左右,但它经常出现短时的功率峰值,达到65瓦的水平。在压力测试期间,笔记本电脑在最初的峰值(约68瓦)之后平均消耗58瓦。
| Off / Standby | |
| Idle | |
| Load |
|
Key:
min: | |
| Acer Swift 3X SF314-510G-70DW i7-1165G7, Xe MAX, Micron 2210 MTFDHBA1T0QFD, IPS, 1920x1080, 14" | Asus Vivobook 15 K513EQ i7-1165G7, GeForce MX350, Intel SSD 660p SSDPEKNW512G8, OLED, 1920x1080, 15.6" | Dell Inspiron 15 7000 7506 2-in-1 Black Edition i7-1165G7, Xe MAX, Micron 2300 1TB MTFDHBA1T0TDV, IPS, 3840x2160, 15.6" | Lenovo ThinkPad L14 G2 AMD R7 PRO 5850U, Vega 8, WDC PC SN730 SDBQNTY-512GB, IPS LED, 1920x1080, 14" | Acer Swift 3 SF316-51 i7-11370H, Iris Xe G7 96EUs, Micron 2210 MTFDHBA512QFD, IPS, 1920x1080, 16.1" | Acer Swift 5 SF514-55T-58DN i5-1135G7, Iris Xe G7 80EUs, SK Hynix BC511 HFM512GDJTNI, IPS, 1920x1080, 14" | MSI Modern 14 B11SB-085 i7-1165G7, GeForce MX450, Kingston OM8PCP3512F-AB, IPS, 1920x1080, 14" | Average Intel Iris Xe MAX Graphics | Average of class Multimedia | |
|---|---|---|---|---|---|---|---|---|---|
| Power Consumption | -3% | -44% | 7% | 7% | 23% | -14% | -41% | -50% | |
| Idle Minimum * (Watt) | 3.6 | 3.7 -3% | 4 -11% | 5.44 -51% | 4.8 -33% | 2.4 33% | 3 17% | 5.4 ? -50% | 5.62 ? -56% |
| Idle Average * (Watt) | 6.2 | 6.3 -2% | 15.5 -150% | 8.06 -30% | 7.4 -19% | 3.5 44% | 6.3 -2% | 10.4 ? -68% | 10.2 ? -65% |
| Idle Maximum * (Watt) | 10.4 | 9.7 7% | 16.2 -56% | 9.4 10% | 9 13% | 6.6 37% | 10.3 1% | 17.5 ? -68% | 12.5 ? -20% |
| Load Average * (Watt) | 55.1 | 59 -7% | 49.7 10% | 36.06 35% | 34.9 37% | 47 15% | 66 -20% | 50.6 ? 8% | 65 ? -18% |
| Witcher 3 ultra * (Watt) | 54.1 | 51.4 5% | 52.2 4% | 26.1 52% | 34.9 35% | 66.6 -23% | |||
| Load Maximum * (Watt) | 58 | 67.7 -17% | 92.7 -60% | 42.26 27% | 51.4 11% | 67.2 -16% | 90.6 -56% | 73.4 ? -27% | 111.9 ? -93% |
* ... smaller is better
Energy consumption during The Witcher 3 test / stress test
电池寿命
低消耗,特别是在低负载情况下,以及相对较大的58Wh电池导致了令人印象深刻的电池运行时间。Swift 3X的性能比竞争对手高出30%至60%。
该设备在我们的视频测试中持续了近18个小时,在Wi-Fi浏览测试中持续了12:30个小时。即使在负载下,该设备也只在近4小时后耗尽能量。这也是由于在没有苛刻的图形计算时,笔记本电脑使用CPU的板载GPU(英特尔Iris Xe图形)。
| Acer Swift 3X SF314-510G-70DW i7-1165G7, Xe MAX, 58 Wh | Asus Vivobook 15 K513EQ i7-1165G7, GeForce MX350, 42 Wh | Dell Inspiron 15 7000 7506 2-in-1 Black Edition i7-1165G7, Xe MAX, 68 Wh | Lenovo ThinkPad L14 G2 AMD R7 PRO 5850U, Vega 8, 45 Wh | Acer Swift 3 SF316-51 i7-11370H, Iris Xe G7 96EUs, 56 Wh | Acer Swift 5 SF514-55T-58DN i5-1135G7, Iris Xe G7 80EUs, 56 Wh | MSI Modern 14 B11SB-085 i7-1165G7, GeForce MX450, 52.4 Wh | Average of class Multimedia | |
|---|---|---|---|---|---|---|---|---|
| Battery runtime | -60% | -41% | -50% | -40% | -27% | -31% | -22% | |
| H.264 (h) | 17.8 | 9.6 -46% | 10.3 -42% | 16.8 ? -6% | ||||
| WiFi v1.3 (h) | 12.7 | 6 -53% | 9.7 -24% | 7.8 -39% | 9.8 -23% | 13.2 4% | 8.7 -31% | 12.3 ? -3% |
| Load (h) | 3.8 | 1.3 -66% | 1.6 -58% | 1.3 -66% | 1.7 -55% | 1.6 -58% | 1.645 ? -57% | |
| Reader / Idle (h) | 13.3 | 25 | 20.1 | 24.9 ? | ||||
| Witcher 3 ultra (h) | 2.2 |
Pros
Cons
结论:宏碁Swift 3X在测试中以其性能和耐力给人留下深刻印象

在我们的测试中,宏碁Swift 3X SF314-510G-70DW在许多方面提供了良好的性能。
板载和专用图形的组合实现了良好的电池运行时间,最长可达18小时,同时还能提供体面的游戏性能。因此,该设备可用于工作和多媒体,甚至偶尔的游戏也能以稳定的图形质量进行。
该设备的性能为它在测试中赢得了良好的分数,就像外壳、键盘和显示屏一样。如果在端口方面的设置稍微好一点,最终会提供一个更好的整体结果。
总而言之,型号为SF314-510G-70DW的宏碁Swift 3X在我们的评测中留下了良好的印象,只有几点值得批评的地方。说到性能,这种CPU配置不会被轻易击败。此外,该设备还具有令人愉快的轻盈和安静。寻找更便携的笔记本电脑的用户应该考虑功能较少的 Acer Swift 5 SF514-55T-58DN.这款Acer Swift 3 SF316-51提供更好的性能。
价格和可用性
在撰写本文时,宏碁Swift 3X(英特尔酷睿i7-1165G7,英特尔Iris Xe MAX,16GB DDR4X内存,1TB SSD)可以在Amazon上找到。售价1,119.99美元。你也可以在Newegg上找到它。,例如。
Acer Swift 3X SF314-510G-70DW
- 12/08/2021 v7 (old)
Marcus Schwarten
Price comparison

