联想IdeaPad S940笔记本电脑评测:更轻,更薄,更帅
| |||||||||||||||||||||||||
Brightness Distribution: 83 %
Center on Battery: 594.5 cd/m²
Contrast: 1383:1 (Black: 0.43 cd/m²)
ΔE ColorChecker Calman: 4.87 | ∀{0.5-29.43 Ø4.73}
calibrated: 2.83
ΔE Greyscale Calman: 6.7 | ∀{0.09-98 Ø4.97}
100% sRGB (Argyll 1.6.3 3D)
72% AdobeRGB 1998 (Argyll 1.6.3 3D)
81.1% AdobeRGB 1998 (Argyll 3D)
99.7% sRGB (Argyll 3D)
87.5% Display P3 (Argyll 3D)
Gamma: 2.091
CCT: 6891 K
| Lenovo IdeaPad S940-14IWL B140ZAN01.3, IPS, 14", 3840x2160 | Dell XPS 13 9380 i7 4K ID: AUO 282B B133ZAN Dell: 90NTH, IPS, 13.3", 3840x2160 | Apple MacBook Pro 13 2018 Touchbar i5 APPA03E, IPS, 13.3", 2560x1600 | Asus ZenBook 13 UX333FA AU Optronics B133HAN05.C, IPS, 13.3", 1920x1080 | Lenovo ThinkPad X1 Carbon 2018-20KGS5DU00 LP140QH2-SPB1, IPS, 14", 2560x1440 | Lenovo Yoga C930-13IKB 81C4 AUO B139HAN03_0, IPS, 13.9", 1920x1080 | |
|---|---|---|---|---|---|---|
| Display | -17% | 7% | -13% | -9% | -18% | |
| Display P3 Coverage (%) | 87.5 | 64.8 -26% | 98.5 13% | 67.9 -22% | 72.7 -17% | 62.7 -28% |
| sRGB Coverage (%) | 99.7 | 93.6 -6% | 99.9 0% | 97.4 -2% | 97.9 -2% | 92.6 -7% |
| AdobeRGB 1998 Coverage (%) | 81.1 | 65.8 -19% | 87.3 8% | 69.2 -15% | 74.6 -8% | 64.7 -20% |
| Response Times | -16% | 10% | -7% | 27% | 30% | |
| Response Time Grey 50% / Grey 80% * (ms) | 57.2 ? | 64.8 ? -13% | 46 ? 20% | 54.4 ? 5% | 38 ? 34% | 34.4 ? 40% |
| Response Time Black / White * (ms) | 32 ? | 38 ? -19% | 32 ? -0% | 37.6 ? -18% | 26 ? 19% | 25.6 ? 20% |
| PWM Frequency (Hz) | 118000 ? | |||||
| Screen | 11% | 24% | -1% | -10% | -28% | |
| Brightness middle (cd/m²) | 594.5 | 428.3 -28% | 519 -13% | 276 -54% | 316 -47% | 312 -48% |
| Brightness (cd/m²) | 536 | 414 -23% | 504 -6% | 263 -51% | 311 -42% | 295 -45% |
| Brightness Distribution (%) | 83 | 88 6% | 95 14% | 89 7% | 84 1% | 87 5% |
| Black Level * (cd/m²) | 0.43 | 0.27 37% | 0.33 23% | 0.21 51% | 0.35 19% | 0.43 -0% |
| Contrast (:1) | 1383 | 1586 15% | 1573 14% | 1314 -5% | 903 -35% | 726 -48% |
| Colorchecker dE 2000 * | 4.87 | 2.69 45% | 1.4 71% | 4.85 -0% | 4.5 8% | 7.6 -56% |
| Colorchecker dE 2000 max. * | 7.9 | 6.19 22% | 2.8 65% | 8.24 -4% | 10.3 -30% | 15.06 -91% |
| Colorchecker dE 2000 calibrated * | 2.83 | 2.01 29% | 1.6 43% | 1.6 43% | 1.96 31% | |
| Greyscale dE 2000 * | 6.7 | 3.7 45% | 2.2 67% | 5.7 15% | 7.7 -15% | 8.8 -31% |
| Gamma | 2.091 105% | 2.1 105% | 2.22 99% | 2.08 106% | 2.2 100% | 2.01 109% |
| CCT | 6891 94% | 6706 97% | 6908 94% | 7424 88% | 6639 98% | 6874 95% |
| Color Space (Percent of AdobeRGB 1998) (%) | 72 | 60.4 -16% | 77.3 7% | 63 -12% | 68.6 -5% | 59.1 -18% |
| Color Space (Percent of sRGB) (%) | 100 | 93.5 -6% | 99.99 0% | 98 -2% | 97.9 -2% | 92.3 -8% |
| Total Average (Program / Settings) | -7% /
3% | 14% /
19% | -7% /
-4% | 3% /
-5% | -5% /
-19% |
* ... smaller is better
Display Response Times
| ↔ Response Time Black to White | ||
|---|---|---|
| 32 ms ... rise ↗ and fall ↘ combined | ↗ 17.2 ms rise | 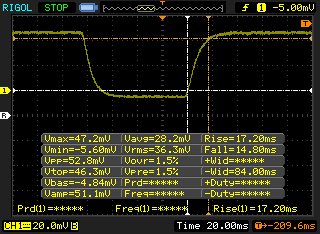 |
| ↘ 14.8 ms fall | ||
| The screen shows slow response rates in our tests and will be unsatisfactory for gamers. In comparison, all tested devices range from 0.1 (minimum) to 240 (maximum) ms. » 86 % of all devices are better. This means that the measured response time is worse than the average of all tested devices (19.9 ms). | ||
| ↔ Response Time 50% Grey to 80% Grey | ||
| 57.2 ms ... rise ↗ and fall ↘ combined | ↗ 30 ms rise | 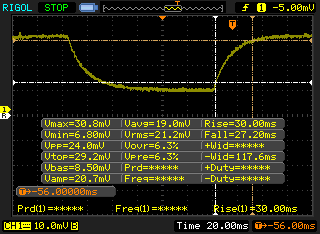 |
| ↘ 27.2 ms fall | ||
| The screen shows slow response rates in our tests and will be unsatisfactory for gamers. In comparison, all tested devices range from 0.165 (minimum) to 636 (maximum) ms. » 94 % of all devices are better. This means that the measured response time is worse than the average of all tested devices (31.1 ms). | ||
Screen Flickering / PWM (Pulse-Width Modulation)
| Screen flickering / PWM not detected | 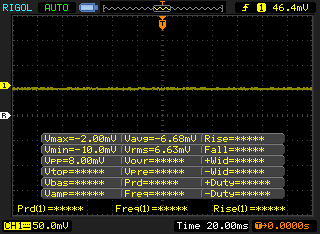 | ||
In comparison: 52 % of all tested devices do not use PWM to dim the display. If PWM was detected, an average of 7794 (minimum: 5 - maximum: 343500) Hz was measured. | |||
| Cinebench R10 | |
| Rendering Multiple CPUs 32Bit | |
| Average of class Subnotebook (14395 - 51868, n=13, last 2 years) | |
| Average Intel Core i7-8565U (13806 - 23118, n=16) | |
| Lenovo Yoga 530-14ARR-81H9000VGE | |
| Rendering Single 32Bit | |
| Average of class Subnotebook (2299 - 10697, n=13, last 2 years) | |
| Average Intel Core i7-8565U (2682 - 8906, n=16) | |
| Lenovo Yoga 530-14ARR-81H9000VGE | |
| PCMark 8 Home Score Accelerated v2 | 3147 points | |
| PCMark 8 Work Score Accelerated v2 | 4209 points | |
| PCMark 10 Score | 3870 points | |
Help | ||
| Lenovo IdeaPad S940-14IWL Samsung SSD PM981 MZVLB512HAJQ | Dell XPS 13 9380 i7 4K Samsung SSD PM981 MZVLB512HAJQ | Apple MacBook Pro 13 2018 Touchbar i5 | Asus ZenBook 13 UX333FA WDC PC SN520 SDAPNUW-256G | Lenovo Yoga C930-13IKB 81C4 SK hynix PC401 HFS256GD9TNG | |
|---|---|---|---|---|---|
| AS SSD | 14% | -51% | -40% | -263% | |
| Seq Read (MB/s) | 2625 | 1981 -25% | 1442 -45% | 1186 -55% | 1228 -53% |
| Seq Write (MB/s) | 1360 | 1473 8% | 1694 25% | 809 -41% | 544 -60% |
| 4K Read (MB/s) | 47.71 | 53.3 12% | 9.7 -80% | 39.69 -17% | 39.16 -18% |
| 4K Write (MB/s) | 115.5 | 127.4 10% | 20 -83% | 114 -1% | 106.5 -8% |
| 4K-64 Read (MB/s) | 1492 | 1179 -21% | 957 -36% | 618 -59% | 466.4 -69% |
| 4K-64 Write (MB/s) | 1154 | 2105 82% | 162 -86% | 510 -56% | 305.1 -74% |
| Access Time Read * (ms) | 0.045 | 0.036 20% | 0.068 -51% | 0.46 -922% | |
| Access Time Write * (ms) | 0.032 | 0.029 9% | 0.032 -0% | 0.51 -1494% | |
| Score Read (Points) | 1802 | 1430 -21% | 776 -57% | 628 -65% | |
| Score Write (Points) | 1406 | 2379 69% | 705 -50% | 466 -67% | |
| Score Total (Points) | 4069 | 4526 11% | 1870 -54% | 1394 -66% | |
| Copy ISO MB/s (MB/s) | 1294 | 1090 | 628 | ||
| Copy Program MB/s (MB/s) | 503 | 714 | 540 | ||
| Copy Game MB/s (MB/s) | 1148 | 413 | 533 | ||
| CrystalDiskMark 5.2 / 6 | 29% | -38% | -25% | -22% | |
| Write 4K (MB/s) | 105.3 | 139.5 32% | 43.24 -59% | 113.7 8% | 108.7 3% |
| Read 4K (MB/s) | 40.9 | 61.3 50% | 14.07 -66% | 43.18 6% | 40.91 0% |
| Write Seq (MB/s) | 1914 | 1863 -3% | 887 -54% | 970 -49% | 798 -58% |
| Read Seq (MB/s) | 2224 | 2494 12% | 1515 -32% | 1085 -51% | 1610 -28% |
| Write 4K Q32T1 (MB/s) | 419.3 | 772 84% | 225.3 -46% | 396.8 -5% | 385.1 -8% |
| Read 4K Q32T1 (MB/s) | 288.1 | 454.8 58% | 346.5 20% | 317.8 10% | 305.8 6% |
| Write Seq Q32T1 (MB/s) | 1954 | 1869 -4% | 859 -56% | 518 -73% | 779 -60% |
| Read Seq Q32T1 (MB/s) | 3382 | 3480 3% | 2915 -14% | 1741 -49% | 2359 -30% |
| Total Average (Program / Settings) | 22% /
20% | -45% /
-44% | -33% /
-34% | -143% /
-162% |
* ... smaller is better

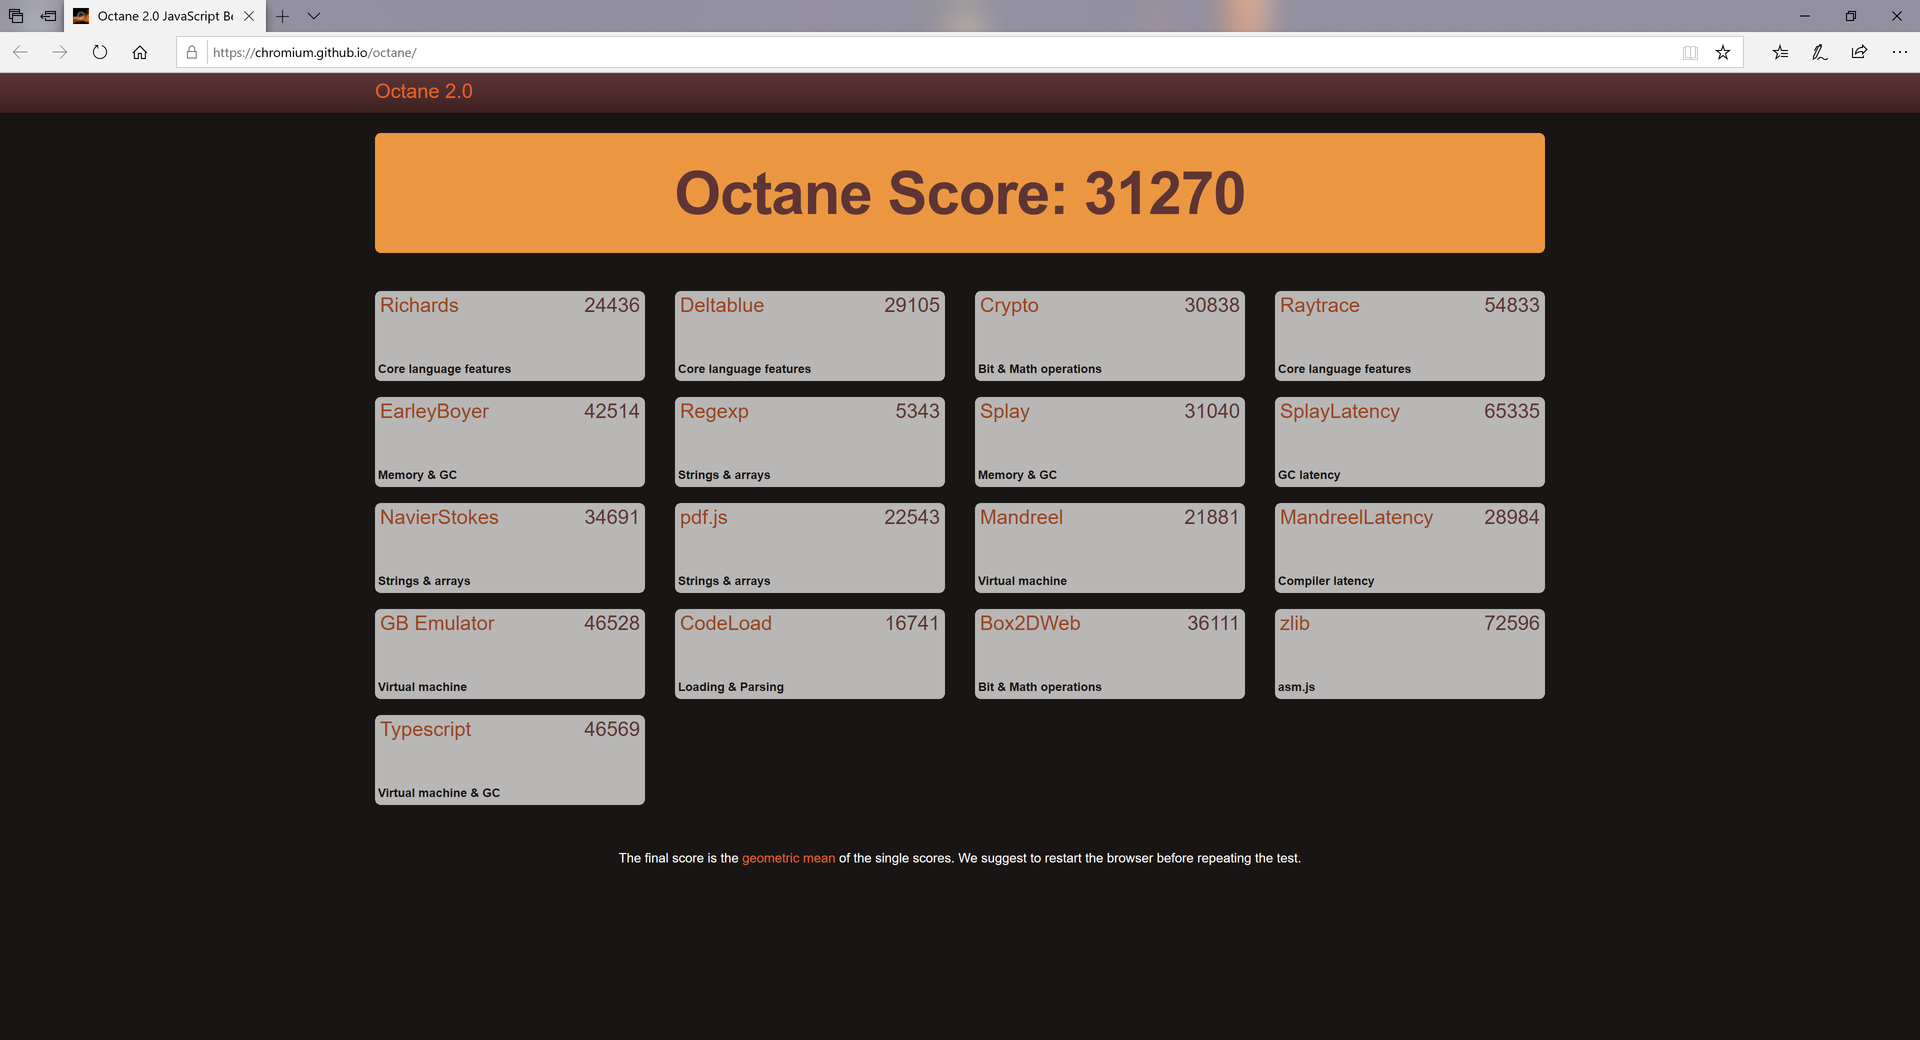
| 3DMark 11 Performance | 1987 points | |
| 3DMark Cloud Gate Standard Score | 8135 points | |
| 3DMark Fire Strike Score | 1130 points | |
Help | ||
| low | med. | high | ultra | |
|---|---|---|---|---|
| BioShock Infinite (2013) | 70 | 35 | 27 | 8 |
| Metro: Last Light (2013) | 41 | |||
| Rise of the Tomb Raider (2016) | 16 | 11 | 6 |
Noise level
| Idle |
| 28.3 / 28.3 / 31.3 dB(A) |
| Load |
| 34.3 / 34.3 dB(A) |
 | ||
30 dB silent 40 dB(A) audible 50 dB(A) loud |
||
min: | ||
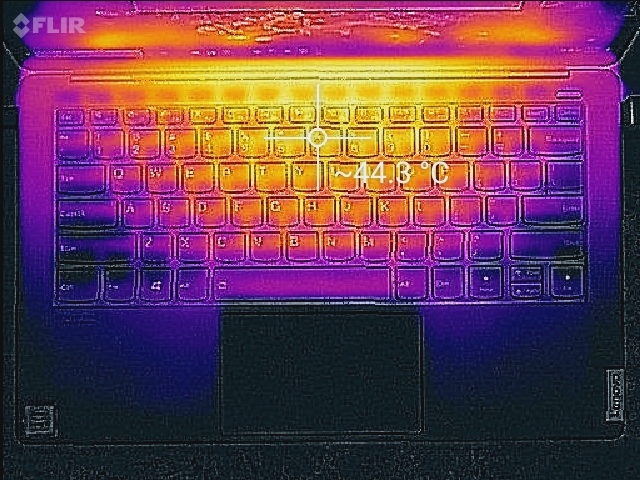
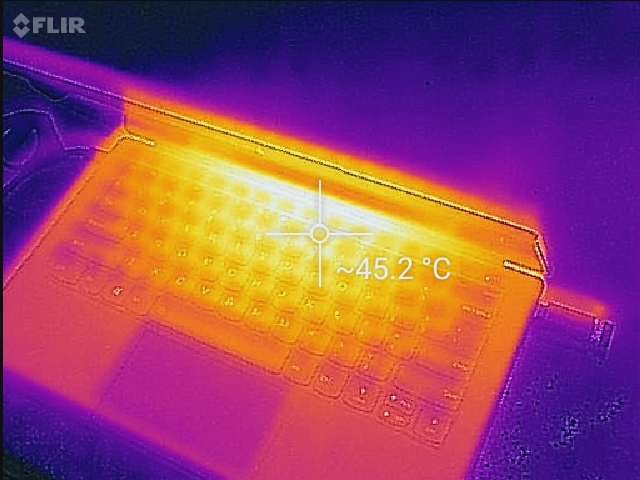
(±) The maximum temperature on the upper side is 43.8 °C / 111 F, compared to the average of 35.9 °C / 97 F, ranging from 21.4 to 59 °C for the class Subnotebook.
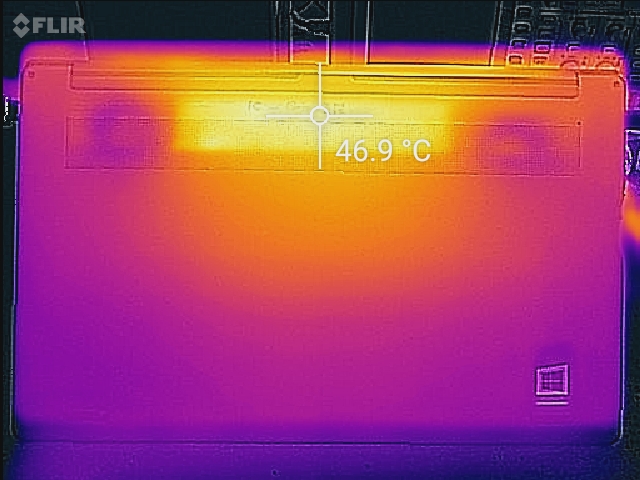
(-) The bottom heats up to a maximum of 47 °C / 117 F, compared to the average of 39.2 °C / 103 F
(+) In idle usage, the average temperature for the upper side is 30.9 °C / 88 F, compared to the device average of 30.8 °C / 87 F.
(+) The palmrests and touchpad are reaching skin temperature as a maximum (34 °C / 93.2 F) and are therefore not hot.
(-) The average temperature of the palmrest area of similar devices was 28.2 °C / 82.8 F (-5.8 °C / -10.4 F).
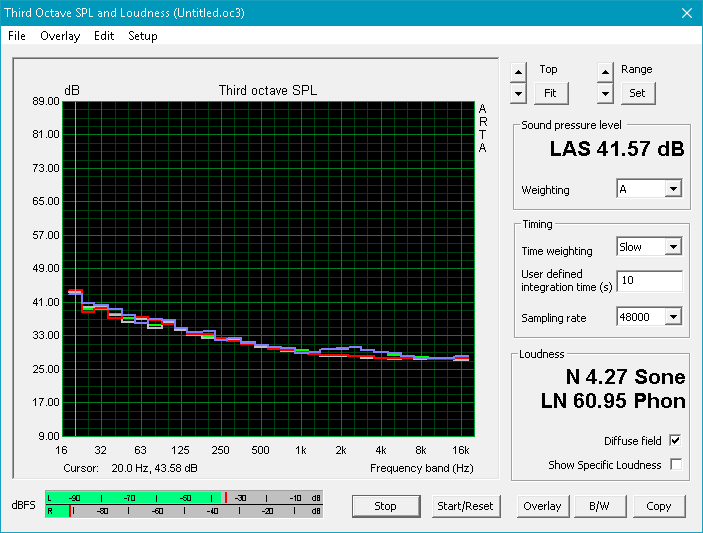
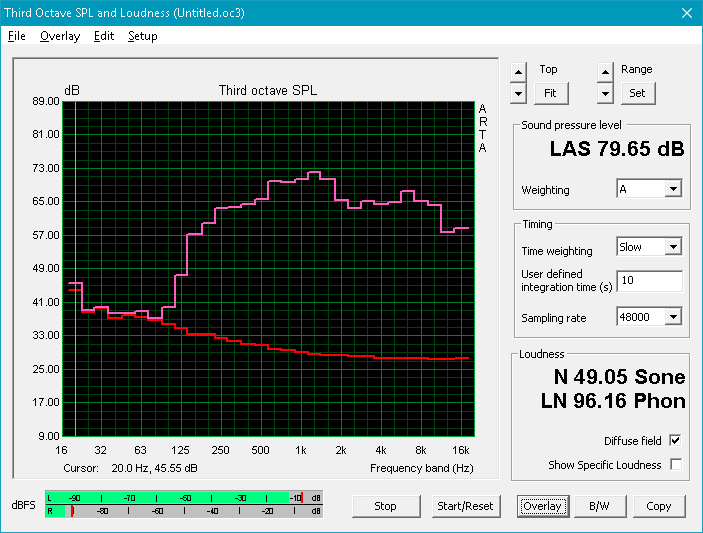
Lenovo IdeaPad S940-14IWL audio analysis
(±) | speaker loudness is average but good (79.7 dB)
Bass 100 - 315 Hz
(±) | reduced bass - on average 9.2% lower than median
(±) | linearity of bass is average (12.3% delta to prev. frequency)
Mids 400 - 2000 Hz
(+) | balanced mids - only 4% away from median
(+) | mids are linear (5.4% delta to prev. frequency)
Highs 2 - 16 kHz
(+) | balanced highs - only 0.9% away from median
(+) | highs are linear (4.2% delta to prev. frequency)
Overall 100 - 16.000 Hz
(±) | linearity of overall sound is average (15.2% difference to median)
Compared to same class
» 34% of all tested devices in this class were better, 5% similar, 61% worse
» The best had a delta of 5%, average was 18%, worst was 53%
Compared to all devices tested
» 21% of all tested devices were better, 4% similar, 74% worse
» The best had a delta of 4%, average was 24%, worst was 134%
Dell XPS 13 9380 i7 4K audio analysis
(±) | speaker loudness is average but good (75.3 dB)
Bass 100 - 315 Hz
(-) | nearly no bass - on average 18.5% lower than median
(±) | linearity of bass is average (8.1% delta to prev. frequency)
Mids 400 - 2000 Hz
(±) | higher mids - on average 7.7% higher than median
(±) | linearity of mids is average (11.5% delta to prev. frequency)
Highs 2 - 16 kHz
(±) | higher highs - on average 6.2% higher than median
(±) | linearity of highs is average (10.5% delta to prev. frequency)
Overall 100 - 16.000 Hz
(±) | linearity of overall sound is average (28.5% difference to median)
Compared to same class
» 90% of all tested devices in this class were better, 2% similar, 7% worse
» The best had a delta of 5%, average was 18%, worst was 53%
Compared to all devices tested
» 86% of all tested devices were better, 3% similar, 11% worse
» The best had a delta of 4%, average was 24%, worst was 134%
| Off / Standby | |
| Idle | |
| Load |
|
Key:
min: | |
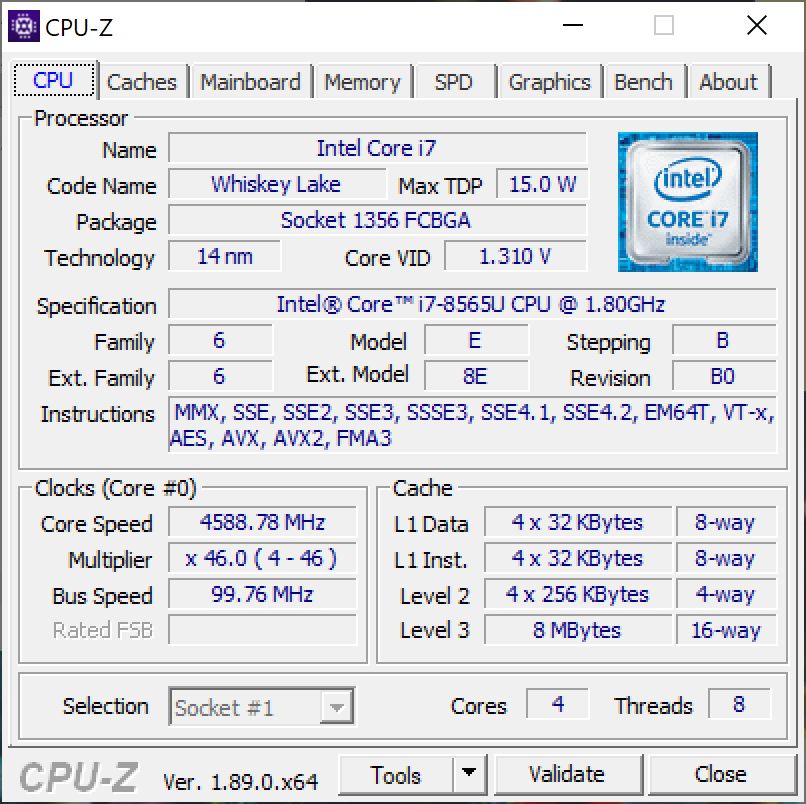
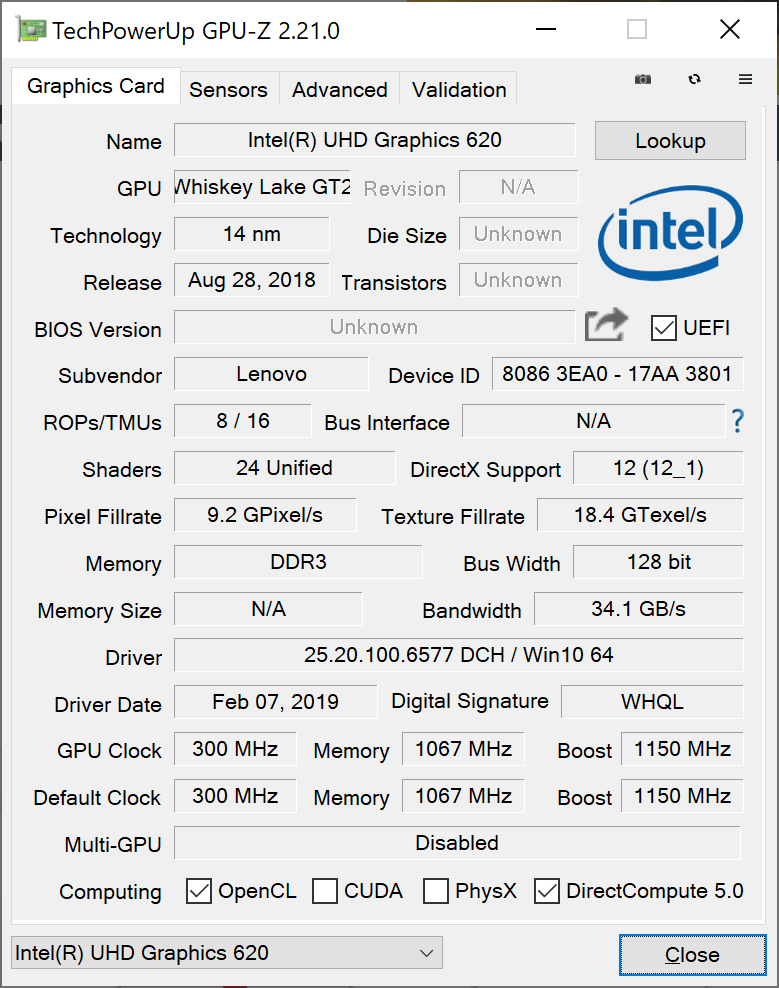
| Lenovo IdeaPad S940-14IWL i7-8565U, UHD Graphics 620, Samsung SSD PM981 MZVLB512HAJQ, IPS, 3840x2160, 14" | Dell XPS 13 9380 i7 4K i7-8565U, UHD Graphics 620, Samsung SSD PM981 MZVLB512HAJQ, IPS, 3840x2160, 13.3" | Apple MacBook Pro 13 2018 Touchbar i5 i5-8259U, Iris Plus Graphics 655, , IPS, 2560x1600, 13.3" | Asus ZenBook 13 UX333FA i5-8265U, UHD Graphics 620, WDC PC SN520 SDAPNUW-256G, IPS, 1920x1080, 13.3" | Lenovo Yoga C930-13IKB 81C4 i5-8550U, UHD Graphics 620, SK hynix PC401 HFS256GD9TNG, IPS, 1920x1080, 13.9" | Lenovo Yoga 530-14ARR-81H9000VGE R7 2700U, Vega 10, SK hynix BC501 HFM256GDHTNG, IPS, 1920x1080, 14" | |
|---|---|---|---|---|---|---|
| Power Consumption | 7% | 4% | 38% | 6% | 24% | |
| Idle Minimum * (Watt) | 5.2 | 5.2 -0% | 2.3 56% | 1.6 69% | 3.4 35% | 4.3 17% |
| Idle Average * (Watt) | 10.2 | 8.6 16% | 8.7 15% | 4.6 55% | 7.5 26% | 6.4 37% |
| Idle Maximum * (Watt) | 11.9 | 10.5 12% | 12.2 -3% | 7.3 39% | 11.8 1% | 7.8 34% |
| Load Average * (Watt) | 42.1 | 44.2 -5% | 53.3 -27% | 37.9 10% | 47.7 -13% | 34 19% |
| Load Maximum * (Watt) | 53.6 | 47.5 11% | 64 -19% | 44.8 16% | 63.2 -18% | 47.8 11% |
* ... smaller is better
| Lenovo IdeaPad S940-14IWL i7-8565U, UHD Graphics 620, 52 Wh | Dell XPS 13 9380 i7 4K i7-8565U, UHD Graphics 620, 52 Wh | Apple MacBook Pro 13 2018 Touchbar i5 i5-8259U, Iris Plus Graphics 655, 58 Wh | Asus ZenBook 13 UX333FA i5-8265U, UHD Graphics 620, 50 Wh | Lenovo ThinkPad X1 Carbon 2018-20KGS5DU00 i5-8550U, UHD Graphics 620, 57 Wh | Lenovo Yoga C930-13IKB 81C4 i5-8550U, UHD Graphics 620, 60 Wh | Lenovo Yoga 530-14ARR-81H9000VGE R7 2700U, Vega 10, 45 Wh | |
|---|---|---|---|---|---|---|---|
| Battery runtime | 54% | 94% | 119% | 80% | 122% | 28% | |
| Reader / Idle (h) | 8.4 | 27.8 231% | 11.7 39% | ||||
| WiFi v1.3 (h) | 5 | 7.7 54% | 9.7 94% | 9.9 98% | 9 80% | 11.1 122% | 6.7 34% |
| Load (h) | 1.7 | 2.2 29% | 1.9 12% | ||||
| Witcher 3 ultra (h) | 1.6 |
Pros
Cons
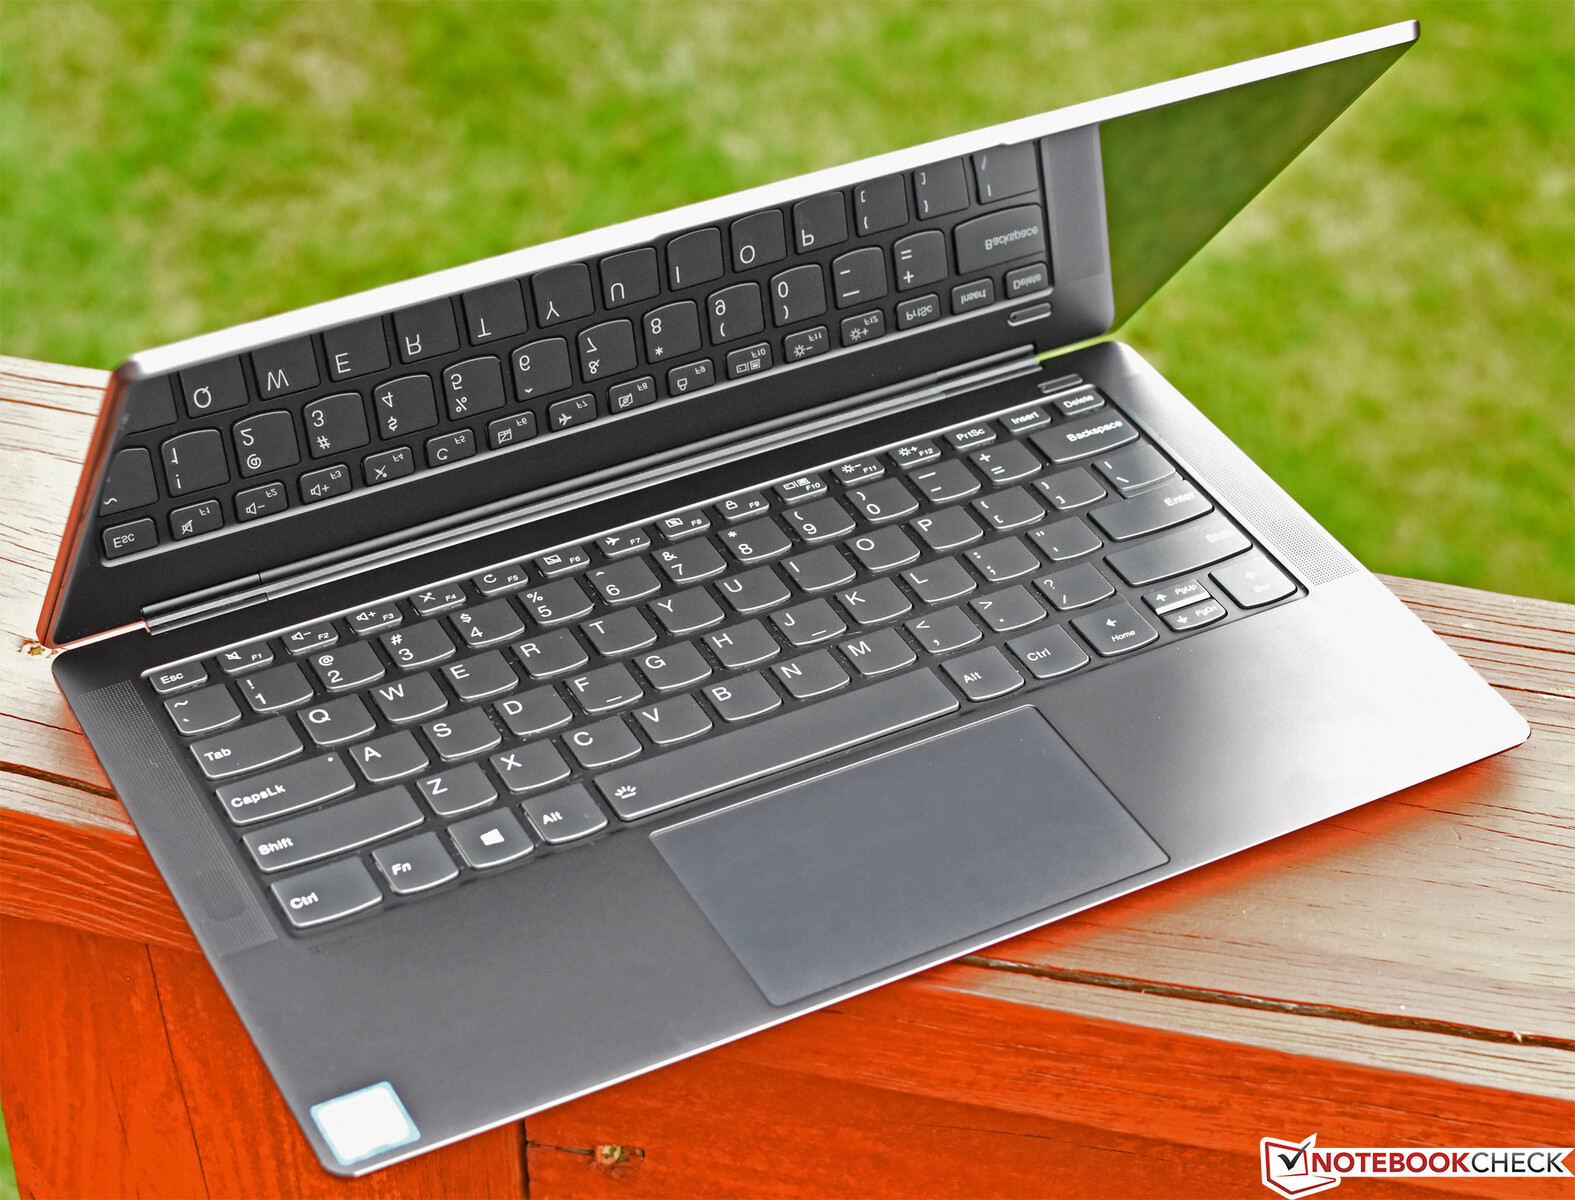
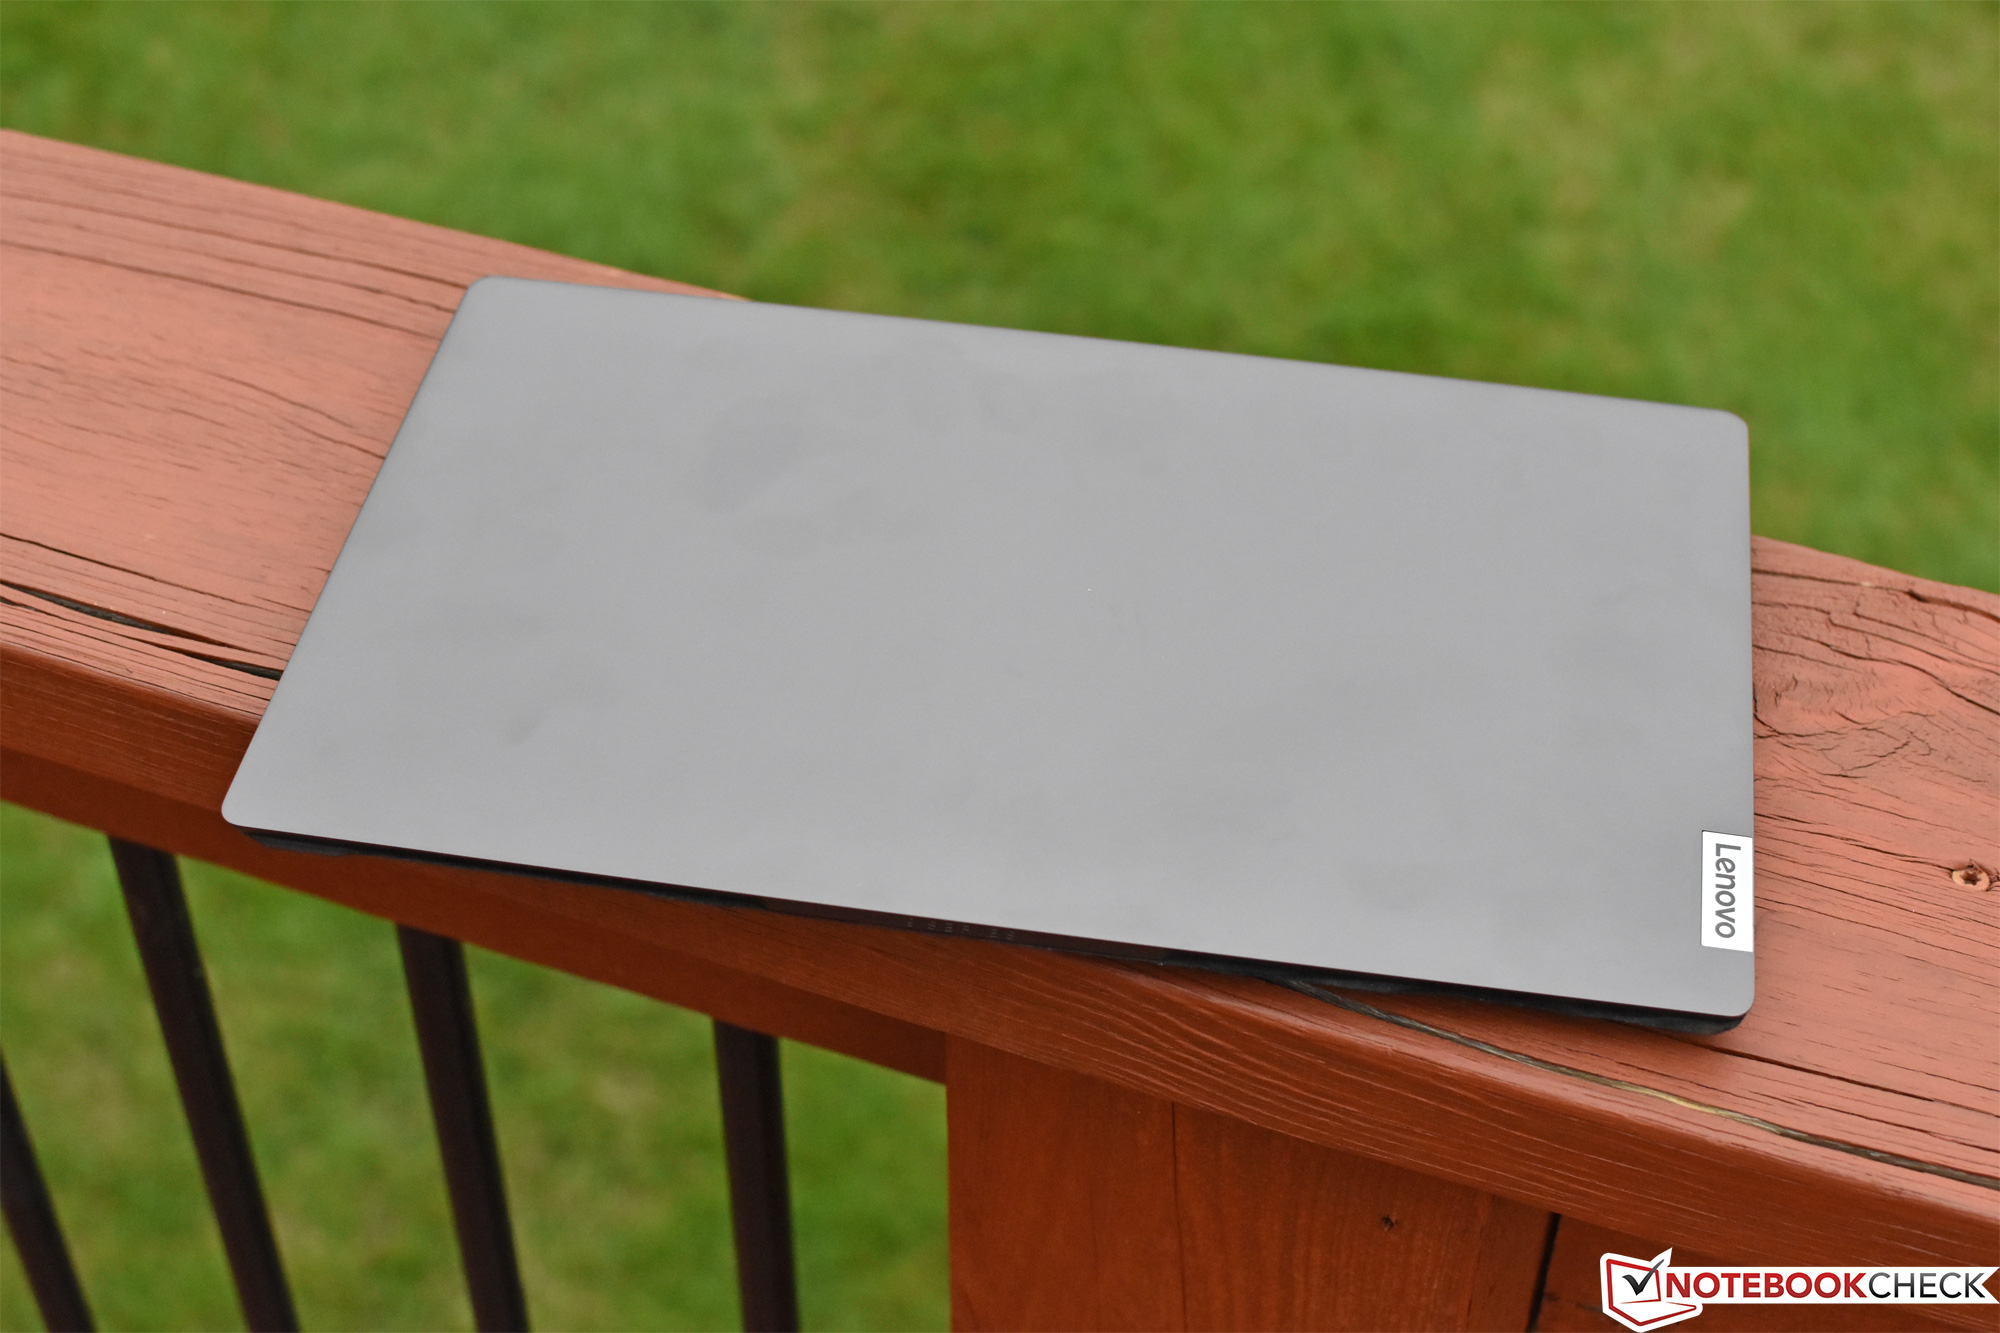
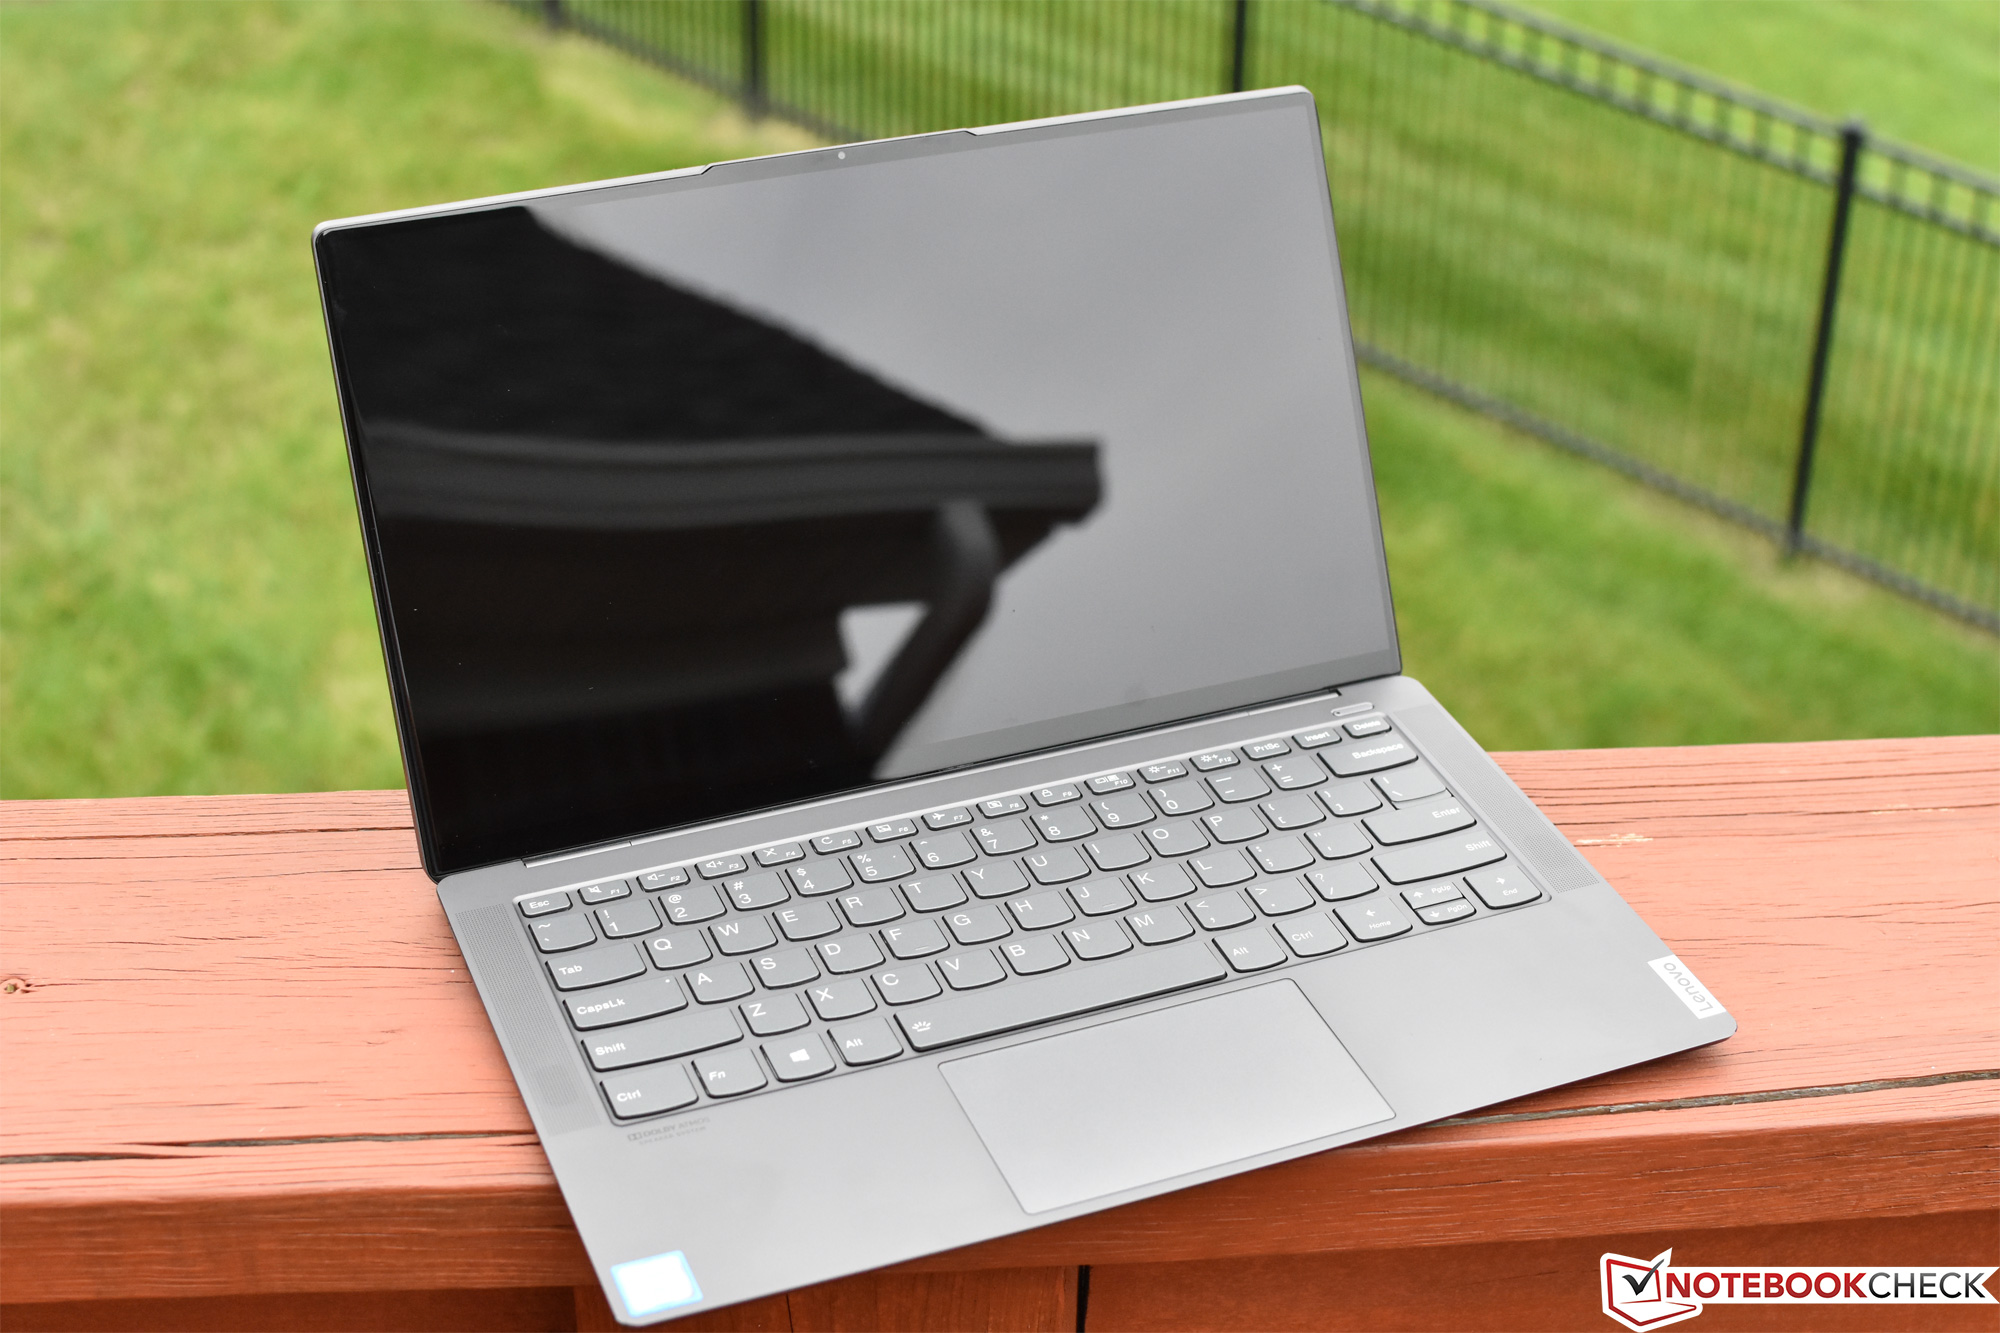
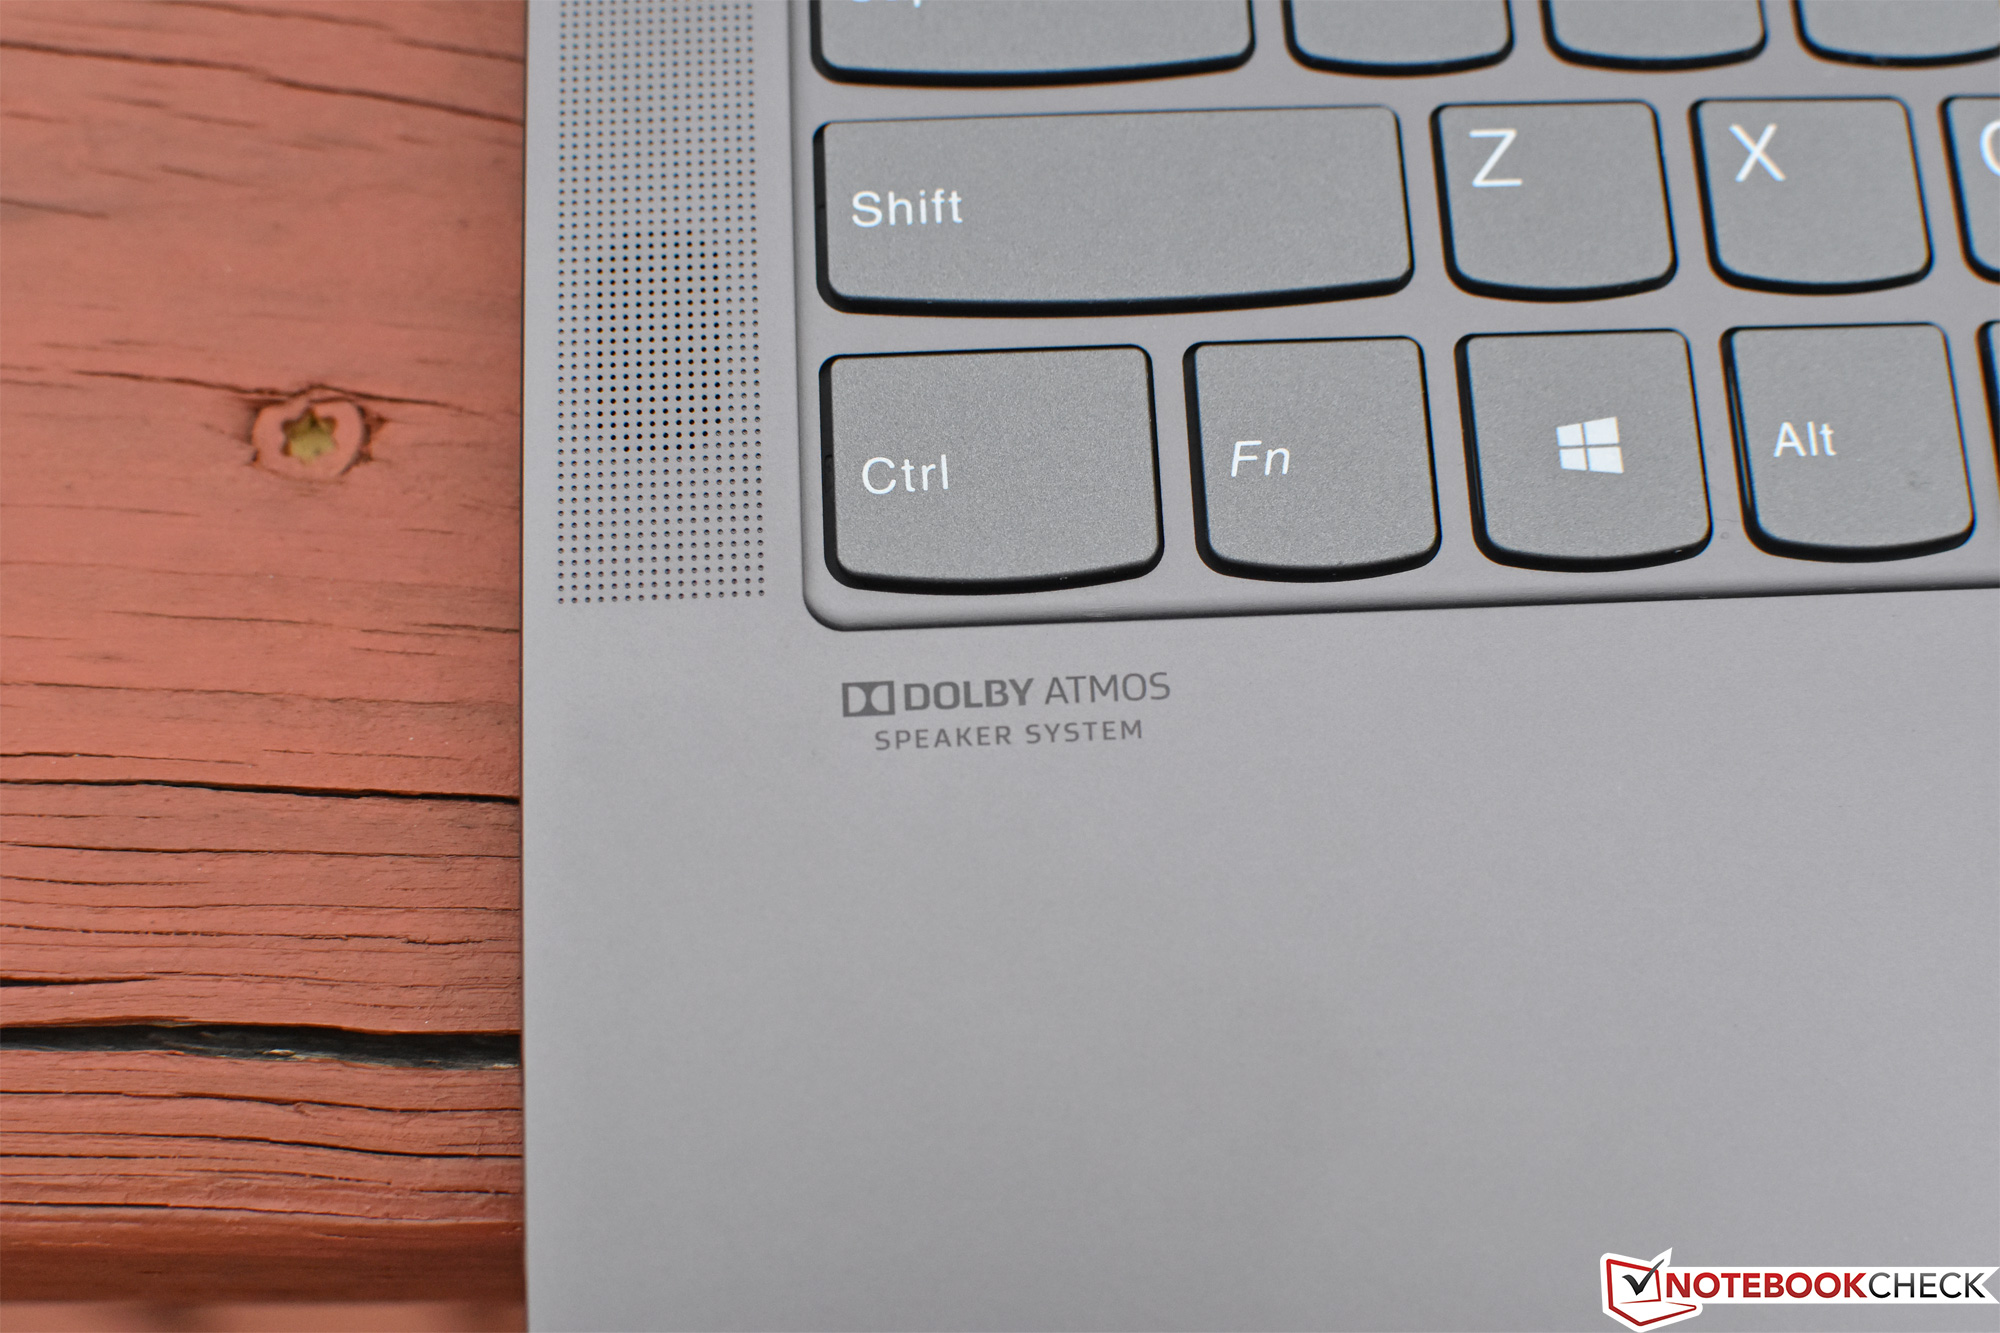
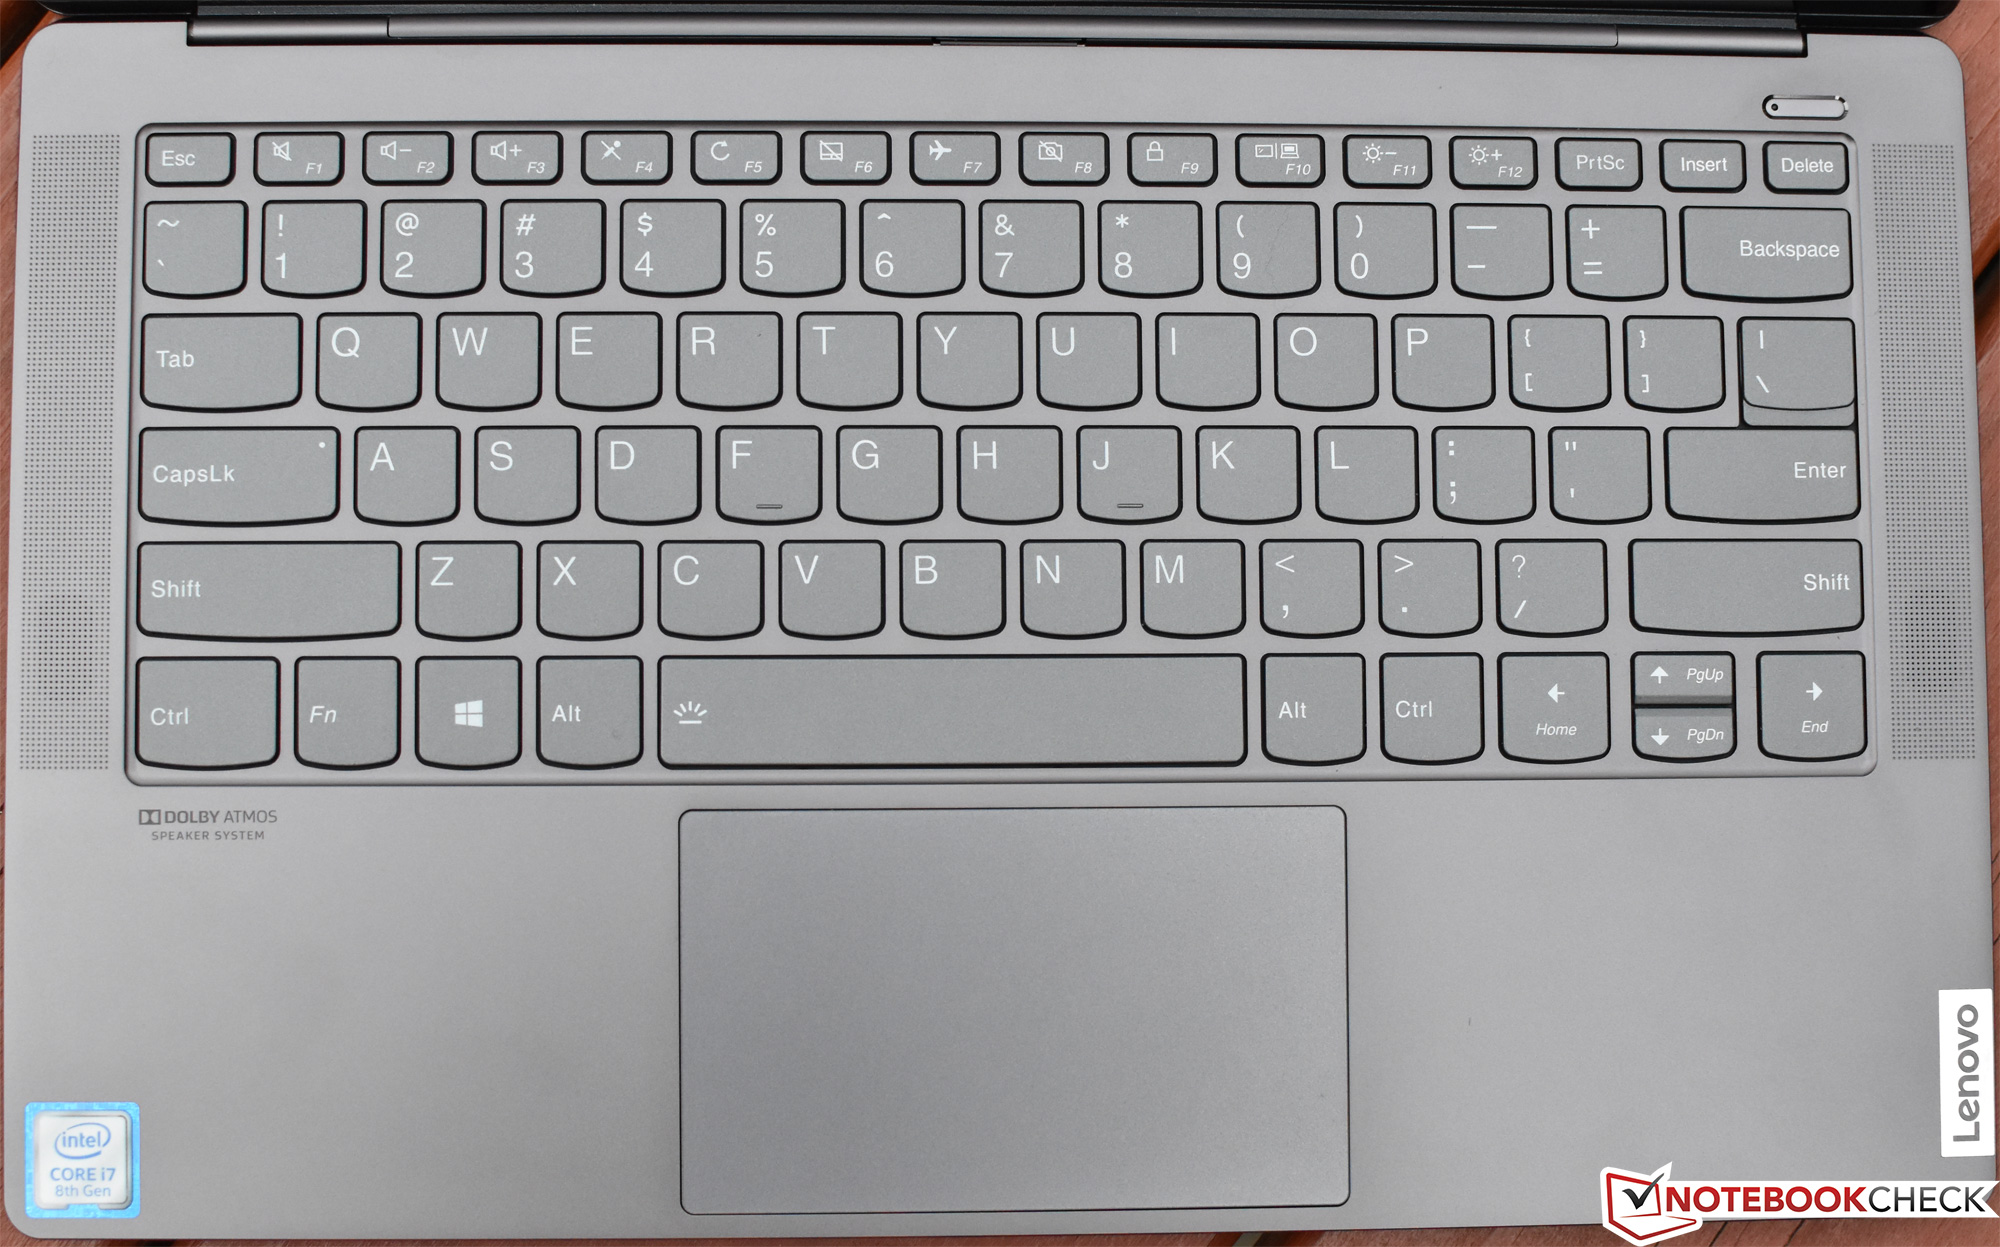
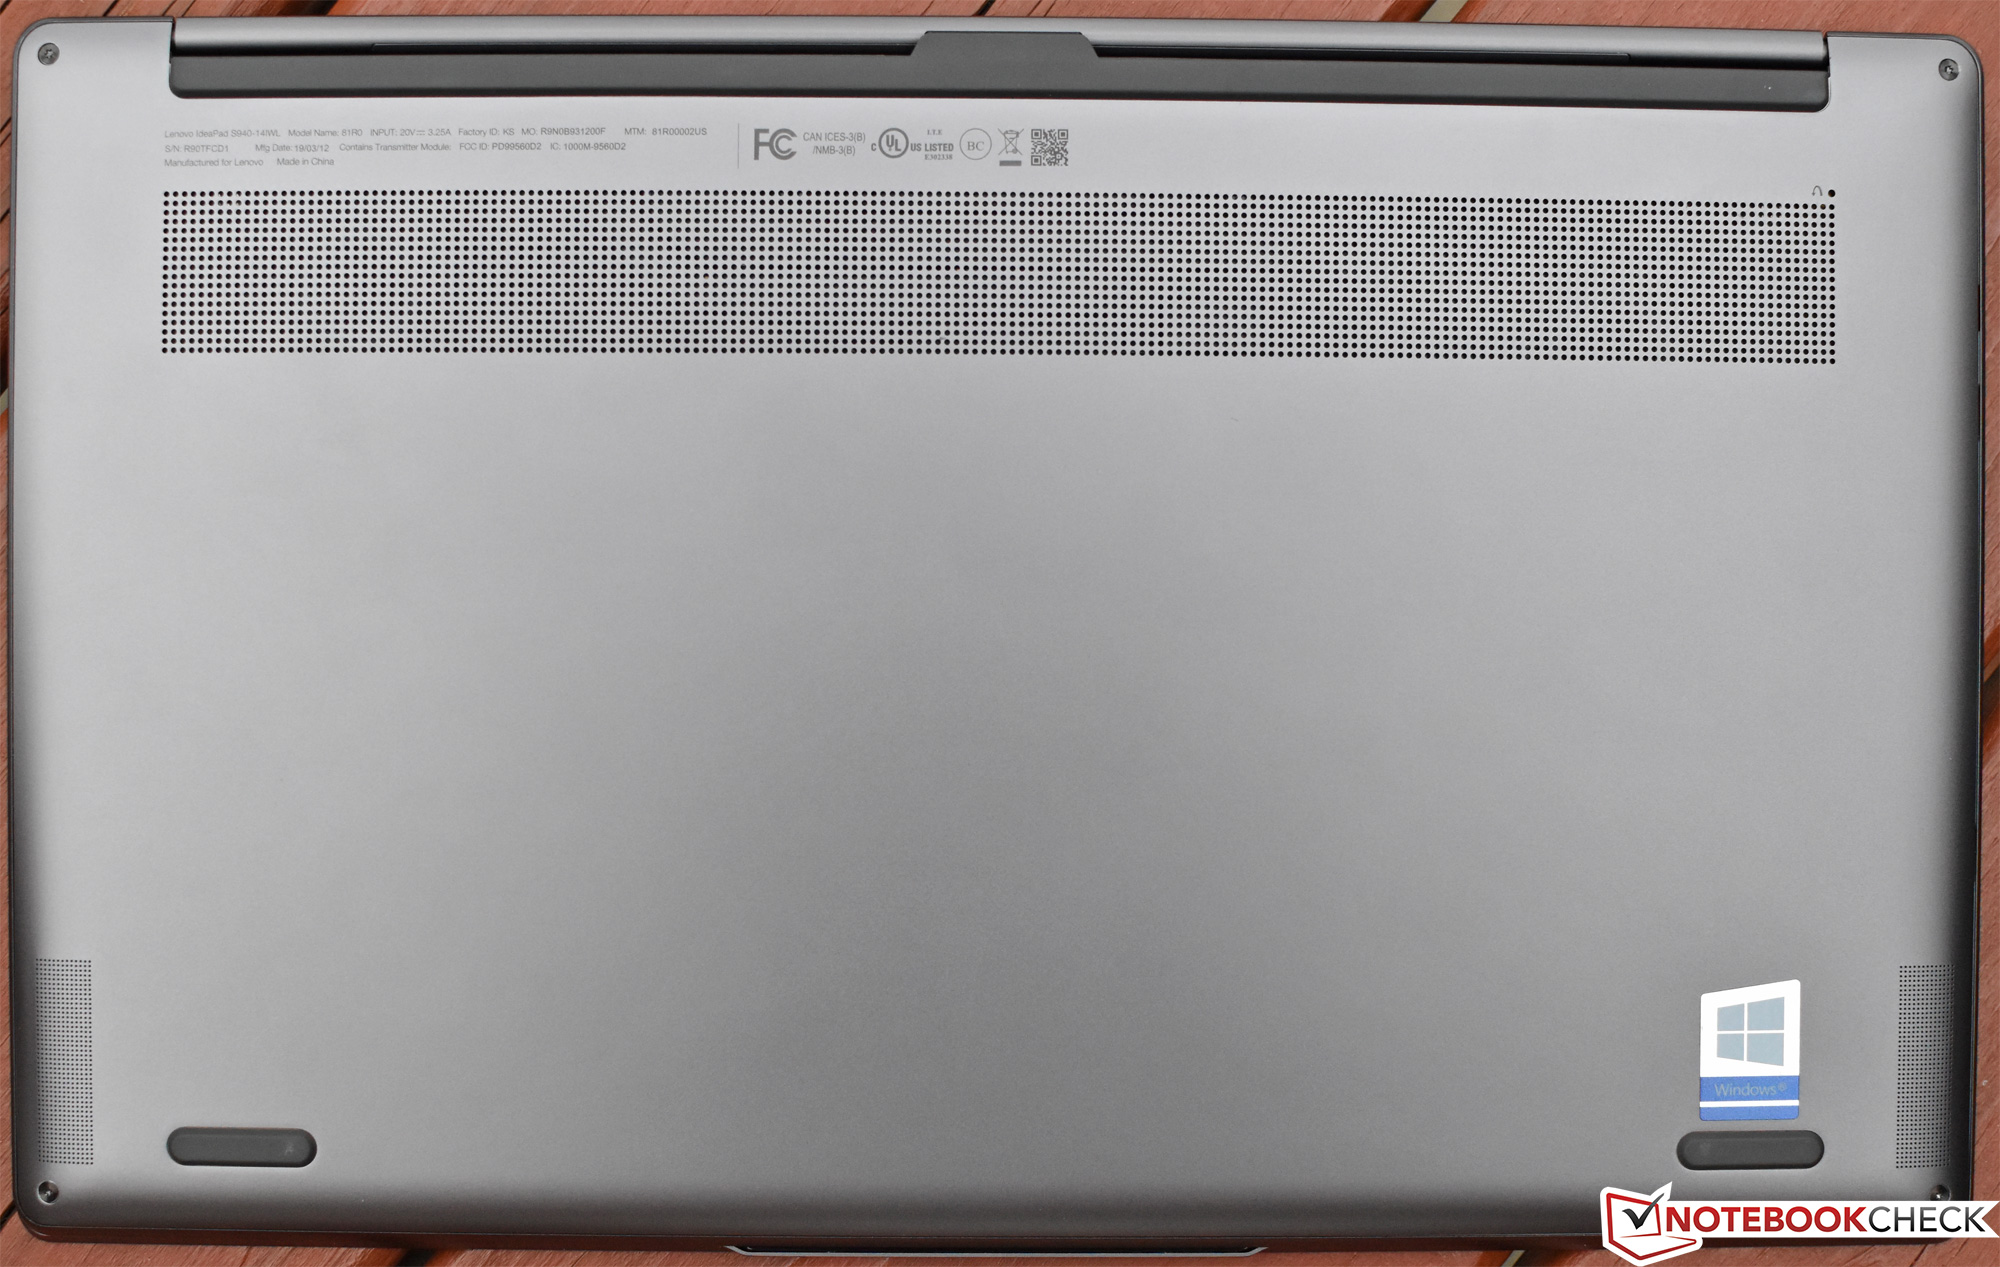
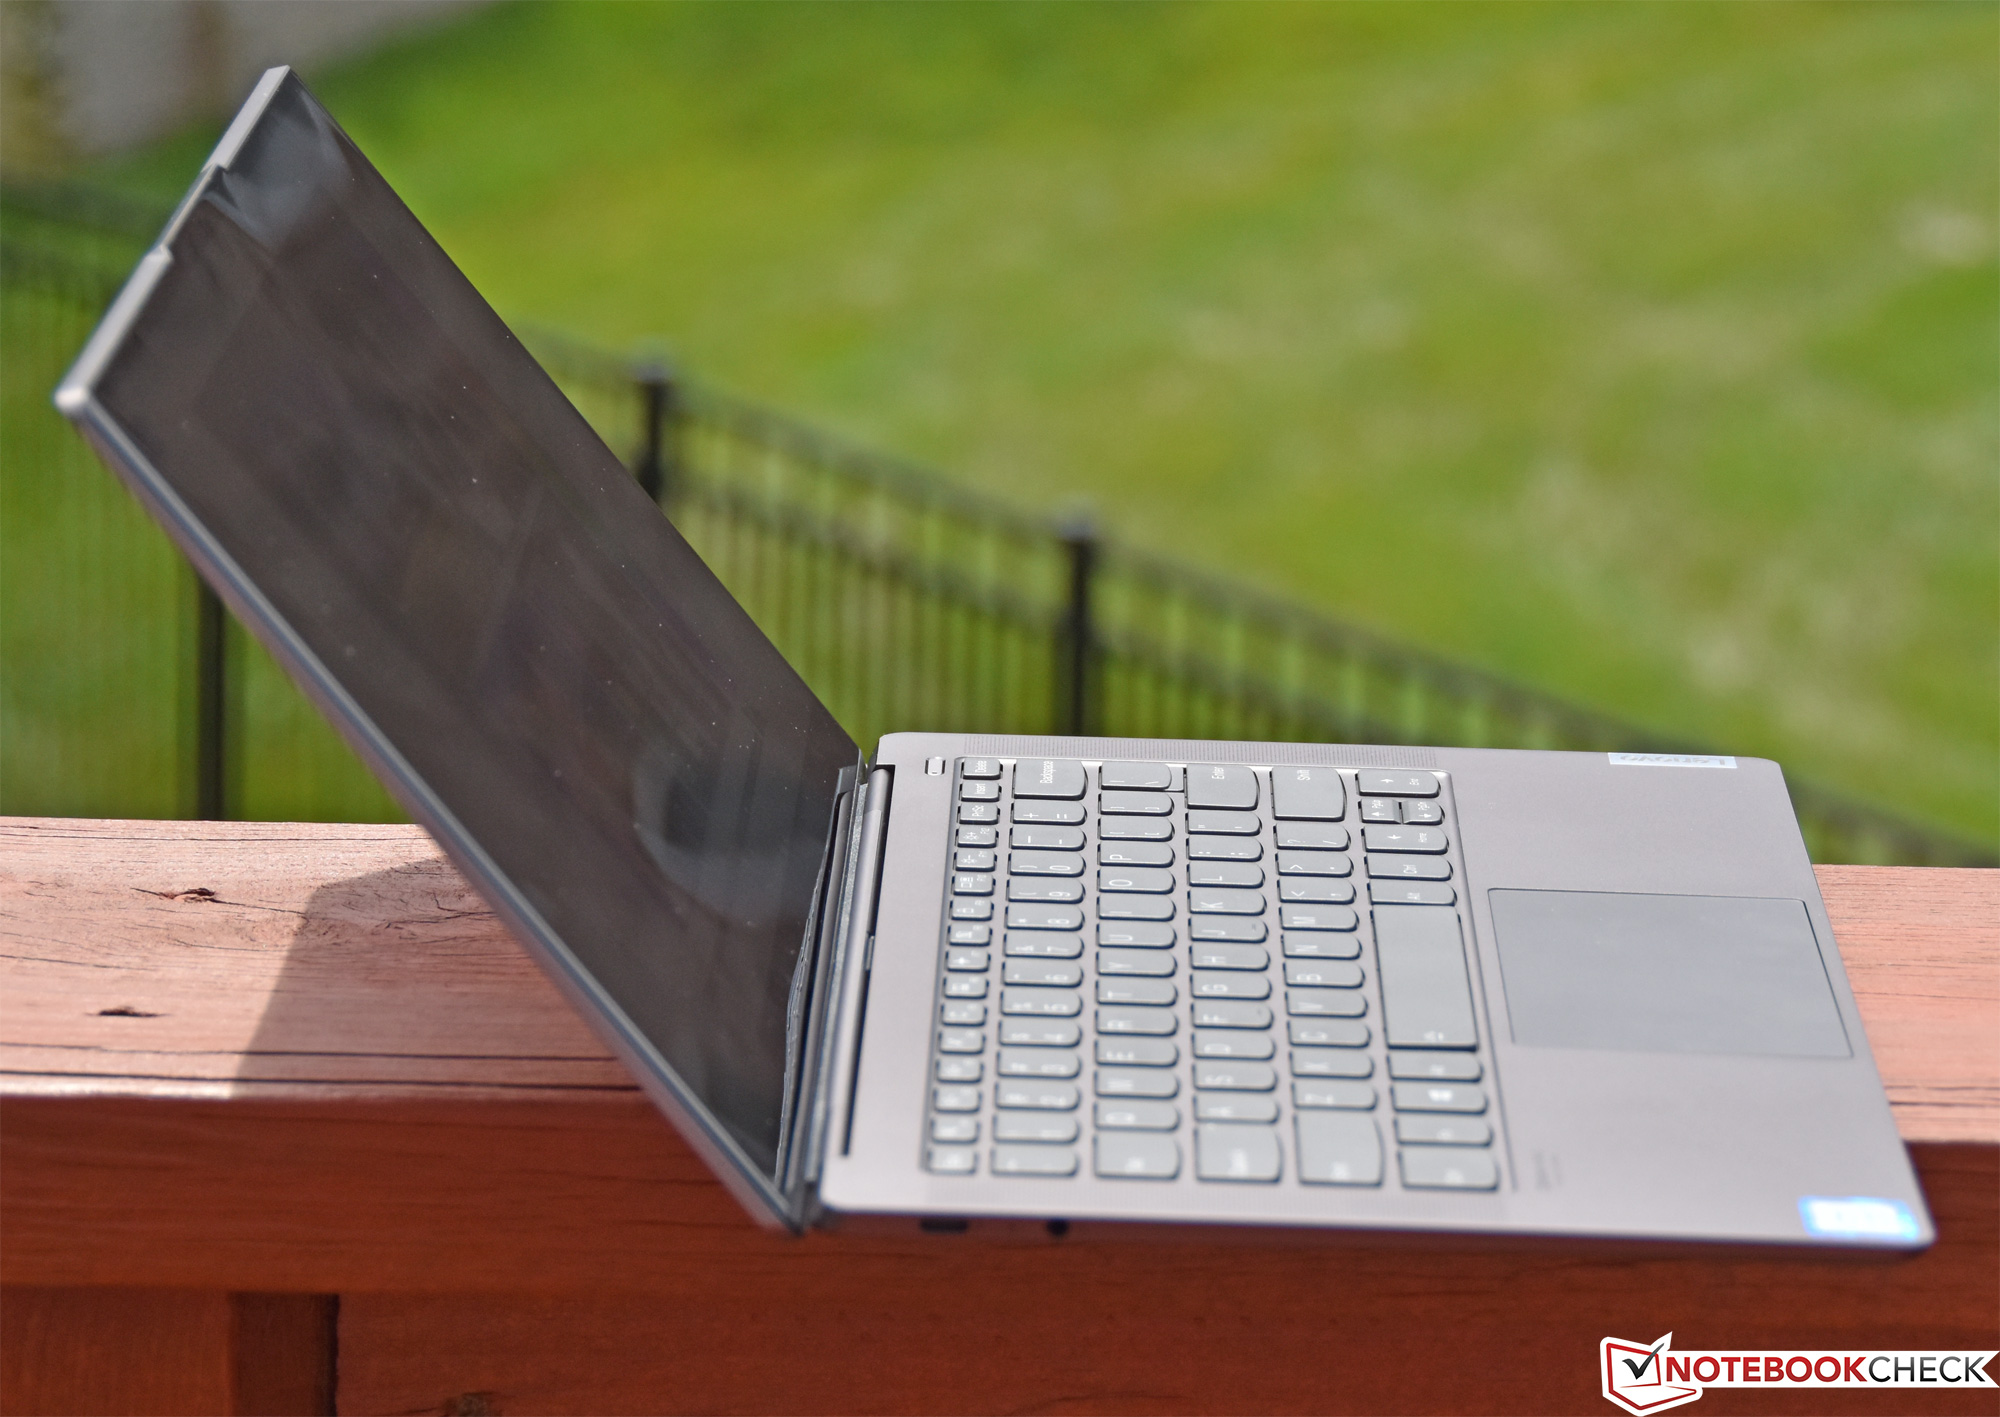
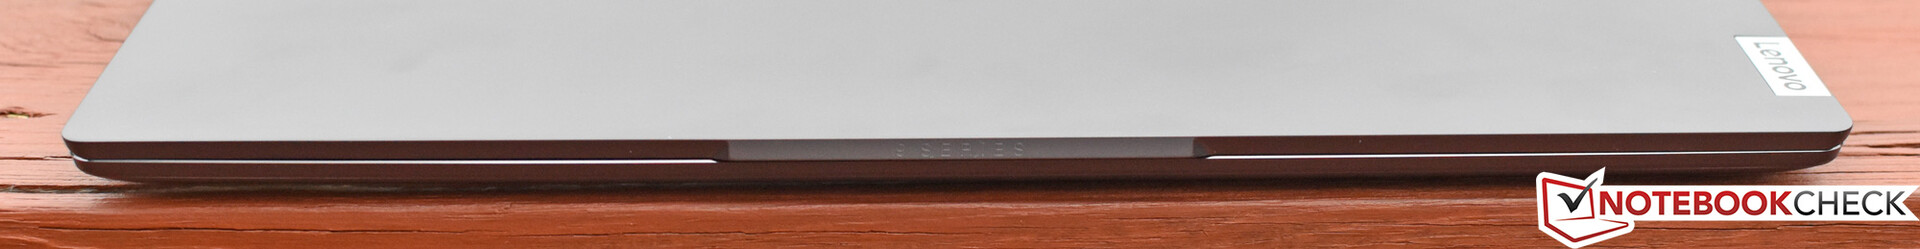
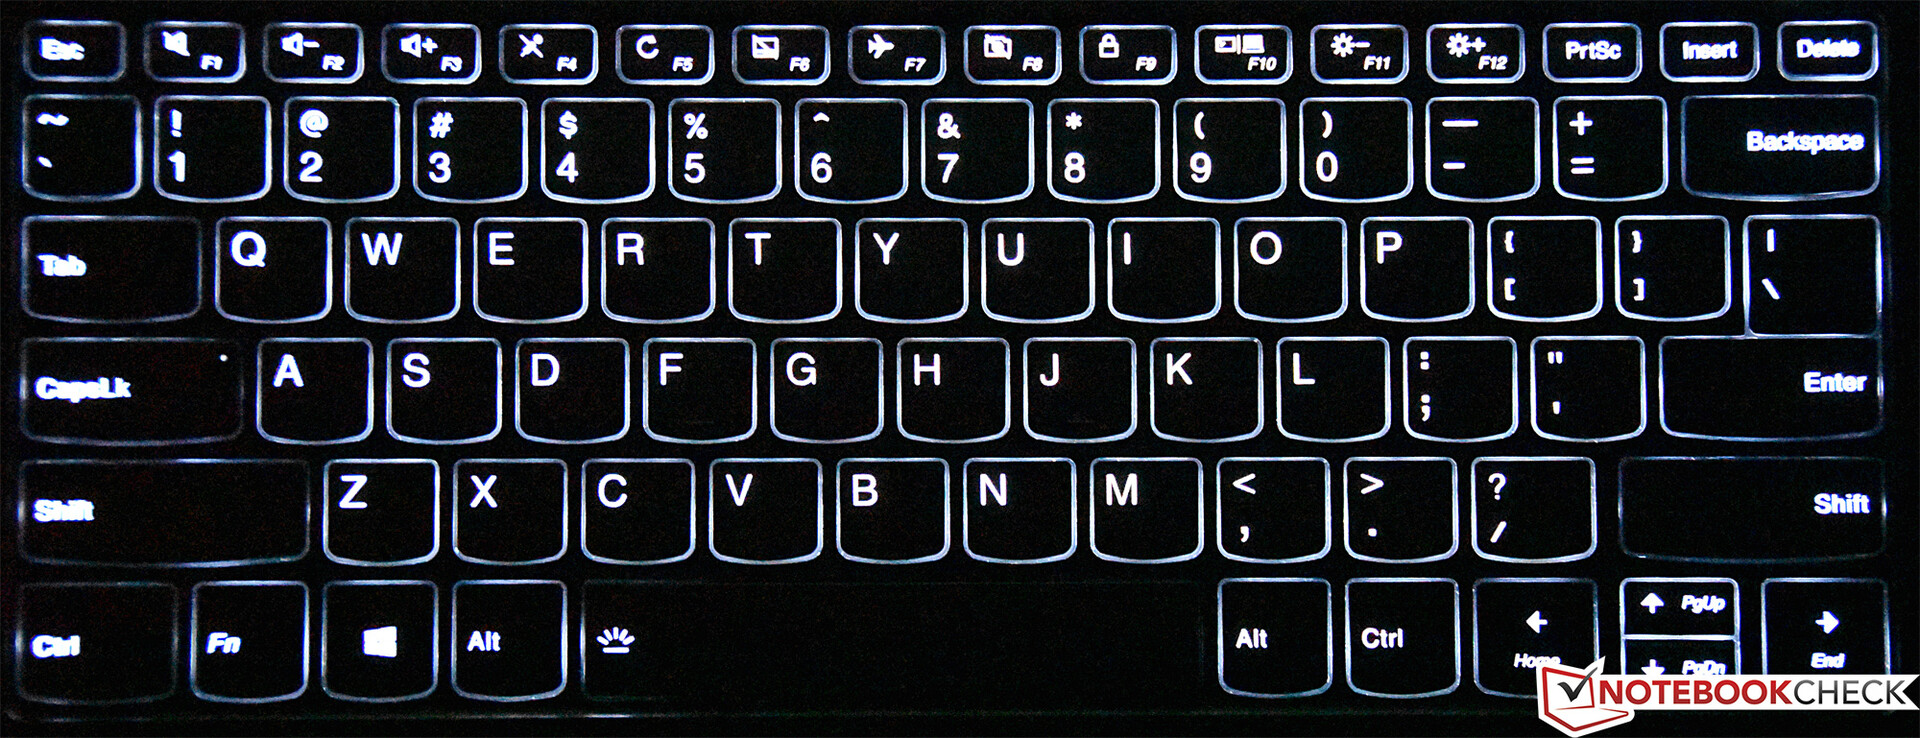
IdeaPad S940是一款绝对华丽的设备。它是我们迄今为止评测过的最小最轻的14英寸笔记本电脑之一,它非常适合在厨房桌子或会议室中使用。虽然它很小,但它的构造仍然感觉相对坚固,具有高强度的屏幕,完美的铰链,并且机身几乎不会弯曲。它也是我们在笔记本电脑中看到的最令人印象深刻且令人难以置信的高亮度4K HDR显示器之一。使影音体验更上一层楼的是四个看似强大的杜比Atmos扬声器......虽然物理大小仍然是一个不可避免的约束,但它们提供的音频体验远远超过其他任何尺寸的笔记本电脑。它几乎在所有条件下几乎都是静音的,即使在负载下也几乎听不见。最后,尽管它很薄,输入设备也相当不错——带有非常好的玻璃点击垫,伴随着键程短但仍可维修的键盘。
IdeaPad S940是一款漂亮的笔记本电脑,但4K显示屏和i7 CPU版本有一些重要的失误,使其难以被推荐用于大多数用途。我们期待在以后有机会评测i5 CPU,FHD版本,我们希望这可能会解决其中一些令人失望的问题。
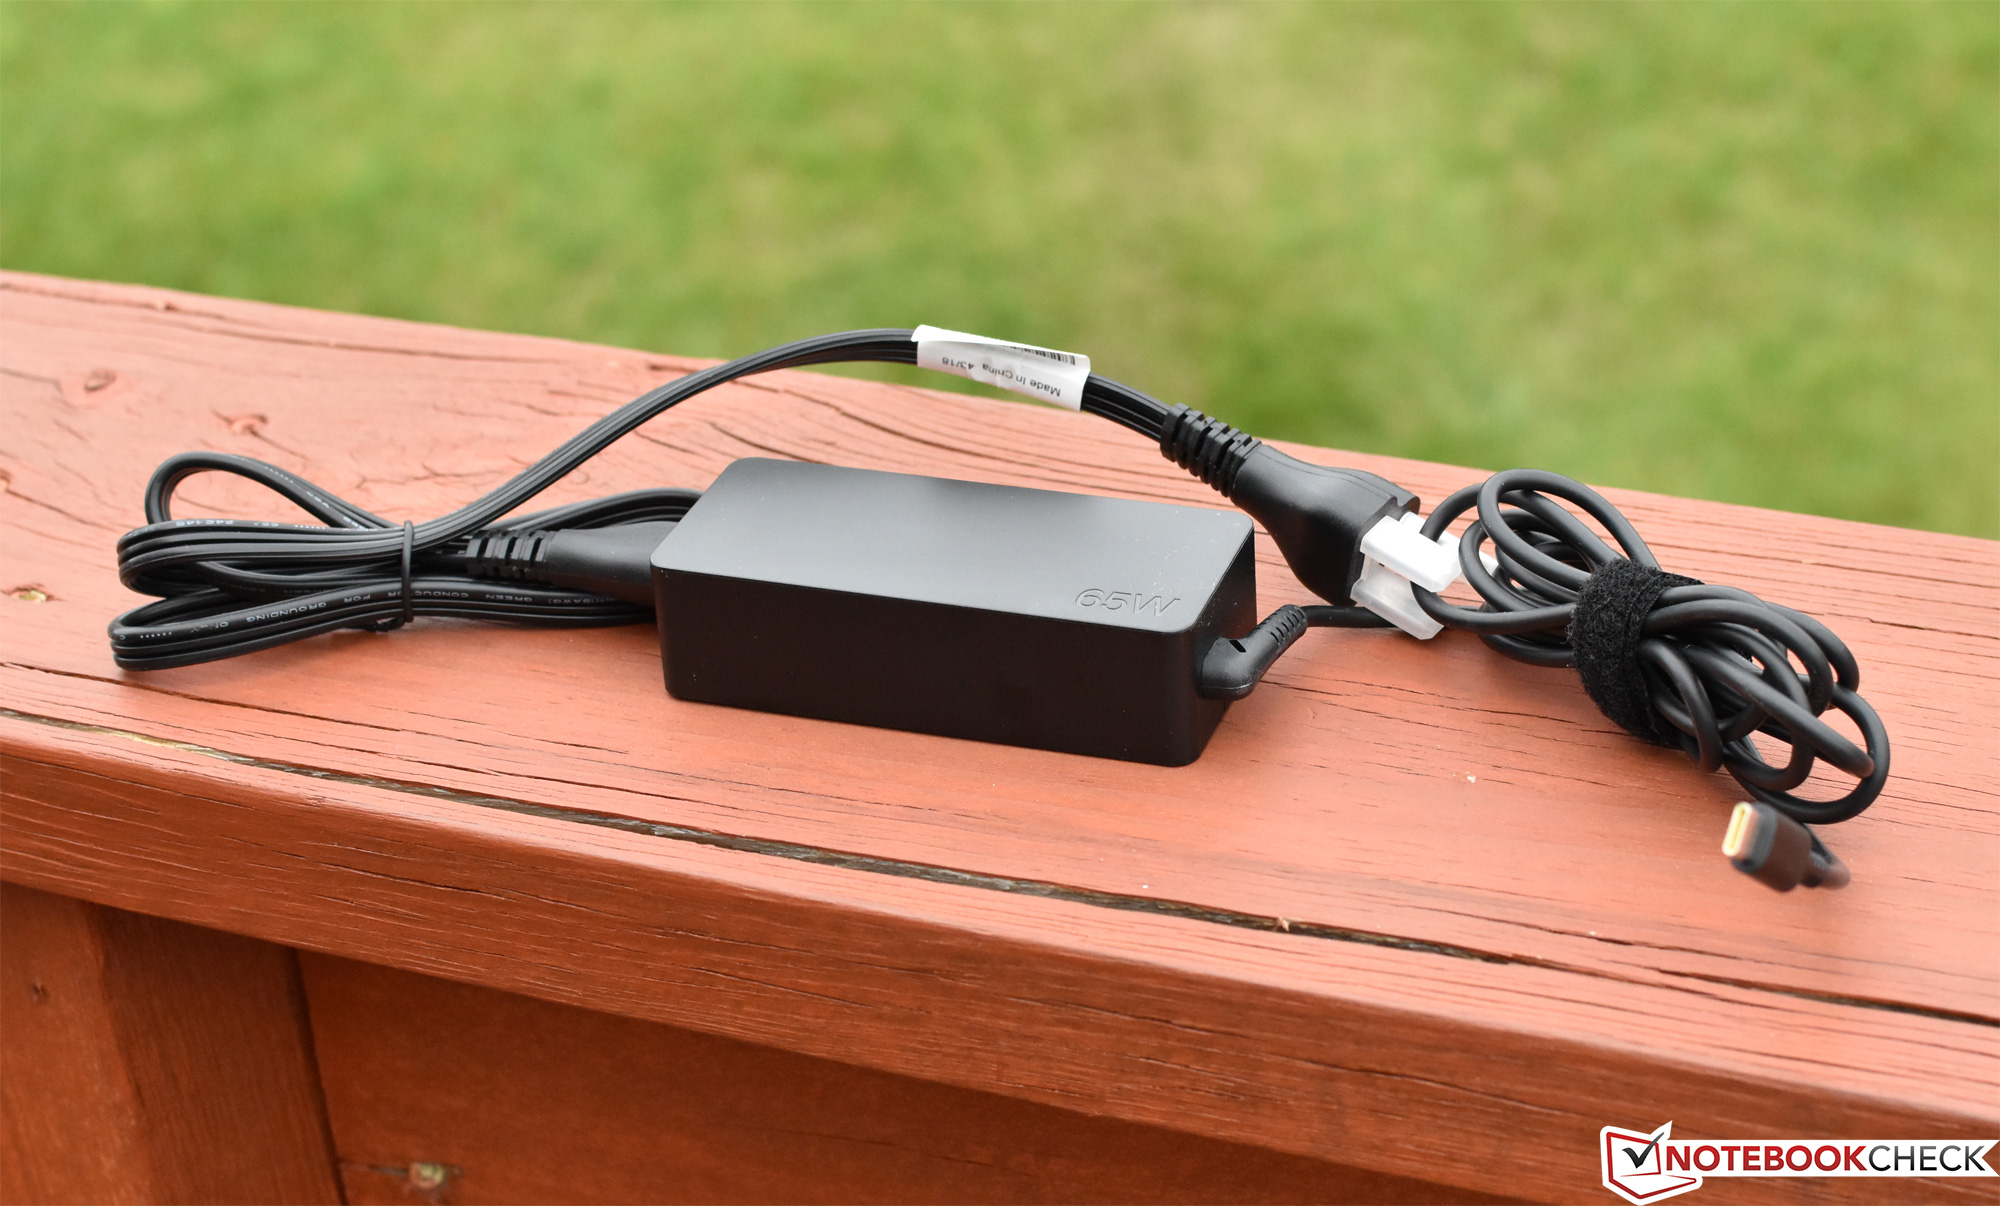
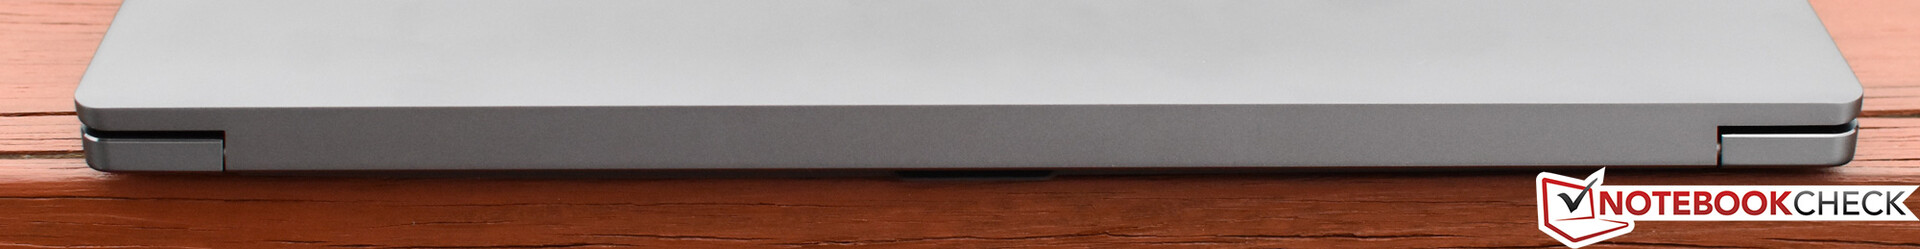
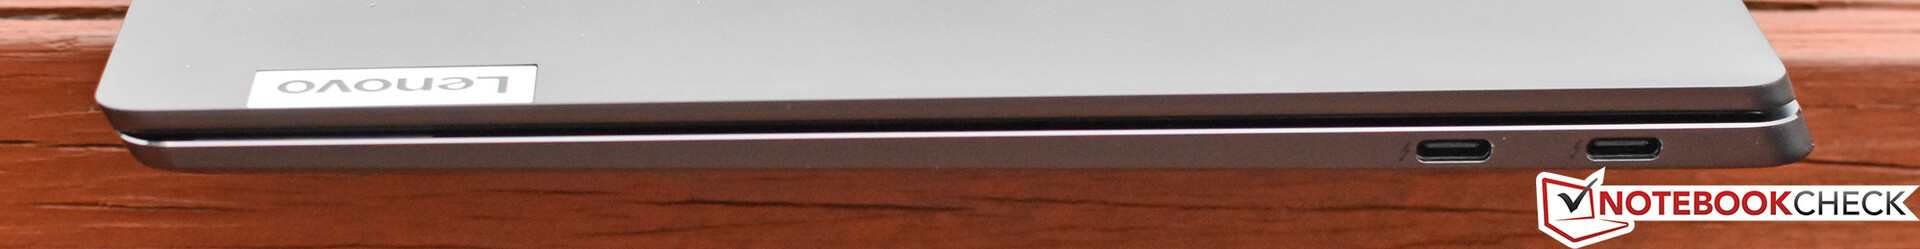
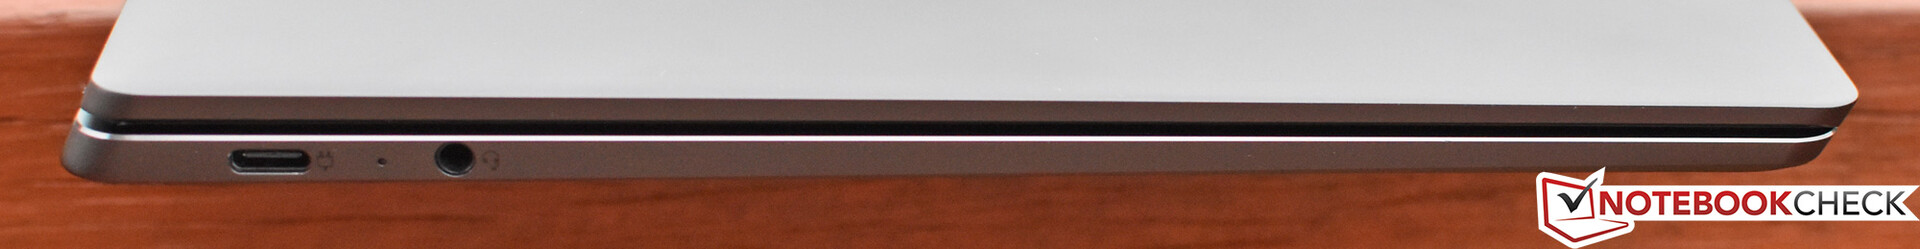
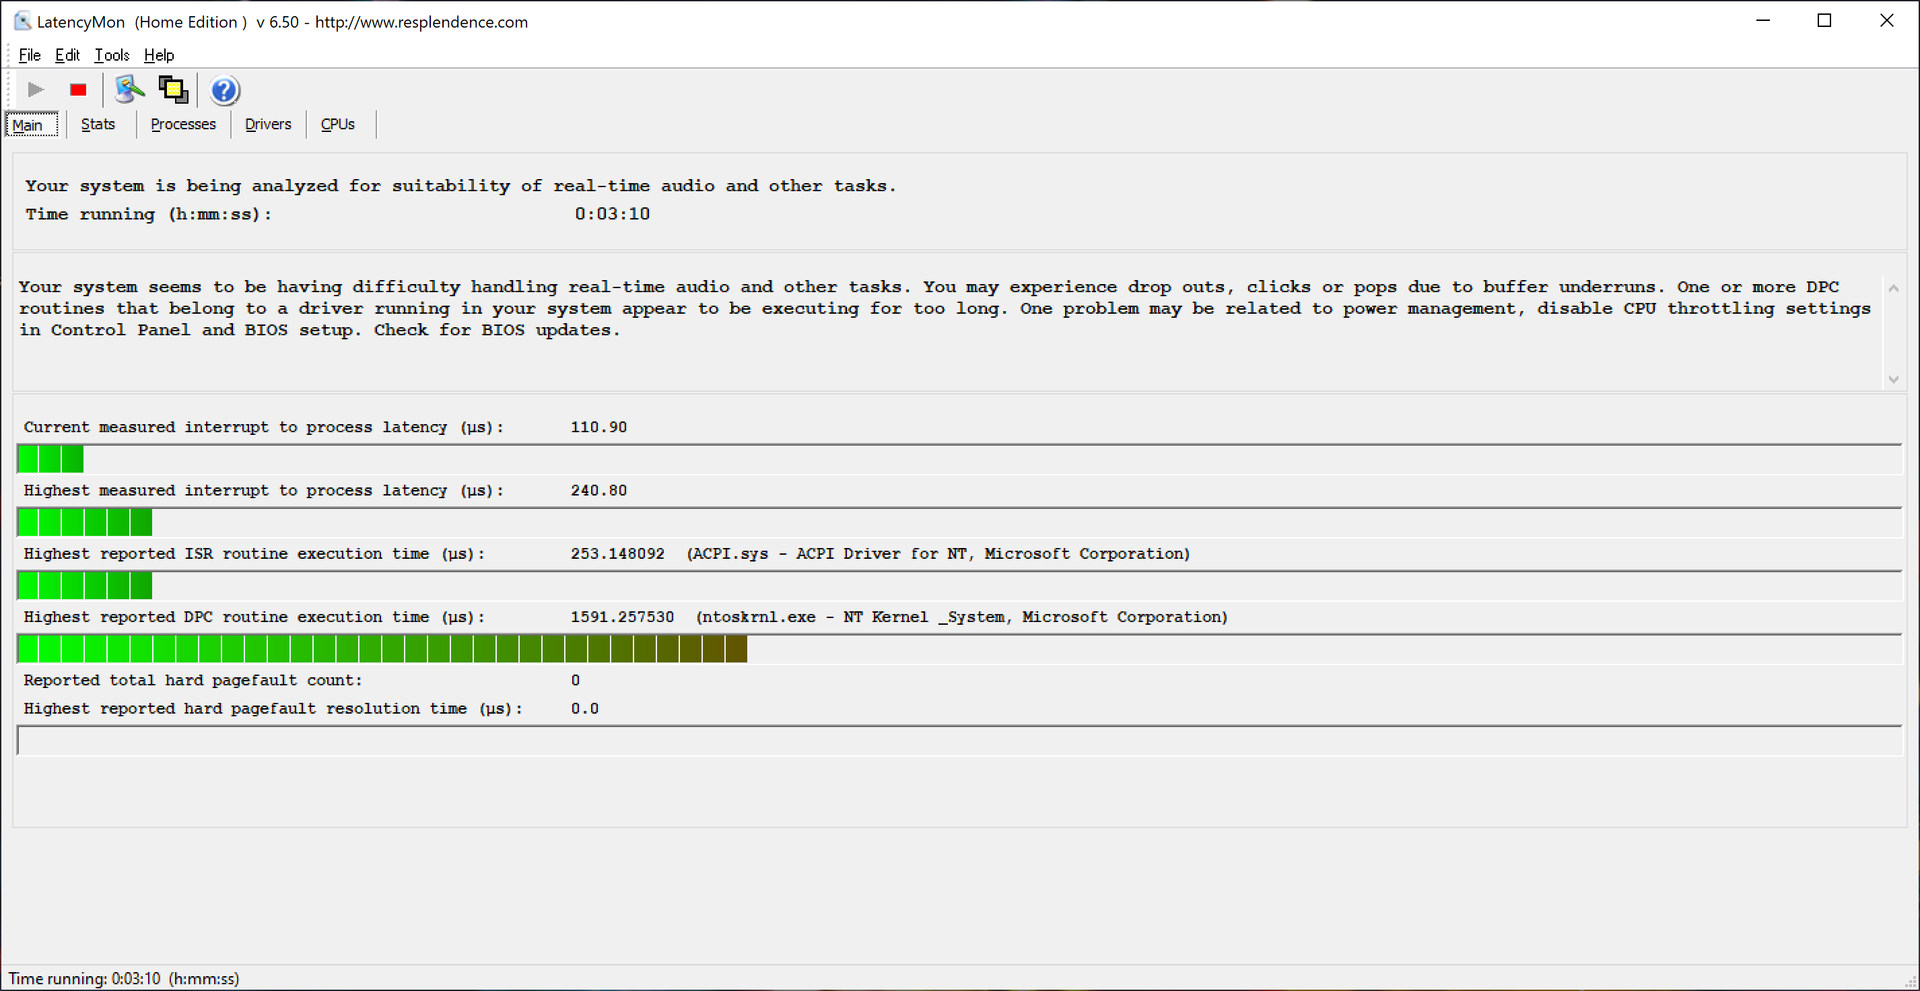
可惜它不完美。不幸的是,从这里开始,情况就下滑了。端口选择有点少,只有两个雷电3.0端口(没有专用充电端口),另外还有一个USB Type-C端口和一个耳机插孔。功耗偏高,电池续航时间短得令人失望——我们的网页浏览基准测试续航只有不到5小时。但最令人不安的是机器不愿意——或者说是没这个本事——正常的散热:持续的负荷导致温度迅速上升到90摄氏度,也不会变得得更低。结果低于我们评测中Core i7芯片的平均CPU性能。但笔记本电脑在空转时和正常使用情况下同样对冷却本身并不感兴趣 - 疏忽导致在许多情况下表面温度很高,使得放在腿上的使用不那么舒适。
所以,不幸的是,S940的实际用途——至少与前面提到的令人惊叹的UHD显示器相比——就不尽如人意了。尽管我们还没有测试过这样的配置,但FHD显示选项可能会明显改善续航时间,所以我们不能肯定地说。如果CPU性能不重要,或许Core i5可能会以更低的成本表现得更出色。这也可能对温度有所帮助,甚至会改善整体情况。尽管如此,尽管它具有漂亮的轻量级机身和屏幕,但很不去推荐X1 Carbon,或其他任何其他竞争对手(所有这些都在大多数类别中表现更好),例如戴尔XPS 13或MacBook Pro 13。
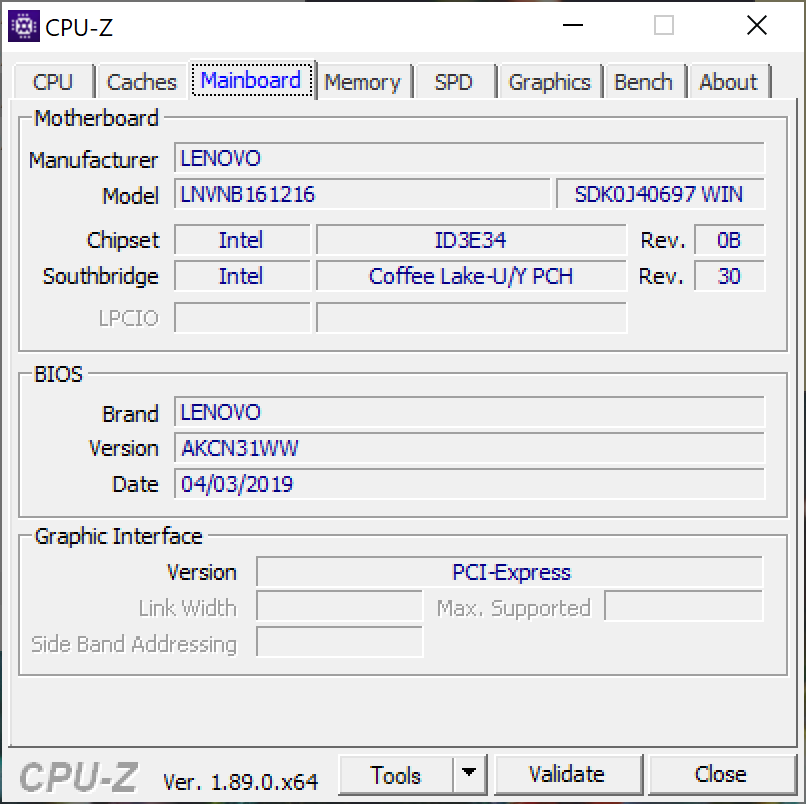
Lenovo IdeaPad S940-14IWL
- 06/27/2019 v6 (old)
Steve Schardein
Price comparison

