Schenker Technologies XMG P407 (Clevo P641HK1) 笔记本电脑简短评测
| SD Card Reader | |
| average JPG Copy Test (av. of 3 runs) | |
| Schenker XMG P406 | |
| Schenker XMG P407 | |
| MSI GL62M 7RD-077 | |
| maximum AS SSD Seq Read Test (1GB) | |
| Schenker XMG P407 | |
| Schenker XMG P406 | |
| MSI GL62M 7RD-077 | |
| Networking | |
| iperf3 transmit AX12 | |
| Razer Blade (2016) FHD | |
| Schenker XMG P407 | |
| MSI GL62M 7RD-077 (jseb) | |
| iperf3 receive AX12 | |
| Razer Blade (2016) FHD | |
| Schenker XMG P407 | |
| MSI GL62M 7RD-077 (jseb) | |
| |||||||||||||||||||||||||
Brightness Distribution: 80 %
Center on Battery: 298 cd/m²
Contrast: 1104:1 (Black: 0.27 cd/m²)
ΔE ColorChecker Calman: 4.42 | ∀{0.5-29.43 Ø4.71}
ΔE Greyscale Calman: 4.11 | ∀{0.09-98 Ø4.96}
82% sRGB (Argyll 1.6.3 3D)
54% AdobeRGB 1998 (Argyll 1.6.3 3D)
60% AdobeRGB 1998 (Argyll 3D)
82.1% sRGB (Argyll 3D)
64.5% Display P3 (Argyll 3D)
Gamma: 2.5
CCT: 6329 K
| Schenker XMG P407 LG Philips LP140WF3-SPD1 (LGD046D), 1920x1080, 14" | Schenker XMG P406 LG Philips 140WF1 (LGD040A), 1920x1080, 14" | Razer Blade (2016) FHD LG Philips LP140WF3-SPD1 (LGD046D), 1920x1080, 14" | Gigabyte P34W v5 2560x1440, 14" | MSI GL62M 7RD-077 Chi Mei N156HGE-EAL, 1920x1080, 15.6" | |
|---|---|---|---|---|---|
| Display | 2% | 1% | -13% | 31% | |
| Display P3 Coverage (%) | 64.5 | 66.2 3% | 65.2 1% | 51.4 -20% | 85.4 32% |
| sRGB Coverage (%) | 82.1 | 82.8 1% | 83.4 2% | 76.6 -7% | 100 22% |
| AdobeRGB 1998 Coverage (%) | 60 | 60.5 1% | 60.9 1% | 52.8 -12% | 83.8 40% |
| Response Times | -15% | 2% | 9% | -1% | |
| Response Time Grey 50% / Grey 80% * (ms) | 47 ? | 56 ? -19% | 47 ? -0% | 41.2 ? 12% | 44 ? 6% |
| Response Time Black / White * (ms) | 27 ? | 30 ? -11% | 26 ? 4% | 25.4 ? 6% | 29 ? -7% |
| PWM Frequency (Hz) | 198 ? | ||||
| Screen | -1% | -1% | 3% | -50% | |
| Brightness middle (cd/m²) | 298 | 282 -5% | 272 -9% | 277.8 -7% | 258 -13% |
| Brightness (cd/m²) | 282 | 266 -6% | 277 -2% | 270 -4% | 234 -17% |
| Brightness Distribution (%) | 80 | 81 1% | 84 5% | 83 4% | 79 -1% |
| Black Level * (cd/m²) | 0.27 | 0.22 19% | 0.26 4% | 0.38 -41% | 0.54 -100% |
| Contrast (:1) | 1104 | 1282 16% | 1046 -5% | 731 -34% | 478 -57% |
| Colorchecker dE 2000 * | 4.42 | 4.98 -13% | 4.59 -4% | 2.71 39% | 9.74 -120% |
| Colorchecker dE 2000 max. * | 8.57 | 10.2 -19% | 8.49 1% | 5.47 36% | 14.6 -70% |
| Greyscale dE 2000 * | 4.11 | 4.08 1% | 4.28 -4% | 2.11 49% | 11.59 -182% |
| Gamma | 2.5 88% | 2.51 88% | 2.23 99% | 2.19 100% | 2.19 100% |
| CCT | 6329 103% | 5877 111% | 6848 95% | 6314 103% | 11851 55% |
| Color Space (Percent of AdobeRGB 1998) (%) | 54 | 54 0% | 55 2% | 48.5 -10% | 76 41% |
| Color Space (Percent of sRGB) (%) | 82 | 83 1% | 83 1% | 76.9 -6% | 100 22% |
| Total Average (Program / Settings) | -5% /
-2% | 1% /
-0% | -0% /
0% | -7% /
-27% |
* ... smaller is better
Screen Flickering / PWM (Pulse-Width Modulation)
| Screen flickering / PWM not detected | 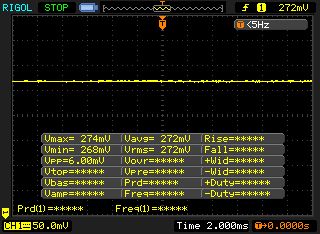 | ||
In comparison: 52 % of all tested devices do not use PWM to dim the display. If PWM was detected, an average of 7754 (minimum: 5 - maximum: 343500) Hz was measured. | |||
Display Response Times
| ↔ Response Time Black to White | ||
|---|---|---|
| 27 ms ... rise ↗ and fall ↘ combined | ↗ 5 ms rise | 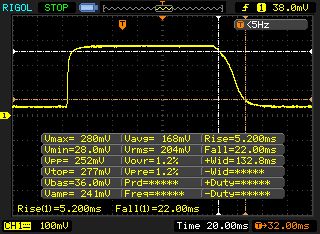 |
| ↘ 22 ms fall | ||
| The screen shows relatively slow response rates in our tests and may be too slow for gamers. In comparison, all tested devices range from 0.1 (minimum) to 240 (maximum) ms. » 67 % of all devices are better. This means that the measured response time is worse than the average of all tested devices (19.8 ms). | ||
| ↔ Response Time 50% Grey to 80% Grey | ||
| 47 ms ... rise ↗ and fall ↘ combined | ↗ 14 ms rise | 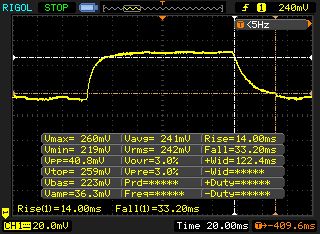 |
| ↘ 33 ms fall | ||
| The screen shows slow response rates in our tests and will be unsatisfactory for gamers. In comparison, all tested devices range from 0.165 (minimum) to 636 (maximum) ms. » 81 % of all devices are better. This means that the measured response time is worse than the average of all tested devices (31 ms). | ||
| Cinebench R15 | |
| CPU Single 64Bit | |
| Razer Blade (2016) FHD | |
| Schenker XMG P407 | |
| MSI GL62M 7RD-077 | |
| Schenker XMG P406 | |
| Gigabyte P34W v5 | |
| CPU Multi 64Bit | |
| Schenker XMG P407 | |
| MSI GL62M 7RD-077 | |
| Gigabyte P34W v5 | |
| Schenker XMG P406 | |
| Razer Blade (2016) FHD | |
| Cinebench R11.5 | |
| CPU Multi 64Bit | |
| MSI GL62M 7RD-077 | |
| Schenker XMG P407 | |
| Gigabyte P34W v5 | |
| Razer Blade (2016) FHD | |
| Schenker XMG P406 | |
| CPU Single 64Bit | |
| Razer Blade (2016) FHD | |
| Schenker XMG P407 | |
| Gigabyte P34W v5 | |
| MSI GL62M 7RD-077 | |
| Schenker XMG P406 | |
| Cinebench R10 | |
| Rendering Multiple CPUs 32Bit | |
| Schenker XMG P407 | |
| MSI GL62M 7RD-077 | |
| Razer Blade (2016) FHD | |
| Schenker XMG P406 | |
| Gigabyte P34W v5 | |
| Rendering Single 32Bit | |
| Schenker XMG P407 | |
| MSI GL62M 7RD-077 | |
| Razer Blade (2016) FHD | |
| Gigabyte P34W v5 | |
| Schenker XMG P406 | |
| Geekbench 3 | |
| 32 Bit Single-Core Score | |
| Schenker XMG P407 | |
| Razer Blade (2016) FHD | |
| MSI GL62M 7RD-077 | |
| 32 Bit Multi-Core Score | |
| Schenker XMG P407 | |
| MSI GL62M 7RD-077 | |
| Razer Blade (2016) FHD | |
| Geekbench 4.0 | |
| 64 Bit Single-Core Score | |
| Razer Blade (2016) FHD | |
| Schenker XMG P407 | |
| MSI GL62M 7RD-077 | |
| 64 Bit Multi-Core Score | |
| Schenker XMG P407 | |
| Razer Blade (2016) FHD | |
| MSI GL62M 7RD-077 | |
| JetStream 1.1 - 1.1 Total | |
| MSI GL62M 7RD-077 | |
| Razer Blade (2016) FHD | |
| Schenker XMG P407 | |
| PCMark 7 Score | 6266 points | |
| PCMark 8 Home Score Accelerated v2 | 4069 points | |
| PCMark 8 Creative Score Accelerated v2 | 5146 points | |
| PCMark 8 Work Score Accelerated v2 | 5234 points | |
Help | ||
| PCMark 8 | |
| Home Score Accelerated v2 | |
| Schenker XMG P407 | |
| Razer Blade (2016) FHD | |
| MSI GL62M 7RD-077 | |
| Gigabyte P34W v5 | |
| Schenker XMG P406 | |
| Work Score Accelerated v2 | |
| Schenker XMG P407 | |
| Schenker XMG P406 | |
| Razer Blade (2016) FHD | |
| MSI GL62M 7RD-077 | |
| Gigabyte P34W v5 | |
| PCMark 7 - Score | |
| Schenker XMG P407 | |
| Gigabyte P34W v5 | |
| Schenker XMG P406 | |
| Razer Blade (2016) FHD | |
| MSI GL62M 7RD-077 | |

| Schenker XMG P407 Samsung SM961 MZVPW256 m.2 PCI-e | Schenker XMG P406 Samsung SM951 MZHPV256HDGL m.2 PCI-e | Razer Blade (2016) FHD | Gigabyte P34W v5 Samsung SSD 950 Pro 512GB m.2 NVMe | MSI GL62M 7RD-077 HGST Travelstar 7K1000 HTS721010A9E630 | |
|---|---|---|---|---|---|
| CrystalDiskMark 3.0 | 14% | 20% | 31% | -96% | |
| Read Seq (MB/s) | 1345 | 1634 21% | 1977 47% | 2269 69% | 112.4 -92% |
| Write Seq (MB/s) | 1502 | 1290 -14% | 1668 11% | 1524 1% | 107.3 -93% |
| Read 512 (MB/s) | 320.3 | 1149 259% | 800 150% | 937 193% | 43.19 -87% |
| Write 512 (MB/s) | 1276 | 1285 1% | 1030 -19% | 1483 16% | 57 -96% |
| Read 4k (MB/s) | 58.9 | 43.82 -26% | 58.1 -1% | 53.8 -9% | 0.494 -99% |
| Write 4k (MB/s) | 171 | 110.3 -35% | 145.6 -15% | 167.3 -2% | 1.122 -99% |
| Read 4k QD32 (MB/s) | 625 | 320.5 -49% | 592 -5% | 622 0% | 1.088 -100% |
| Write 4k QD32 (MB/s) | 539 | 287.3 -47% | 508 -6% | 418.9 -22% | 1.234 -100% |
| 3DMark 06 Standard Score | 26084 points | |
| 3DMark 11 Performance | 9921 points | |
| 3DMark Ice Storm Standard Score | 83626 points | |
| 3DMark Cloud Gate Standard Score | 22393 points | |
| 3DMark Fire Strike Score | 7194 points | |
| 3DMark Fire Strike Extreme Score | 3766 points | |
| 3DMark Time Spy Score | 2659 points | |
Help | ||
| 3DMark | |
| 1280x720 Cloud Gate Standard Graphics | |
| Asus Strix GL502VM-FY039T | |
| Razer Blade (2016) FHD | |
| Schenker XMG P407 | |
| Schenker XMG P406 | |
| Gigabyte P34W v5 | |
| Dell Inspiron 15 7000 7567 | |
| MSI GL62M 7RD-077 | |
| 1920x1080 Fire Strike Graphics | |
| Asus Strix GL502VM-FY039T | |
| Razer Blade (2016) FHD | |
| Schenker XMG P407 | |
| Dell Inspiron 15 7000 7567 | |
| Gigabyte P34W v5 | |
| Schenker XMG P406 | |
| MSI GL62M 7RD-077 | |
| 3DMark 11 - 1280x720 Performance GPU | |
| Asus Strix GL502VM-FY039T | |
| Razer Blade (2016) FHD | |
| Schenker XMG P407 | |
| Dell Inspiron 15 7000 7567 | |
| Gigabyte P34W v5 | |
| Schenker XMG P406 | |
| MSI GL62M 7RD-077 | |
| low | med. | high | ultra | |
|---|---|---|---|---|
| Tomb Raider (2013) | 360.1 | 258.1 | 199.2 | 98.9 |
| BioShock Infinite (2013) | 168.9 | 159.2 | 152.2 | 76.4 |
| Battlefield 4 (2013) | 178.6 | 174.9 | 145.7 | 71 |
| Ashes of the Singularity (2016) | 63.2 | 45.6 | 40.4 | |
| Deus Ex Mankind Divided (2016) | 99 | 74.7 | 39.8 | 20.3 |
| Battlefield 1 (2016) | 142.1 | 122.1 | 62.4 | 56.3 |
| Civilization 6 (2016) | 70.2 | 50.1 | 41.8 | 42.4 |
| Titanfall 2 (2016) | 143.7 | 136.5 | 68.5 | 58.6 |
| BioShock Infinite - 1920x1080 Ultra Preset, DX11 (DDOF) | |
| Asus Strix GL502VM-FY039T | |
| Razer Blade (2016) FHD | |
| Schenker XMG P407 | |
| Dell Inspiron 15 7000 7567 | |
| Gigabyte P34W v5 | |
| MSI GL62M 7RD-077 | |
| Tomb Raider - 1920x1080 Ultra Preset AA:FX AF:16x | |
| Asus Strix GL502VM-FY039T | |
| Razer Blade (2016) FHD | |
| Schenker XMG P407 | |
| Gigabyte P34W v5 | |
| MSI GL62M 7RD-077 | |
| Battlefield 4 - 1920x1080 Ultra Preset AA:4x MS | |
| Asus Strix GL502VM-FY039T | |
| Razer Blade (2016) FHD | |
| Schenker XMG P407 | |
| Schenker XMG P406 | |
| MSI GL62M 7RD-077 | |
| Battlefield 1 - 1920x1080 Ultra Preset AA:T | |
| Schenker XMG P407 | |
| Dell Inspiron 15 7000 7567 | |
| MSI GL62M 7RD-077 | |
| Ashes of the Singularity - 1920x1080 high | |
| Asus Strix GL502VM-FY039T | |
| Razer Blade (2016) FHD | |
| Schenker XMG P407 | |
| MSI GL62M 7RD-077 | |
| Titanfall 2 - 1920x1080 Very High (Insane Texture Quality) / Enabled AA:TS AF:16x | |
| Asus Strix GL502VM-FY039T | |
| Dell Inspiron 15 7000 7567 | |
| Schenker XMG P407 | |
| MSI GL62M 7RD-077 | |
| Civilization 6 - 1920x1080 Ultra Preset AA:4xMS | |
| Schenker XMG P407 | |
| MSI GL62M 7RD-077 | |
| Deus Ex Mankind Divided - 1920x1080 High Preset AF:4x | |
| Razer Blade (2016) FHD | |
| Schenker XMG P407 | |
| MSI GL62M 7RD-077 | |
Noise level
| Idle |
| 31 / 32 / 36 dB(A) |
| HDD |
| 32 dB(A) |
| Load |
| 43 / 48 dB(A) |
 | ||
30 dB silent 40 dB(A) audible 50 dB(A) loud |
||
min: | ||
| Schenker XMG P407 i7-7700HQ, GeForce GTX 1050 Ti Mobile | Schenker XMG P406 6700HQ, GeForce GTX 970M | Razer Blade (2016) FHD 6700HQ, GeForce GTX 1060 Mobile | Gigabyte P34W v5 6700HQ, GeForce GTX 970M | MSI GL62M 7RD-077 i7-7700HQ, GeForce GTX 1050 Mobile | |
|---|---|---|---|---|---|
| Noise | -5% | -9% | -2% | 1% | |
| off / environment * (dB) | 29 | 31 -7% | 30.6 -6% | ||
| Idle Minimum * (dB) | 31 | 30 3% | 35 -13% | 31.6 -2% | 32.5 -5% |
| Idle Average * (dB) | 32 | 32 -0% | 36 -13% | 31.6 1% | 32.5 -2% |
| Idle Maximum * (dB) | 36 | 40 -11% | 37 -3% | 32.5 10% | 32.5 10% |
| Load Average * (dB) | 43 | 47 -9% | 43 -0% | 46.5 -8% | 36.4 15% |
| Load Maximum * (dB) | 48 | 51 -6% | 57 -19% | 52.5 -9% | 52.4 -9% |
* ... smaller is better
(-) The maximum temperature on the upper side is 49 °C / 120 F, compared to the average of 40.4 °C / 105 F, ranging from 21.2 to 68.8 °C for the class Gaming.
(-) The bottom heats up to a maximum of 50.8 °C / 123 F, compared to the average of 43.2 °C / 110 F
(+) In idle usage, the average temperature for the upper side is 23.5 °C / 74 F, compared to the device average of 33.9 °C / 93 F.
(±) The palmrests and touchpad can get very hot to the touch with a maximum of 36.4 °C / 97.5 F.
(-) The average temperature of the palmrest area of similar devices was 28.8 °C / 83.8 F (-7.6 °C / -13.7 F).
| Schenker XMG P407 i7-7700HQ, GeForce GTX 1050 Ti Mobile | Schenker XMG P406 6700HQ, GeForce GTX 970M | Razer Blade (2016) FHD 6700HQ, GeForce GTX 1060 Mobile | Gigabyte P34W v5 6700HQ, GeForce GTX 970M | MSI GL62M 7RD-077 i7-7700HQ, GeForce GTX 1050 Mobile | |
|---|---|---|---|---|---|
| Heat | -35% | -6% | -18% | 2% | |
| Maximum Upper Side * (°C) | 49 | 55 -12% | 54 -10% | 59.3 -21% | 44.9 8% |
| Maximum Bottom * (°C) | 50.8 | 58.7 -16% | 49.4 3% | 56.5 -11% | 38.2 25% |
| Idle Upper Side * (°C) | 26.3 | 36.9 -40% | 28 -6% | 27.8 -6% | 27.4 -4% |
| Idle Bottom * (°C) | 24.1 | 41.7 -73% | 26.8 -11% | 31.8 -32% | 29 -20% |
* ... smaller is better
Speakers
Schenker XMG P407 audio analysis
(±) | speaker loudness is average but good (78 dB)
Bass 100 - 315 Hz
(-) | nearly no bass - on average 19.2% lower than median
(±) | linearity of bass is average (11% delta to prev. frequency)
Mids 400 - 2000 Hz
(+) | balanced mids - only 4.4% away from median
(±) | linearity of mids is average (9.6% delta to prev. frequency)
Highs 2 - 16 kHz
(+) | balanced highs - only 3.7% away from median
(+) | highs are linear (5.5% delta to prev. frequency)
Overall 100 - 16.000 Hz
(±) | linearity of overall sound is average (20.5% difference to median)
Compared to same class
» 73% of all tested devices in this class were better, 5% similar, 22% worse
» The best had a delta of 6%, average was 18%, worst was 132%
Compared to all devices tested
» 54% of all tested devices were better, 8% similar, 38% worse
» The best had a delta of 4%, average was 23%, worst was 134%
Razer Blade (2016) FHD audio analysis
(±) | speaker loudness is average but good (79 dB)
Bass 100 - 315 Hz
(±) | reduced bass - on average 10.6% lower than median
(±) | linearity of bass is average (12.4% delta to prev. frequency)
Mids 400 - 2000 Hz
(+) | balanced mids - only 4.3% away from median
(+) | mids are linear (3.9% delta to prev. frequency)
Highs 2 - 16 kHz
(+) | balanced highs - only 3.4% away from median
(+) | highs are linear (5.7% delta to prev. frequency)
Overall 100 - 16.000 Hz
(±) | linearity of overall sound is average (17.3% difference to median)
Compared to same class
» 47% of all tested devices in this class were better, 12% similar, 41% worse
» The best had a delta of 6%, average was 18%, worst was 132%
Compared to all devices tested
» 33% of all tested devices were better, 8% similar, 59% worse
» The best had a delta of 4%, average was 23%, worst was 134%
| Off / Standby | |
| Idle | |
| Load |
|
Key:
min: | |
| Schenker XMG P407 i7-7700HQ, GeForce GTX 1050 Ti Mobile | Schenker XMG P406 6700HQ, GeForce GTX 970M | Razer Blade (2016) FHD 6700HQ, GeForce GTX 1060 Mobile | MSI GL62M 7RD-077 i7-7700HQ, GeForce GTX 1050 Mobile | |
|---|---|---|---|---|
| Power Consumption | -13% | -10% | 3% | |
| Idle Minimum * (Watt) | 10 | 12 -20% | 14 -40% | 10.6 -6% |
| Idle Average * (Watt) | 15 | 16 -7% | 18 -20% | 14.5 3% |
| Idle Maximum * (Watt) | 24 | 22 8% | 21 12% | 15 37% |
| Load Average * (Watt) | 82 | 90 -10% | 70 15% | 90 -10% |
| Load Maximum * (Watt) | 124 | 170 -37% | 146 -18% | 135 -9% |
* ... smaller is better
| Schenker XMG P407 i7-7700HQ, GeForce GTX 1050 Ti Mobile, 45 Wh | Schenker XMG P406 6700HQ, GeForce GTX 970M, 45 Wh | Razer Blade (2016) FHD 6700HQ, GeForce GTX 1060 Mobile, 70 Wh | Gigabyte P34W v5 6700HQ, GeForce GTX 970M, 61 Wh | MSI GL62M 7RD-077 i7-7700HQ, GeForce GTX 1050 Mobile, 41 Wh | |
|---|---|---|---|---|---|
| Battery runtime | -25% | 40% | -20% | -18% | |
| Reader / Idle (h) | 7.4 | 4.6 -38% | 12.7 72% | 6.5 -12% | 6.5 -12% |
| H.264 (h) | 3.6 | 5.2 44% | 3.6 0% | ||
| WiFi v1.3 (h) | 4 | 3.3 -17% | 7.1 78% | 3.9 -2% | 3.8 -5% |
| Load (h) | 1.5 | 1.2 -20% | 1 -33% | 0.8 -47% | 0.7 -53% |
Pros
Cons
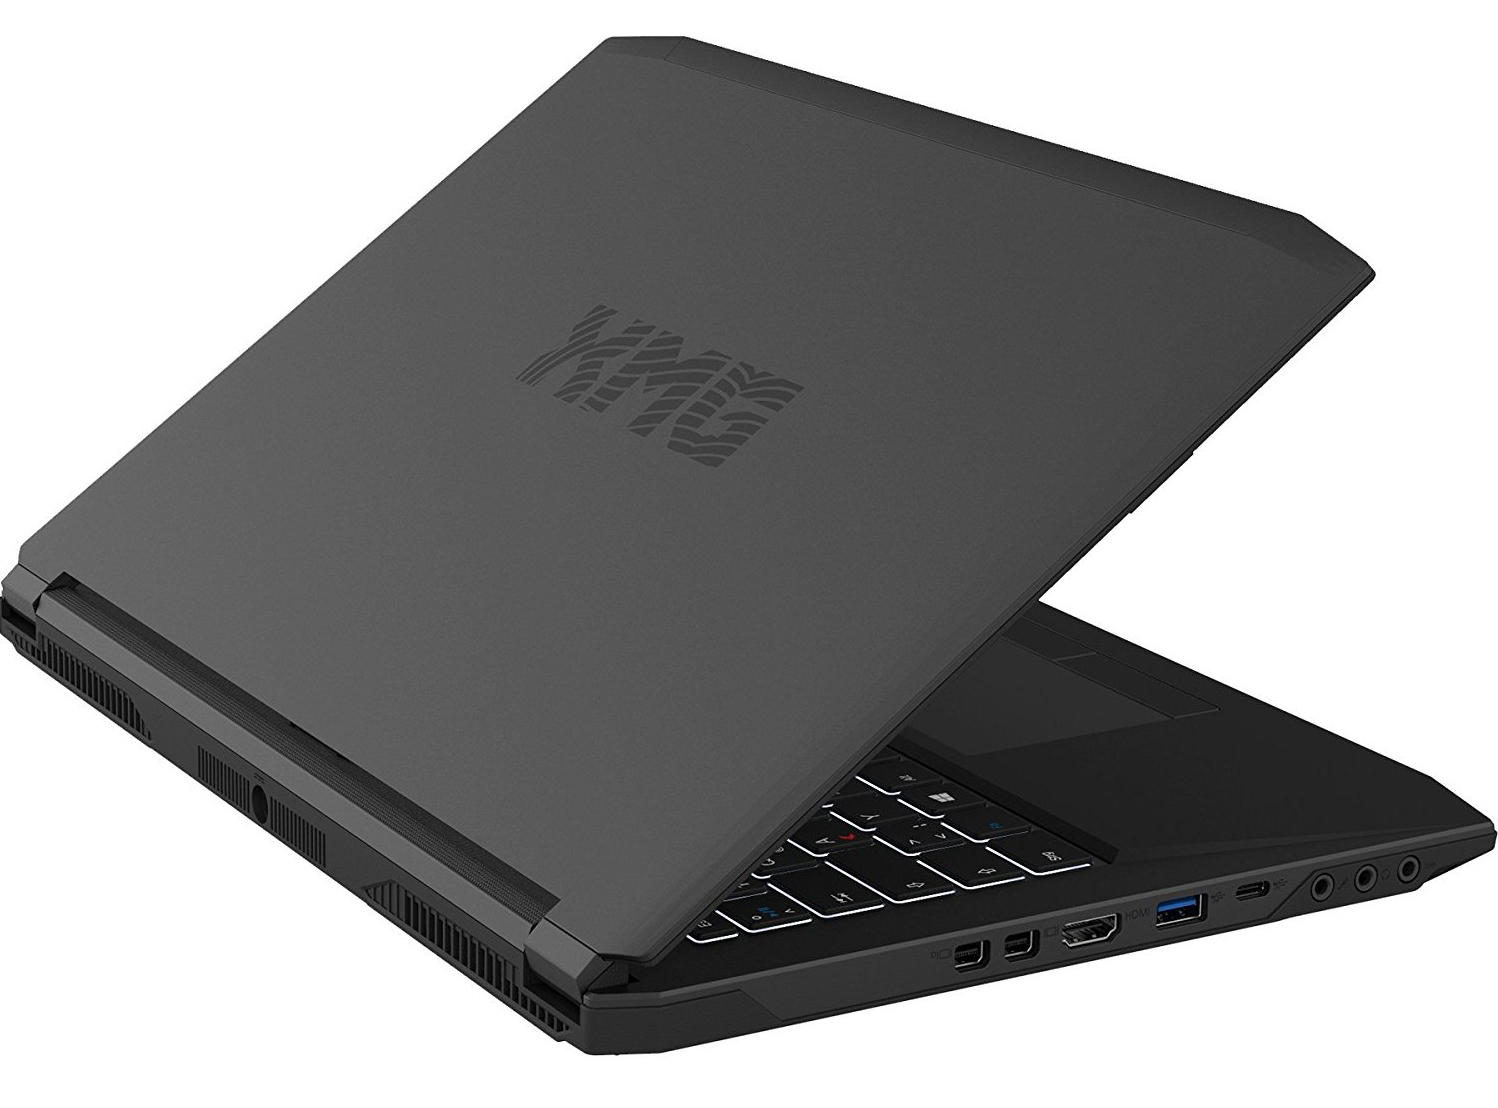
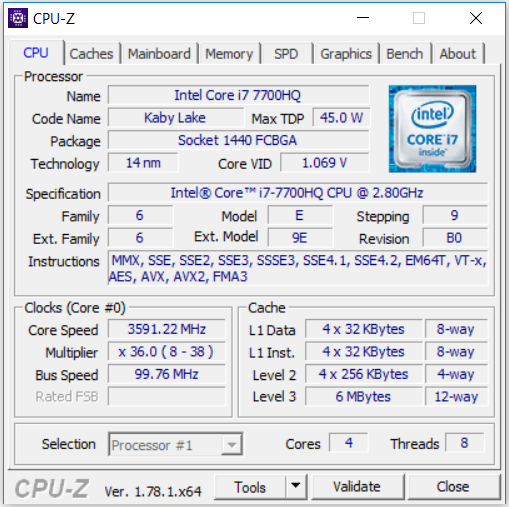
在外观上,XMG P407与其前代没有什么不同。这就是为什么我们重点关注它的内部新特征。新的Kaby Lake处理器带来了细微的性能提升。新的处理器对电池的续航也带来了正面的影响。GeForce GTX 1050 Ti集成显卡处于Nvidia阵营的的中上流,但与上一代的许多顶级产品相比,它却具有更高的性能。换句话说:XMG P406的集成显卡GeForce GTX 970M在3DMark基准测试和现实世界游戏中方面失分。
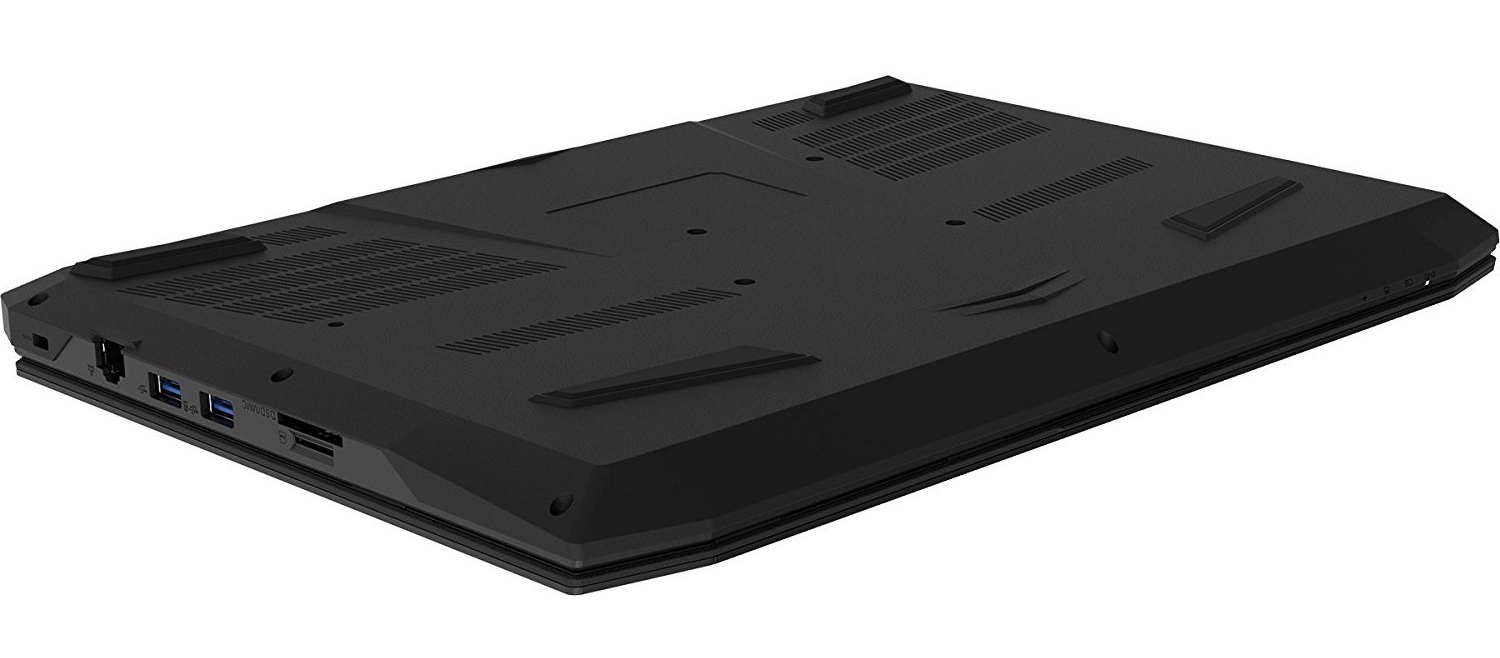
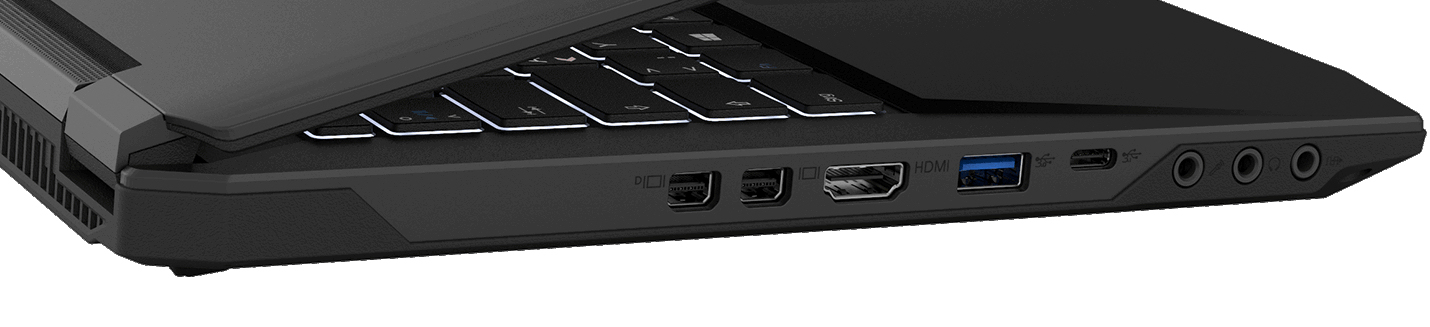
负载下的发热情况可以说是适中的:XMG P407不像其前代那样烫手。P406与P407在系统噪声方面的差异很小。 然而,我们注意到一些改进:P406中的处理器风扇容易突然加速运转,非常显眼。但P407显然不存在这种情况。 该机的接口得到了进一步更新:四个USB 3.1 Type-A 第一代接口中的一个升级成了USB 3.1 Type-C 第二代接口。此外,两个迷你视频接口中的一个也符合了1.4标准。
凭借XMG P407,Schenker提供了一个14英寸的全能型的游戏本。
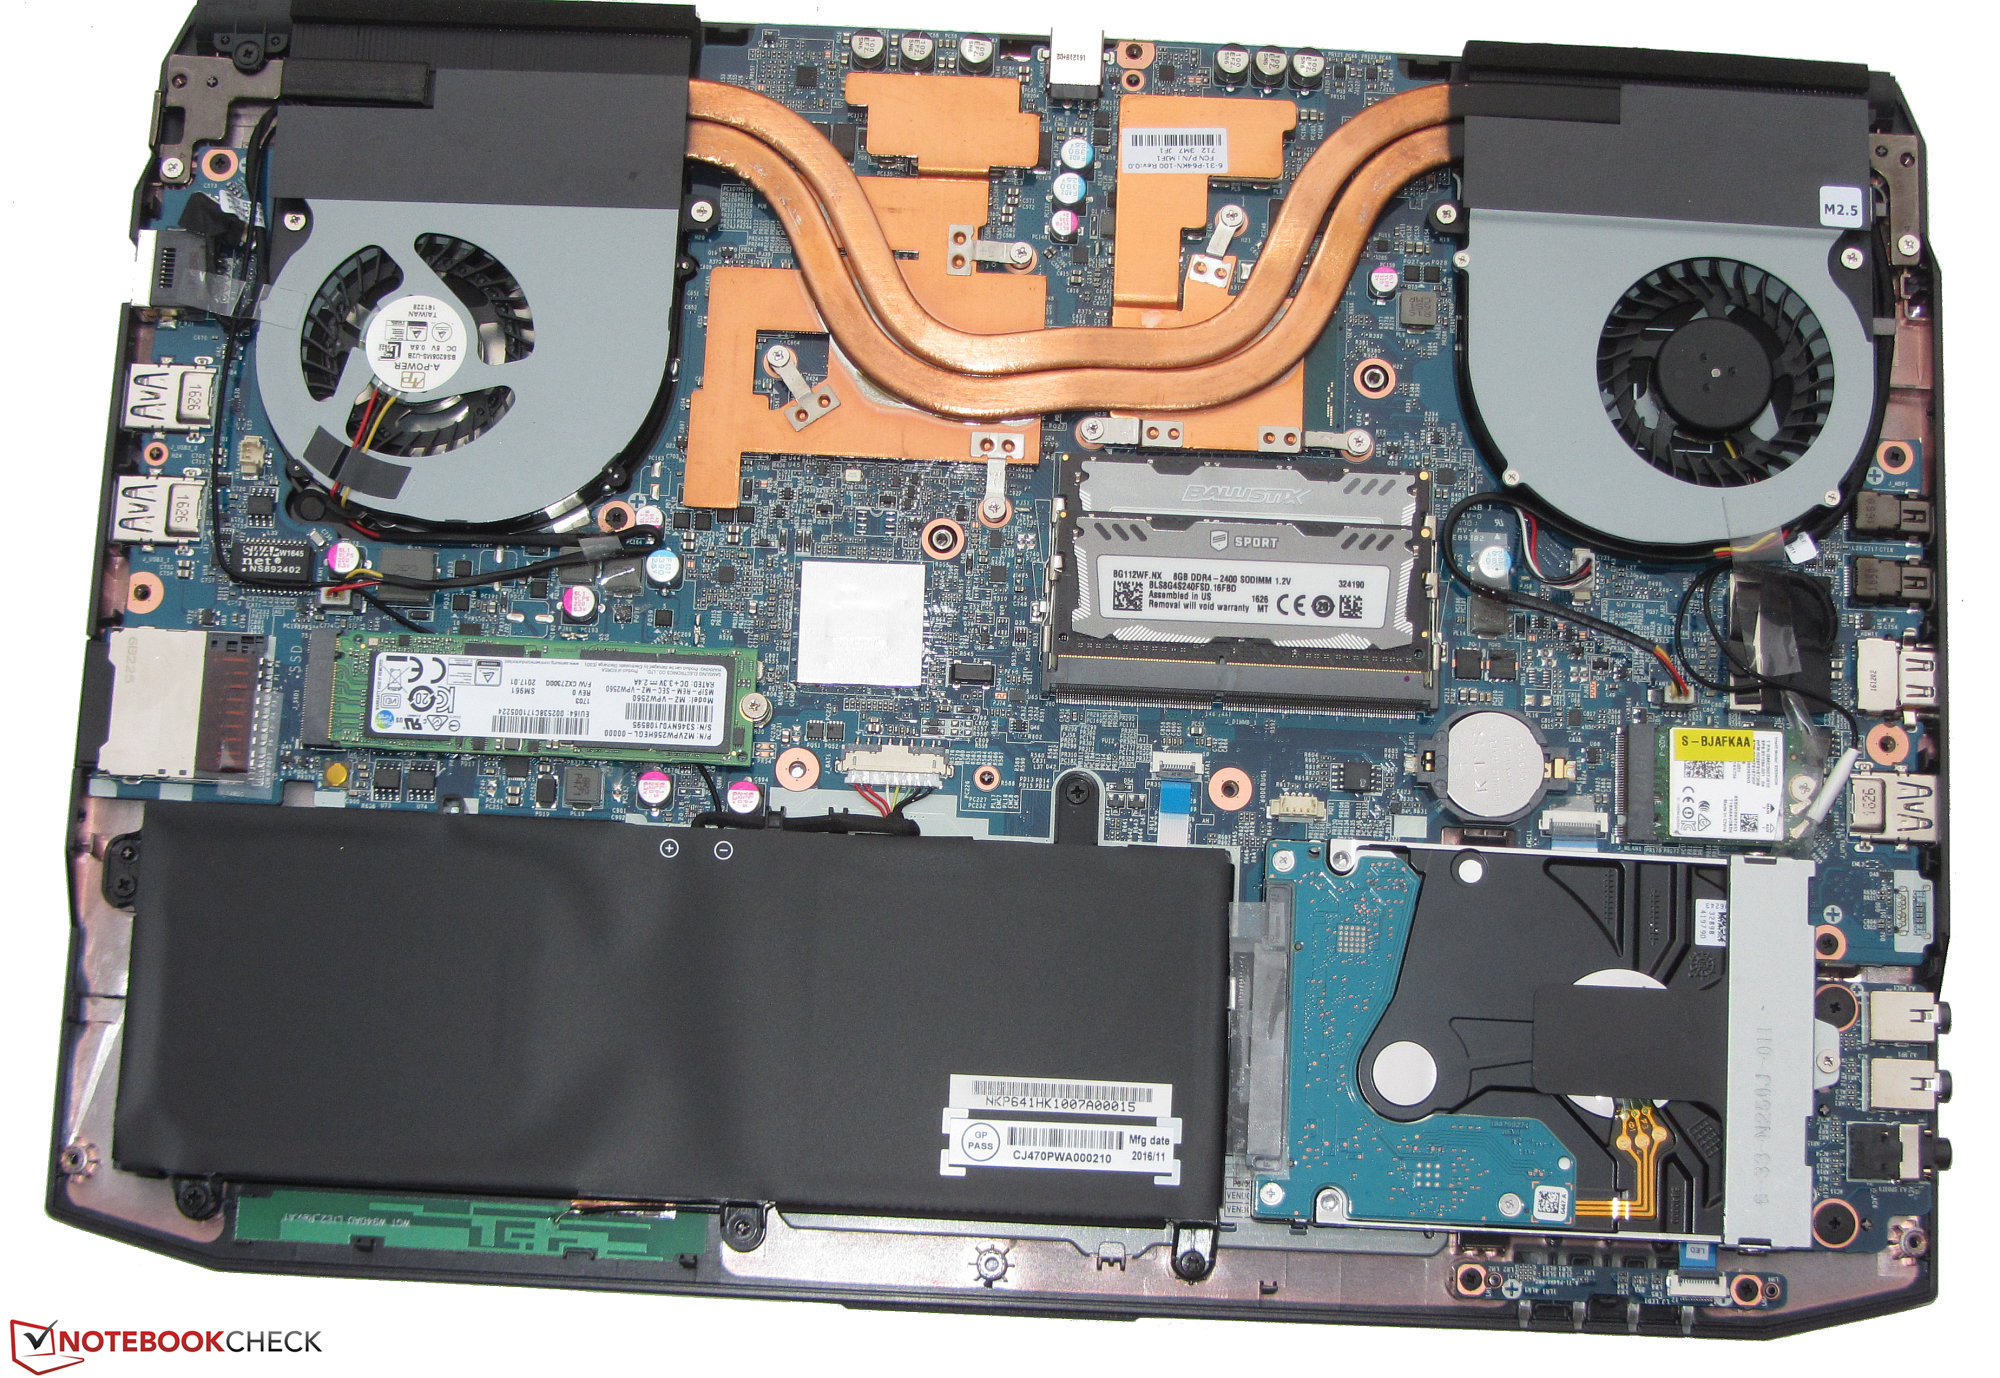
高速NVMe固态硬盘确保了系统的快速运行。所需的存储空间由2.5英寸硬盘驱动器提供。两个驱动器都可以被更换,而且用户可以毫不费力地拆开机器的底板 。该机配备了优秀的的键盘;哑光IPS显示屏具有令人愉快的视角和良好的对比度。然而,屏幕的亮度可以更高。内置显示屏的切换时间仅比XMG P406稍好。
注:本文是基于完整评测的缩减版本,阅读完整的英文评测,请点击这里。
Schenker Technologies XMG P407 (Clevo P641HK1) Notebook Review
Schenker XMG P407
- 03/06/2017 v6 (old)
Sascha Mölck