驰为AeroBook (2019) 笔记本电脑评测:一台众筹出来的笔记本
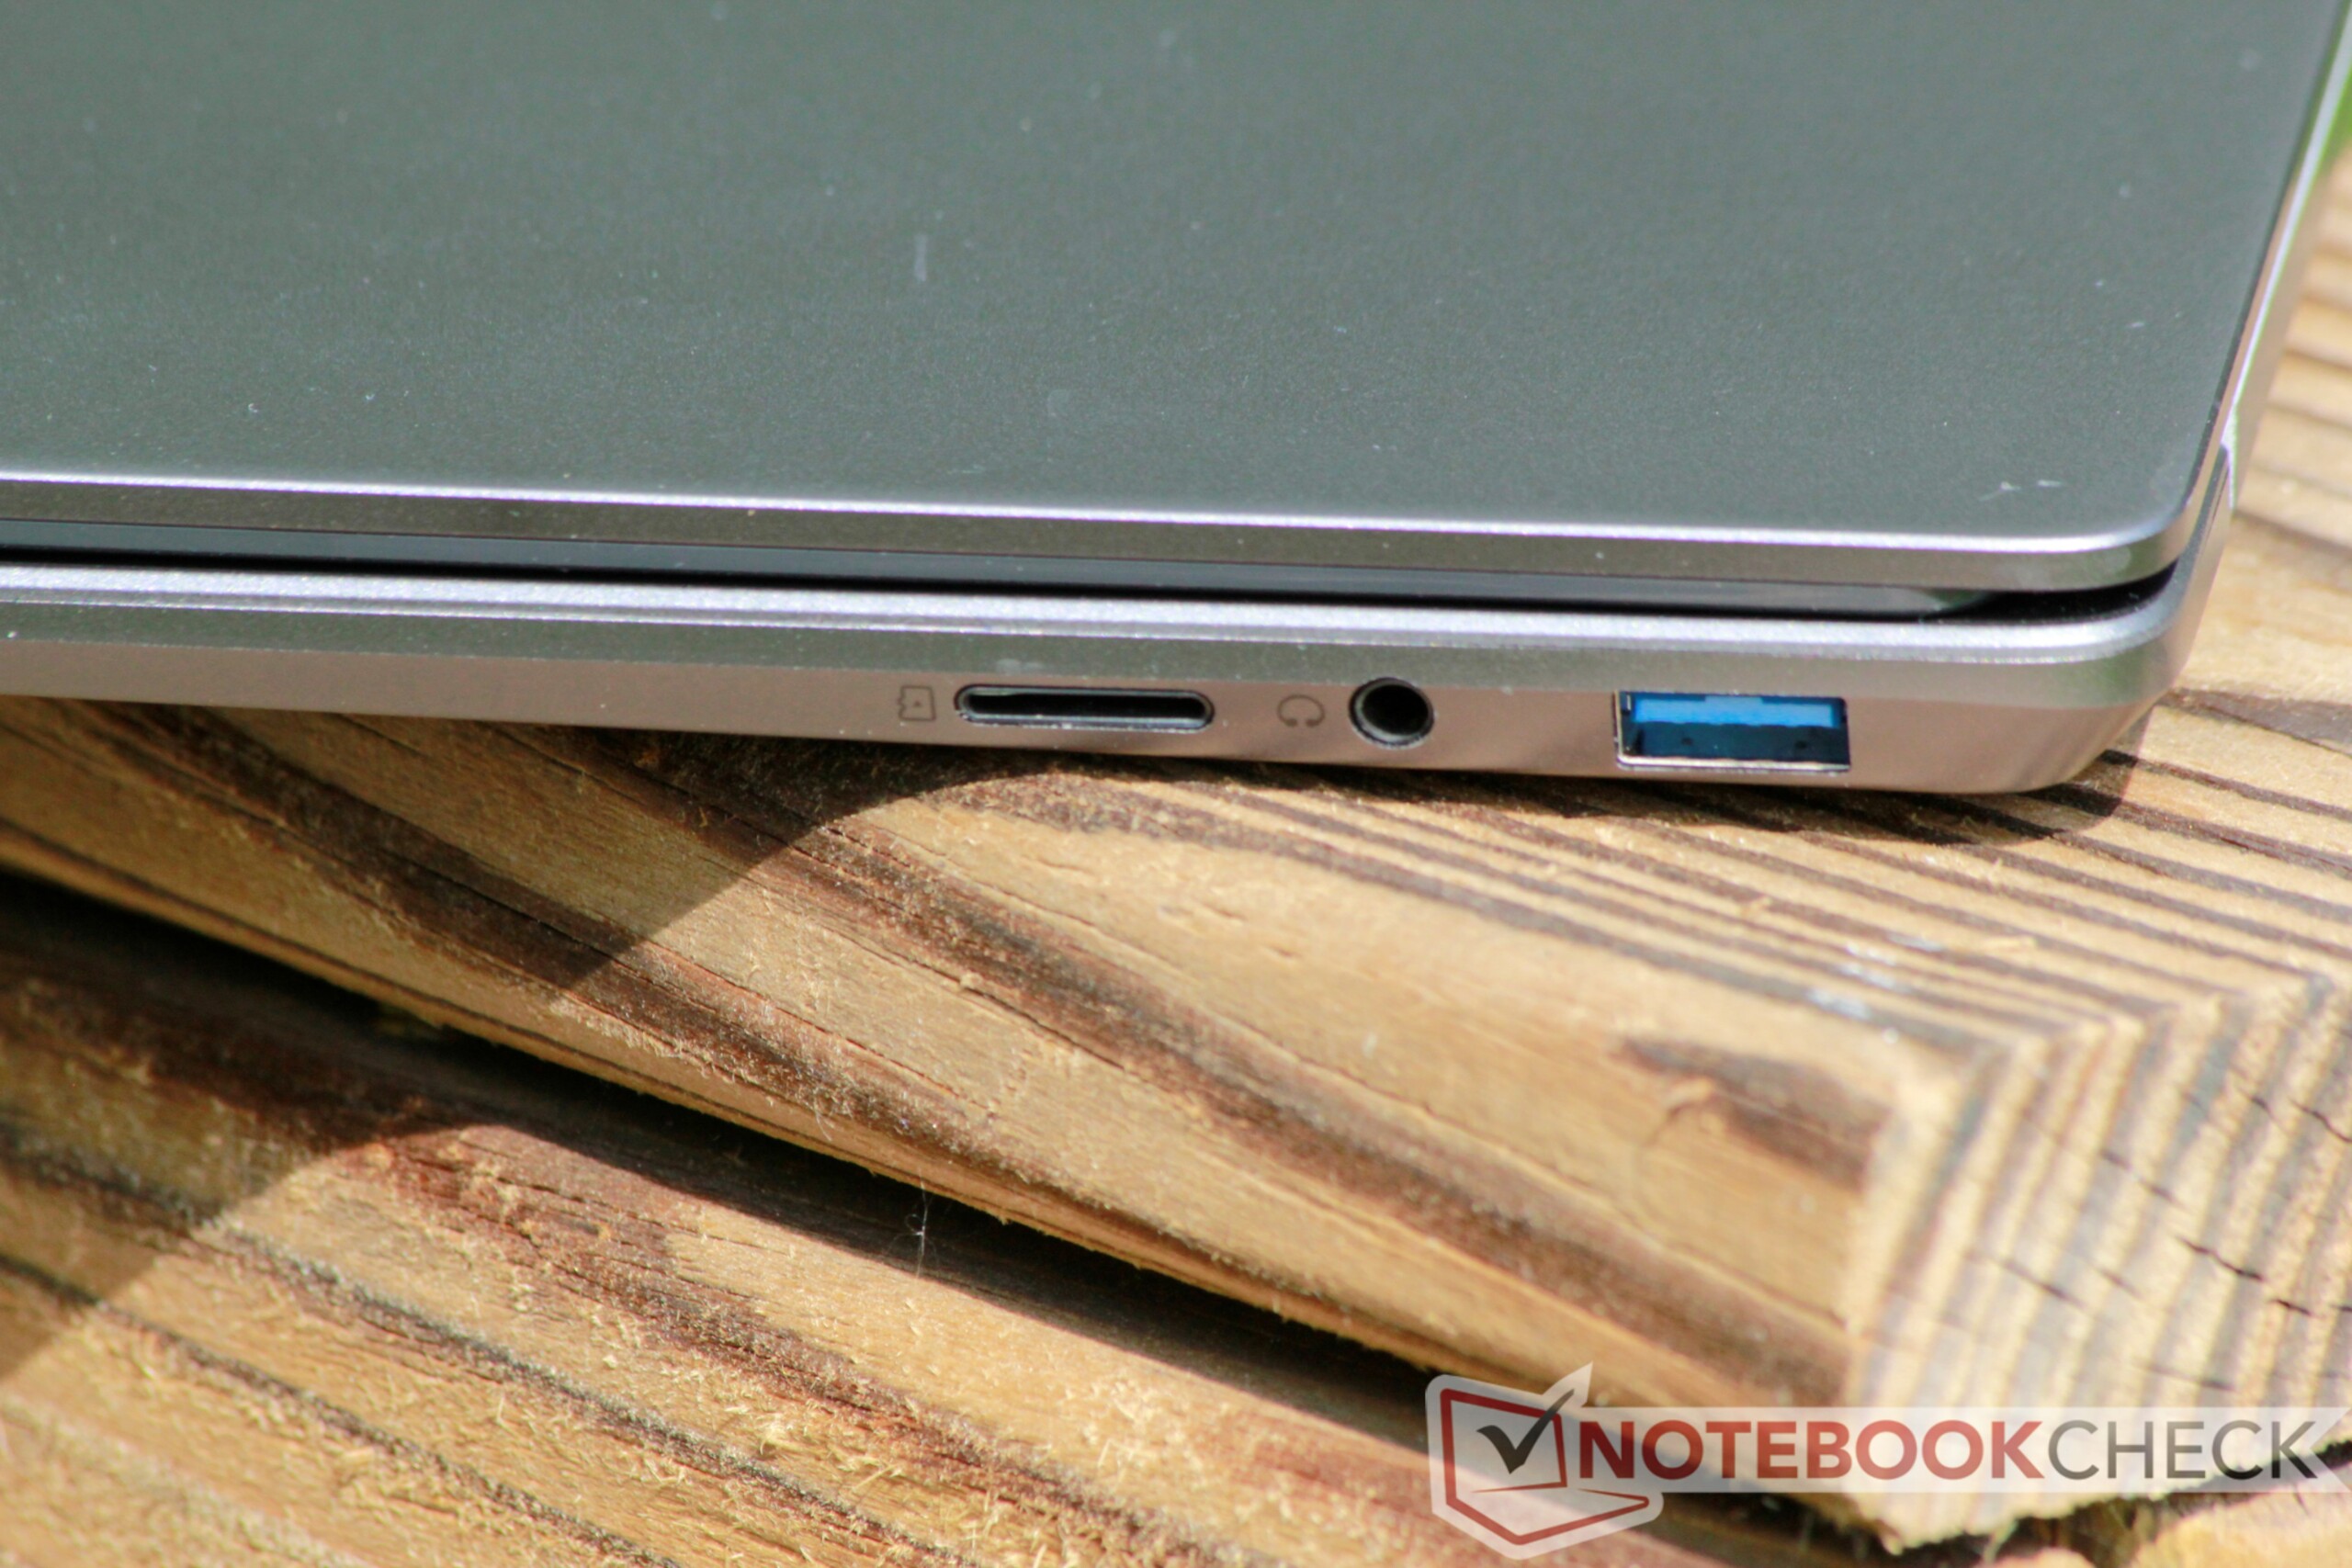
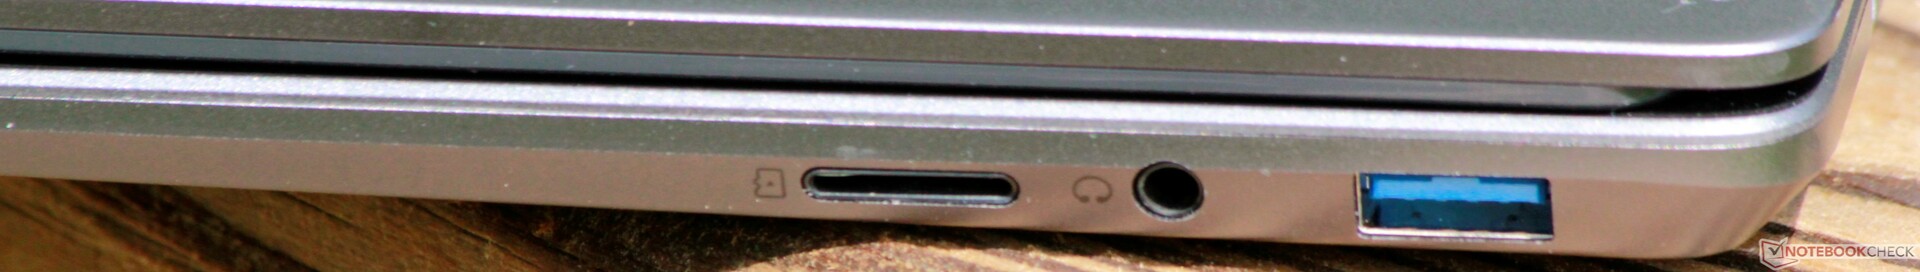
| SD Card Reader | |
| average JPG Copy Test (av. of 3 runs) | |
| Dell XPS 13 9380 2019 (Toshiba Exceria Pro SDXC 64 GB UHS-II) | |
| Average of class Subnotebook (23.7 - 188, n=9, last 2 years) | |
| Lenovo IdeaPad 330S-15IKB-81F500N5GE (Toshiba Exceria Pro SDXC 64 GB UHS-II) | |
| Chuwi LapBook SE | |
| Chuwi AeroBook 13 inch 2019 (Toshiba Exceria Pro UHS-II SDXC) | |
| maximum AS SSD Seq Read Test (1GB) | |
| Dell XPS 13 9380 2019 (Toshiba Exceria Pro SDXC 64 GB UHS-II) | |
| Average of class Subnotebook (24.9 - 195, n=8, last 2 years) | |
| Asus E203MA-FD825TS (Toshiba Exceria Pro M501 microSDXC 64GB) | |
| Chuwi LapBook SE | |
| Chuwi AeroBook 13 inch 2019 (Toshiba Exceria Pro UHS-II SDXC) | |
| |||||||||||||||||||||||||
Brightness Distribution: 90 %
Center on Battery: 307.6 cd/m²
Contrast: 905:1 (Black: 0.34 cd/m²)
ΔE ColorChecker Calman: 7.31 | ∀{0.5-29.43 Ø4.73}
calibrated: 3.94
ΔE Greyscale Calman: 6.8 | ∀{0.09-98 Ø4.97}
87% sRGB (Argyll 1.6.3 3D)
57% AdobeRGB 1998 (Argyll 1.6.3 3D)
64.1% AdobeRGB 1998 (Argyll 3D)
87.6% sRGB (Argyll 3D)
67.3% Display P3 (Argyll 3D)
Gamma: 1.909
CCT: 7695 K
| Chuwi AeroBook 13 inch 2019 BOE BOE0719, IPS, 13.3", 1920x1080 | Apple MacBook Air 2018 APPA039, IPS, 13.3", 2560x1600 | Asus E203MA-FD825TS AUO225C, TN LED, 11.6", 1366x768 | Lenovo IdeaPad 330S-15IKB-81F500N5GE BOE0700, IPS, 15.6", 1920x1080 | Apple MacBook 12 2017 APPA027, LED IPS, 12", 2304x1440 | Chuwi LapBook SE 13.3", 1920x1080 | Dell XPS 13 9380 2019 ID: AUO 282B B133ZAN Dell: 90NTH, IPS, 13.3", 3840x2160 | |
|---|---|---|---|---|---|---|---|
| Display | 7% | -43% | -37% | 3% | 1% | ||
| Display P3 Coverage (%) | 67.3 | 67.8 1% | 35.75 -47% | 39.85 -41% | 65 -3% | 64.7 -4% | |
| sRGB Coverage (%) | 87.6 | 96.1 10% | 53.8 -39% | 58.8 -33% | 94.8 8% | 93.1 6% | |
| AdobeRGB 1998 Coverage (%) | 64.1 | 69.8 9% | 36.94 -42% | 41.17 -36% | 66.5 4% | 65.3 2% | |
| Response Times | -8% | 22% | -20% | -12% | -7% | -50% | |
| Response Time Grey 50% / Grey 80% * (ms) | 34 ? | 39.6 ? -16% | 41 ? -21% | 44 ? -29% | 40.8 ? -20% | 39.2 ? -15% | 58 ? -71% |
| Response Time Black / White * (ms) | 28 ? | 28 ? -0% | 10 ? 64% | 31 ? -11% | 29.2 ? -4% | 27.7 ? 1% | 36 ? -29% |
| PWM Frequency (Hz) | 2000 ? | 113600 ? | 86000 ? | 116000 | 200 ? | ||
| Screen | 37% | -36% | -8% | -9% | 23% | ||
| Brightness middle (cd/m²) | 307.6 | 320 4% | 235 -24% | 283 -8% | 227 -26% | 404 31% | |
| Brightness (cd/m²) | 295 | 315 7% | 227 -23% | 252 -15% | 210 -29% | 389 32% | |
| Brightness Distribution (%) | 90 | 95 6% | 93 3% | 75 -17% | 89 -1% | 85 -6% | |
| Black Level * (cd/m²) | 0.34 | 0.29 15% | 0.44 -29% | 0.63 -85% | 0.44 -29% | 0.37 -9% | |
| Contrast (:1) | 905 | 1103 22% | 534 -41% | 449 -50% | 516 -43% | 1092 21% | |
| Colorchecker dE 2000 * | 7.31 | 1.2 84% | 11.73 -60% | 4.02 45% | 6.6 10% | 3.72 49% | |
| Colorchecker dE 2000 max. * | 11.92 | 3.2 73% | 18.8 -58% | 8.77 26% | 12.2 -2% | 7.38 38% | |
| Colorchecker dE 2000 calibrated * | 3.94 | 0.5 87% | 3.73 5% | 4.03 -2% | 1.9 52% | 2.06 48% | |
| Greyscale dE 2000 * | 6.8 | 0.8 88% | 12.64 -86% | 0.8 88% | 7.9 -16% | 4.44 35% | |
| Gamma | 1.909 115% | 2.2 100% | 2.61 84% | 2.35 94% | 2.16 102% | 2.34 94% | |
| CCT | 7695 84% | 6548 99% | 14819 44% | 6552 99% | 8879 73% | 7095 92% | |
| Color Space (Percent of AdobeRGB 1998) (%) | 57 | 62.1 9% | 34 -40% | 38 -33% | 60 5% | ||
| Color Space (Percent of sRGB) (%) | 87 | 96 10% | 54 -38% | 58 -33% | 93 7% | ||
| Total Average (Program / Settings) | 12% /
26% | -19% /
-30% | -22% /
-15% | -12% /
-12% | -4% /
-6% | -9% /
10% |
* ... smaller is better
Display Response Times
| ↔ Response Time Black to White | ||
|---|---|---|
| 28 ms ... rise ↗ and fall ↘ combined | ↗ 14.8 ms rise | 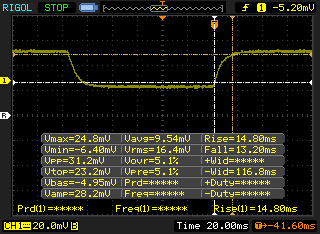 |
| ↘ 13.2 ms fall | ||
| The screen shows relatively slow response rates in our tests and may be too slow for gamers. In comparison, all tested devices range from 0.1 (minimum) to 240 (maximum) ms. » 71 % of all devices are better. This means that the measured response time is worse than the average of all tested devices (19.9 ms). | ||
| ↔ Response Time 50% Grey to 80% Grey | ||
| 34 ms ... rise ↗ and fall ↘ combined | ↗ 15.2 ms rise | 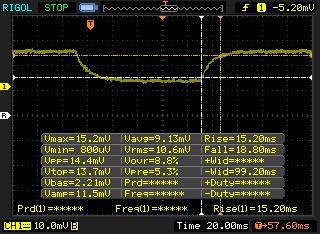 |
| ↘ 18.8 ms fall | ||
| The screen shows slow response rates in our tests and will be unsatisfactory for gamers. In comparison, all tested devices range from 0.165 (minimum) to 636 (maximum) ms. » 47 % of all devices are better. This means that the measured response time is similar to the average of all tested devices (31.1 ms). | ||
Screen Flickering / PWM (Pulse-Width Modulation)
| Screen flickering / PWM detected | 2000 Hz | ≤ 99 % brightness setting | 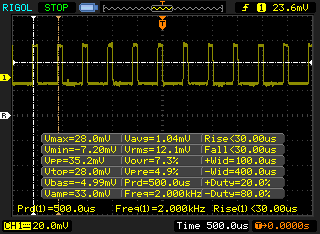 |
The display backlight flickers at 2000 Hz (worst case, e.g., utilizing PWM) Flickering detected at a brightness setting of 99 % and below. There should be no flickering or PWM above this brightness setting. The frequency of 2000 Hz is quite high, so most users sensitive to PWM should not notice any flickering. In comparison: 52 % of all tested devices do not use PWM to dim the display. If PWM was detected, an average of 7798 (minimum: 5 - maximum: 343500) Hz was measured. | |||
| Cinebench R11.5 | |
| CPU Single 64Bit | |
| Average of class Subnotebook (1.89 - 3.71, n=13, last 2 years) | |
| Average Intel Core m3-6Y30 (0.81 - 1.04, n=6) | |
| Chuwi LapBook SE | |
| CPU Multi 64Bit | |
| Average of class Subnotebook (14.8 - 36, n=13, last 2 years) | |
| Average Intel Core m3-6Y30 (1.79 - 2.4, n=6) | |
| Chuwi LapBook SE | |
| Cinebench R10 | |
| Rendering Multiple CPUs 32Bit | |
| Average of class Subnotebook (14395 - 51868, n=13, last 2 years) | |
| Average Intel Core m3-6Y30 (6194 - 7355, n=4) | |
| Chuwi LapBook SE | |
| Rendering Single 32Bit | |
| Average of class Subnotebook (2299 - 10697, n=13, last 2 years) | |
| Average Intel Core m3-6Y30 (3286 - 3477, n=4) | |
| Chuwi LapBook SE | |
| wPrime 2.10 - 1024m | |
| Average Intel Core m3-6Y30 (788 - 864, n=3) | |
| Chuwi LapBook SE | |
| Average of class Subnotebook (145.3 - 1250, n=9, last 2 years) | |
* ... smaller is better
| PCMark 8 Home Score Accelerated v2 | 2650 points | |
| PCMark 8 Work Score Accelerated v2 | 3735 points | |
| PCMark 10 Score | 2138 points | |
Help | ||
| Chuwi AeroBook 13 inch 2019 Netac SSD 256GB | Apple MacBook Air 2018 Apple SSD AP0256 | Apple MacBook 12 2017 Apple SSD AP0256 | Asus E203MA-FD825TS SanDisk DA4064 | Lenovo IdeaPad 330S-15IKB-81F500N5GE | Chuwi LapBook SE SanDisk DF4032 | Dell XPS 13 9380 2019 SK hynix PC401 HFS256GD9TNG | Average Netac SSD 256GB | |
|---|---|---|---|---|---|---|---|---|
| CrystalDiskMark 5.2 / 6 | 113% | 99% | -59% | 19% | -78% | 99% | -7% | |
| Write 4K (MB/s) | 81.8 | 118 44% | 95.7 17% | 38.28 -53% | 11.17 -86% | 84.6 3% | 86 ? 5% | |
| Read 4K (MB/s) | 33.97 | 29.97 -12% | 22.8 -33% | 12.14 -64% | 7.2 -79% | 38.52 13% | 23.2 ? -32% | |
| Write Seq (MB/s) | 422.4 | 1000 137% | 867 105% | 220.2 -48% | 158.1 -63% | 87.7 -79% | 557 32% | 364 ? -14% |
| Read Seq (MB/s) | 502 | 1218 143% | 940 87% | 262 -48% | 892 78% | 247 -51% | 1393 177% | 432 ? -14% |
| Write 4K Q32T1 (MB/s) | 152.9 | 232.1 52% | 342 124% | 45.72 -70% | 162.2 6% | 12.29 -92% | 339.5 122% | 188.9 ? 24% |
| Read 4K Q32T1 (MB/s) | 175.4 | 254 45% | 437.5 149% | 61 -65% | 320.4 83% | 32.46 -81% | 255.4 46% | 185.9 ? 6% |
| Write Seq Q32T1 (MB/s) | 464.9 | 1001 115% | 1085 133% | 167.1 -64% | 160.2 -66% | 92 -80% | 558 20% | 398 ? -14% |
| Read Seq Q32T1 (MB/s) | 530 | 2555 382% | 1634 208% | 211.5 -60% | 933 76% | 150.1 -72% | 2541 379% | 456 ? -14% |

| 3DMark 11 Performance | 1121 points | |
| 3DMark Cloud Gate Standard Score | 4145 points | |
| 3DMark Fire Strike Score | 617 points | |
Help | ||
| low | med. | high | ultra | |
|---|---|---|---|---|
| BioShock Infinite (2013) | 32 | 13 | ||
| Rocket League (2017) | 28 | 11 | ||
| Team Fortress 2 (2017) | 42 | 30 | 14 |
(±) The maximum temperature on the upper side is 44 °C / 111 F, compared to the average of 35.9 °C / 97 F, ranging from 21.4 to 59 °C for the class Subnotebook.
(-) The bottom heats up to a maximum of 53.4 °C / 128 F, compared to the average of 39.2 °C / 103 F
(+) In idle usage, the average temperature for the upper side is 31.9 °C / 89 F, compared to the device average of 30.8 °C / 87 F.
(±) The palmrests and touchpad can get very hot to the touch with a maximum of 36.2 °C / 97.2 F.
(-) The average temperature of the palmrest area of similar devices was 28.2 °C / 82.8 F (-8 °C / -14.4 F).
Chuwi AeroBook 13 inch 2019 audio analysis
(±) | speaker loudness is average but good (76.7 dB)
Bass 100 - 315 Hz
(-) | nearly no bass - on average 23% lower than median
(+) | bass is linear (5.2% delta to prev. frequency)
Mids 400 - 2000 Hz
(±) | higher mids - on average 8.5% higher than median
(±) | linearity of mids is average (12.7% delta to prev. frequency)
Highs 2 - 16 kHz
(±) | higher highs - on average 8.6% higher than median
(±) | linearity of highs is average (11.2% delta to prev. frequency)
Overall 100 - 16.000 Hz
(-) | overall sound is not linear (37.3% difference to median)
Compared to same class
» 97% of all tested devices in this class were better, 1% similar, 1% worse
» The best had a delta of 5%, average was 18%, worst was 53%
Compared to all devices tested
» 94% of all tested devices were better, 1% similar, 5% worse
» The best had a delta of 4%, average was 24%, worst was 134%
Apple MacBook Air 2018 audio analysis
(±) | speaker loudness is average but good (75 dB)
Bass 100 - 315 Hz
(±) | reduced bass - on average 8.1% lower than median
(±) | linearity of bass is average (10% delta to prev. frequency)
Mids 400 - 2000 Hz
(+) | balanced mids - only 2.9% away from median
(+) | mids are linear (5.6% delta to prev. frequency)
Highs 2 - 16 kHz
(+) | balanced highs - only 2.2% away from median
(+) | highs are linear (4.5% delta to prev. frequency)
Overall 100 - 16.000 Hz
(+) | overall sound is linear (12.3% difference to median)
Compared to same class
» 16% of all tested devices in this class were better, 5% similar, 80% worse
» The best had a delta of 5%, average was 18%, worst was 53%
Compared to all devices tested
» 10% of all tested devices were better, 2% similar, 87% worse
» The best had a delta of 4%, average was 24%, worst was 134%
Apple MacBook 12 2017 audio analysis
(+) | speakers can play relatively loud (83.9 dB)
Bass 100 - 315 Hz
(-) | nearly no bass - on average 15% lower than median
(±) | linearity of bass is average (8.8% delta to prev. frequency)
Mids 400 - 2000 Hz
(+) | balanced mids - only 2% away from median
(+) | mids are linear (3.8% delta to prev. frequency)
Highs 2 - 16 kHz
(+) | balanced highs - only 2.3% away from median
(+) | highs are linear (3.3% delta to prev. frequency)
Overall 100 - 16.000 Hz
(+) | overall sound is linear (11.6% difference to median)
Compared to same class
» 12% of all tested devices in this class were better, 3% similar, 84% worse
» The best had a delta of 5%, average was 18%, worst was 53%
Compared to all devices tested
» 8% of all tested devices were better, 2% similar, 90% worse
» The best had a delta of 4%, average was 24%, worst was 134%
| Off / Standby | |
| Idle | |
| Load |
|
Key:
min: | |
| Chuwi AeroBook 13 inch 2019 6Y30, HD Graphics 515, Netac SSD 256GB, IPS, 1920x1080, 13.3" | Apple MacBook Air 2018 i5-8210Y, UHD Graphics 617, Apple SSD AP0256, IPS, 2560x1600, 13.3" | Apple MacBook 12 2017 m3-7Y32, HD Graphics 615, Apple SSD AP0256, LED IPS, 2304x1440, 12" | Asus E203MA-FD825TS Pentium N5000, UHD Graphics 605, SanDisk DA4064, TN LED, 1366x768, 11.6" | Lenovo IdeaPad 330S-15IKB-81F500N5GE i5-8250U, UHD Graphics 620, , IPS, 1920x1080, 15.6" | Chuwi LapBook SE Celeron N4100, UHD Graphics 600, SanDisk DF4032, , 1920x1080, 13.3" | Dell XPS 13 9380 2019 i5-8265U, UHD Graphics 620, SK hynix PC401 HFS256GD9TNG, IPS, 3840x2160, 13.3" | |
|---|---|---|---|---|---|---|---|
| Power Consumption | 7% | 28% | 49% | -9% | 26% | -36% | |
| Idle Minimum * (Watt) | 4.6 | 2.2 52% | 2 57% | 1.9 59% | 5 -9% | 2.7 41% | 4.8 -4% |
| Idle Average * (Watt) | 7.8 | 5.7 27% | 5.4 31% | 3.5 55% | 7.6 3% | 6.3 19% | 8.6 -10% |
| Idle Maximum * (Watt) | 8.9 | 10.3 -16% | 6.6 26% | 3.9 56% | 8.6 3% | 7.6 15% | 10.4 -17% |
| Load Average * (Watt) | 20.9 | 25.6 -22% | 22 -5% | 12.7 39% | 25.6 -22% | 12.6 40% | 37.9 -81% |
| Load Maximum * (Watt) | 28.6 | 30.6 -7% | 20 30% | 19 34% | 34 -19% | 24.6 14% | 48.5 -70% |
* ... smaller is better
| Chuwi AeroBook 13 inch 2019 6Y30, HD Graphics 515, 38 Wh | Apple MacBook Air 2018 i5-8210Y, UHD Graphics 617, 50.3 Wh | Apple MacBook 12 2017 m3-7Y32, HD Graphics 615, 41.4 Wh | Asus E203MA-FD825TS Pentium N5000, UHD Graphics 605, 38 Wh | Lenovo IdeaPad 330S-15IKB-81F500N5GE i5-8250U, UHD Graphics 620, 52 Wh | Chuwi LapBook SE Celeron N4100, UHD Graphics 600, 37 Wh | Dell XPS 13 9380 2019 i5-8265U, UHD Graphics 620, 52 Wh | |
|---|---|---|---|---|---|---|---|
| Battery runtime | 54% | 45% | 34% | 14% | 130% | 53% | |
| Reader / Idle (h) | 9.3 | 12.6 35% | 17.2 85% | ||||
| WiFi v1.3 (h) | 6.2 | 11.1 79% | 9 45% | 8.3 34% | 5.8 -6% | 7.4 19% | 8.3 34% |
| Load (h) | 1.7 | 2.2 29% | 1.9 12% | 5.8 241% | 2.4 41% |
Pros
Cons
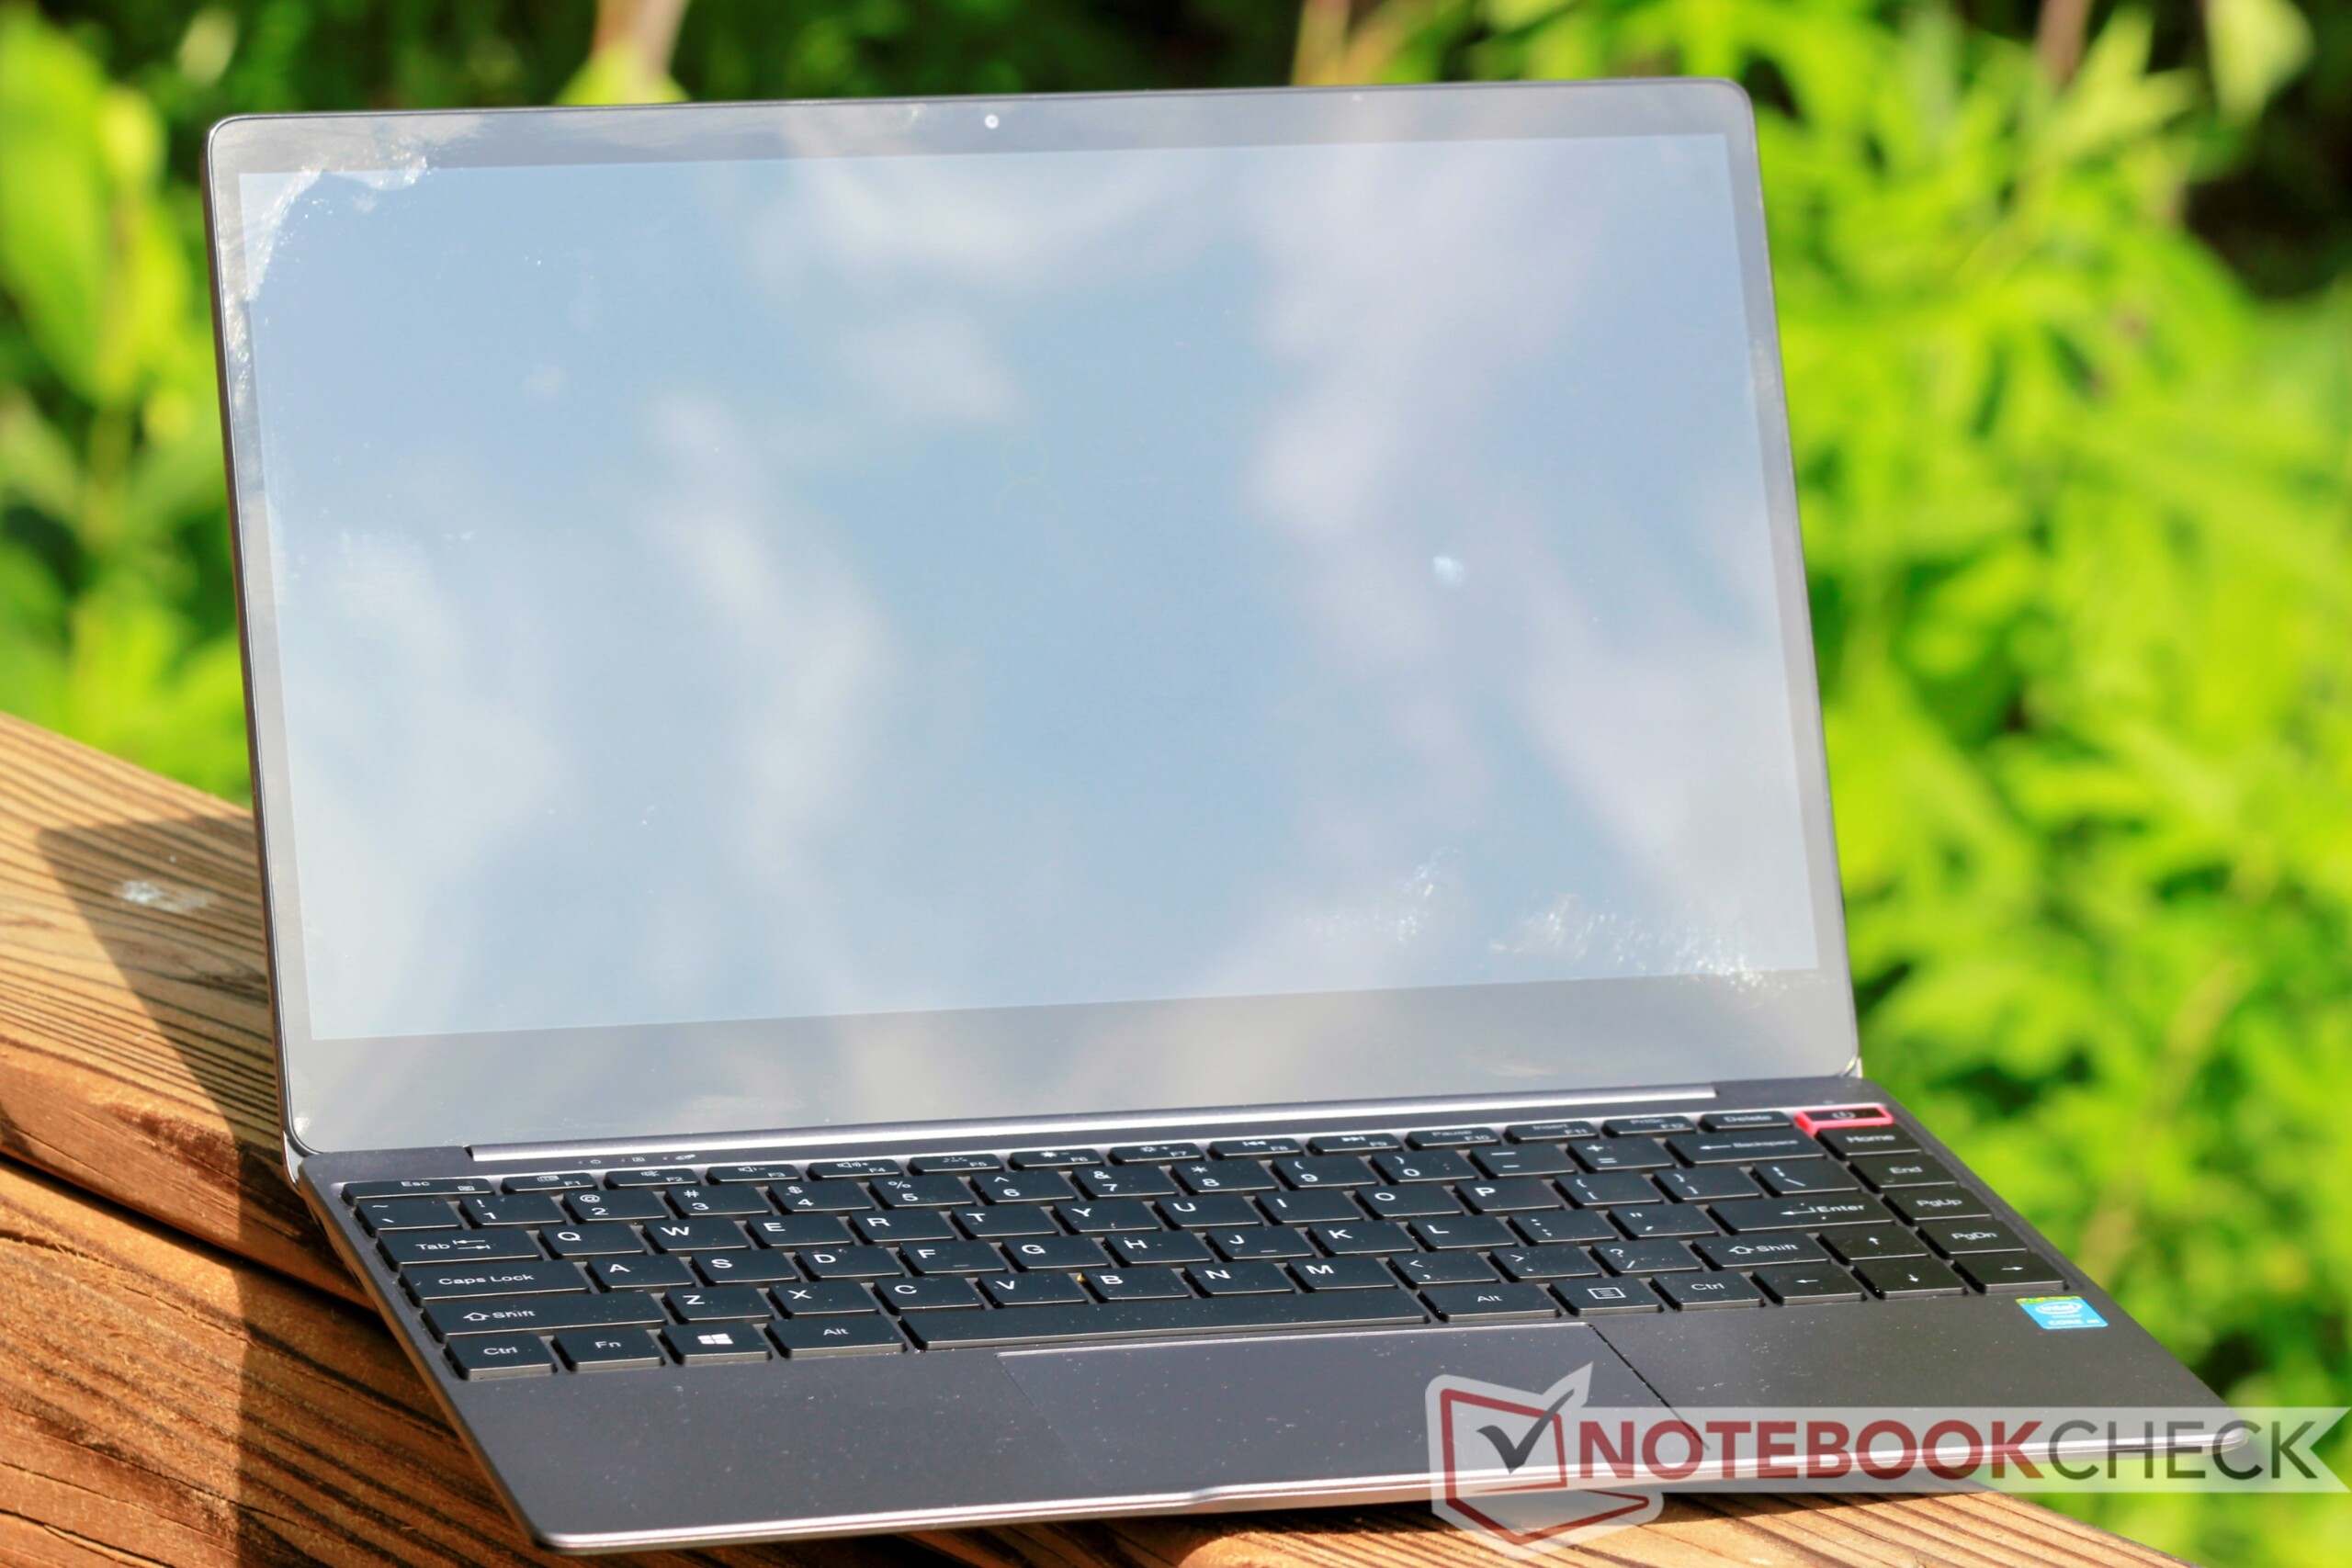
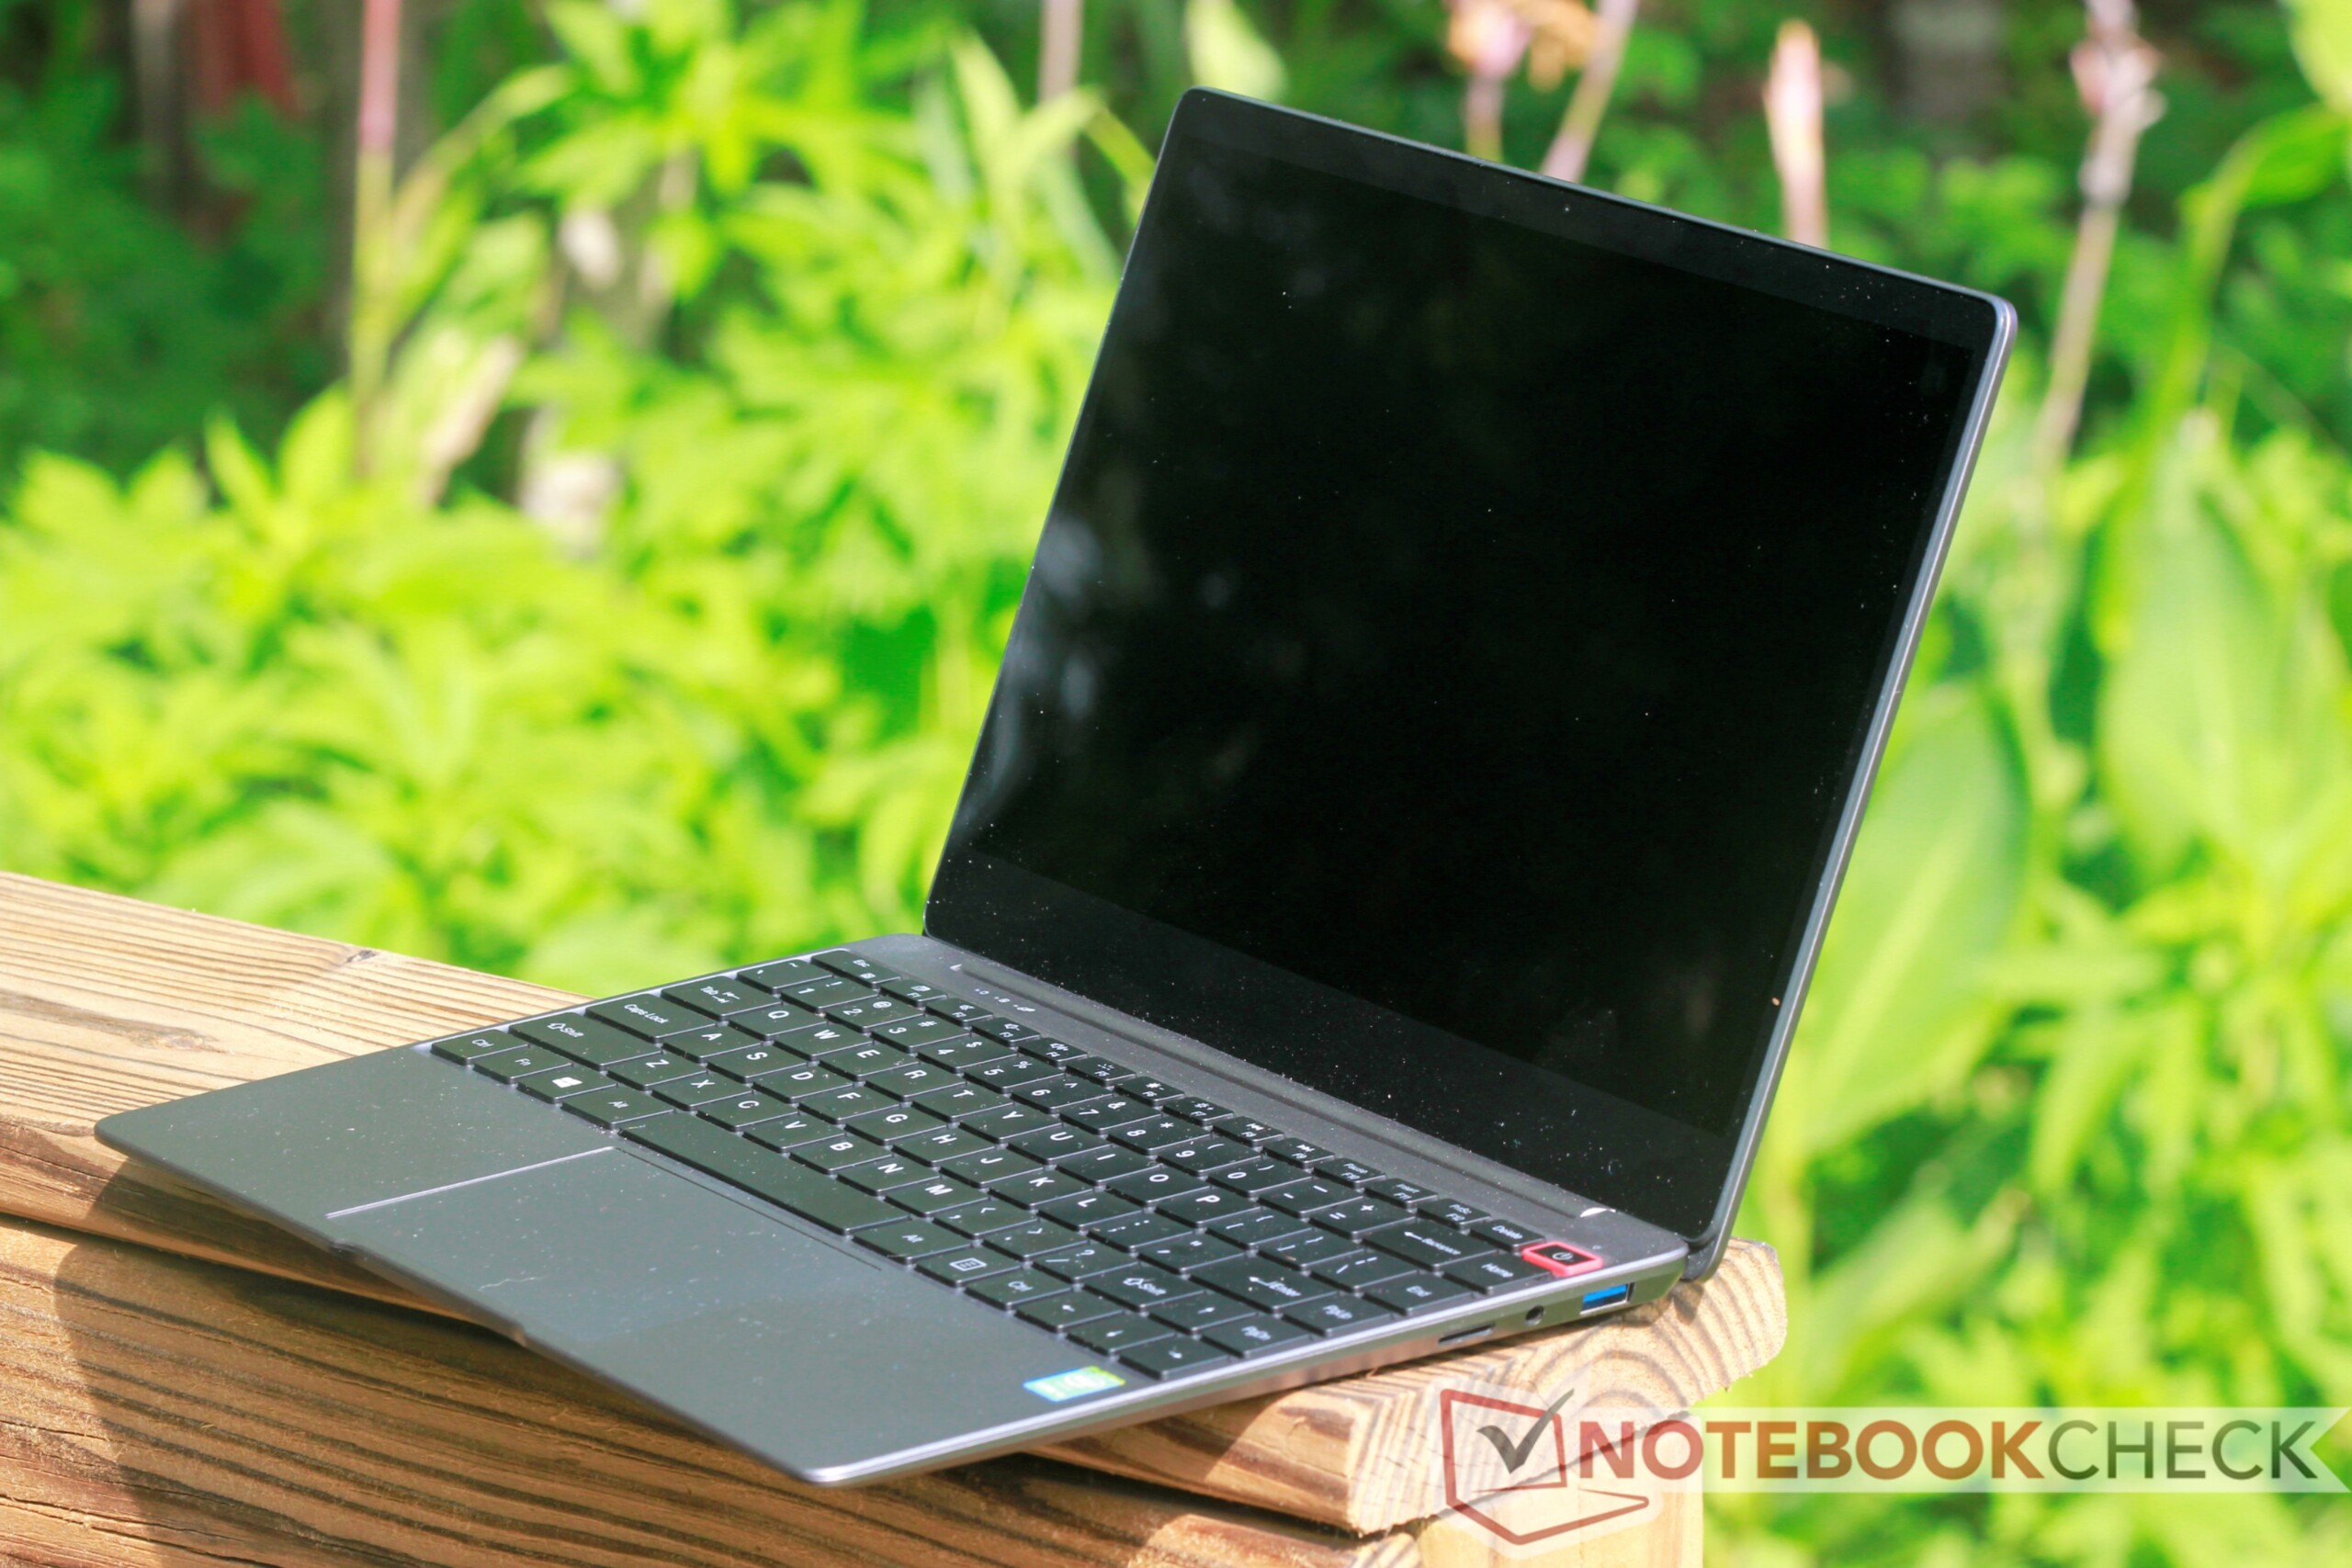
Chuwi的AeroBook是台不错的MacBook克隆版。这台国产笔记本有几件事情是做对了的; 设计是一流的,构建质量非常好,考虑到500美元的价格,键盘和触控板也非常好。
不幸的是,就像MacBook 12一样,AeroBook在功耗方面也没有给人留下深刻的印象。 此外,Chuwi不能像MacBook那样依赖软件优化。 由于MacOS的优化,Apple的小型笔记本电脑可以播放4K视频流和处理相当复杂的办公工作,而AeroBook在这些任务中不尽如人意,最终降级为与Chromebook和其他便宜的Windows笔记本电脑相同的队列。
总体而言,Chuwi Aerobook是一款外观漂亮的笔记本电脑,专为轻度使用,书写笔记和基本的办公工作而设计。 任何较重的任务都会让用户想要换台更好的电脑。
有兴趣的买家可以在这里使用优惠码“CHUWINOTE”在亚马逊链接上节省30美元。
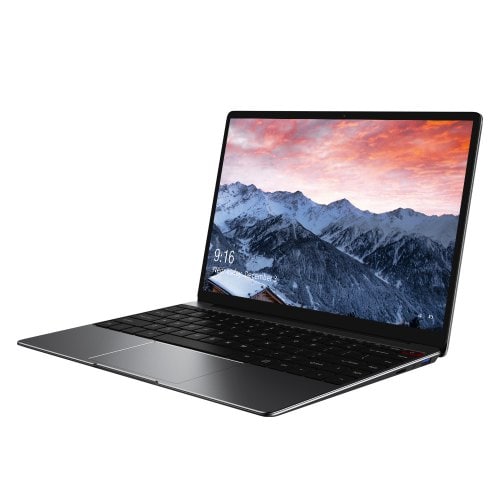
Chuwi AeroBook 13 inch 2019
- 09/26/2019 v7 (old)
Sam Medley
Price comparison

