苹果 iPad Pro 12.9 (2017) 平板电脑简短评测


| |||||||||||||||||||||||||
Brightness Distribution: 90 %
Center on Battery: 650 cd/m²
Contrast: 1548:1 (Black: 0.42 cd/m²)
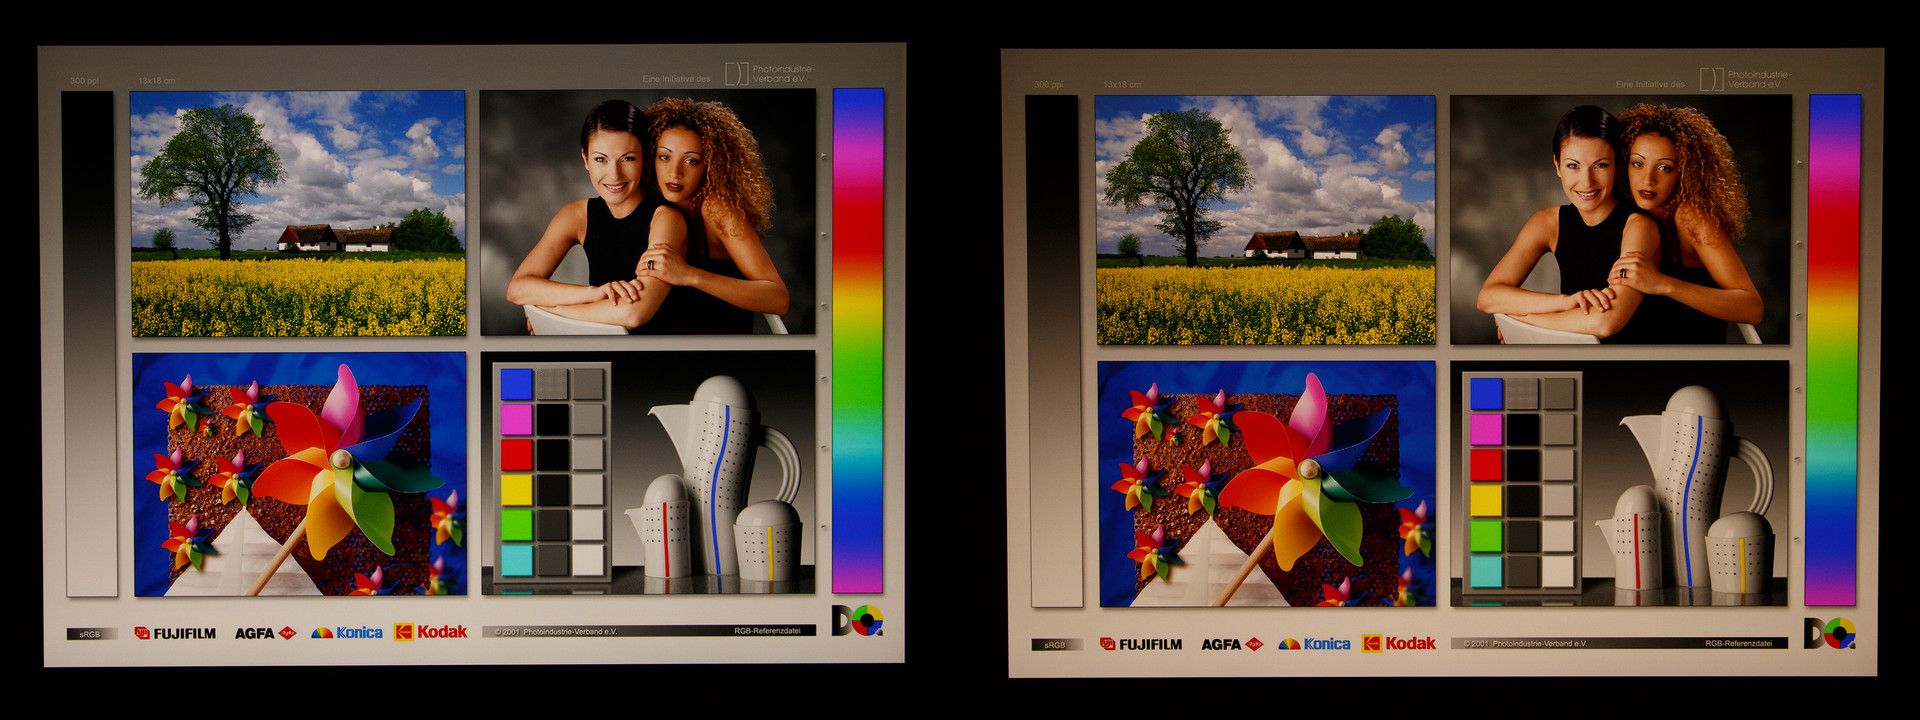
ΔE ColorChecker Calman: 1 | ∀{0.5-29.43 Ø4.71}
ΔE Greyscale Calman: 1.5 | ∀{0.09-98 Ø4.96}
Gamma: 2.25
CCT: 6734 K
| Apple iPad Pro 12.9 2017 IPS, 2732x2048, 12.9" | Apple iPad Pro 12.9 IPS, 2732x2048, 12.9" | Apple iPad Pro 10.5 2017 IPS, 2224x1668, 10.5" | Samsung Galaxy Tab S3 SM-T825 Super AMOLED, 2048x1526, 9.7" | Asus ZenPad 3s 10 Z500M IPS, 2048x1536, 9.7" | Microsoft Surface Pro (2017) i5 IPS, 2736x1824, 12.3" | Acer Aspire Switch Alpha 12 SA5-271-70EQ IPS, 2160x1440, 12" | |
|---|---|---|---|---|---|---|---|
| Screen | -43% | -34% | -39% | -174% | -77% | -221% | |
| Brightness middle (cd/m²) | 650 | 399 -39% | 634 -2% | 452 -30% | 489 -25% | 417 -36% | 391 -40% |
| Brightness (cd/m²) | 614 | 393 -36% | 625 2% | 468 -24% | 443 -28% | 401 -35% | 367 -40% |
| Brightness Distribution (%) | 90 | 92 2% | 87 -3% | 82 -9% | 86 -4% | 88 -2% | 87 -3% |
| Black Level * (cd/m²) | 0.42 | 0.22 48% | 0.39 7% | 0.43 -2% | 0.29 31% | 0.56 -33% | |
| Contrast (:1) | 1548 | 1814 17% | 1626 5% | 1137 -27% | 1438 -7% | 698 -55% | |
| Colorchecker dE 2000 * | 1 | 2.96 -196% | 1.9 -90% | 1.8 -80% | 5.5 -450% | 3.63 -263% | 6.96 -596% |
| Colorchecker dE 2000 max. * | 1.9 | 3.9 -105% | 4 -111% | 11.6 -511% | 6.74 -255% | 13.43 -607% | |
| Greyscale dE 2000 * | 1.5 | 3 -100% | 2.8 -87% | 1.2 20% | 6.7 -347% | 2.18 -45% | 7.44 -396% |
| Gamma | 2.25 98% | 2.21 100% | 2.26 97% | 2.11 104% | 2.06 107% | 3.09 71% | 2.41 91% |
| CCT | 6734 97% | 7049 92% | 7027 93% | 6500 100% | 7457 87% | 6767 96% | 8126 80% |
| Color Space (Percent of AdobeRGB 1998) (%) | 71.15 | 82.32 | 63 | 53 | |||
| Color Space (Percent of sRGB) (%) | 97.87 | 99.06 | 99 | 83 |
* ... smaller is better
Screen Flickering / PWM (Pulse-Width Modulation)
| Screen flickering / PWM not detected | 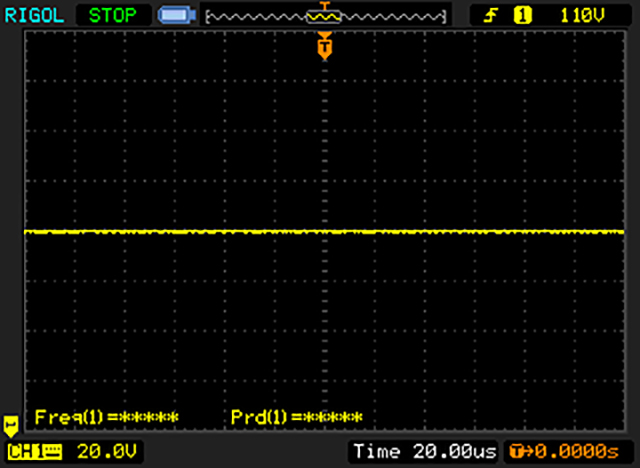 | ||
In comparison: 52 % of all tested devices do not use PWM to dim the display. If PWM was detected, an average of 7754 (minimum: 5 - maximum: 343500) Hz was measured. | |||
Display Response Times
| ↔ Response Time Black to White | ||
|---|---|---|
| 18.4 ms ... rise ↗ and fall ↘ combined | ↗ 6 ms rise | 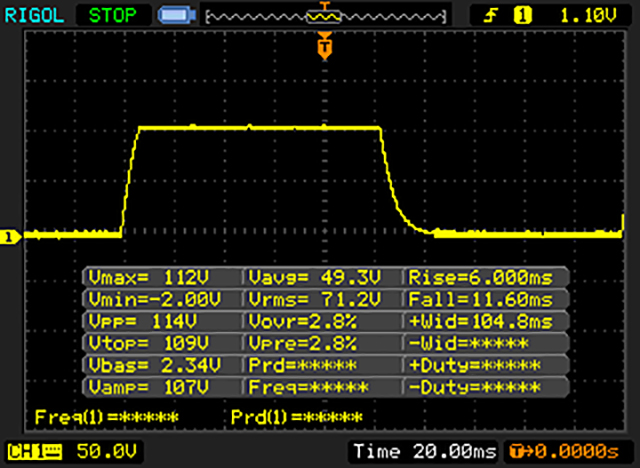 |
| ↘ 12.4 ms fall | ||
| The screen shows good response rates in our tests, but may be too slow for competitive gamers. In comparison, all tested devices range from 0.1 (minimum) to 240 (maximum) ms. » 41 % of all devices are better. This means that the measured response time is similar to the average of all tested devices (19.8 ms). | ||
| ↔ Response Time 50% Grey to 80% Grey | ||
| 41.6 ms ... rise ↗ and fall ↘ combined | ↗ 20.4 ms rise | 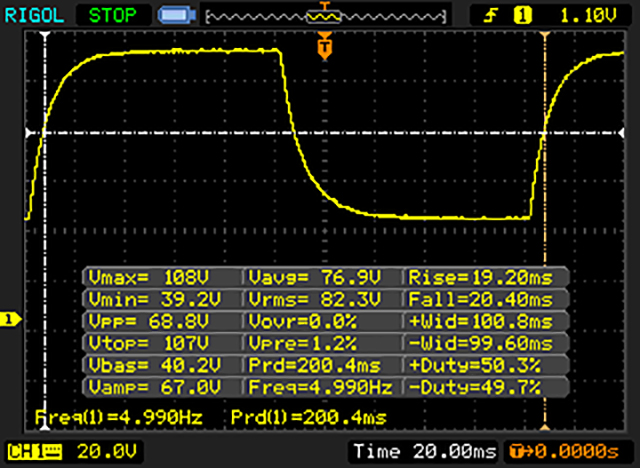 |
| ↘ 21.2 ms fall | ||
| The screen shows slow response rates in our tests and will be unsatisfactory for gamers. In comparison, all tested devices range from 0.165 (minimum) to 636 (maximum) ms. » 67 % of all devices are better. This means that the measured response time is worse than the average of all tested devices (31 ms). | ||
| AnTuTu v6 - Total Score | |
| Apple iPad Pro 12.9 2017 | |
| Apple iPad Pro 10.5 2017 | |
| Apple iPad Pro 12.9 | |
| HTC U11 | |
| Samsung Galaxy Tab S3 SM-T825 | |
| Asus ZenPad 3s 10 Z500M | |
| Huawei MediaPad T2 10.0 Pro | |
| Geekbench 4.4 | |
| 64 Bit Multi-Core Score | |
| Apple iPad Pro 10.5 2017 | |
| Apple iPad Pro 12.9 2017 | |
| HTC U11 | |
| Apple iPad Pro 12.9 | |
| Samsung Galaxy Tab S3 SM-T825 | |
| 64 Bit Single-Core Score | |
| Apple iPad Pro 10.5 2017 | |
| Apple iPad Pro 12.9 2017 | |
| Apple iPad Pro 12.9 | |
| HTC U11 | |
| Samsung Galaxy Tab S3 SM-T825 | |
| GFXBench 3.0 | |
| on screen Manhattan Onscreen OGL | |
| Apple iPad Pro 10.5 2017 | |
| Apple iPad Pro 12.9 2017 | |
| Samsung Galaxy Tab S3 SM-T825 | |
| Apple iPad Pro 12.9 | |
| HTC U11 | |
| Asus ZenPad 3s 10 Z500M | |
| Huawei MediaPad T2 10.0 Pro | |
| 1920x1080 1080p Manhattan Offscreen | |
| Apple iPad Pro 12.9 2017 | |
| Apple iPad Pro 10.5 2017 | |
| Apple iPad Pro 12.9 | |
| HTC U11 | |
| Samsung Galaxy Tab S3 SM-T825 | |
| Asus ZenPad 3s 10 Z500M | |
| Huawei MediaPad T2 10.0 Pro | |
| GFXBench 3.1 | |
| on screen Manhattan ES 3.1 Onscreen | |
| Apple iPad Pro 12.9 | |
| Apple iPad Pro 10.5 2017 | |
| Apple iPad Pro 12.9 2017 | |
| Samsung Galaxy Tab S3 SM-T825 | |
| HTC U11 | |
| Asus ZenPad 3s 10 Z500M | |
| 1920x1080 Manhattan ES 3.1 Offscreen | |
| Apple iPad Pro 12.9 | |
| Apple iPad Pro 12.9 2017 | |
| Apple iPad Pro 10.5 2017 | |
| HTC U11 | |
| Samsung Galaxy Tab S3 SM-T825 | |
| Asus ZenPad 3s 10 Z500M | |
| GFXBench | |
| on screen Car Chase Onscreen | |
| Apple iPad Pro 12.9 | |
| Samsung Galaxy Tab S3 SM-T825 | |
| HTC U11 | |
| Asus ZenPad 3s 10 Z500M | |
| 1920x1080 Car Chase Offscreen | |
| Apple iPad Pro 12.9 | |
| HTC U11 | |
| Samsung Galaxy Tab S3 SM-T825 | |
| Asus ZenPad 3s 10 Z500M | |
| Octane V2 - Total Score | |
| Apple iPad Pro 12.9 2017 | |
| Apple iPad Pro 10.5 2017 | |
| Apple iPad Pro 12.9 | |
| HTC U11 | |
| Samsung Galaxy Tab S3 SM-T825 | |
| Asus ZenPad 3s 10 Z500M | |
| Huawei MediaPad T2 10.0 Pro | |
| WebXPRT 2015 - Overall | |
| Apple iPad Pro 10.5 2017 | |
| Apple iPad Pro 12.9 2017 | |
| Apple iPad Pro 12.9 | |
| HTC U11 | |
| Samsung Galaxy Tab S3 SM-T825 | |
| Asus ZenPad 3s 10 Z500M | |
| Huawei MediaPad T2 10.0 Pro | |
| JetStream 1.1 - 1.1 Total | |
| Apple iPad Pro 12.9 2017 | |
| Apple iPad Pro 10.5 2017 | |
| Apple iPad Pro 12.9 | |
| HTC U11 | |
| Asus ZenPad 3s 10 Z500M | |
| Samsung Galaxy Tab S3 SM-T825 | |
| Huawei MediaPad T2 10.0 Pro | |
| Mozilla Kraken 1.1 - Total | |
| Huawei MediaPad T2 10.0 Pro | |
| Asus ZenPad 3s 10 Z500M | |
| HTC U11 | |
| Samsung Galaxy Tab S3 SM-T825 | |
| Apple iPad Pro 12.9 | |
| Apple iPad Pro 10.5 2017 | |
| Apple iPad Pro 12.9 2017 | |
* ... smaller is better
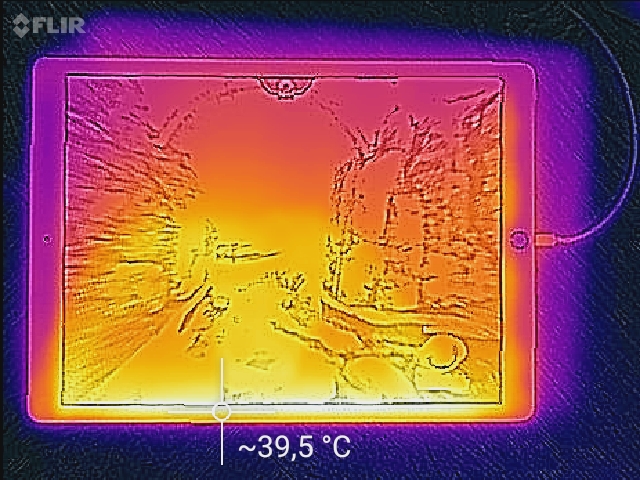
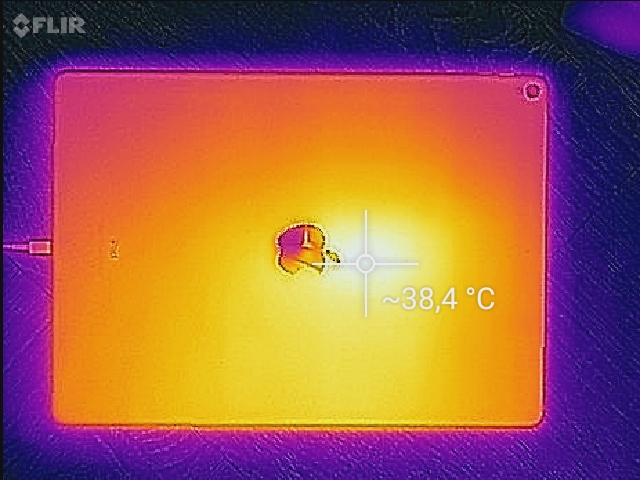
(+) The maximum temperature on the upper side is 37.2 °C / 99 F, compared to the average of 33.7 °C / 93 F, ranging from 20.7 to 53.2 °C for the class Tablet.
(+) The bottom heats up to a maximum of 35 °C / 95 F, compared to the average of 33.2 °C / 92 F
(±) In idle usage, the average temperature for the upper side is 32.9 °C / 91 F, compared to the device average of 30 °C / 86 F.
Apple iPad Pro 12.9 2017 audio analysis
(±) | speaker loudness is average but good (81.2 dB)
Bass 100 - 315 Hz
(±) | reduced bass - on average 5.7% lower than median
(±) | linearity of bass is average (10.7% delta to prev. frequency)
Mids 400 - 2000 Hz
(+) | balanced mids - only 1.6% away from median
(+) | mids are linear (5.1% delta to prev. frequency)
Highs 2 - 16 kHz
(+) | balanced highs - only 4.7% away from median
(+) | highs are linear (5.9% delta to prev. frequency)
Overall 100 - 16.000 Hz
(+) | overall sound is linear (8.9% difference to median)
Compared to same class
» 2% of all tested devices in this class were better, 2% similar, 96% worse
» The best had a delta of 7%, average was 20%, worst was 129%
Compared to all devices tested
» 3% of all tested devices were better, 1% similar, 97% worse
» The best had a delta of 4%, average was 23%, worst was 134%
Samsung Galaxy Tab S3 SM-T825 audio analysis
(+) | speakers can play relatively loud (86.5 dB)
Bass 100 - 315 Hz
(-) | nearly no bass - on average 26.5% lower than median
(±) | linearity of bass is average (14.5% delta to prev. frequency)
Mids 400 - 2000 Hz
(±) | higher mids - on average 5.1% higher than median
(+) | mids are linear (5.2% delta to prev. frequency)
Highs 2 - 16 kHz
(+) | balanced highs - only 1.9% away from median
(+) | highs are linear (5.6% delta to prev. frequency)
Overall 100 - 16.000 Hz
(±) | linearity of overall sound is average (17.9% difference to median)
Compared to same class
» 45% of all tested devices in this class were better, 6% similar, 48% worse
» The best had a delta of 7%, average was 20%, worst was 129%
Compared to all devices tested
» 37% of all tested devices were better, 8% similar, 55% worse
» The best had a delta of 4%, average was 23%, worst was 134%
Microsoft Surface Pro (2017) i5 audio analysis
(-) | not very loud speakers (68 dB)
Bass 100 - 315 Hz
(±) | reduced bass - on average 9.7% lower than median
(±) | linearity of bass is average (7% delta to prev. frequency)
Mids 400 - 2000 Hz
(+) | balanced mids - only 4.6% away from median
(+) | mids are linear (6.3% delta to prev. frequency)
Highs 2 - 16 kHz
(+) | balanced highs - only 2.1% away from median
(+) | highs are linear (5.2% delta to prev. frequency)
Overall 100 - 16.000 Hz
(±) | linearity of overall sound is average (18.2% difference to median)
Compared to same class
» 40% of all tested devices in this class were better, 7% similar, 53% worse
» The best had a delta of 6%, average was 20%, worst was 57%
Compared to all devices tested
» 39% of all tested devices were better, 8% similar, 53% worse
» The best had a delta of 4%, average was 23%, worst was 134%
| Off / Standby | |
| Idle | |
| Load |
|
Key:
min: | |
| Apple iPad Pro 12.9 2017 10875 mAh | Apple iPad Pro 12.9 10307 mAh | Samsung Galaxy Note Pro 12.2 LTE (SM-P905) mAh | Apple iPad Pro 10.5 2017 8134 mAh | Asus ZenPad 3s 10 Z500M 5900 mAh | Samsung Galaxy Tab S3 SM-T825 6000 mAh | Lenovo Yoga Book Android YB1-X90F 8500 mAh | |
|---|---|---|---|---|---|---|---|
| Power Consumption | -33% | -23% | 16% | 17% | 29% | 13% | |
| Idle Minimum * (Watt) | 1.55 | 2.69 -74% | 3.1 -100% | 1.44 7% | 1.59 -3% | 2.08 -34% | 2.19 -41% |
| Idle Average * (Watt) | 8.58 | 10.95 -28% | 8.9 -4% | 6.12 29% | 4.14 52% | 3.5 59% | 4.3 50% |
| Idle Maximum * (Watt) | 8.59 | 11.14 -30% | 9.4 -9% | 6.14 29% | 4.23 51% | 3.58 58% | 4.37 49% |
| Load Average * (Watt) | 10.09 | 11.54 -14% | 9.8 3% | 8.55 15% | 10.89 -8% | 6.97 31% | 8.62 15% |
| Load Maximum * (Watt) | 10.61 | 12.8 -21% | 11 -4% | 10.62 -0% | 11.58 -9% | 7.4 30% | 11.26 -6% |
* ... smaller is better
| Apple iPad Pro 12.9 2017 10875 mAh | Apple iPad Pro 12.9 10307 mAh | Apple iPad Pro 10.5 2017 8134 mAh | Samsung Galaxy Tab S3 SM-T825 6000 mAh | Asus ZenPad 3s 10 Z500M 5900 mAh | Lenovo Yoga Book Android YB1-X90F 8500 mAh | Huawei MediaPad T2 10.0 Pro 6600 mAh | |
|---|---|---|---|---|---|---|---|
| Battery runtime | -18% | -17% | -1% | -26% | -15% | -30% | |
| Reader / Idle (h) | 48.7 | 32.2 -34% | 33.9 -30% | 31.7 -35% | 24.2 -50% | 33.1 -32% | 20.5 -58% |
| H.264 (h) | 11.3 | 10.5 -7% | 10.5 -7% | 9.2 -19% | 10 -12% | 11.7 4% | 9.9 -12% |
| WiFi v1.3 (h) | 12.3 | 11.6 -6% | 11.6 -6% | 12.7 3% | 8.6 -30% | 10 -19% | 6.9 -44% |
| Load (h) | 4.3 | 3.3 -23% | 3.3 -23% | 6.3 47% | 3.8 -12% | 3.7 -14% | 4.1 -5% |
Pros
Cons

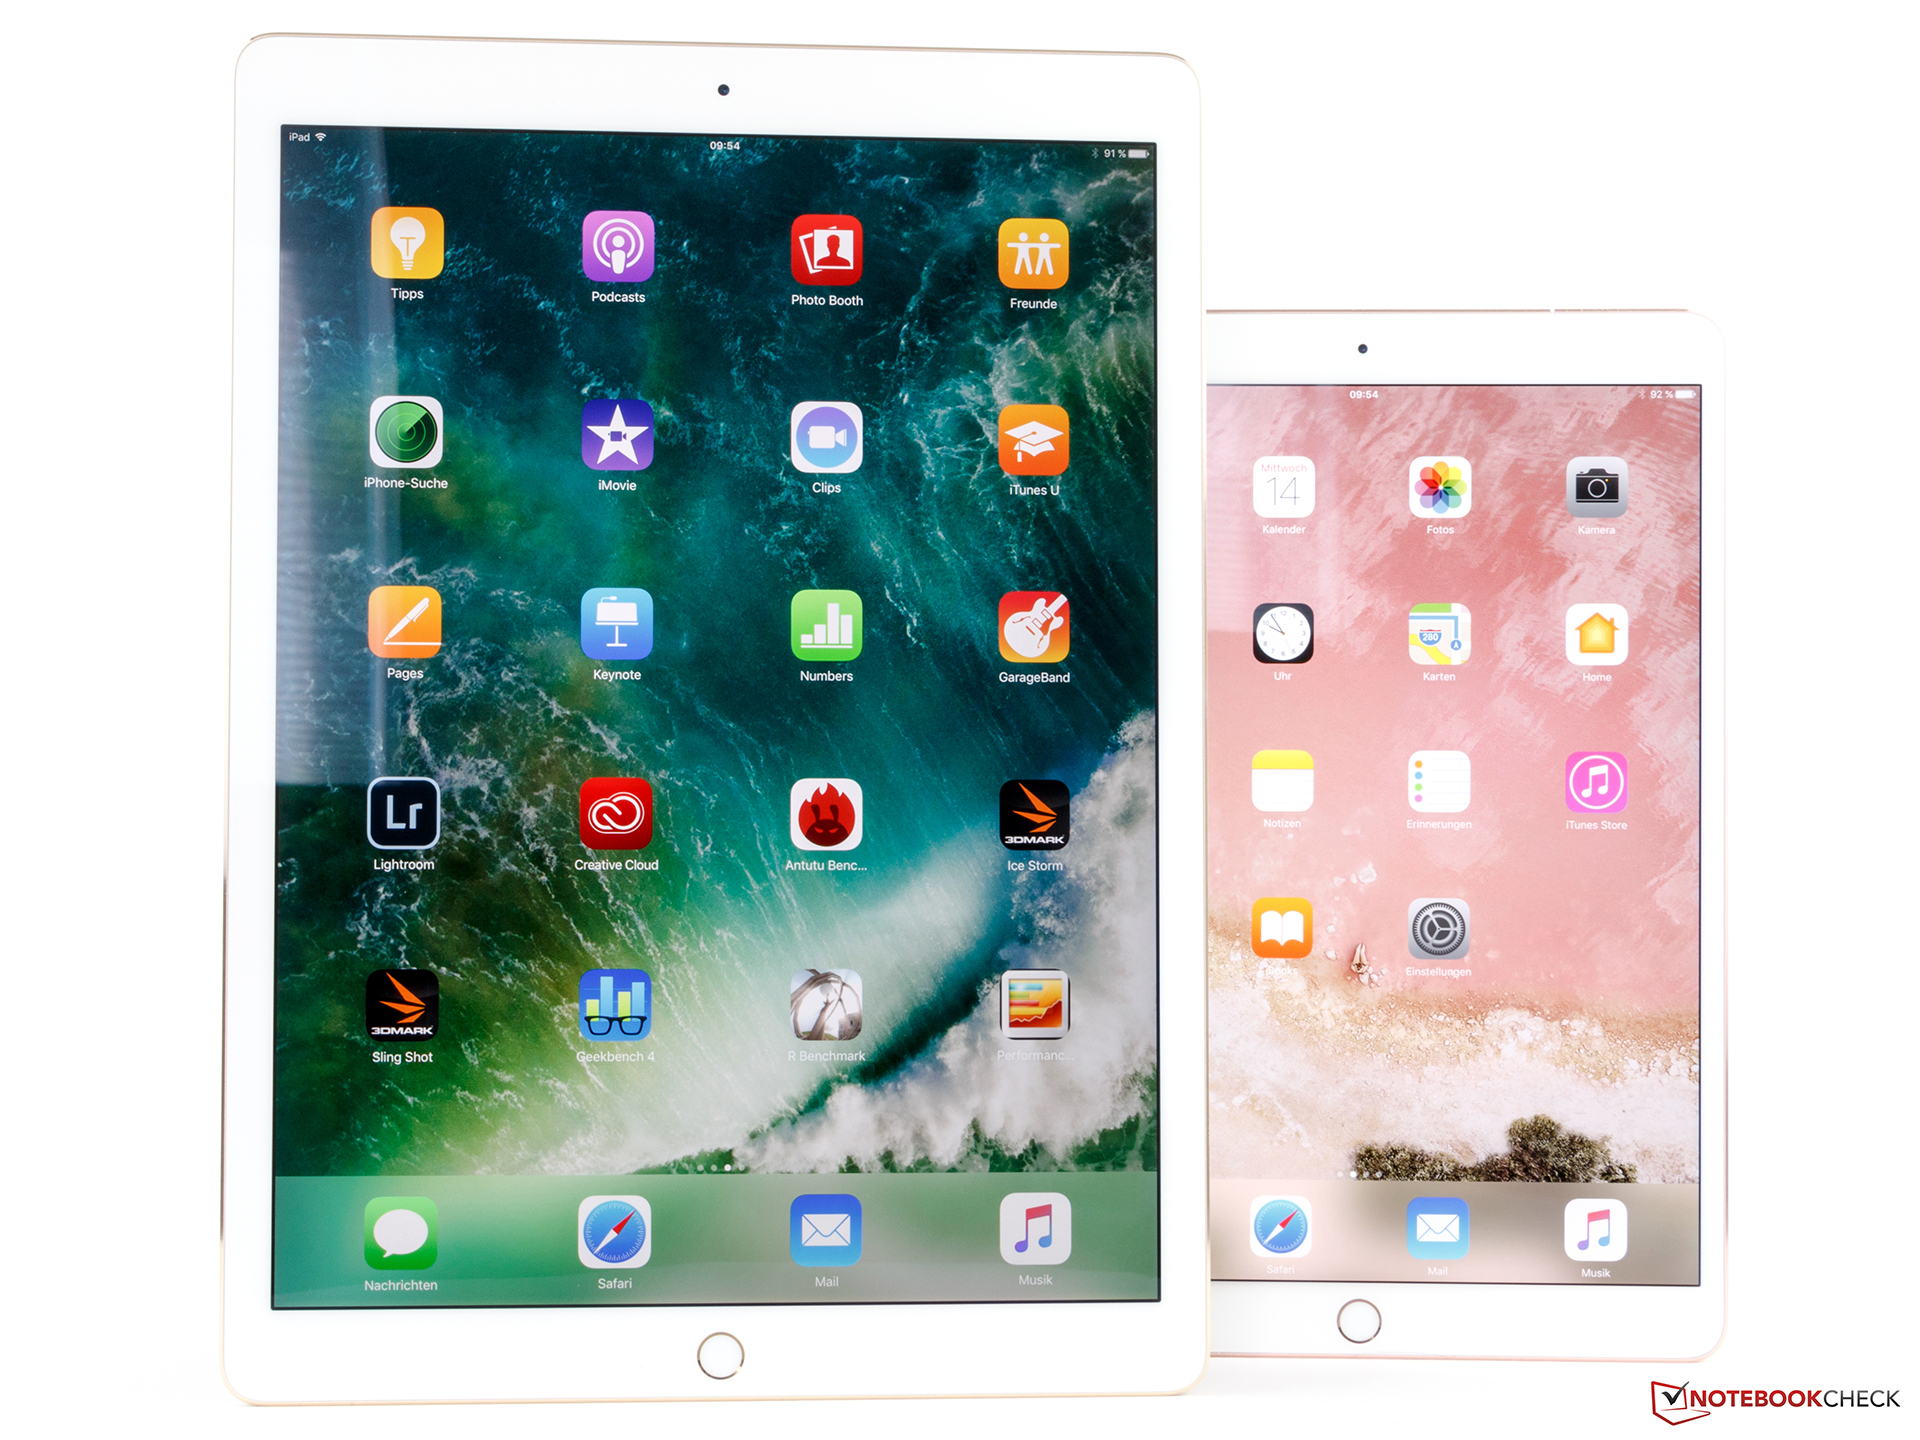
数据上看,iPad Pro 12.9只不过是一款更大的iPad Pro 10.5,但在现实生活中,它在很多方面都有所不同。精确校准的显示屏幕具有非常准确的色彩精确度,令人印象深刻;扬声器非常均衡;Wi-Fi调制解调器的范围更广;并且电池续航时间更长。
因此,要看个人的偏好和品味。12.9英寸机型,让创意工作、编辑照片和观看电影变得更加有趣。更便携,更好的人体工程学设计和更高的游戏性能则是10.5英寸机型的优势。
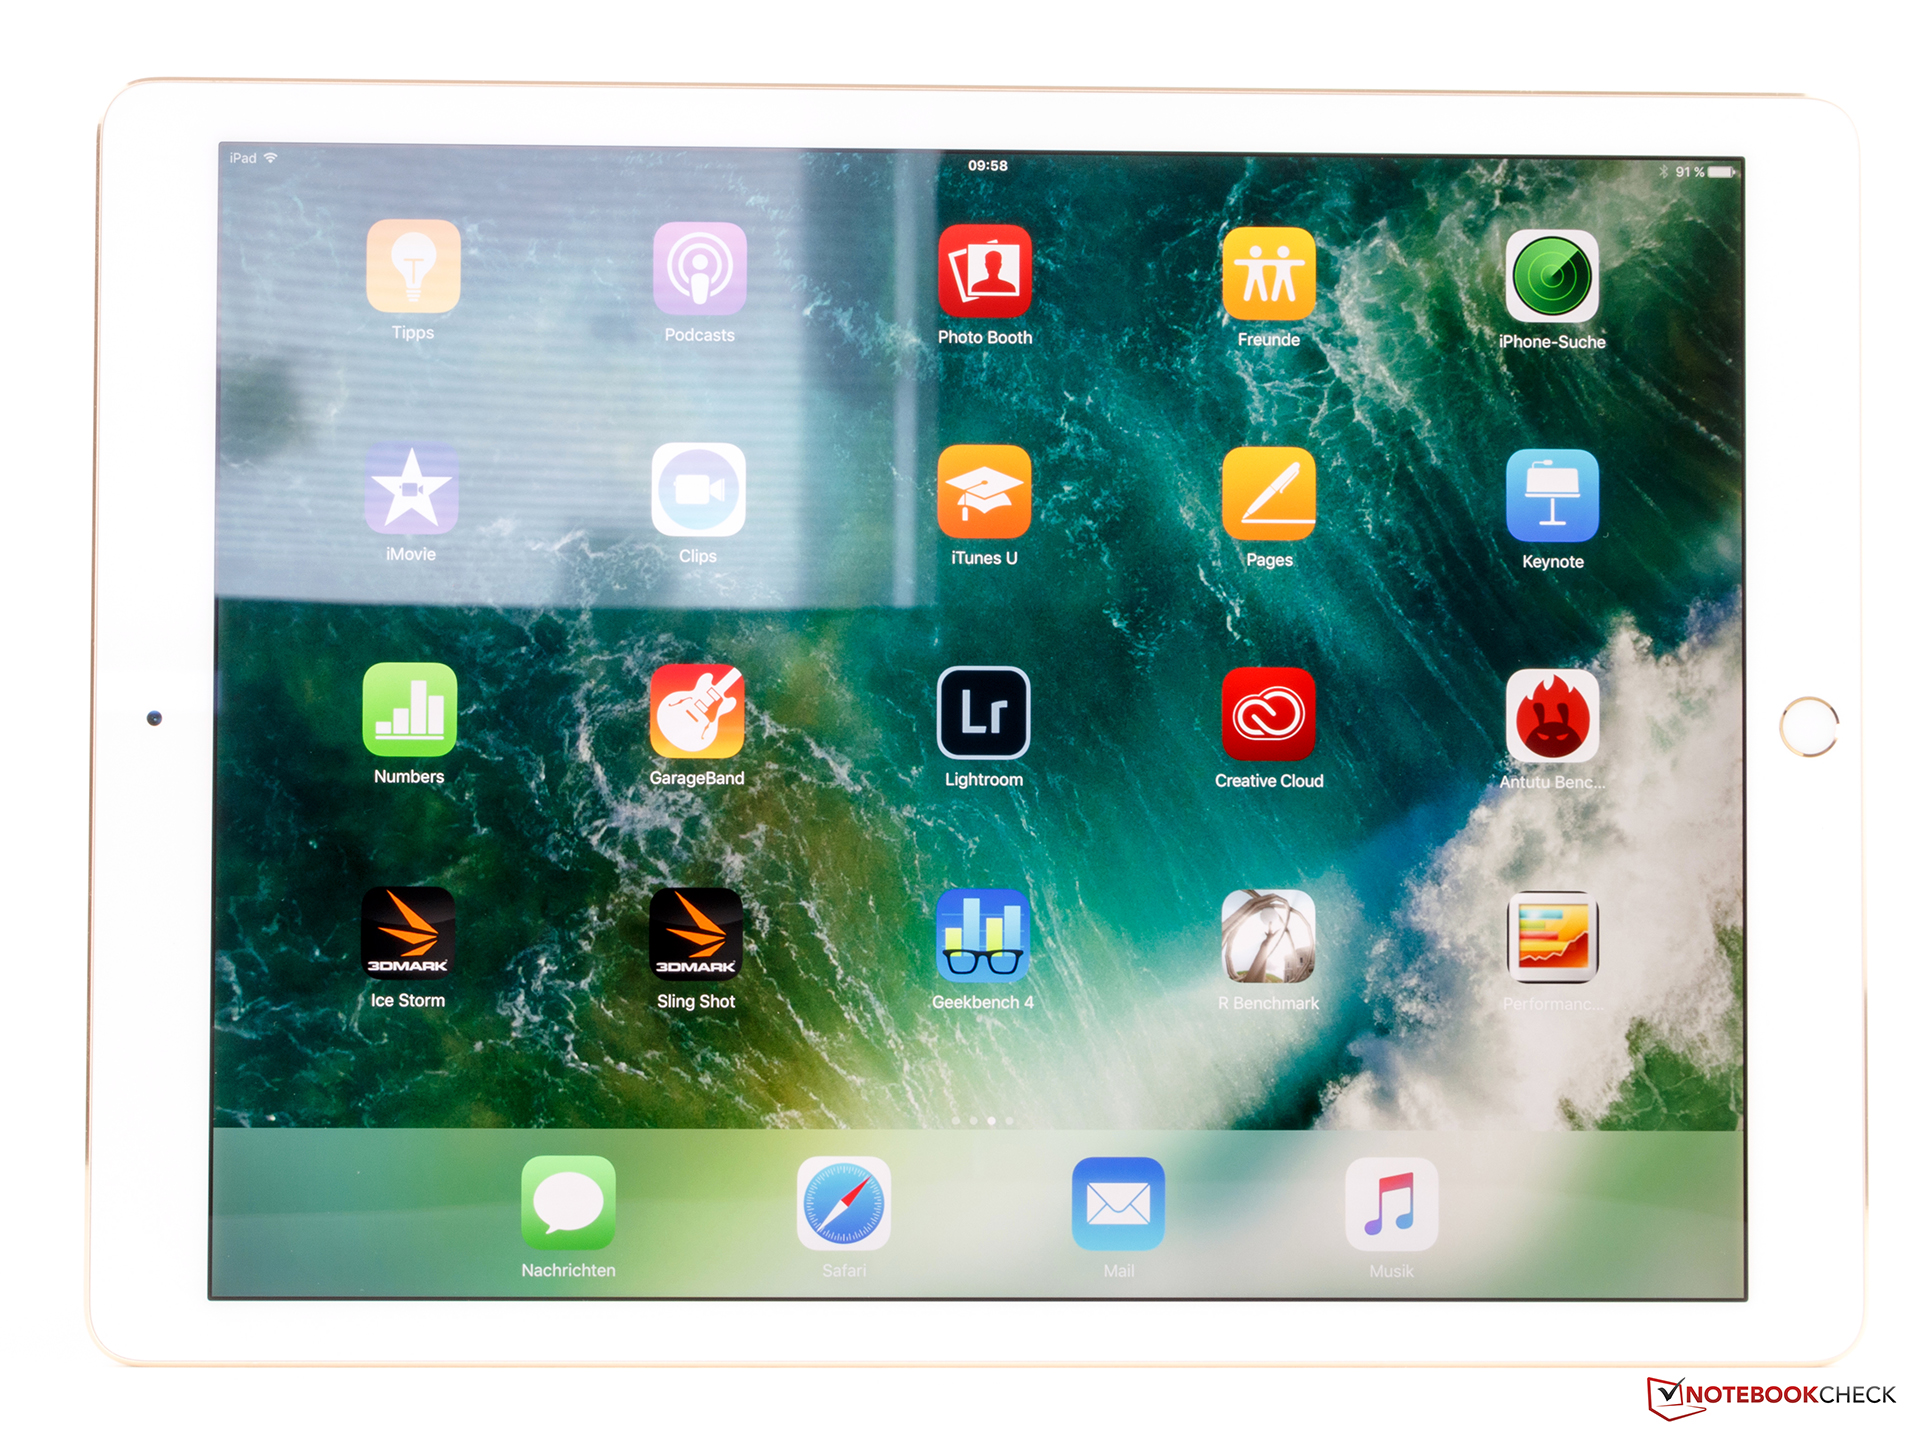
iPad Pro 12.9(2017)不仅更大,而且还提供了惊人的120赫兹显示屏,令人印象深刻的性能和更长的电池续航。除此之外,您还可以获得一流的摄像头和非常好的扬声器。
不过,我们不会考虑将iPad Pro 12.9作为笔记本的替代品。iOS仍然太有限,Safari浏览器对复杂的网站和CMS系统的支持很有限。可选的配件;智能键盘,除了在光滑而坚实的表面上可以顺利使用,其他情况下都很难使用。
Apple iPad Pro 12.9 2017
- 06/26/2017 v6 (old)
Daniel Schmidt
Price comparison
