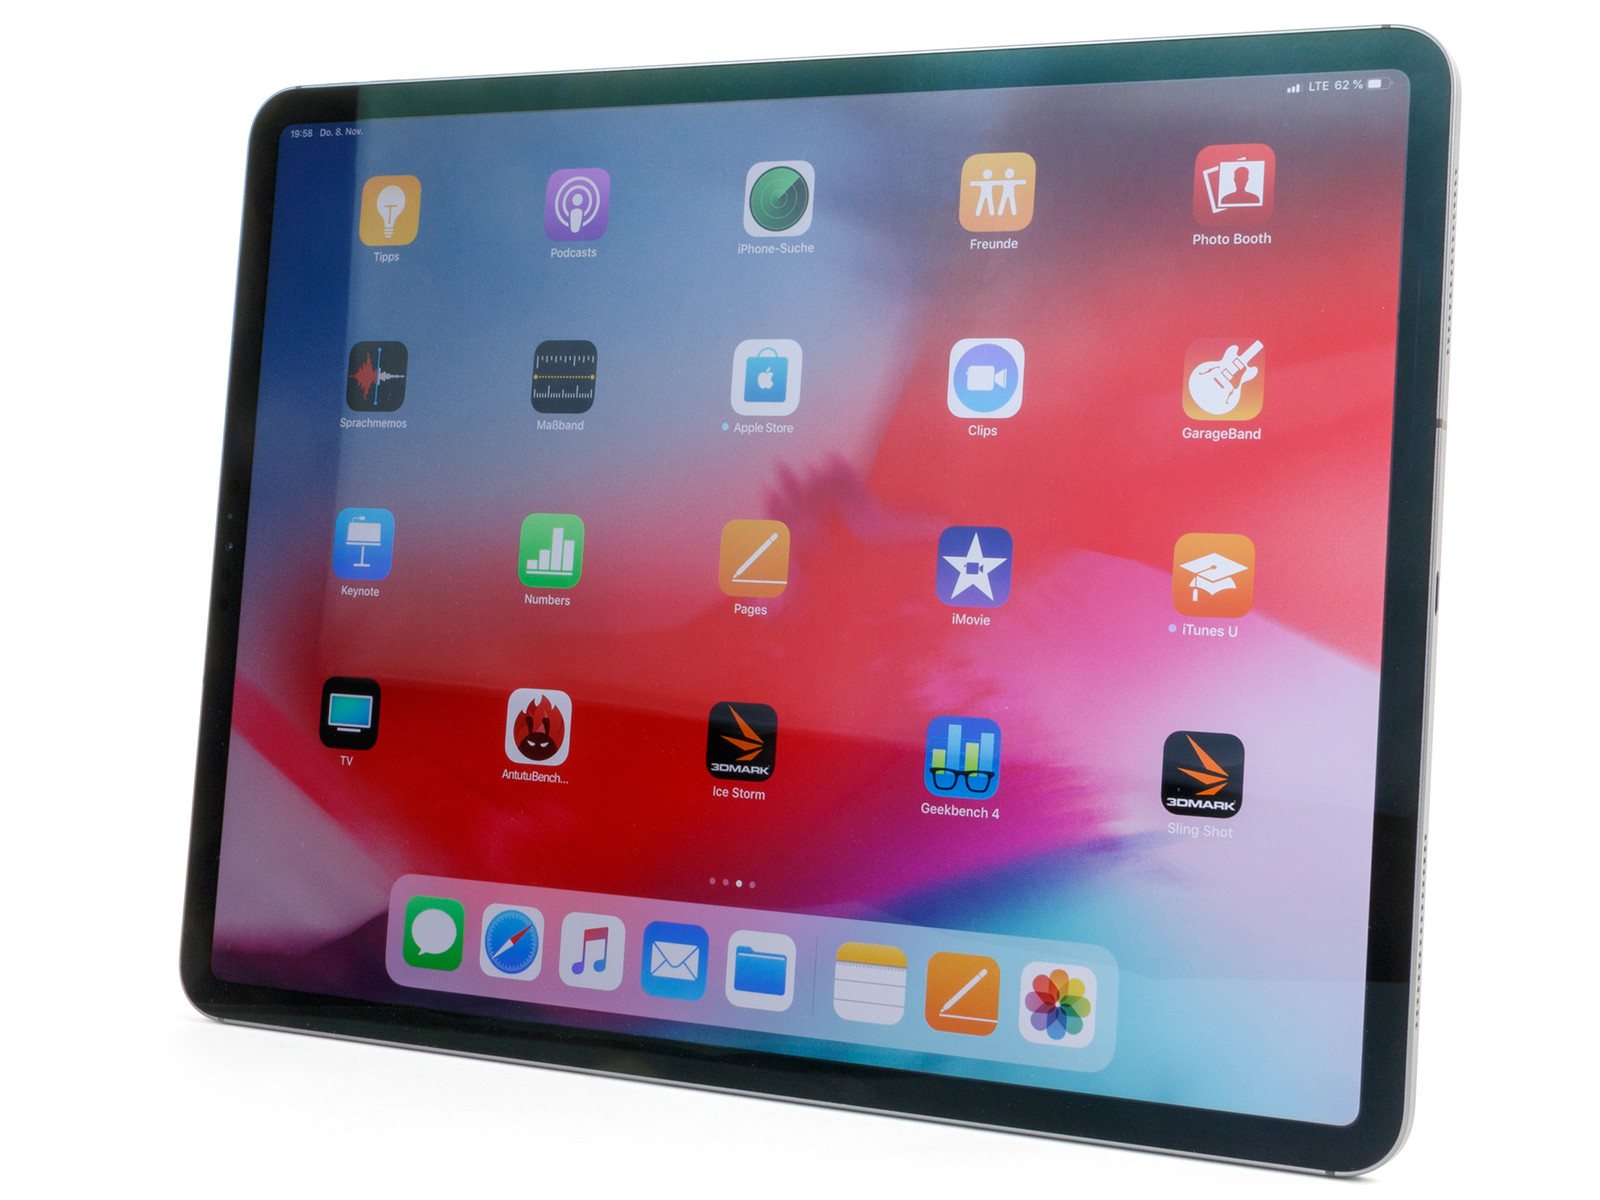
苹果iPad Pro 12.9(2018款,LTE版,256 GB)平板电脑评测


| |||||||||||||||||||||||||
Brightness Distribution: 91 %
Center on Battery: 632 cd/m²
Contrast: 1975:1 (Black: 0.32 cd/m²)
ΔE ColorChecker Calman: 1.1 | ∀{0.5-29.43 Ø4.72}
ΔE Greyscale Calman: 1.7 | ∀{0.09-98 Ø4.97}
99.7% sRGB (Calman 2D)
Gamma: 2.21
CCT: 6794 K
| Apple iPad Pro 12.9 2018 IPS, 2732x2048, 12.9" | Apple iPad Pro 12.9 2017 IPS, 2732x2048, 12.9" | Samsung Galaxy Tab S4 Super AMOLED, 2560x1600, 10.5" | Huawei MediaPad M5 10.8 Pro IPS, 2560x1600, 10.8" | Microsoft Surface Pro 6, Core i5, 128 GB IPS, 2736x1834, 12.3" | Apple iPad 6 2018 IPS, 2048x1536, 9.7" | |
|---|---|---|---|---|---|---|
| Screen | -1% | -57% | -201% | -78% | -22% | |
| Brightness middle (cd/m²) | 632 | 650 3% | 474 -25% | 384 -39% | 463 -27% | 530 -16% |
| Brightness (cd/m²) | 605 | 614 1% | 477 -21% | 360 -40% | 450 -26% | 513 -15% |
| Brightness Distribution (%) | 91 | 90 -1% | 91 0% | 84 -8% | 83 -9% | 92 1% |
| Black Level * (cd/m²) | 0.32 | 0.42 -31% | 0.8 -150% | 0.32 -0% | 0.61 -91% | |
| Contrast (:1) | 1975 | 1548 -22% | 480 -76% | 1447 -27% | 869 -56% | |
| Colorchecker dE 2000 * | 1.1 | 1 9% | 2.5 -127% | 6.83 -521% | 3.76 -242% | 1.2 -9% |
| Colorchecker dE 2000 max. * | 2.4 | 1.9 21% | 5.8 -142% | 12.7 -429% | 7.35 -206% | 3.2 -33% |
| Greyscale dE 2000 * | 1.7 | 1.5 12% | 2.1 -24% | 7.5 -341% | 3.18 -87% | 1 41% |
| Gamma | 2.21 100% | 2.25 98% | 2.08 106% | 2.199 100% | 2.53 87% | 2.28 96% |
| CCT | 6794 96% | 6734 97% | 6281 103% | 8544 76% | 6994 93% | 6588 99% |
| Colorchecker dE 2000 calibrated * | 2.68 | |||||
| Color Space (Percent of AdobeRGB 1998) (%) | 59 | |||||
| Color Space (Percent of sRGB) (%) | 90 |
* ... smaller is better
Screen Flickering / PWM (Pulse-Width Modulation)
| Screen flickering / PWM not detected | 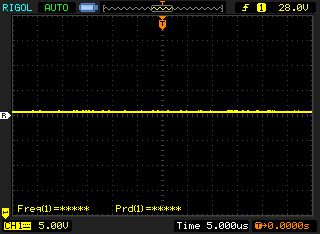 | ||
In comparison: 52 % of all tested devices do not use PWM to dim the display. If PWM was detected, an average of 7772 (minimum: 5 - maximum: 343500) Hz was measured. | |||
Display Response Times
| ↔ Response Time Black to White | ||
|---|---|---|
| 23.2 ms ... rise ↗ and fall ↘ combined | ↗ 7.6 ms rise | 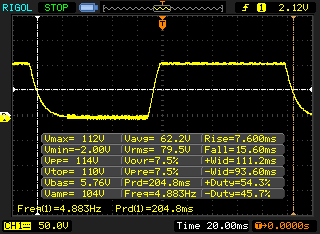 |
| ↘ 15.6 ms fall | ||
| The screen shows good response rates in our tests, but may be too slow for competitive gamers. In comparison, all tested devices range from 0.1 (minimum) to 240 (maximum) ms. » 53 % of all devices are better. This means that the measured response time is worse than the average of all tested devices (19.8 ms). | ||
| ↔ Response Time 50% Grey to 80% Grey | ||
| 49.6 ms ... rise ↗ and fall ↘ combined | ↗ 18.8 ms rise | 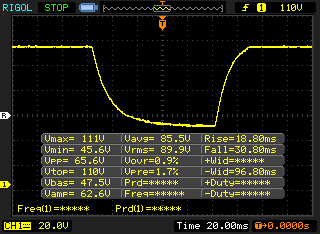 |
| ↘ 30.8 ms fall | ||
| The screen shows slow response rates in our tests and will be unsatisfactory for gamers. In comparison, all tested devices range from 0.165 (minimum) to 636 (maximum) ms. » 86 % of all devices are better. This means that the measured response time is worse than the average of all tested devices (31 ms). | ||
| AnTuTu v7 - Total Score | |
| Average Apple A12X Bionic (552676 - 566378, n=2) | |
| Apple iPad Pro 12.9 2018 | |
| Apple iPad Pro 12.9 | |
| Samsung Galaxy Tab S4 | |
| Huawei MediaPad M5 10.8 Pro | |
| Apple iPad 6 2018 | |
| Basemark ES 3.1 / Metal - offscreen Overall Score | |
| Apple iPad Pro 12.9 2018 | |
| Average Apple A12X Bionic (5216 - 5300, n=2) | |
| Average of class Tablet (255 - 5784, n=7, last 2 years) | |
| Apple iPad Pro 12.9 | |
| Apple iPad 6 2018 | |
| JetStream 1.1 - 1.1 Total | |
| Apple iPad Pro 12.9 2018 (Safari Mobile 12) | |
| Average Apple A12X Bionic (278 - 279, n=2) | |
| Apple iPad Pro 12.9 2017 (Safari Mobile 10) | |
| Microsoft Surface Pro 6, Core i5, 128 GB | |
| Apple iPad 6 2018 (Safari Mobile 11.3) | |
| Apple iPad Pro 12.9 (Safari Mobile 9.0) | |
| Samsung Galaxy Tab S4 (Samsung Browser 8.0) | |
| Huawei MediaPad M5 10.8 Pro (Chrome 68.0.3440.91) | |
| Octane V2 - Total Score | |
| Average of class Tablet (763 - 138481, n=72, last 2 years) | |
| Apple iPad Pro 12.9 2018 (Safari Mobile 12) | |
| Average Apple A12X Bionic (44425 - 45734, n=2) | |
| Apple iPad Pro 12.9 2017 (Safari Mobile 10) | |
| Apple iPad 6 2018 (Safari Mobile 11.3) | |
| Microsoft Surface Pro 6, Core i5, 128 GB | |
| Apple iPad Pro 12.9 (Safari Mobile 9.0) | |
| Samsung Galaxy Tab S4 (Samsung Browser 8.0) | |
| Huawei MediaPad M5 10.8 Pro (Chrome 68.0.3440.91) | |
| Mozilla Kraken 1.1 - Total | |
| Huawei MediaPad M5 10.8 Pro (Chrome 68.0.3440.91) | |
| Samsung Galaxy Tab S4 (Samsung Browser 8.0) | |
| Average of class Tablet (243 - 27101, n=66, last 2 years) | |
| Apple iPad Pro 12.9 (Safari Mobile 9.0) | |
| Microsoft Surface Pro 6, Core i5, 128 GB | |
| Apple iPad 6 2018 (Safari Mobile 11.3) | |
| Apple iPad Pro 12.9 2017 (Safari Mobile 10) | |
| Apple iPad Pro 12.9 2018 (Safari Mobile 12) | |
| Average Apple A12X Bionic (603 - 614, n=2) | |
| WebXPRT 3 - Overall | |
| Average of class Tablet (108 - 480, n=10, last 2 years) | |
| Apple iPad Pro 12.9 2018 (Safari Mobile 12) | |
| Microsoft Surface Pro 6, Core i5, 128 GB (Edge 18) | |
| Average Apple A12X Bionic (172 - 182, n=2) | |
| Apple iPad Pro 12.9 (Safari Mobile 12) | |
| Apple iPad 6 2018 (Safari Mobile 10) | |
| Samsung Galaxy Tab S4 (Samsung Browser 8.0) | |
| Huawei MediaPad M5 10.8 Pro (Chrome 68.0.3440.91) | |
| WebXPRT 2015 - Overall | |
| Average Apple A12X Bionic (380 - 386, n=2) | |
| Apple iPad Pro 12.9 2018 (Safari Mobile 12) | |
| Apple iPad Pro 12.9 2017 (Safari Mobile 10) | |
| Apple iPad Pro 12.9 (Safari Mobile 9.0) | |
| Apple iPad 6 2018 (Safari Mobile 11.3) | |
| Samsung Galaxy Tab S4 (Samsung Browser 8.0) | |
| Huawei MediaPad M5 10.8 Pro (Chrome 68.0.3440.91) | |
* ... smaller is better
Battle Bay
PUBG Mobile
Arena of Valor
Asphalt 9: Legends
World of Tanks Blitz
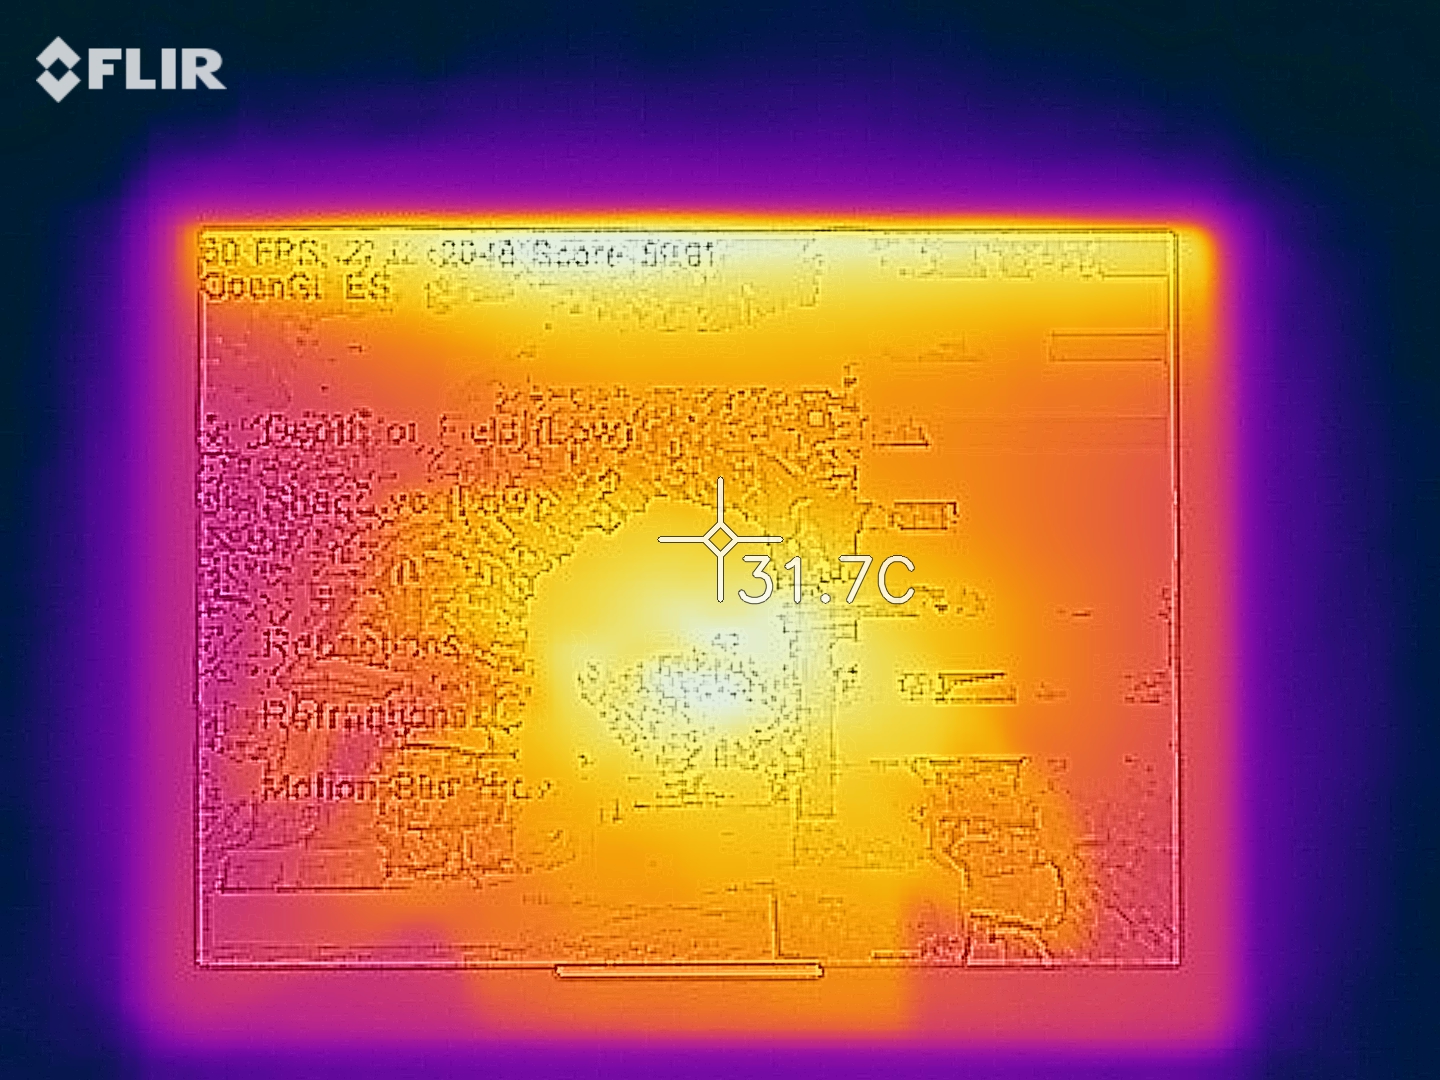
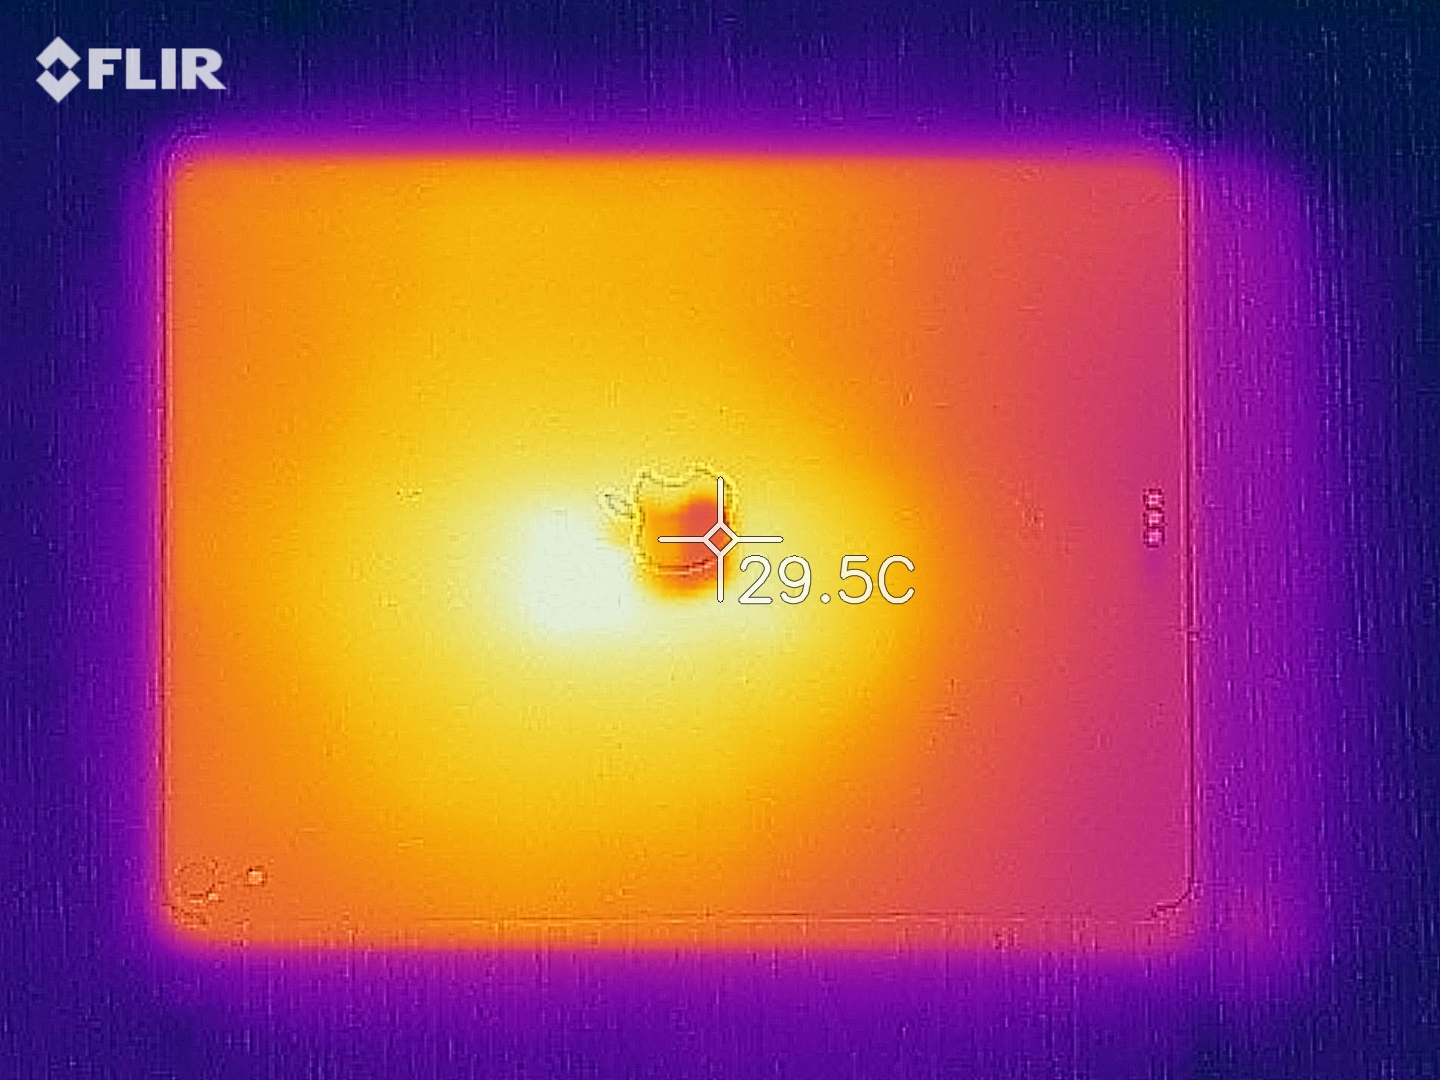
(+) The maximum temperature on the upper side is 38.3 °C / 101 F, compared to the average of 33.6 °C / 92 F, ranging from 20.7 to 53.2 °C for the class Tablet.
(+) The bottom heats up to a maximum of 38.8 °C / 102 F, compared to the average of 33.2 °C / 92 F
(±) In idle usage, the average temperature for the upper side is 32.3 °C / 90 F, compared to the device average of 30 °C / 86 F.
Apple iPad Pro 12.9 2018 audio analysis
(+) | speakers can play relatively loud (82.9 dB)
Bass 100 - 315 Hz
(±) | reduced bass - on average 7.8% lower than median
(±) | linearity of bass is average (12.1% delta to prev. frequency)
Mids 400 - 2000 Hz
(+) | balanced mids - only 3.1% away from median
(+) | mids are linear (4.4% delta to prev. frequency)
Highs 2 - 16 kHz
(+) | balanced highs - only 2.2% away from median
(+) | highs are linear (4.1% delta to prev. frequency)
Overall 100 - 16.000 Hz
(+) | overall sound is linear (9.7% difference to median)
Compared to same class
» 4% of all tested devices in this class were better, 3% similar, 93% worse
» The best had a delta of 7%, average was 20%, worst was 129%
Compared to all devices tested
» 4% of all tested devices were better, 1% similar, 95% worse
» The best had a delta of 4%, average was 24%, worst was 134%
Samsung Galaxy Tab S4 audio analysis
(±) | speaker loudness is average but good (80.1 dB)
Bass 100 - 315 Hz
(-) | nearly no bass - on average 18% lower than median
(-) | bass is not linear (18.7% delta to prev. frequency)
Mids 400 - 2000 Hz
(+) | balanced mids - only 4.3% away from median
(+) | mids are linear (1.9% delta to prev. frequency)
Highs 2 - 16 kHz
(+) | balanced highs - only 3.3% away from median
(±) | linearity of highs is average (7% delta to prev. frequency)
Overall 100 - 16.000 Hz
(±) | linearity of overall sound is average (19.2% difference to median)
Compared to same class
» 52% of all tested devices in this class were better, 6% similar, 41% worse
» The best had a delta of 7%, average was 20%, worst was 129%
Compared to all devices tested
» 46% of all tested devices were better, 7% similar, 47% worse
» The best had a delta of 4%, average was 24%, worst was 134%
| Off / Standby | |
| Idle | |
| Load |
|
Key:
min: | |
| Apple iPad Pro 12.9 2018 mAh | Apple iPad Pro 12.9 2017 10875 mAh | Samsung Galaxy Tab S4 7300 mAh | Huawei MediaPad M5 10.8 Pro 7500 mAh | Apple iPad 6 2018 mAh | Microsoft Surface Pro 6, Core i5, 128 GB mAh | |
|---|---|---|---|---|---|---|
| Power Consumption | 11% | 40% | -5% | -1% | -86% | |
| Idle Minimum * (Watt) | 1.42 | 1.55 -9% | 1.76 -24% | 3.3 -132% | 2.2 -55% | 4.3 -203% |
| Idle Average * (Watt) | 9.35 | 8.58 8% | 4.22 55% | 4.2 55% | 7.8 17% | 8.7 7% |
| Idle Maximum * (Watt) | 9.38 | 8.59 8% | 4.25 55% | 7 25% | 7.9 16% | 9.4 -0% |
| Load Average * (Watt) | 12.75 | 10.09 21% | 4.52 65% | 10.4 18% | 12.6 1% | 24.5 -92% |
| Load Maximum * (Watt) | 14.96 | 10.61 29% | 7.35 51% | 13.8 8% | 12.8 14% | 36 -141% |
* ... smaller is better
| Apple iPad Pro 12.9 2018 mAh | Apple iPad Pro 12.9 2017 10875 mAh | Samsung Galaxy Tab S4 7300 mAh | Huawei MediaPad M5 10.8 Pro 7500 mAh | Apple iPad 6 2018 mAh | Microsoft Surface Pro 6, Core i5, 128 GB mAh | |
|---|---|---|---|---|---|---|
| Battery runtime | 15% | -15% | -15% | -6% | -37% | |
| Reader / Idle (h) | 31.5 | 48.7 55% | 20.5 -35% | 20.9 -34% | 17.8 -43% | |
| H.264 (h) | 15 | 11.3 -25% | 12.3 -18% | 10.5 -30% | ||
| WiFi v1.3 (h) | 13.3 | 12.3 -8% | 8.3 -38% | 11.2 -16% | 11.9 -11% | 9.1 -32% |
| Load (h) | 3.1 | 4.3 39% | 4.1 32% | 3.7 19% | 3.1 0% | 2 -35% |
Pros
Cons
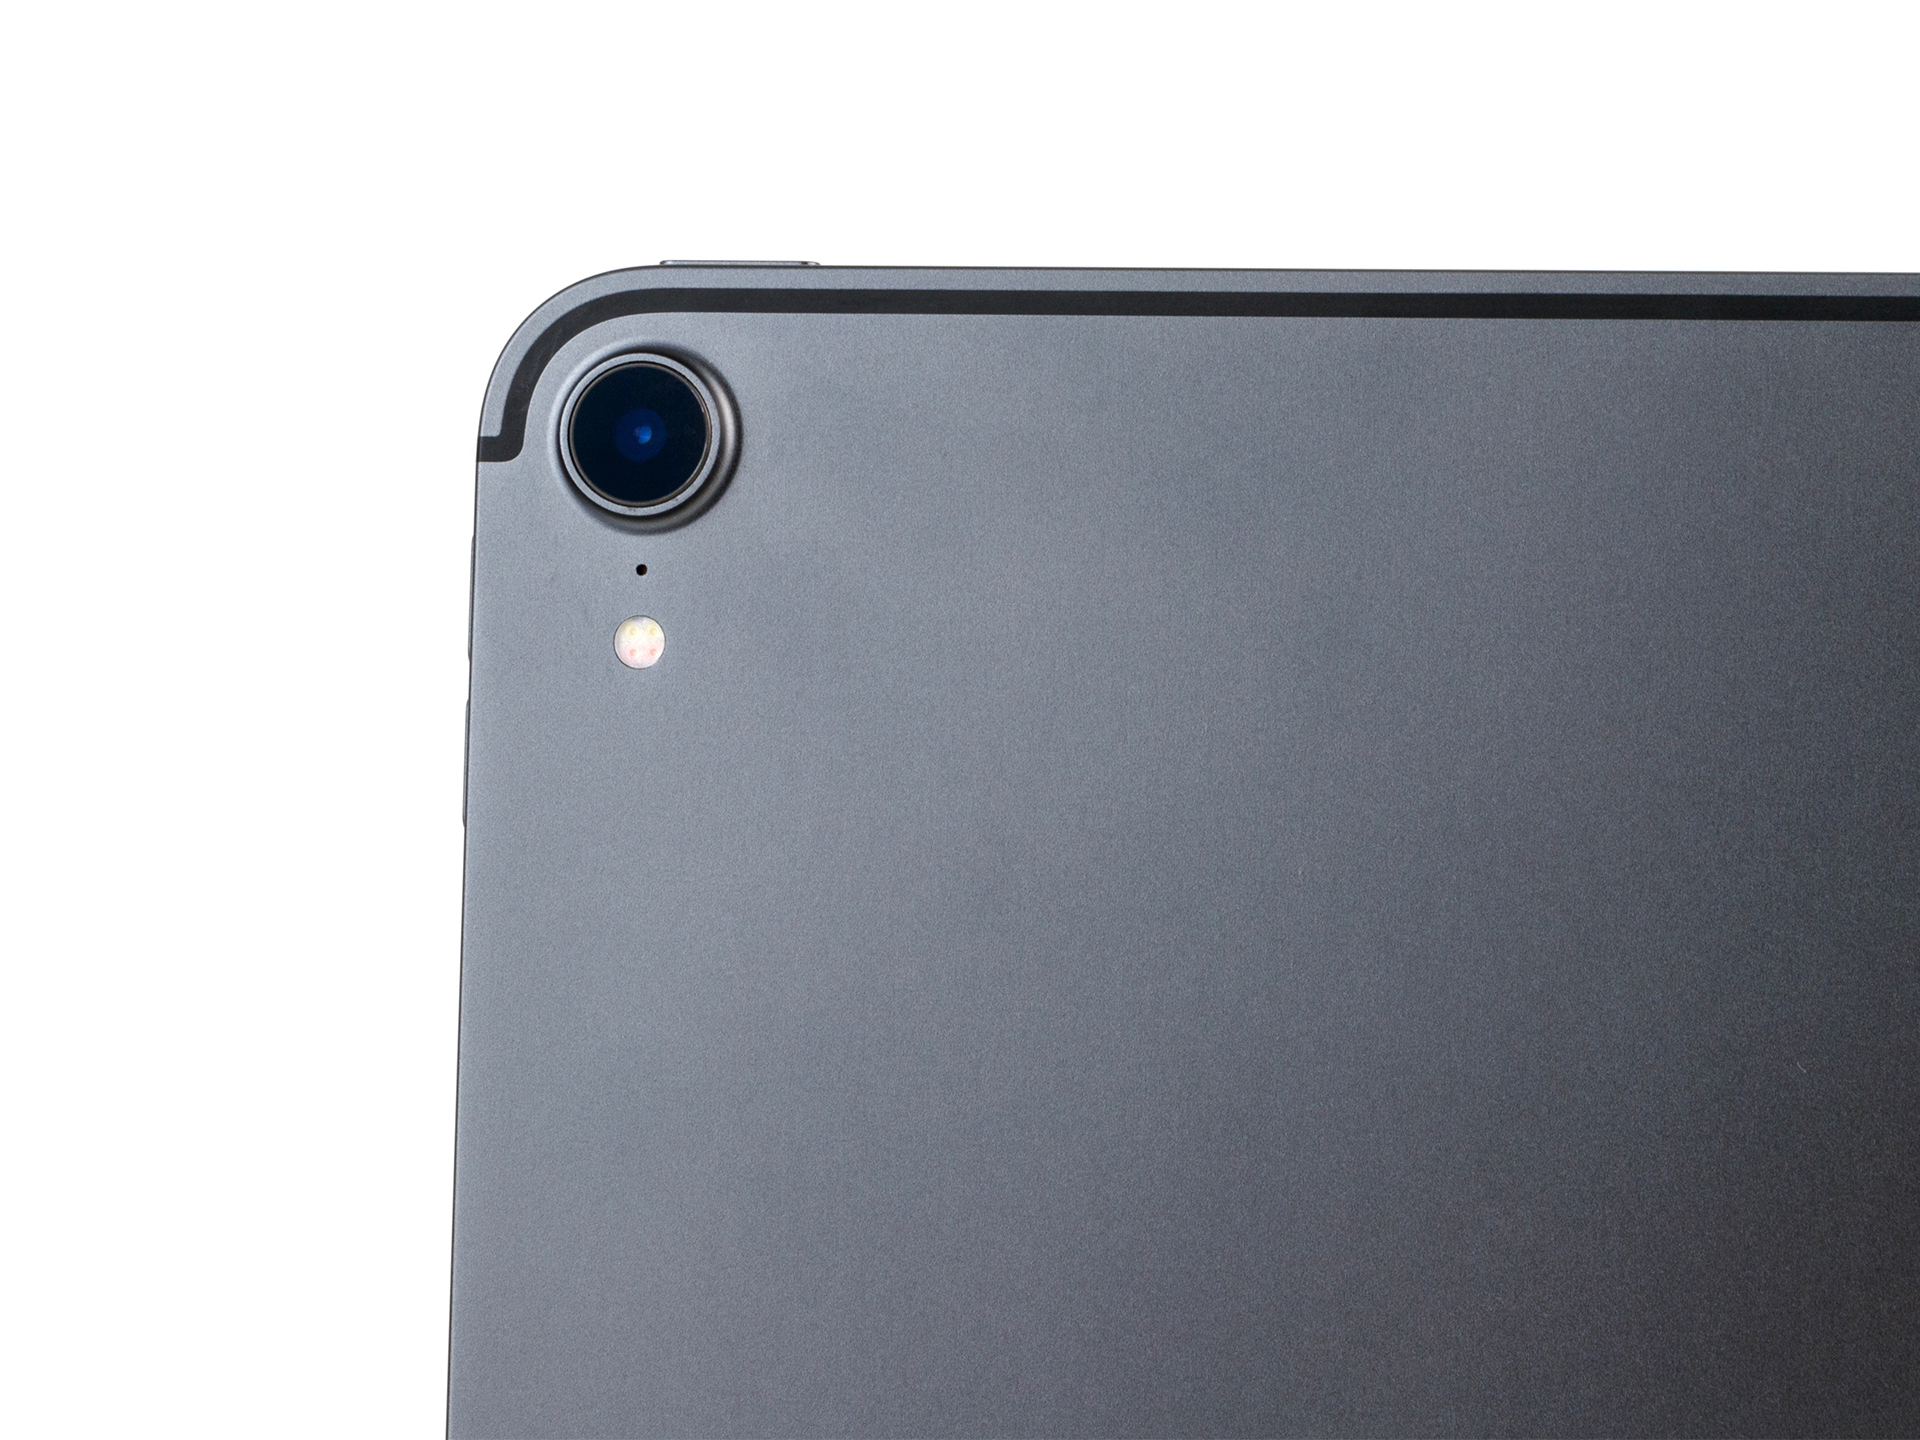
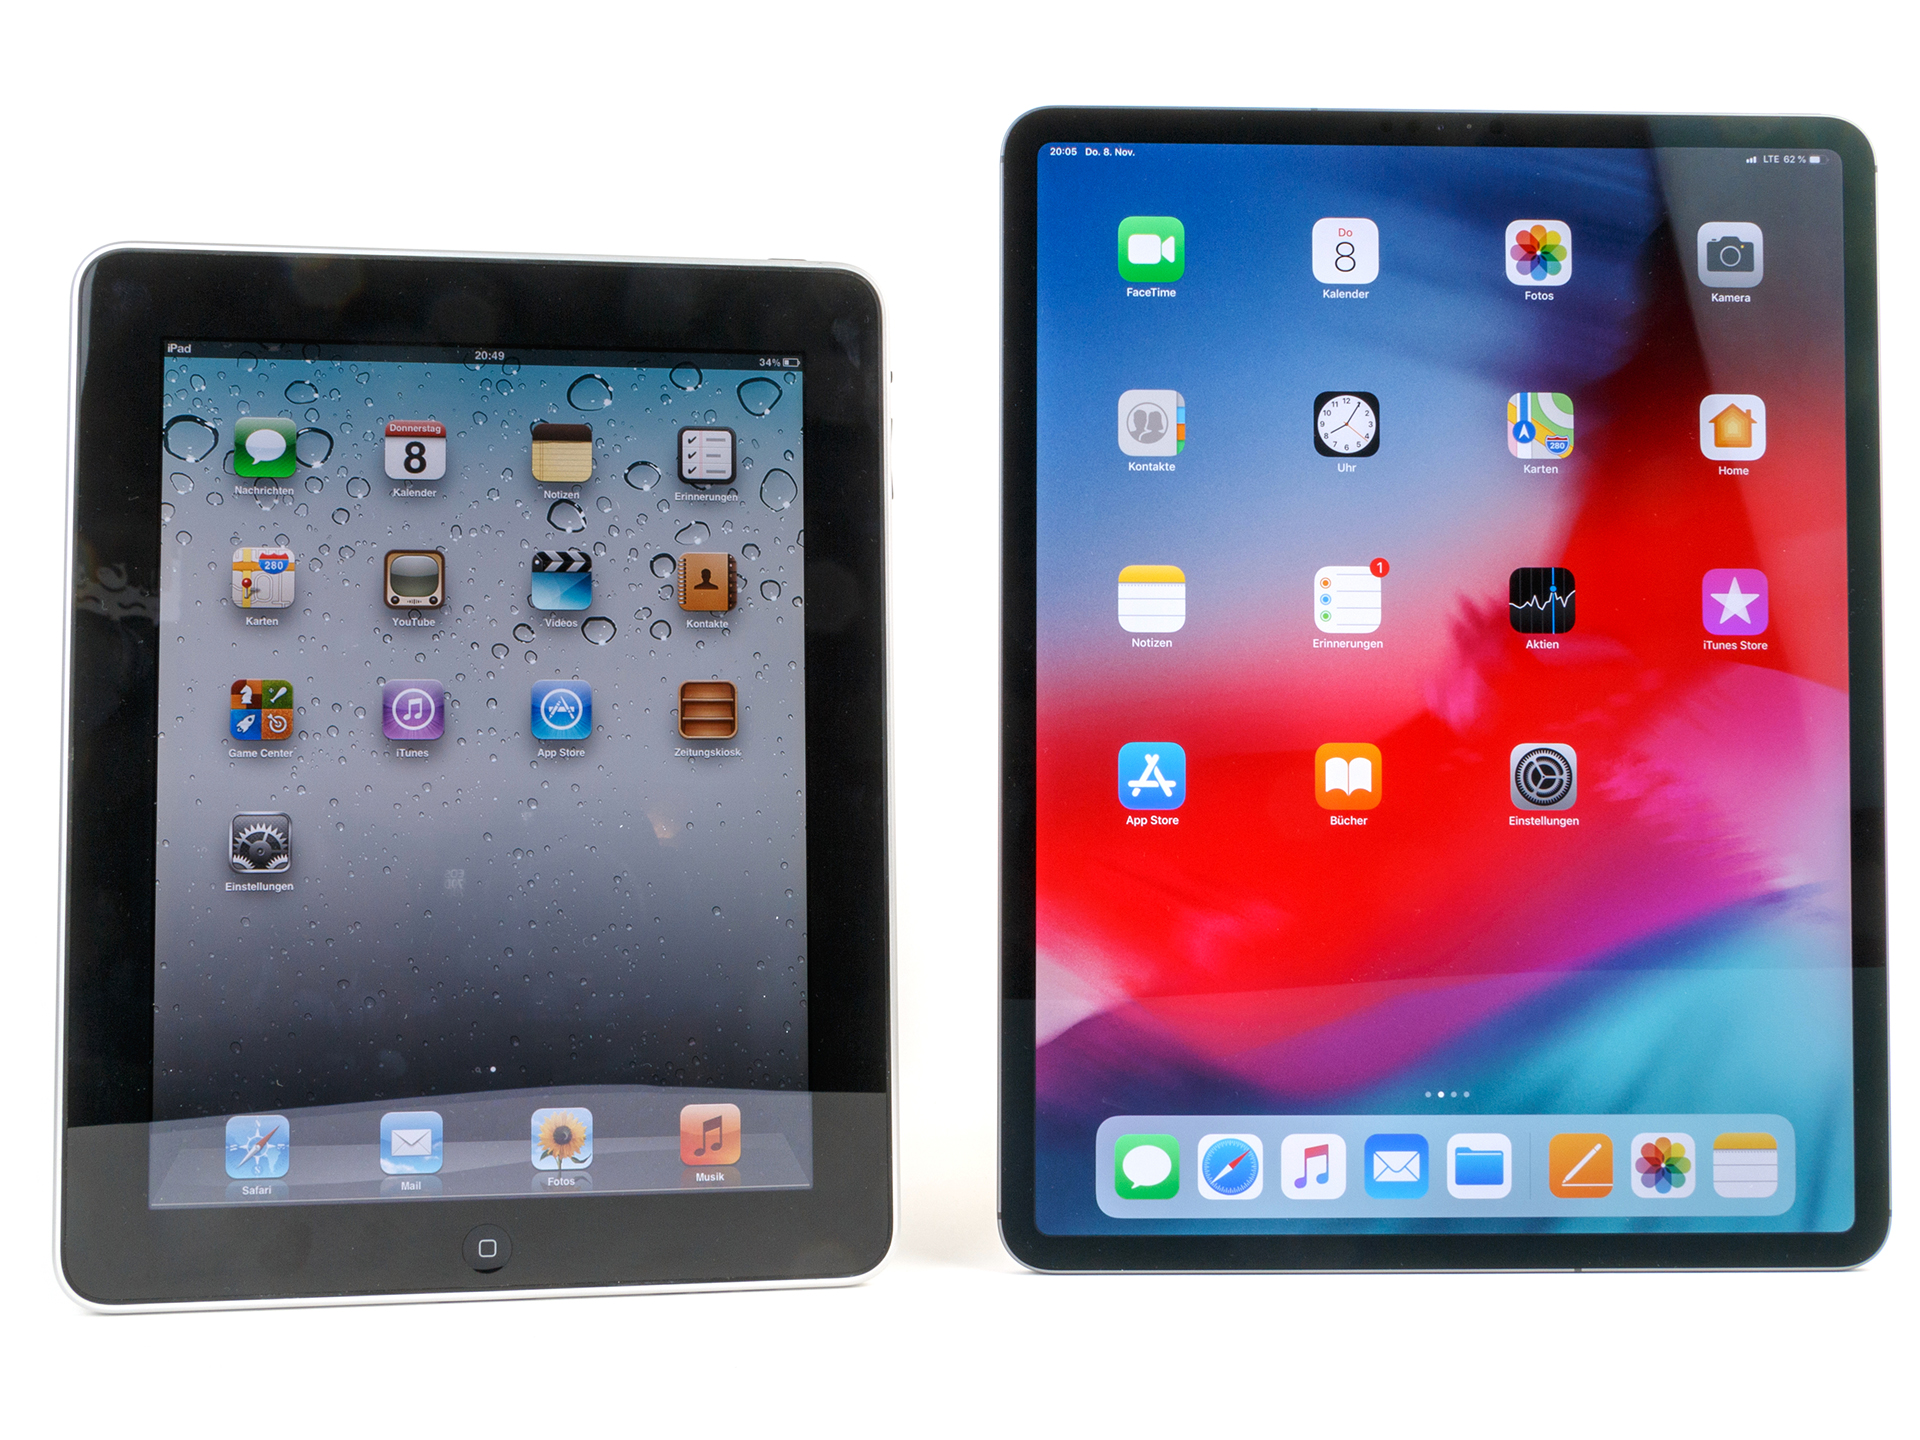
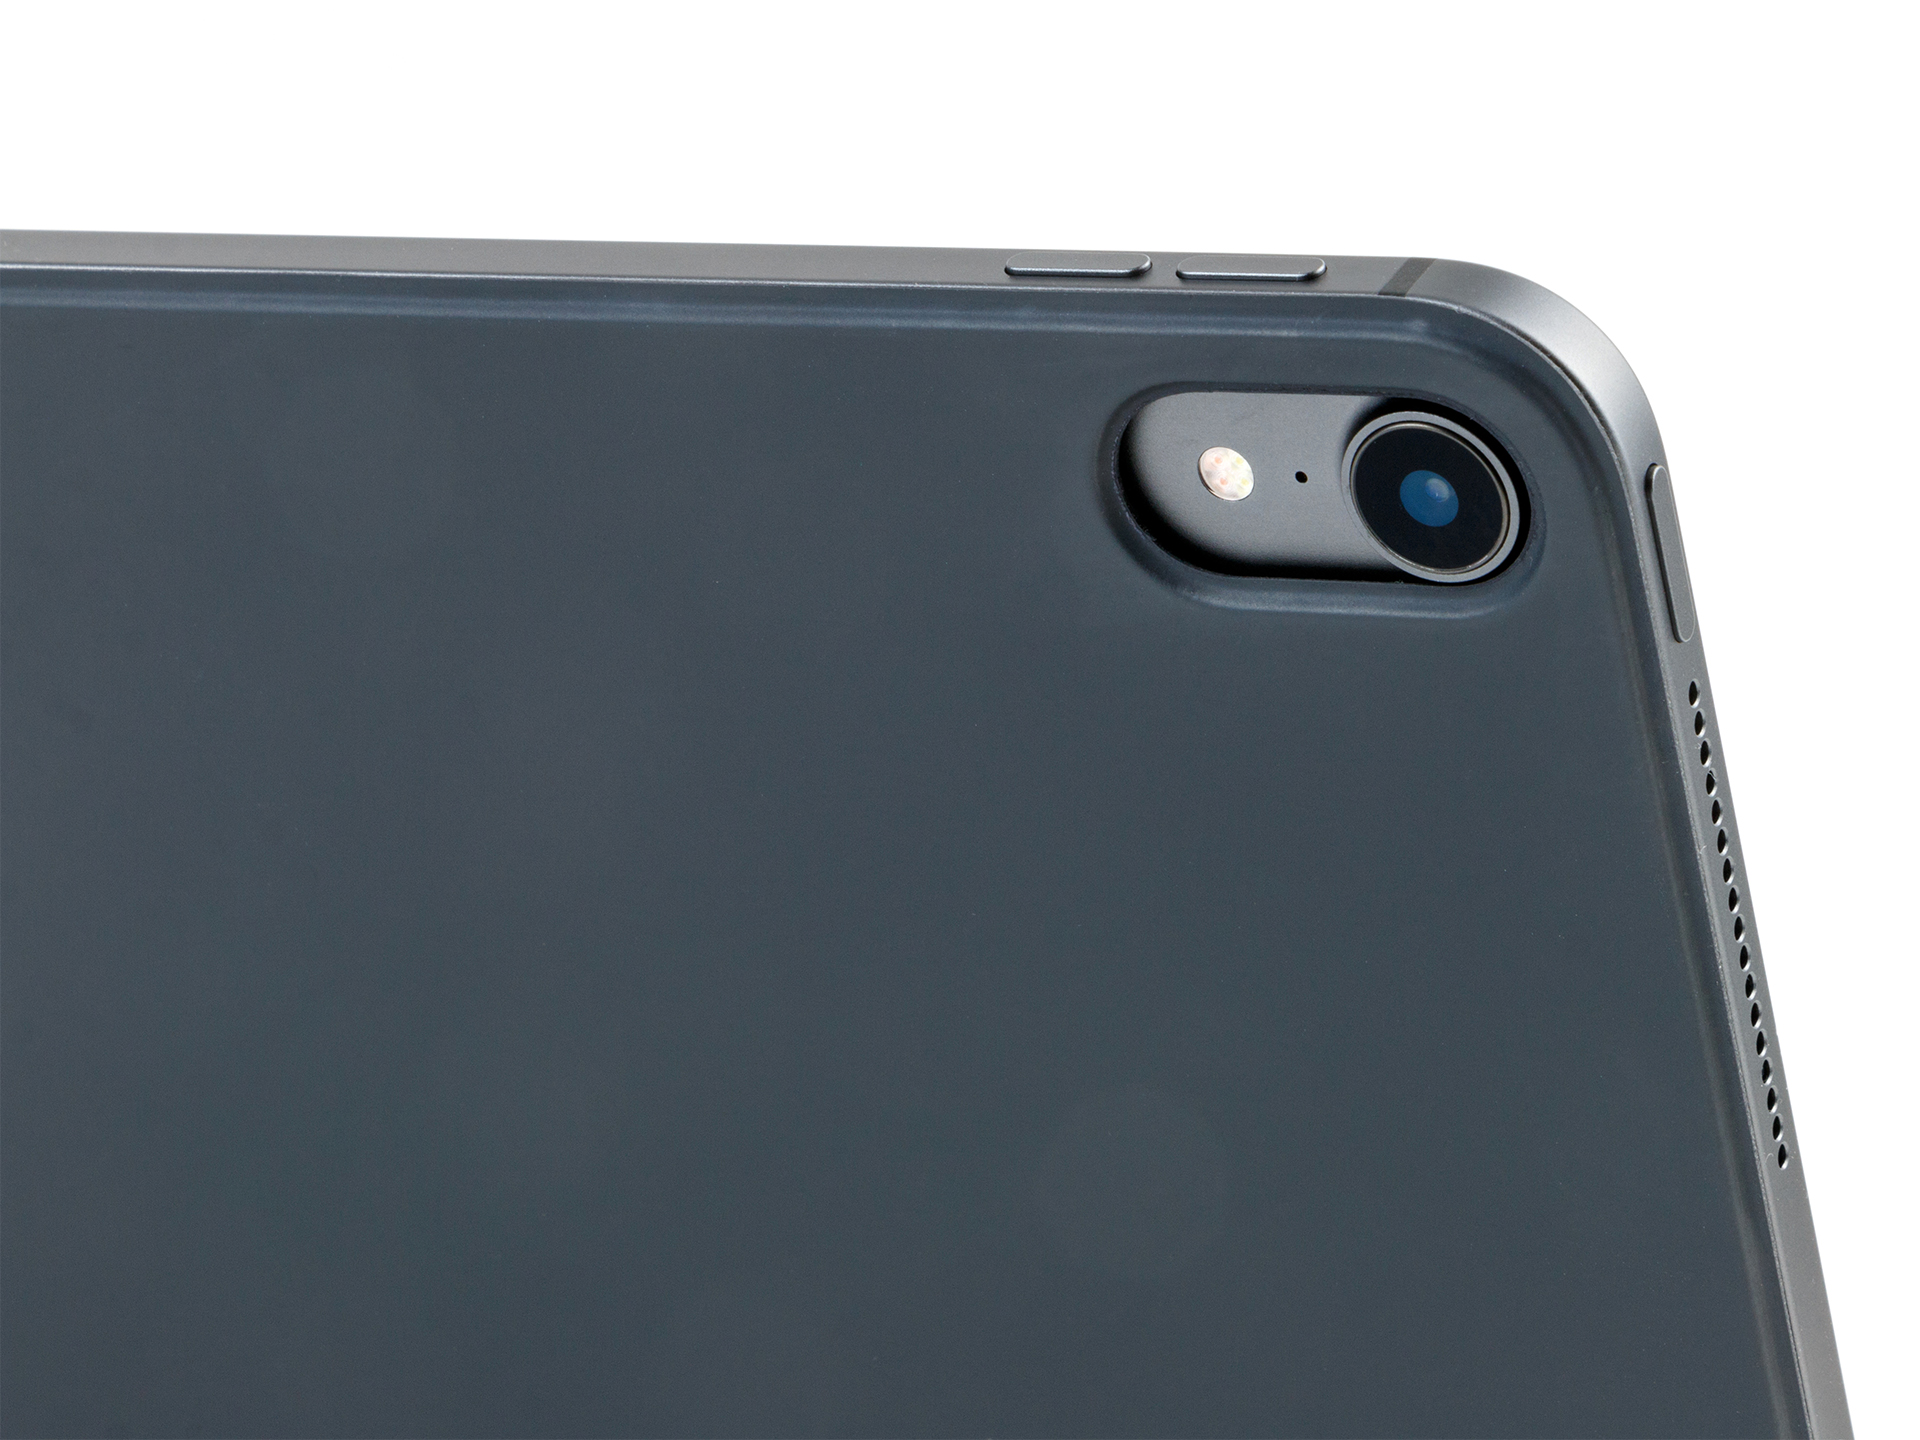
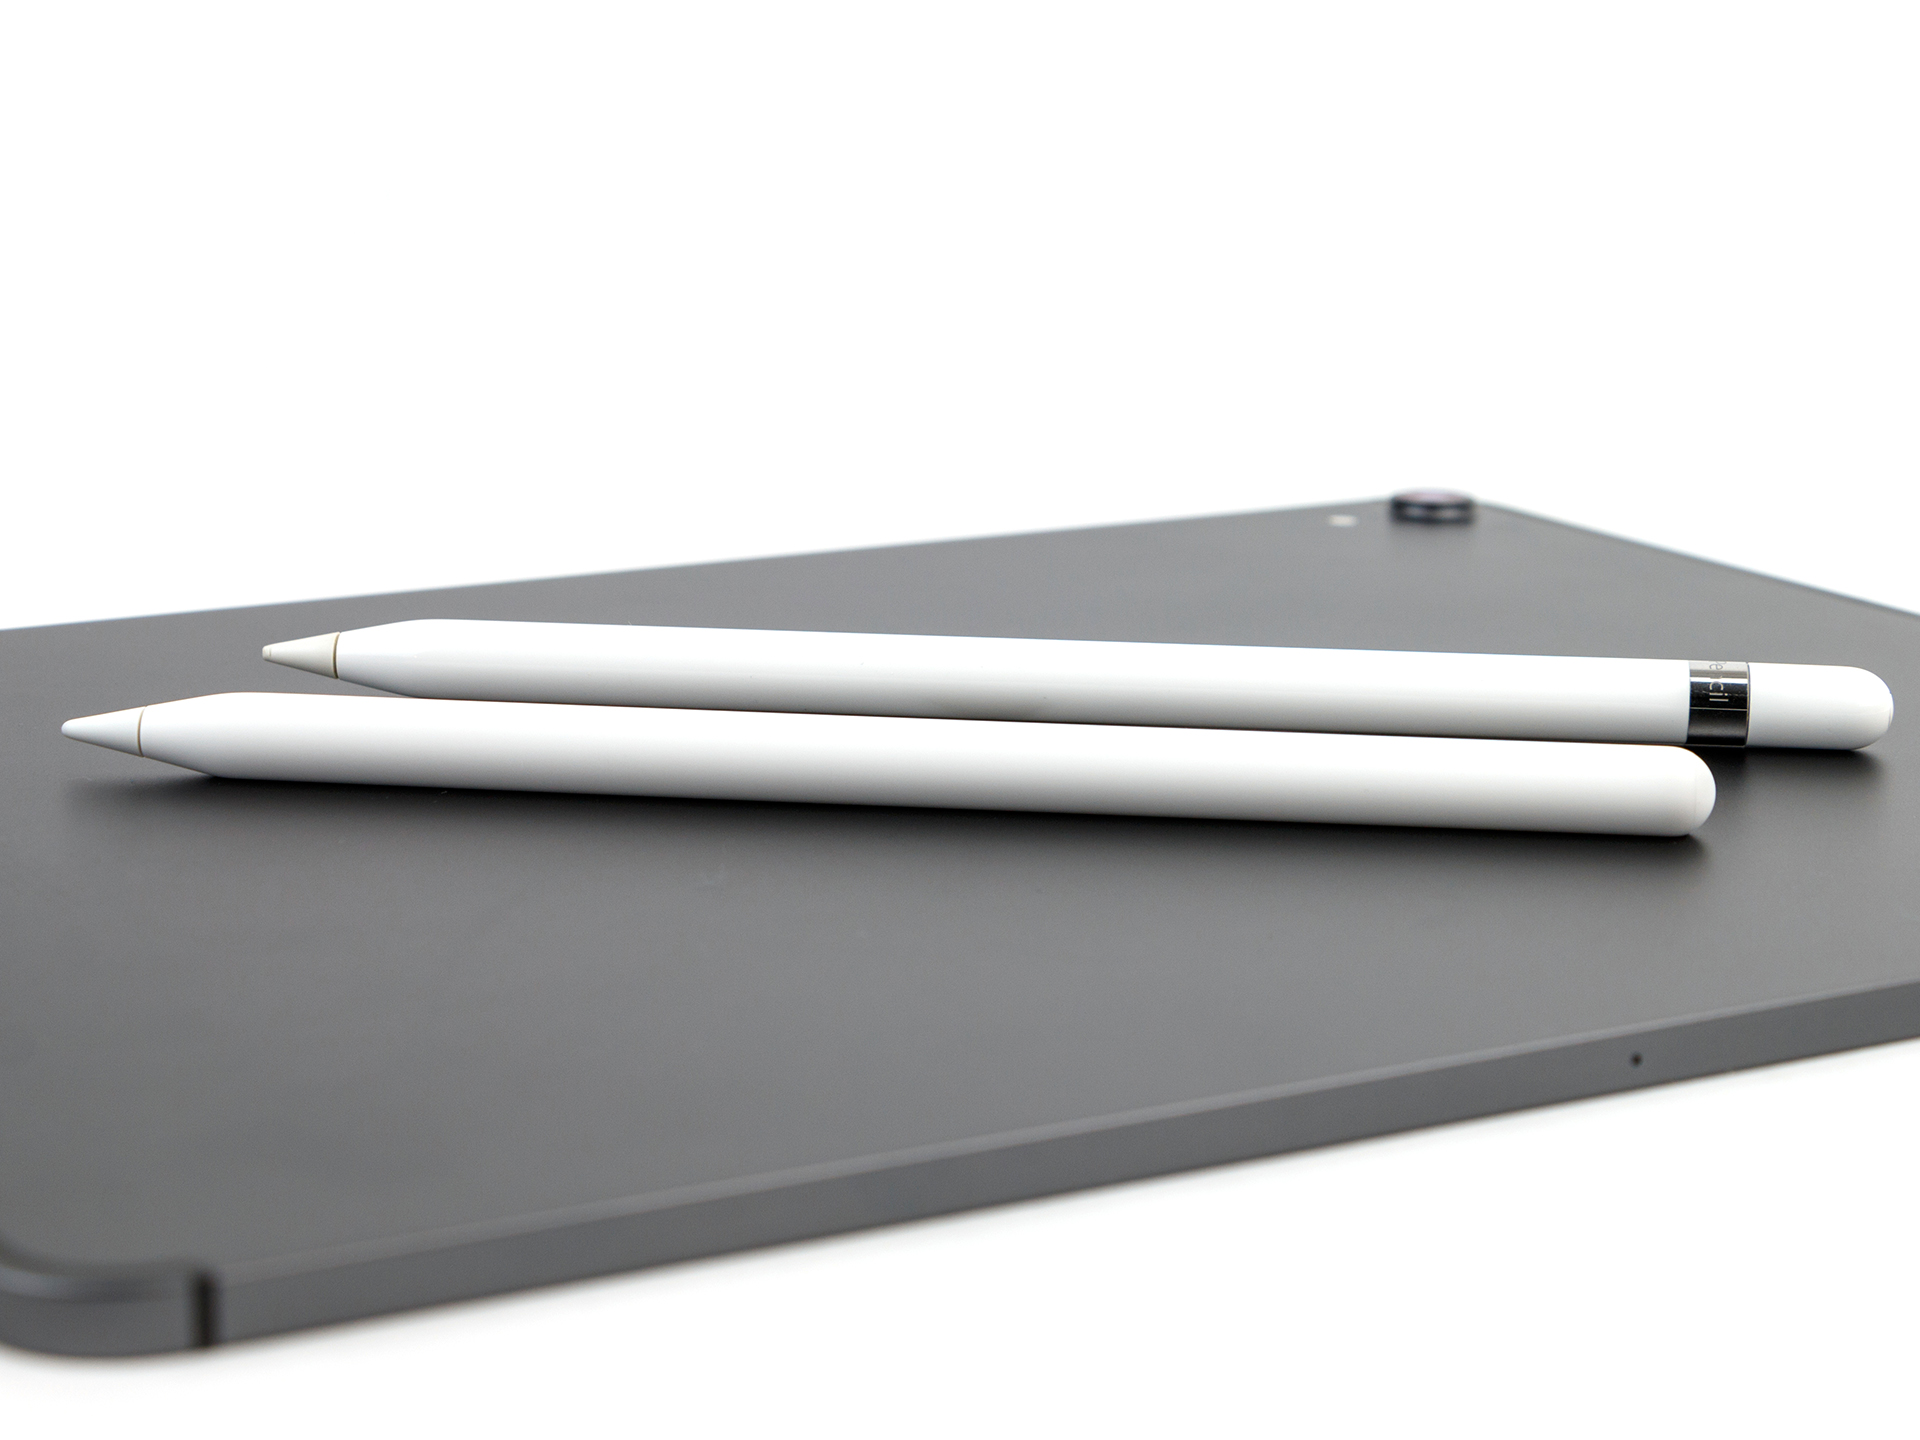
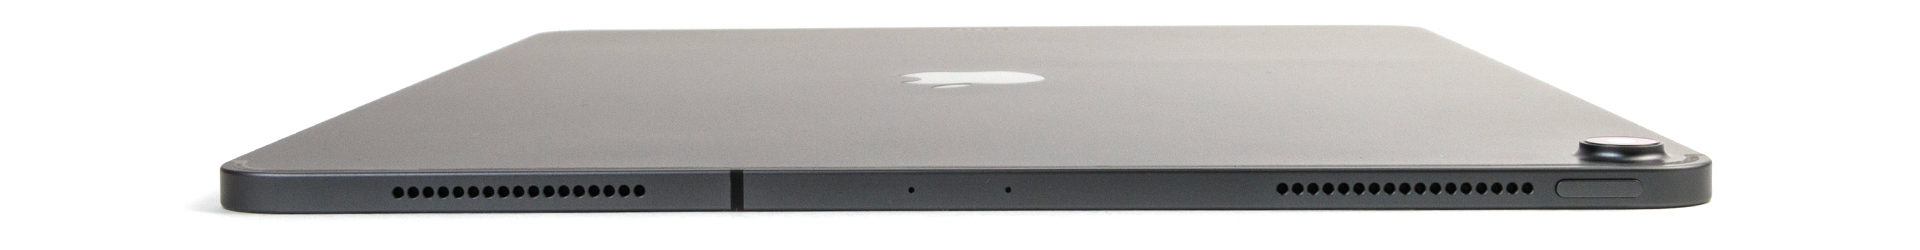
2018款苹果iPad Pro 12.9不仅仅在发布会上给我们留下了深刻的印象,我们在收到设备时也被震撼到了。它仍然是一台巨大的平板电脑,但它比上一代更轻。新Apple Pencil的手感也很棒。
新款iPad Pro 12.9最大的吸引力在于它的性能,苹果声称其性能超过了92%发布于2018年的笔记本电脑。苹果还声称A12X的GPU性能与Xbox One S相媲美。这一次苹果真的夸下了海口,但是恐怕新iPad Pro 12.9并不能达到他们宣传的水准。A12X的确是现在市场上性能最强的ARM芯片,但是和x86处理器仍然没有什么可比性。
“第三代iPad Pro 12.9是一台出色的平板电脑,并且是用钱能买到的最强大的ARM设备。然而iOS的局限性不幸让iPad Pro继续沦为笔记本电脑的替代品,即使它明明已经足够强大。”
iPad Pro 12.9的最大缺点是iOS,这个操作系统仍然没有可用的文件管理系统,也无法读取任何外部USB设备。三星的Galaxy Tab S4在这方面就具有无限的灵活性。对于只需要影音娱乐和轻度办公的用户,他们对iPad Pro 12.9会非常满意,即使价格昂贵。然而,三代更新过后,苹果仍然没能兑现iPad可以做到代替笔记本电脑的承诺。
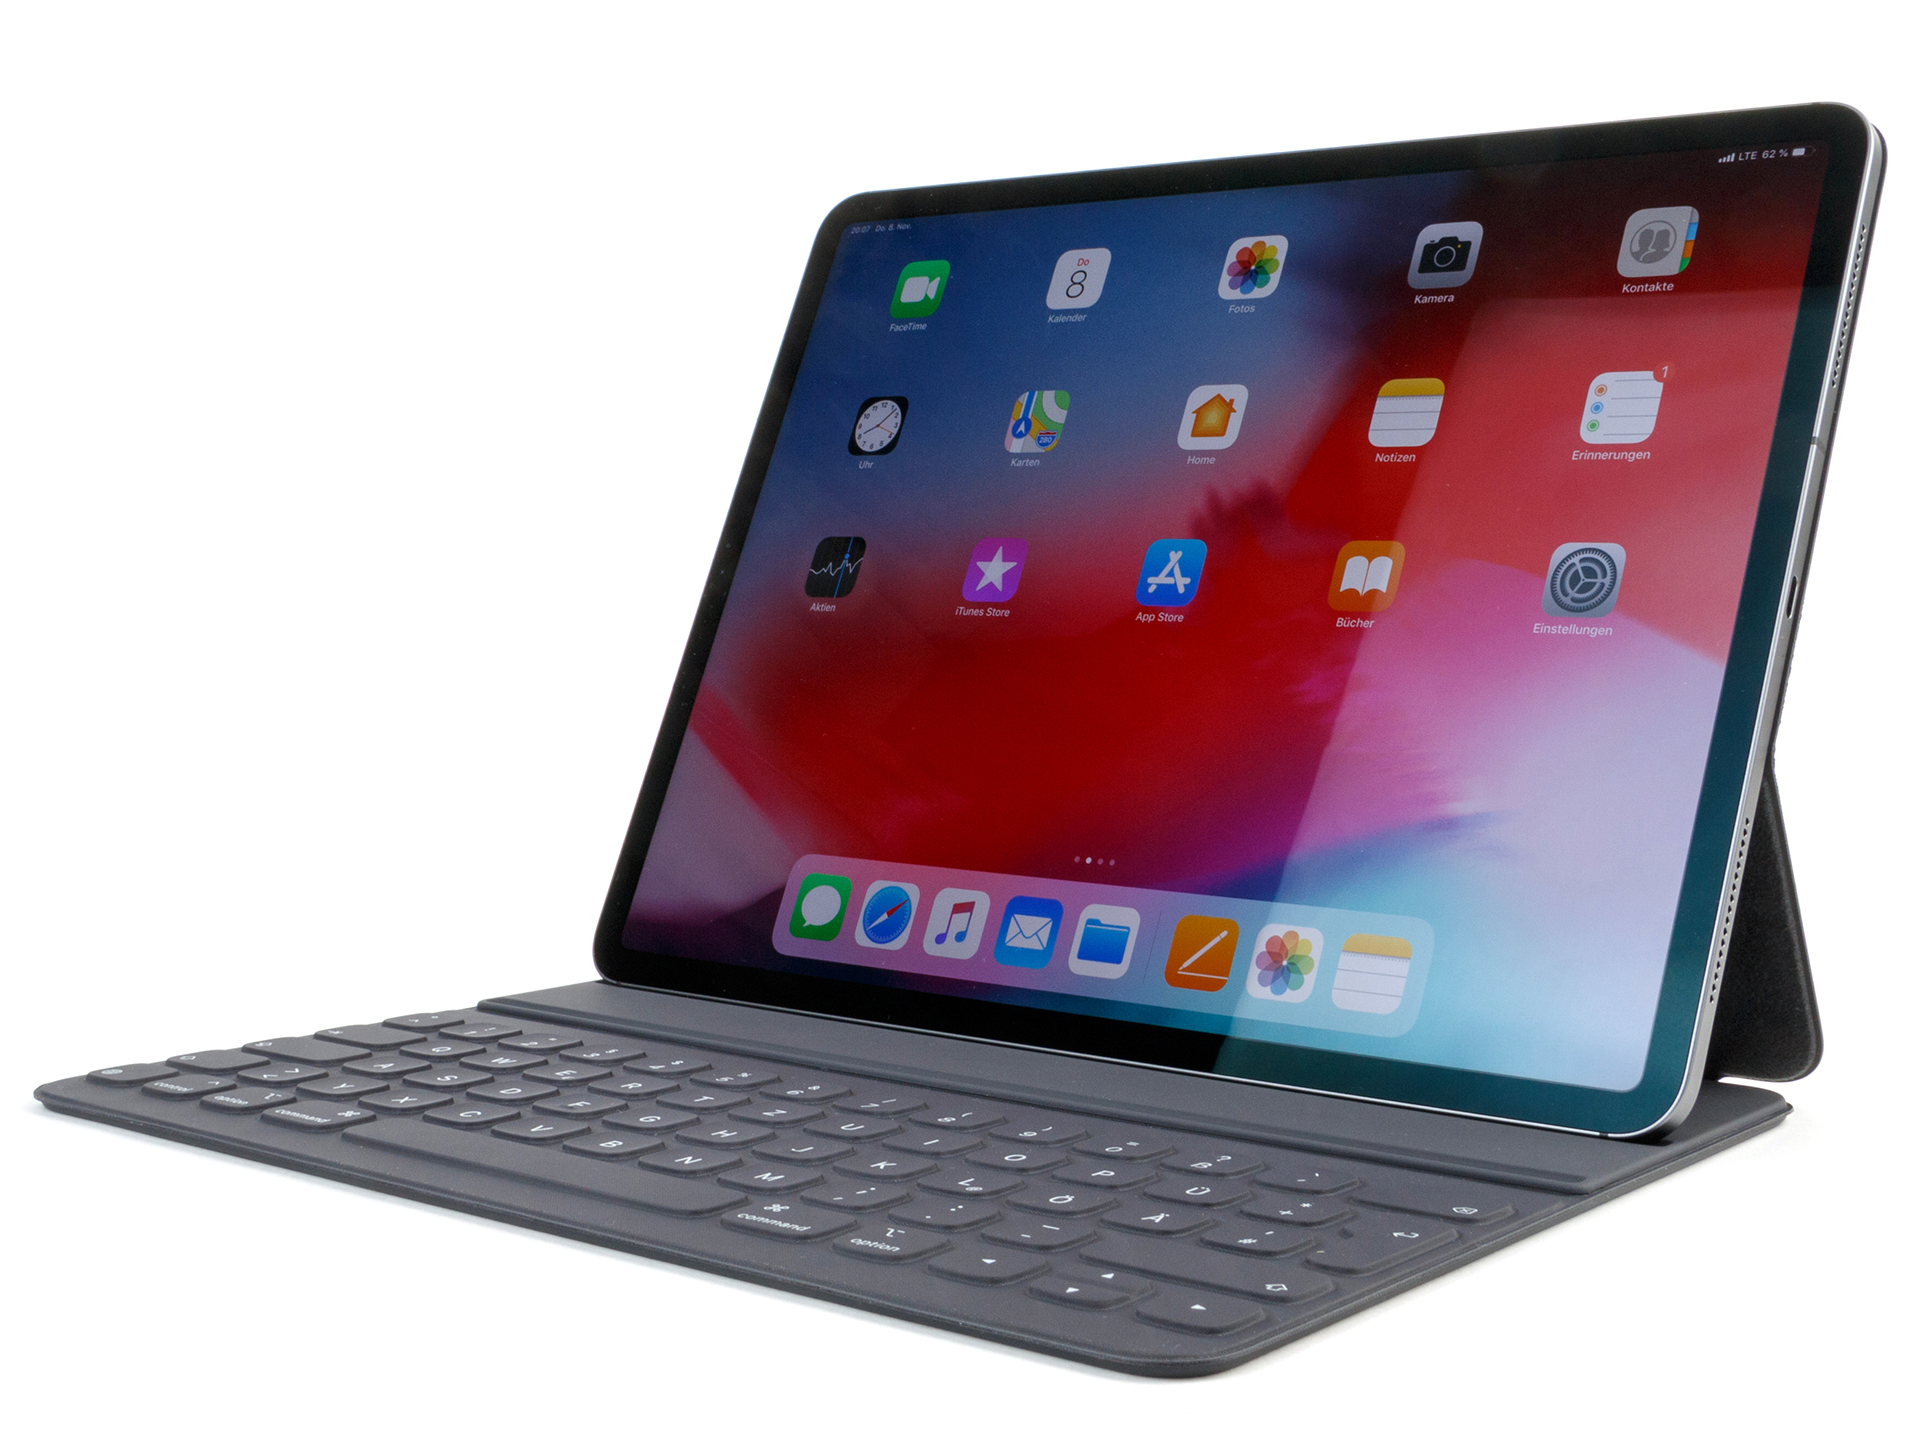
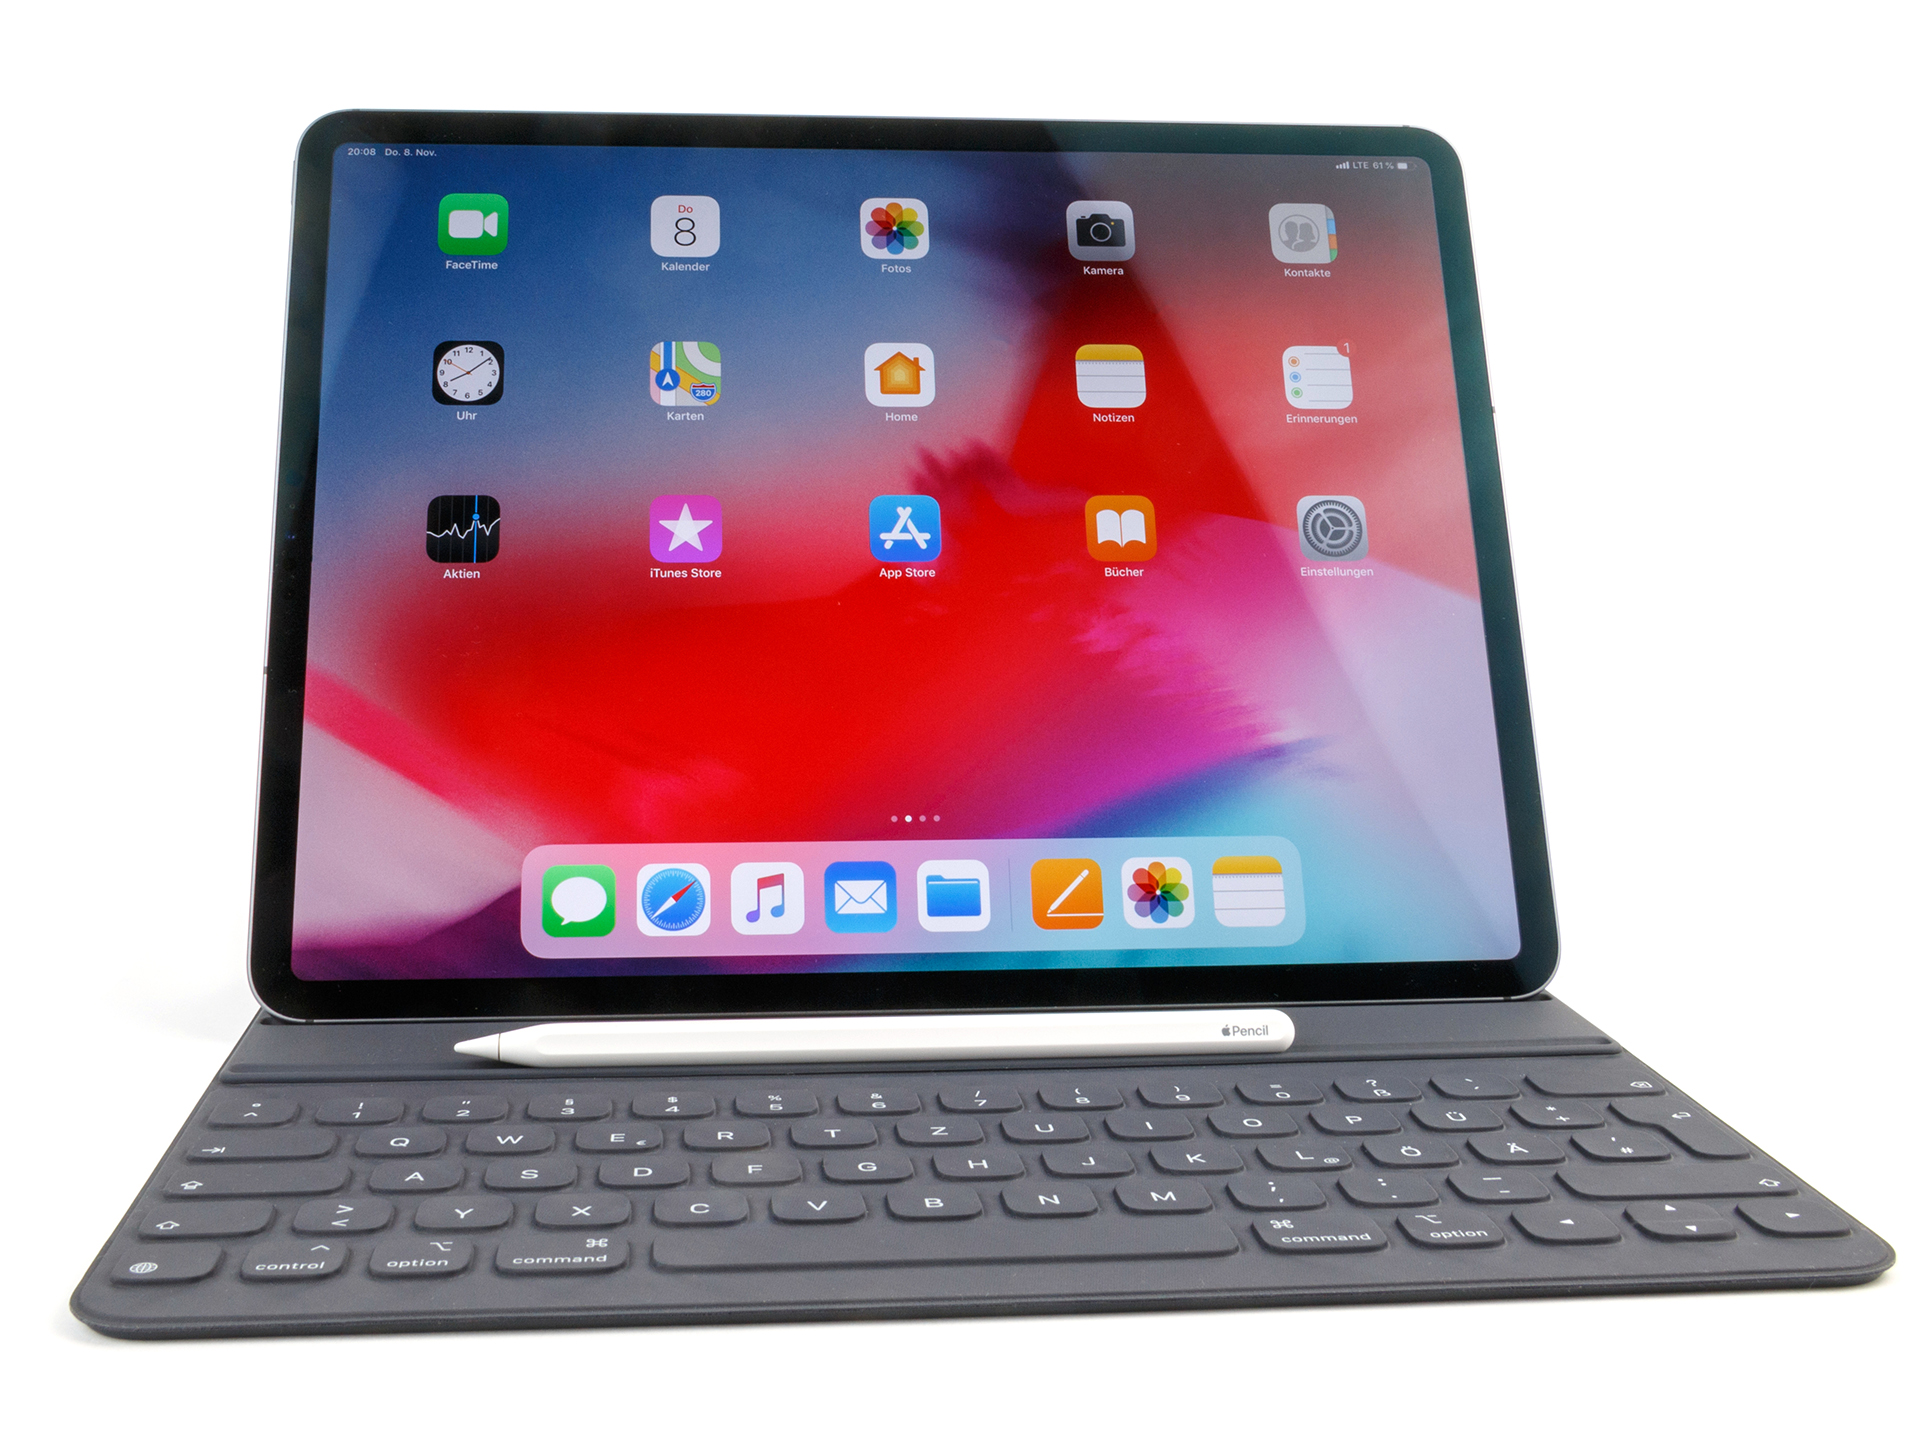
全新iPad Pro 12.9非常适合那些需要Apple Pencil并且懂得怎么用的人。如果您需要在旅途中使用该设备,我们建议您选择11寸的机型。此外,如果只是用于影音娱乐,64GB版本对大部分用户来说应该够用。
Apple iPad Pro 12.9 2018
- 09/16/2019 v7 (old)
Daniel Schmidt
Price comparison

