苹果iPad Pro 11(2018款,Wi-Fi版,64 GB)平板电脑评测


| |||||||||||||||||||||||||
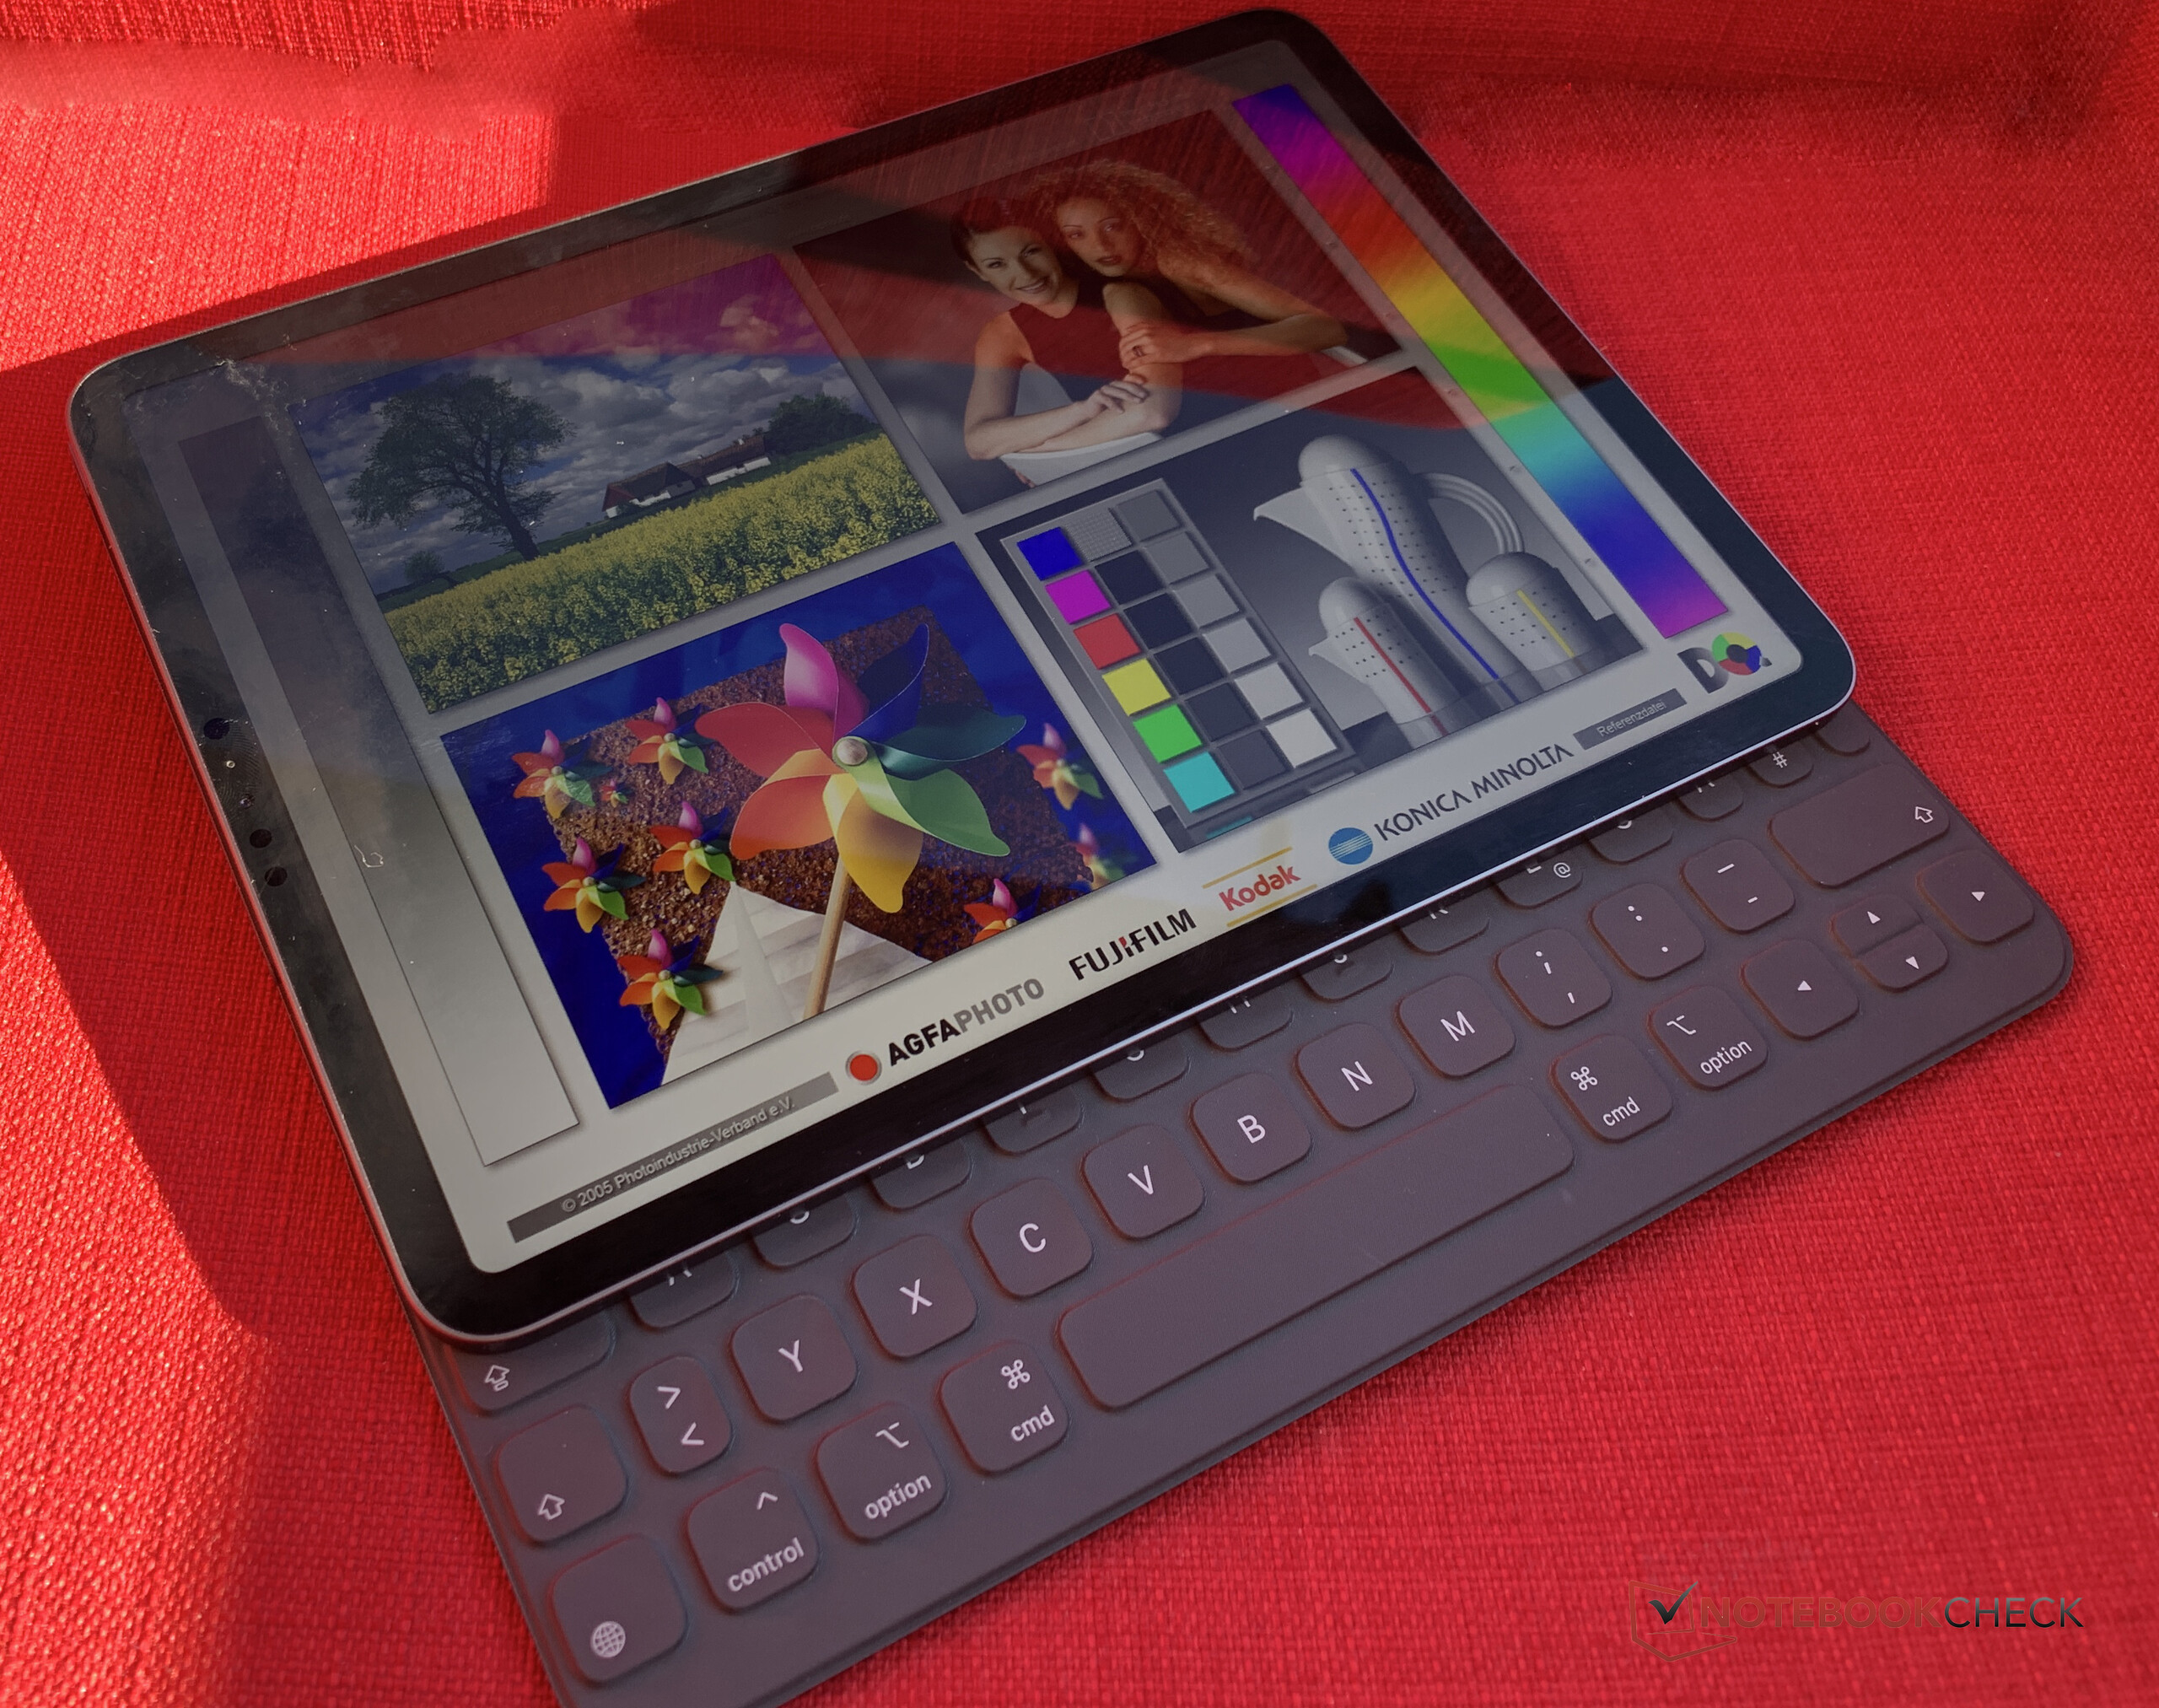
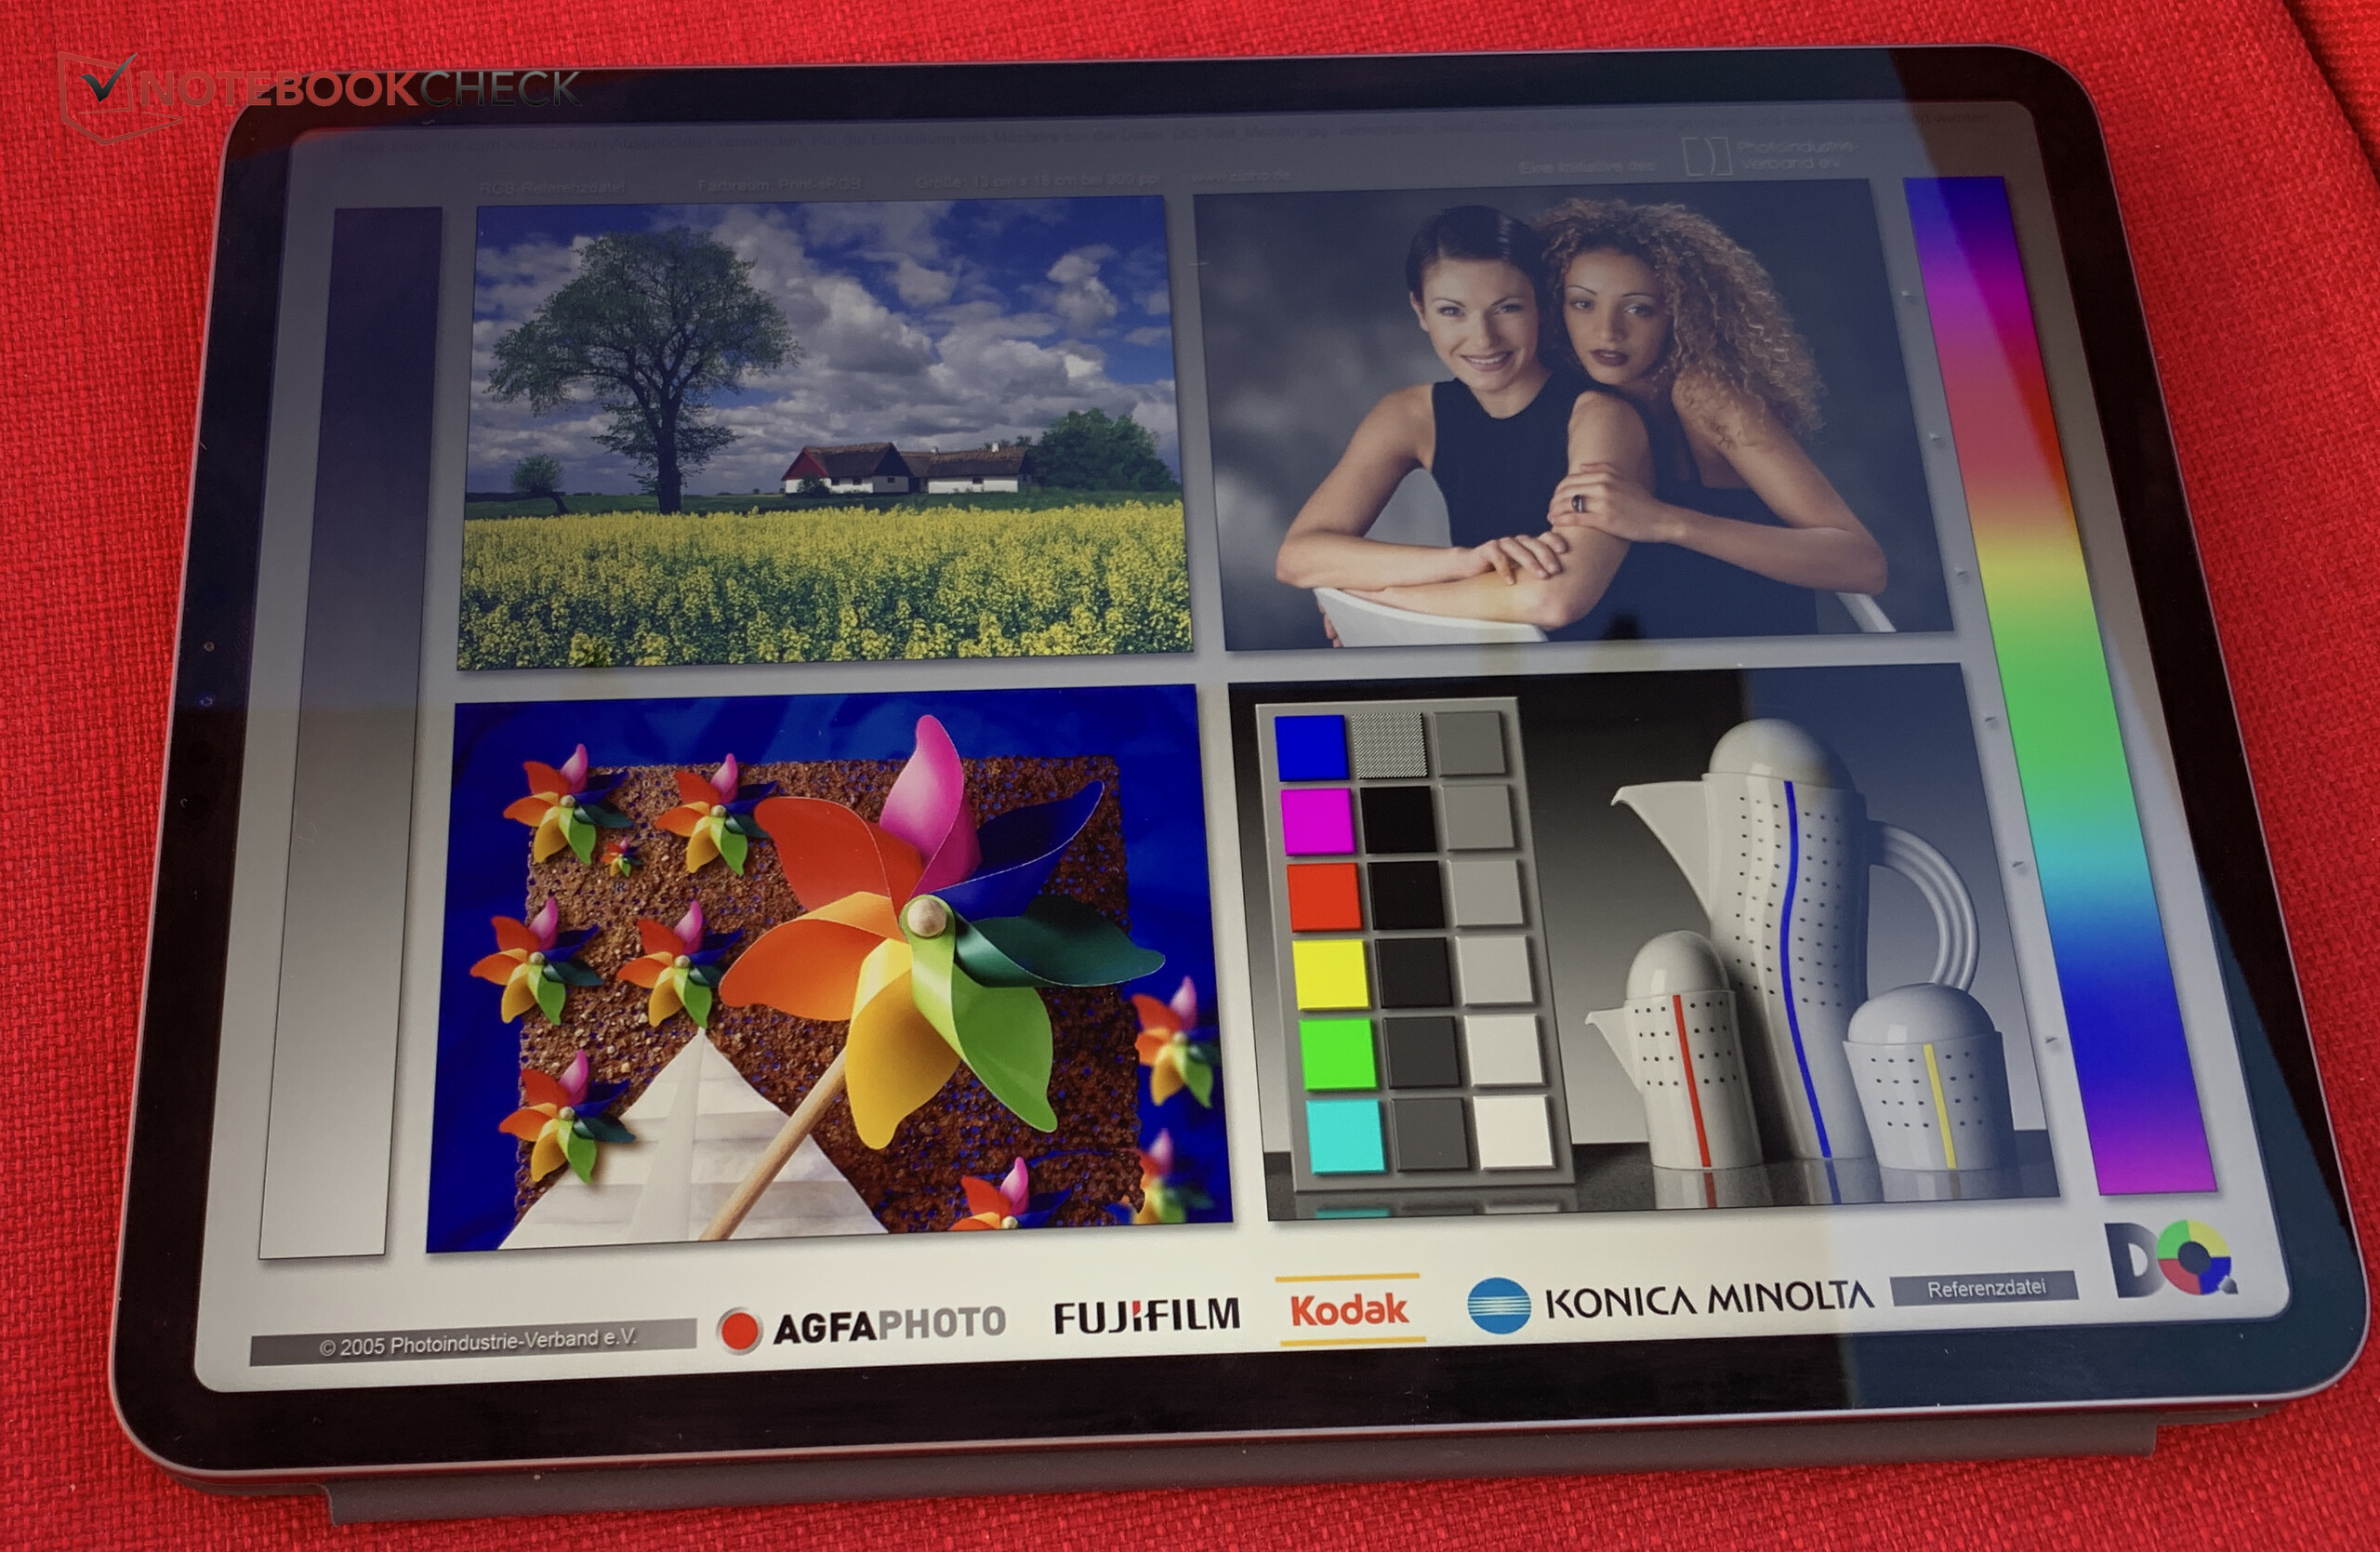
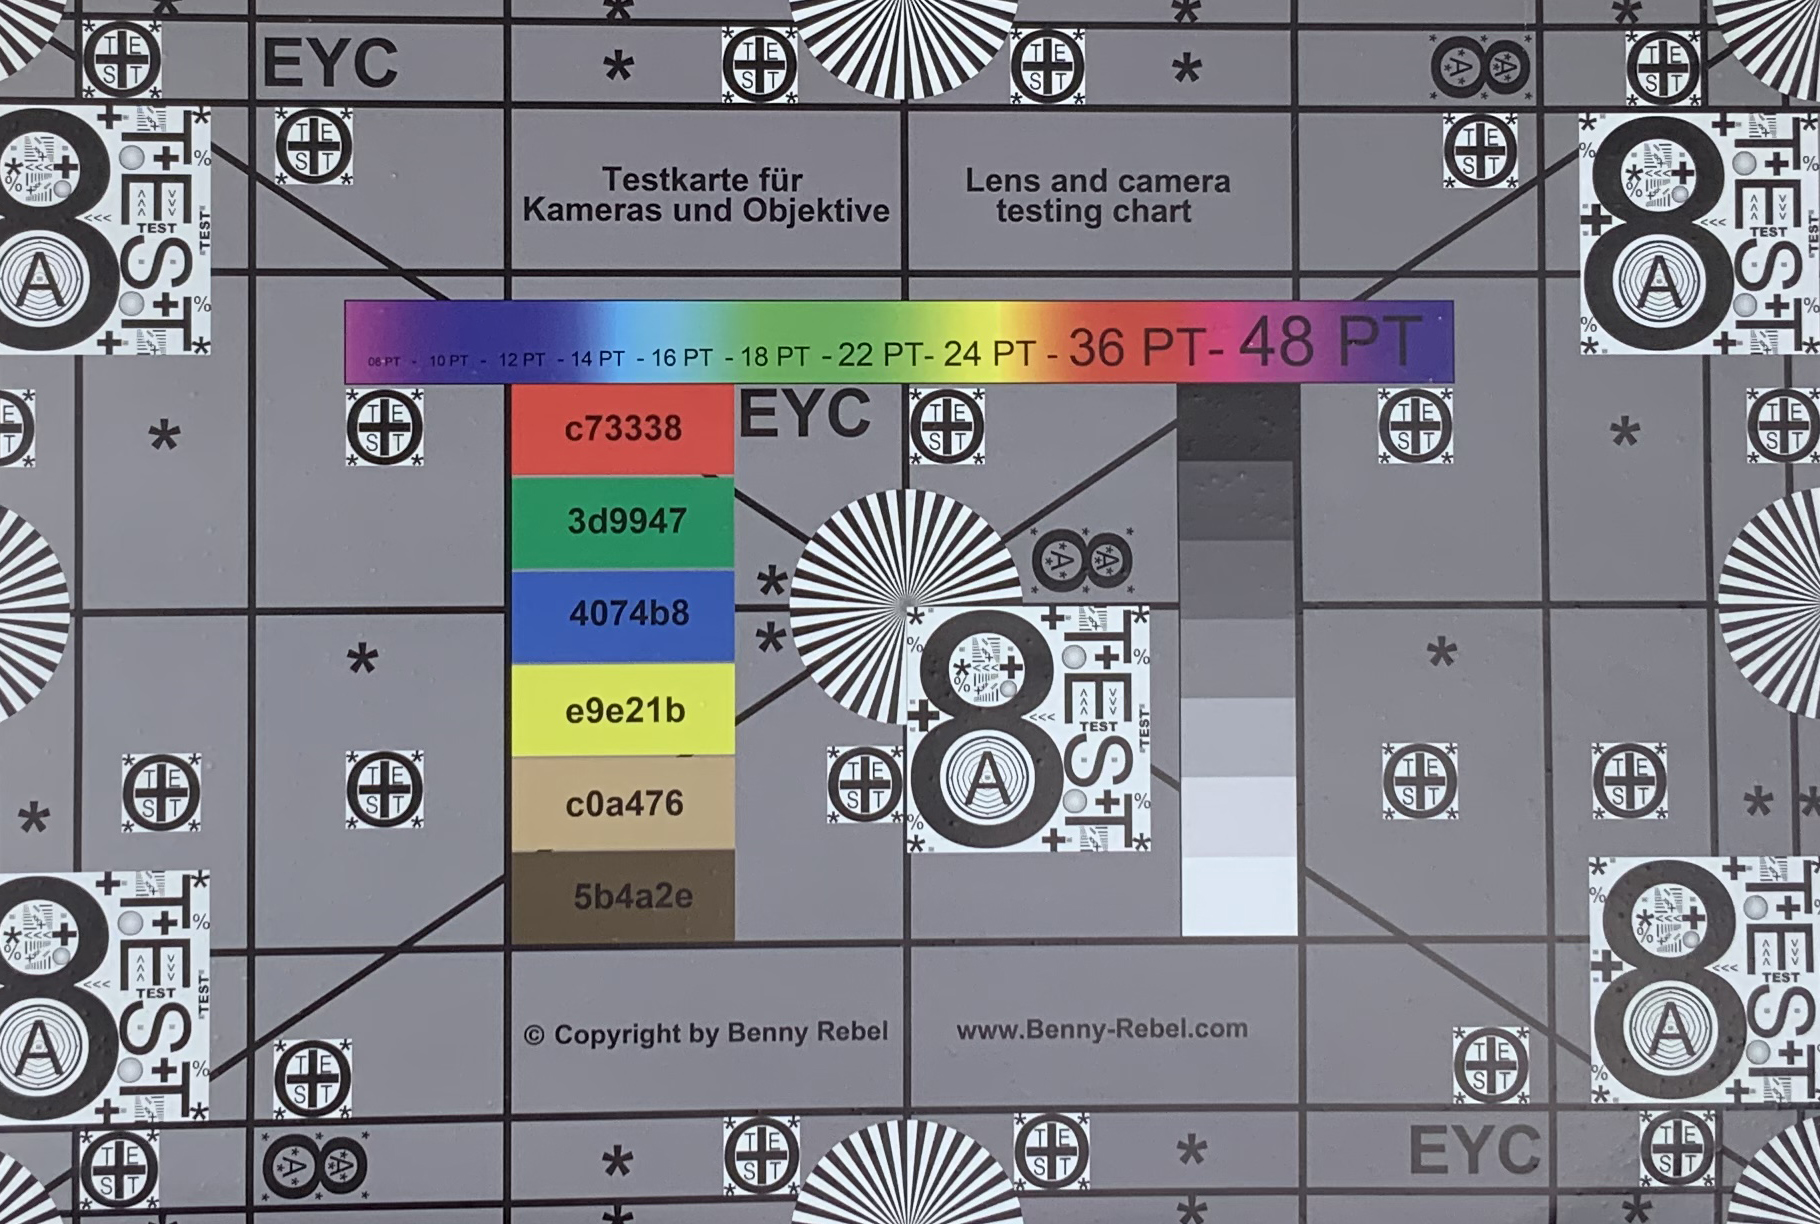
Brightness Distribution: 87 %
Center on Battery: 639 cd/m²
Contrast: 1420:1 (Black: 0.45 cd/m²)
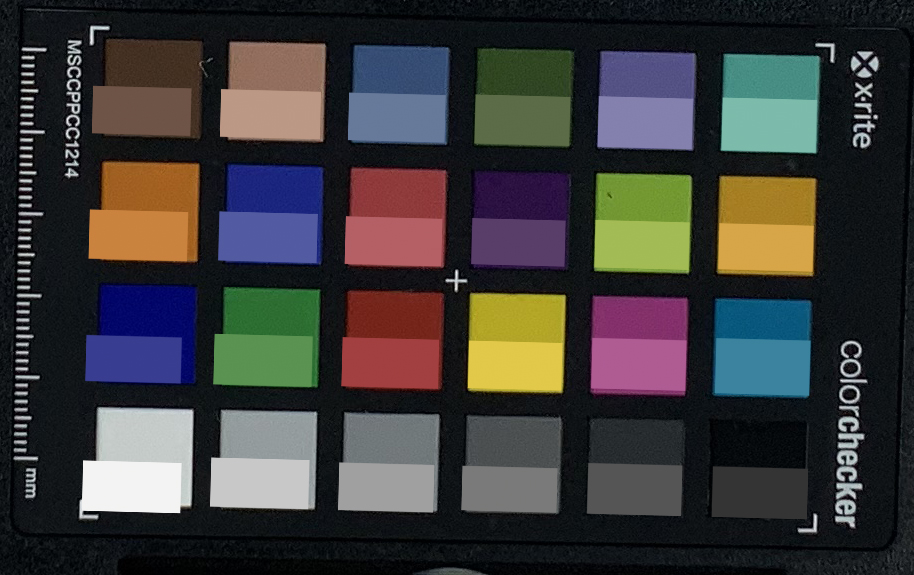
ΔE ColorChecker Calman: 0.92 | ∀{0.5-29.43 Ø4.71}
ΔE Greyscale Calman: 1.3 | ∀{0.09-98 Ø4.96}
99.7% sRGB (Calman 2D)
Gamma: 2.22
CCT: 6656 K
| Apple iPad Pro 11 2018 IPS, 2388x1668, 11" | Microsoft Surface Pro 6, Core i7, 512 GB IPS, 2736x1824, 12.3" | Apple iPad Pro 10.5 2017 IPS, 2224x1668, 10.5" | Apple iPad Pro 12.9 2018 IPS, 2732x2048, 12.9" | Samsung Galaxy Tab S4 Super AMOLED, 2560x1600, 10.5" | Huawei MediaPad M5 10.8 Pro IPS, 2560x1600, 10.8" | |
|---|---|---|---|---|---|---|
| Screen | -94% | -30% | 4% | -66% | -217% | |
| Brightness middle (cd/m²) | 639 | 484 -24% | 634 -1% | 632 -1% | 474 -26% | 384 -40% |
| Brightness (cd/m²) | 591 | 473 -20% | 625 6% | 605 2% | 477 -19% | 360 -39% |
| Brightness Distribution (%) | 87 | 91 5% | 87 0% | 91 5% | 91 5% | 84 -3% |
| Black Level * (cd/m²) | 0.45 | 0.33 27% | 0.39 13% | 0.32 29% | 0.8 -78% | |
| Contrast (:1) | 1420 | 1467 3% | 1626 15% | 1975 39% | 480 -66% | |
| Colorchecker dE 2000 * | 0.92 | 4.29 -366% | 1.9 -107% | 1.1 -20% | 2.5 -172% | 6.83 -642% |
| Colorchecker dE 2000 max. * | 2.59 | 6.46 -149% | 3.9 -51% | 2.4 7% | 5.8 -124% | 12.7 -390% |
| Greyscale dE 2000 * | 1.3 | 4.3 -231% | 2.8 -115% | 1.7 -31% | 2.1 -62% | 7.5 -477% |
| Gamma | 2.22 99% | 2.51 88% | 2.26 97% | 2.21 100% | 2.08 106% | 2.199 100% |
| CCT | 6656 98% | 7315 89% | 7027 93% | 6794 96% | 6281 103% | 8544 76% |
| Colorchecker dE 2000 calibrated * | 1.34 | |||||
| Color Space (Percent of AdobeRGB 1998) (%) | 62 | |||||
| Color Space (Percent of sRGB) (%) | 95 |
* ... smaller is better
Screen Flickering / PWM (Pulse-Width Modulation)
| Screen flickering / PWM not detected | 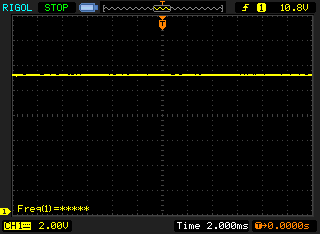 | ||
In comparison: 52 % of all tested devices do not use PWM to dim the display. If PWM was detected, an average of 7754 (minimum: 5 - maximum: 343500) Hz was measured. | |||
Display Response Times
| ↔ Response Time Black to White | ||
|---|---|---|
| 36 ms ... rise ↗ and fall ↘ combined | ↗ 19 ms rise | 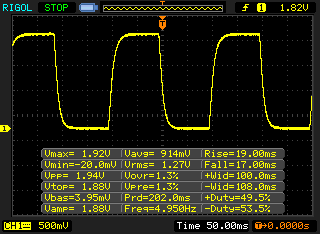 |
| ↘ 17 ms fall | ||
| The screen shows slow response rates in our tests and will be unsatisfactory for gamers. In comparison, all tested devices range from 0.1 (minimum) to 240 (maximum) ms. » 94 % of all devices are better. This means that the measured response time is worse than the average of all tested devices (19.8 ms). | ||
| ↔ Response Time 50% Grey to 80% Grey | ||
| 54 ms ... rise ↗ and fall ↘ combined | ↗ 25 ms rise | 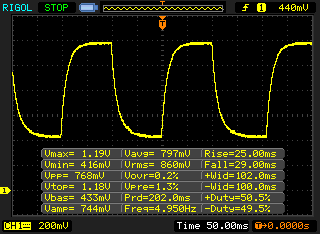 |
| ↘ 29 ms fall | ||
| The screen shows slow response rates in our tests and will be unsatisfactory for gamers. In comparison, all tested devices range from 0.165 (minimum) to 636 (maximum) ms. » 91 % of all devices are better. This means that the measured response time is worse than the average of all tested devices (31 ms). | ||
| PCMark for Android | |
| Work performance score | |
| Samsung Galaxy Tab S4 | |
| Huawei MediaPad M5 10.8 Pro | |
| Work 2.0 performance score | |
| Samsung Galaxy Tab S4 | |
| Huawei MediaPad M5 10.8 Pro | |
| 3DMark | |
| 2560x1440 Sling Shot Extreme (ES 3.1) | |
| Apple iPad Pro 10.5 2017 | |
| Samsung Galaxy Tab S4 | |
| Huawei MediaPad M5 10.8 Pro | |
| 2560x1440 Sling Shot Extreme (ES 3.1) Graphics | |
| Apple iPad Pro 10.5 2017 | |
| Samsung Galaxy Tab S4 | |
| Huawei MediaPad M5 10.8 Pro | |
| 2560x1440 Sling Shot Extreme (ES 3.1) Physics | |
| Samsung Galaxy Tab S4 | |
| Huawei MediaPad M5 10.8 Pro | |
| Apple iPad Pro 10.5 2017 | |
| 2560x1440 Sling Shot Extreme (ES 3.1) Unlimited | |
| Average of class Tablet (800 - 17279, n=13, last 2 years) | |
| Apple iPad Pro 10.5 2017 | |
| Samsung Galaxy Tab S4 | |
| Huawei MediaPad M5 10.8 Pro | |
| 2560x1440 Sling Shot Extreme (ES 3.1) Unlimited Graphics | |
| Average of class Tablet (662 - 28816, n=13, last 2 years) | |
| Apple iPad Pro 10.5 2017 | |
| Samsung Galaxy Tab S4 | |
| Huawei MediaPad M5 10.8 Pro | |
| 2560x1440 Sling Shot Extreme (ES 3.1) Unlimited Physics | |
| Average of class Tablet (2012 - 7196, n=13, last 2 years) | |
| Samsung Galaxy Tab S4 | |
| Huawei MediaPad M5 10.8 Pro | |
| Apple iPad Pro 10.5 2017 | |
| AnTuTu v7 - Total Score | |
| Apple iPad Pro 11 2018 | |
| Average Apple A12X Bionic (552676 - 566378, n=2) | |
| Apple iPad Pro 12.9 2018 | |
| Samsung Galaxy Tab S4 | |
| Huawei MediaPad M5 10.8 Pro | |
| Basemark ES 3.1 / Metal - offscreen Overall Score | |
| Apple iPad Pro 12.9 2018 | |
| Average Apple A12X Bionic (5216 - 5300, n=2) | |
| Apple iPad Pro 11 2018 | |
| Average of class Tablet (255 - 5784, n=6, last 2 years) | |
| JetStream 1.1 - 1.1 Total | |
| Apple iPad Pro 12.9 2018 (Safari Mobile 12) | |
| Average Apple A12X Bionic (278 - 279, n=2) | |
| Apple iPad Pro 11 2018 (Safari 13) | |
| Microsoft Surface Pro 6, Core i7, 512 GB | |
| Apple iPad Pro 10.5 2017 (Safari Mobile 10) | |
| Samsung Galaxy Tab S4 (Samsung Browser 8.0) | |
| Huawei MediaPad M5 10.8 Pro (Chrome 68.0.3440.91) | |
| Octane V2 - Total Score | |
| Average of class Tablet (1633 - 138481, n=71, last 2 years) | |
| Apple iPad Pro 12.9 2018 (Safari Mobile 12) | |
| Average Apple A12X Bionic (44425 - 45734, n=2) | |
| Apple iPad Pro 11 2018 (Safari 13) | |
| Microsoft Surface Pro 6, Core i7, 512 GB | |
| Apple iPad Pro 10.5 2017 (Safari Mobile 10) | |
| Samsung Galaxy Tab S4 (Samsung Browser 8.0) | |
| Huawei MediaPad M5 10.8 Pro (Chrome 68.0.3440.91) | |
| Mozilla Kraken 1.1 - Total | |
| Huawei MediaPad M5 10.8 Pro (Chrome 68.0.3440.91) | |
| Samsung Galaxy Tab S4 (Samsung Browser 8.0) | |
| Average of class Tablet (243 - 16233, n=65, last 2 years) | |
| Microsoft Surface Pro 6, Core i7, 512 GB | |
| Apple iPad Pro 10.5 2017 (Safari Mobile 10) | |
| Apple iPad Pro 12.9 2018 (Safari Mobile 12) | |
| Average Apple A12X Bionic (603 - 614, n=2) | |
| Apple iPad Pro 11 2018 (Safari 13) | |
| WebXPRT 3 - Overall | |
| Average of class Tablet (168 - 520, n=10, last 2 years) | |
| Apple iPad Pro 12.9 2018 (Safari Mobile 12) | |
| Average Apple A12X Bionic (172 - 182, n=2) | |
| Apple iPad Pro 11 2018 (Safari 13) | |
| Samsung Galaxy Tab S4 (Samsung Browser 8.0) | |
| Huawei MediaPad M5 10.8 Pro (Chrome 68.0.3440.91) | |
| WebXPRT 2015 - Overall | |
| Apple iPad Pro 11 2018 (Safari 13) | |
| Average Apple A12X Bionic (380 - 386, n=2) | |
| Apple iPad Pro 12.9 2018 (Safari Mobile 12) | |
| Apple iPad Pro 10.5 2017 (Safari Mobile 10) | |
| Samsung Galaxy Tab S4 (Samsung Browser 8.0) | |
| Huawei MediaPad M5 10.8 Pro (Chrome 68.0.3440.91) | |
* ... smaller is better
| Asphalt 9: Legends | |||
| Settings | Value | ||
| High Quality | 29 fps | ||
| Shadow Fight 3 | |||
| Settings | Value | ||
| high | 59 fps | ||
| minimal | 59 fps | ||
| Arena of Valor | |||
| Settings | Value | ||
| min | 60 fps | ||
| high HD | 59 fps | ||
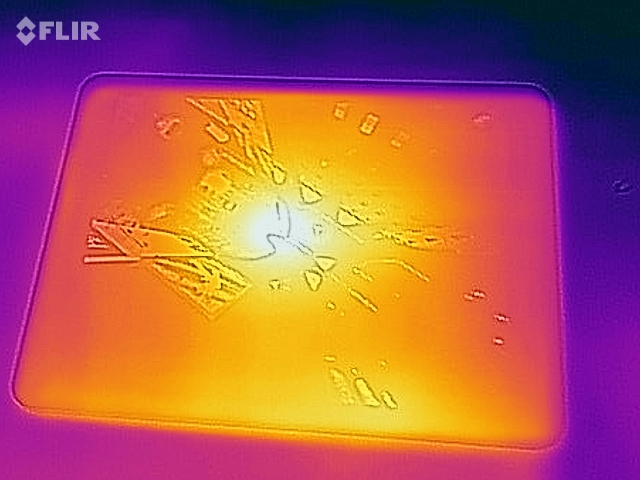
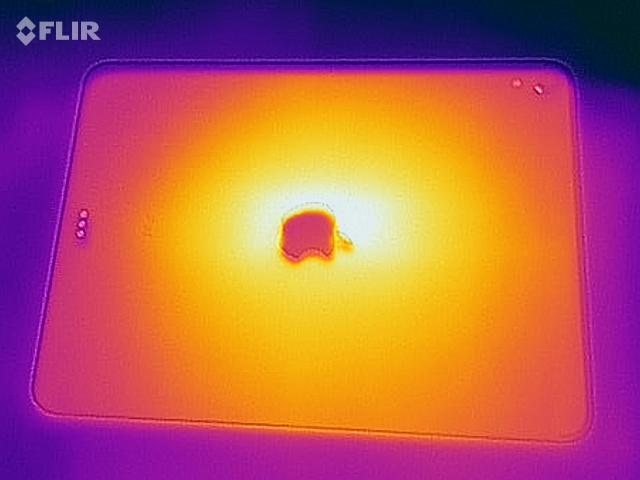
(+) The maximum temperature on the upper side is 37.9 °C / 100 F, compared to the average of 33.7 °C / 93 F, ranging from 20.7 to 53.2 °C for the class Tablet.
(+) The bottom heats up to a maximum of 36.9 °C / 98 F, compared to the average of 33.2 °C / 92 F
(+) In idle usage, the average temperature for the upper side is 25.9 °C / 79 F, compared to the device average of 30 °C / 86 F.
Apple iPad Pro 11 2018 audio analysis
(±) | speaker loudness is average but good (78.7 dB)
Bass 100 - 315 Hz
(±) | reduced bass - on average 8.9% lower than median
(±) | linearity of bass is average (12.2% delta to prev. frequency)
Mids 400 - 2000 Hz
(+) | balanced mids - only 1.9% away from median
(+) | mids are linear (2.4% delta to prev. frequency)
Highs 2 - 16 kHz
(+) | balanced highs - only 1.9% away from median
(+) | highs are linear (6.4% delta to prev. frequency)
Overall 100 - 16.000 Hz
(±) | linearity of overall sound is average (16.5% difference to median)
Compared to same class
» 38% of all tested devices in this class were better, 5% similar, 57% worse
» The best had a delta of 7%, average was 20%, worst was 129%
Compared to all devices tested
» 28% of all tested devices were better, 6% similar, 66% worse
» The best had a delta of 4%, average was 23%, worst was 134%
Apple iPad Pro 10.5 2017 audio analysis
(+) | speakers can play relatively loud (84.6 dB)
Bass 100 - 315 Hz
(±) | reduced bass - on average 10.4% lower than median
(±) | linearity of bass is average (12.3% delta to prev. frequency)
Mids 400 - 2000 Hz
(±) | higher mids - on average 5.8% higher than median
(+) | mids are linear (4.3% delta to prev. frequency)
Highs 2 - 16 kHz
(±) | higher highs - on average 6.6% higher than median
(±) | linearity of highs is average (7% delta to prev. frequency)
Overall 100 - 16.000 Hz
(±) | linearity of overall sound is average (16.1% difference to median)
Compared to same class
» 37% of all tested devices in this class were better, 6% similar, 57% worse
» The best had a delta of 7%, average was 20%, worst was 129%
Compared to all devices tested
» 26% of all tested devices were better, 5% similar, 69% worse
» The best had a delta of 4%, average was 23%, worst was 134%
| Off / Standby | |
| Idle | |
| Load |
|
Key:
min: | |
| Apple iPad Pro 11 2018 7736 mAh | Microsoft Surface Pro 6, Core i7, 512 GB mAh | Apple iPad Pro 10.5 2017 8134 mAh | Apple iPad Pro 12.9 2018 mAh | Samsung Galaxy Tab S4 7300 mAh | Huawei MediaPad M5 10.8 Pro 7500 mAh | |
|---|---|---|---|---|---|---|
| Power Consumption | -120% | 3% | -33% | 22% | -27% | |
| Idle Minimum * (Watt) | 1.2 | 3.2 -167% | 1.44 -20% | 1.42 -18% | 1.76 -47% | 3.3 -175% |
| Idle Average * (Watt) | 4.1 | 8.7 -112% | 6.12 -49% | 9.35 -128% | 4.22 -3% | 4.2 -2% |
| Idle Maximum * (Watt) | 7.5 | 10.4 -39% | 6.14 18% | 9.38 -25% | 4.25 43% | 7 7% |
| Load Average * (Watt) | 13.6 | 29.2 -115% | 8.55 37% | 12.75 6% | 4.52 67% | 10.4 24% |
| Load Maximum * (Watt) | 15.2 | 40.8 -168% | 10.62 30% | 14.96 2% | 7.35 52% | 13.8 9% |
* ... smaller is better
| Apple iPad Pro 11 2018 7736 mAh | Microsoft Surface Pro 6, Core i7, 512 GB mAh | Apple iPad Pro 10.5 2017 8134 mAh | Apple iPad Pro 12.9 2018 mAh | Samsung Galaxy Tab S4 7300 mAh | Huawei MediaPad M5 10.8 Pro 7500 mAh | |
|---|---|---|---|---|---|---|
| Battery runtime | -43% | -17% | -10% | -24% | -24% | |
| Reader / Idle (h) | 34.3 | 18.1 -47% | 33.9 -1% | 31.5 -8% | 20.5 -40% | 20.9 -39% |
| H.264 (h) | 16.4 | 10.5 -36% | 15 -9% | 12.3 -25% | 10.5 -36% | |
| WiFi v1.3 (h) | 15.3 | 8.5 -44% | 11.6 -24% | 13.3 -13% | 8.3 -46% | 11.2 -27% |
| Load (h) | 3.5 | 2.2 -37% | 3.3 -6% | 3.1 -11% | 4.1 17% | 3.7 6% |
Pros
Cons
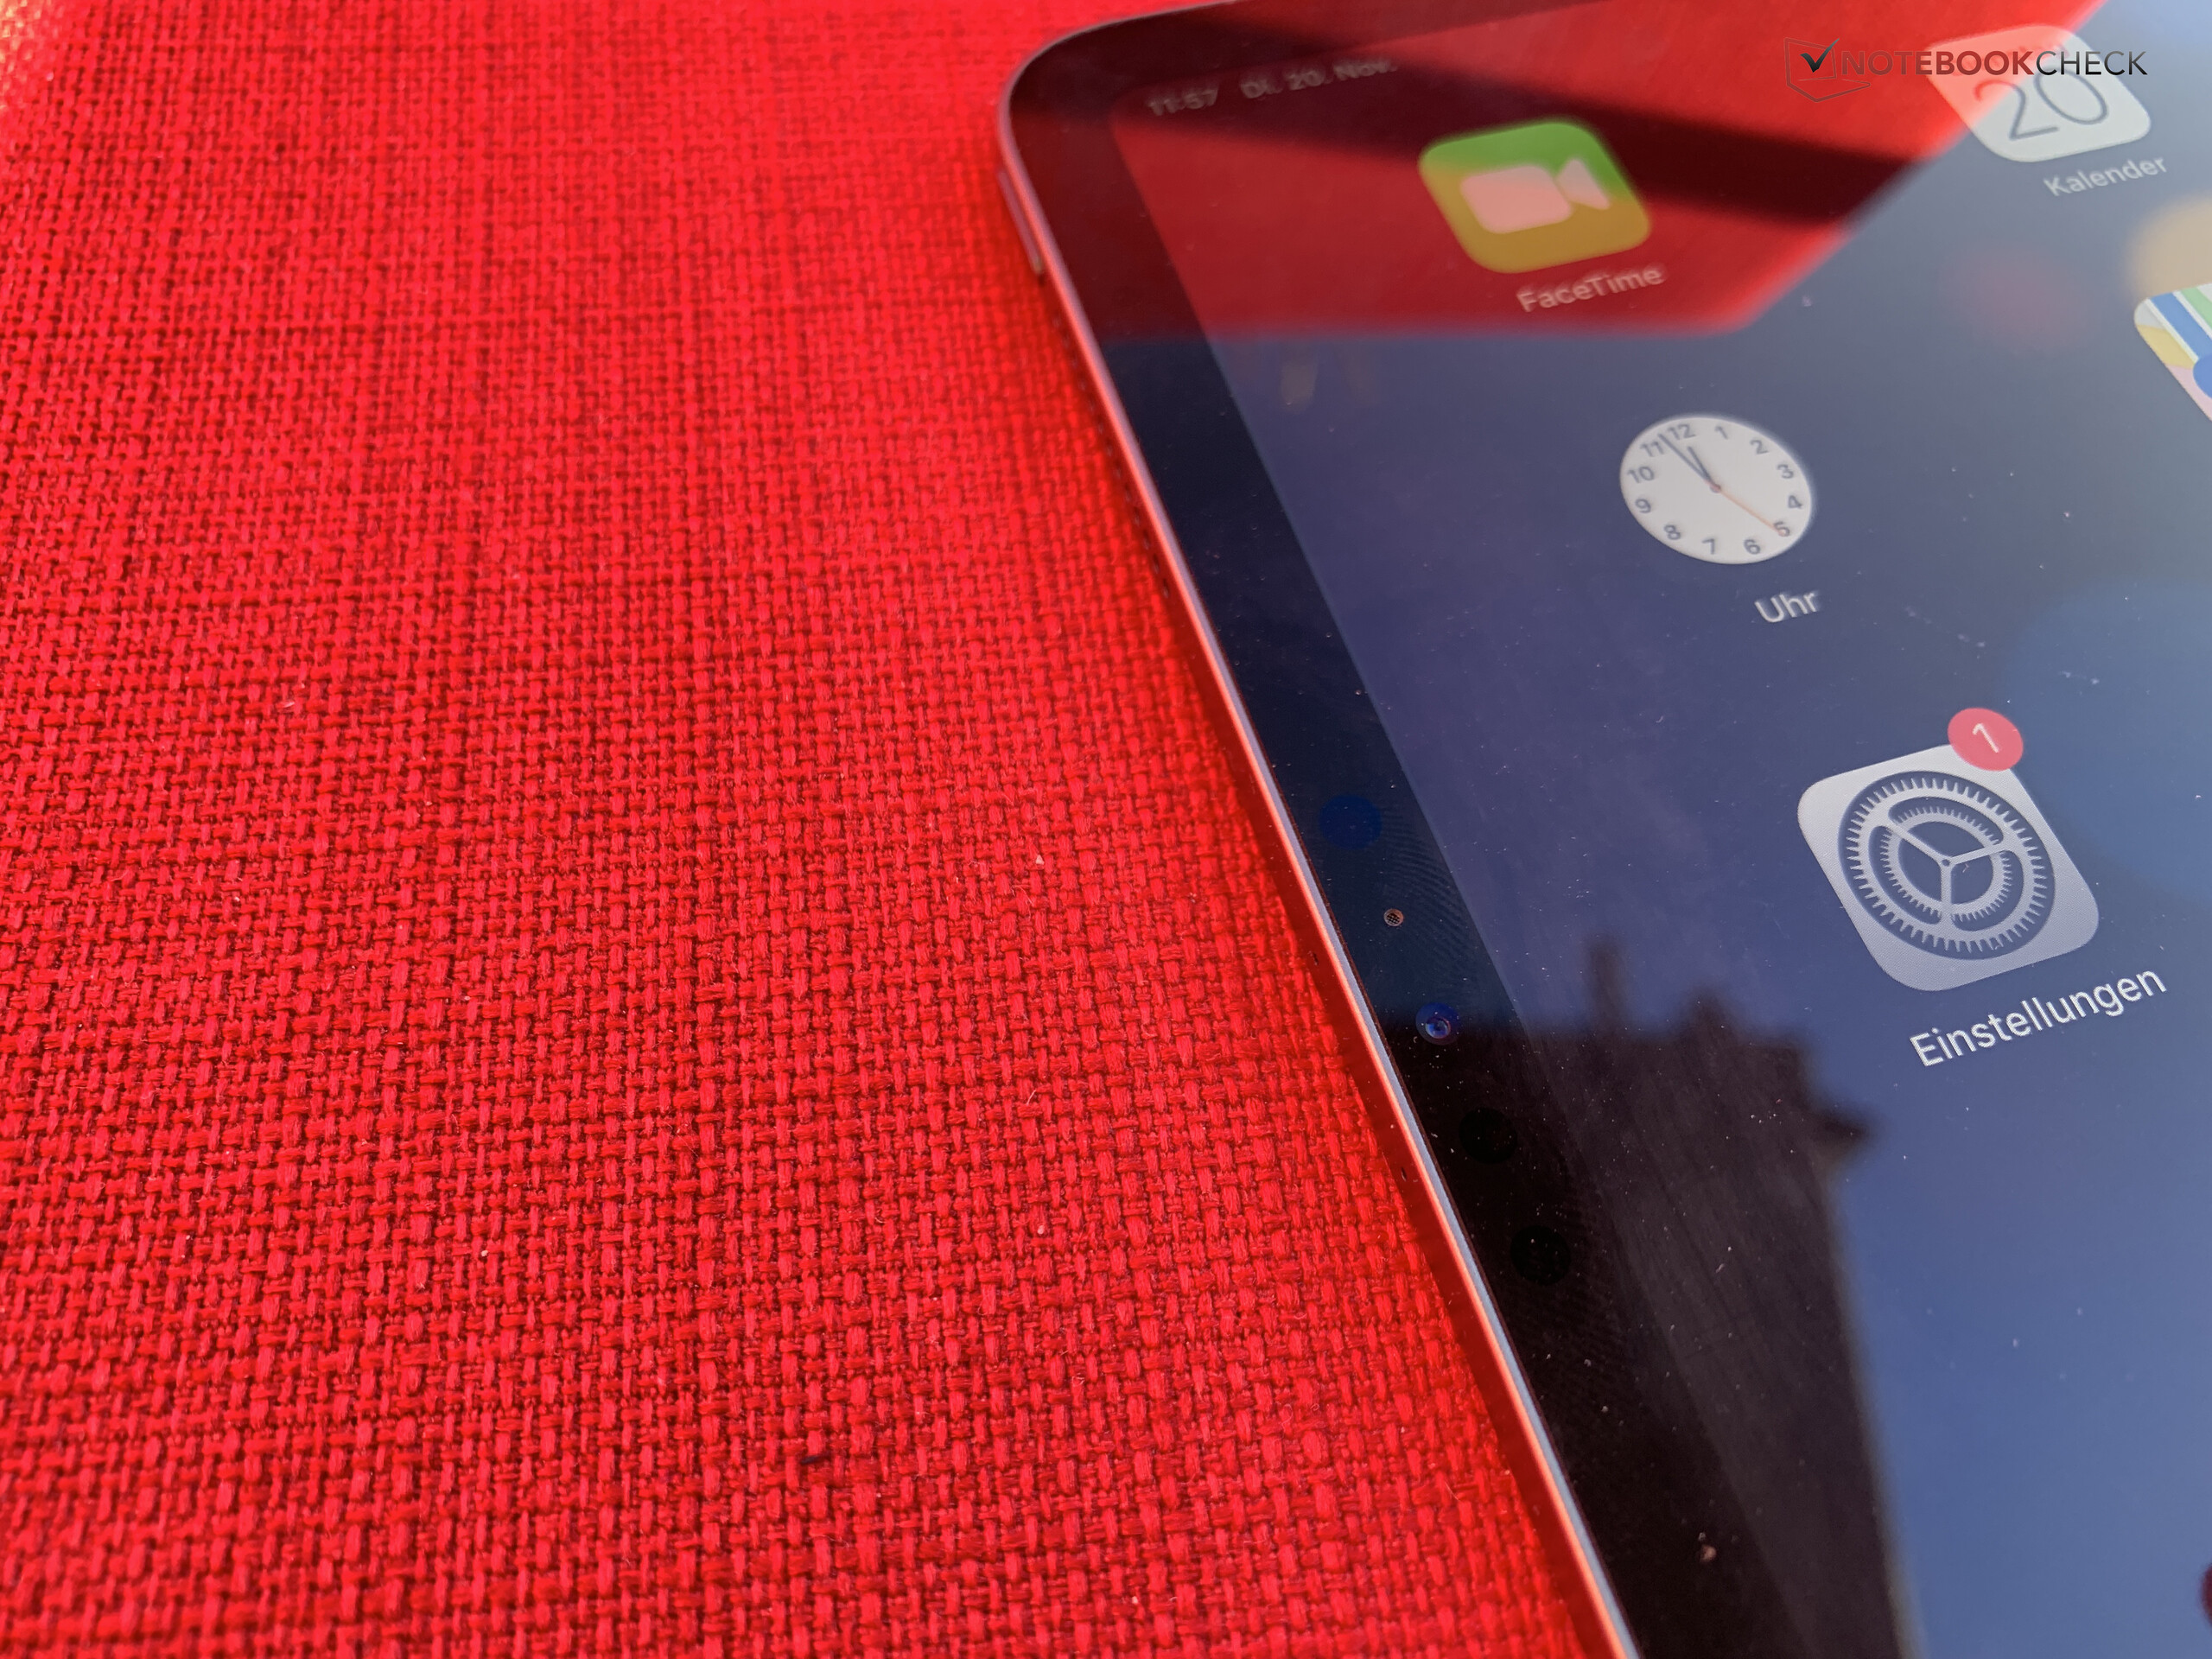
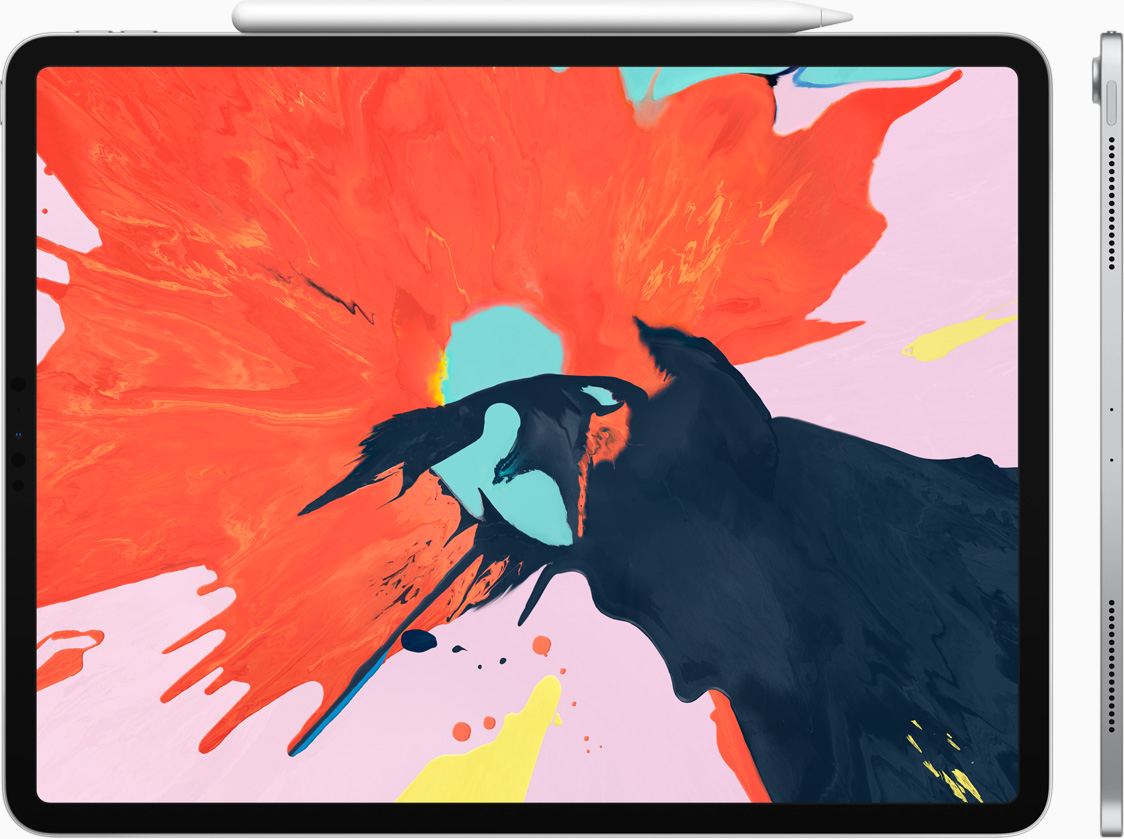
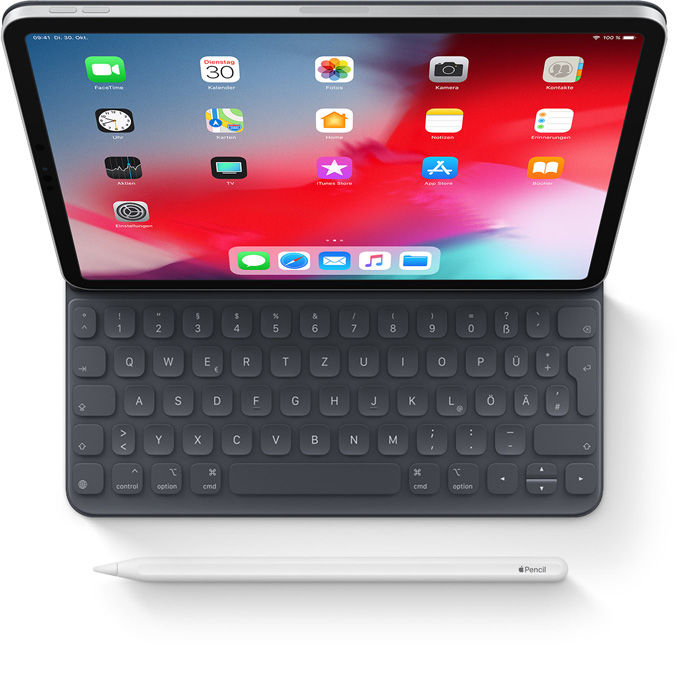
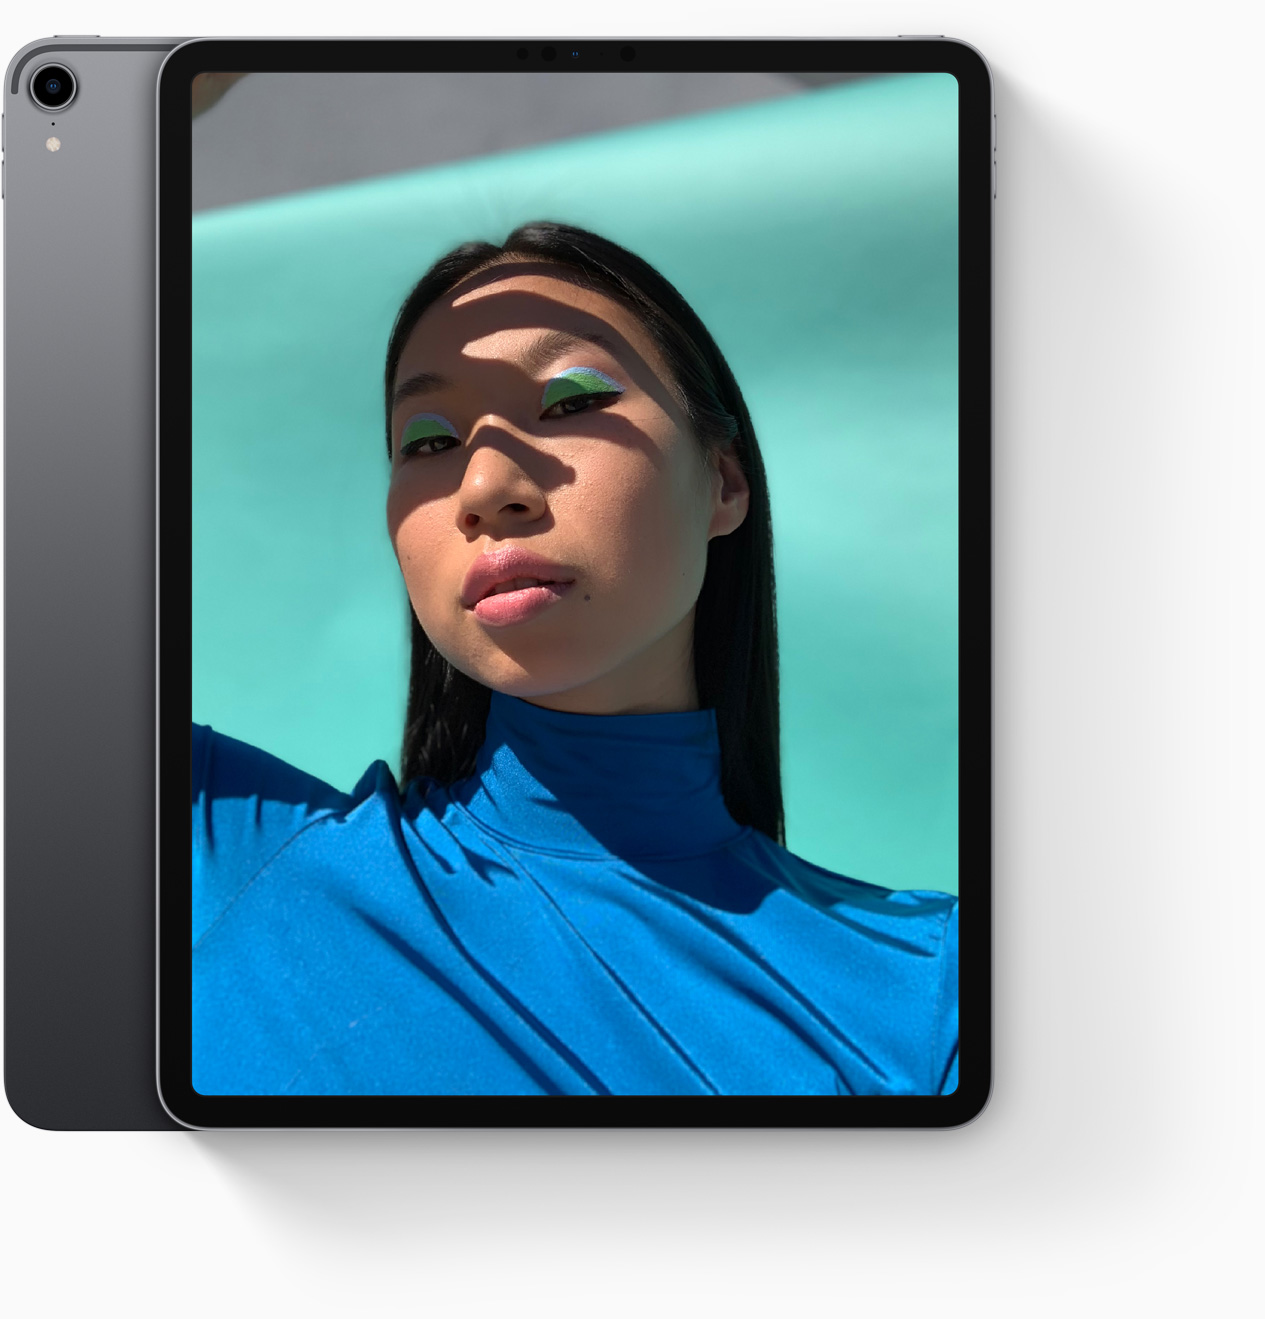
第三代iPad Pro为这个系列带来了新的开始。苹果对其进行了重新设计,在颜色选择上更为柔和。新iPad Pro 11更加接近于苹果“神奇玻璃表面”的设计理念,因为它具有更好的屏幕和屏占比。
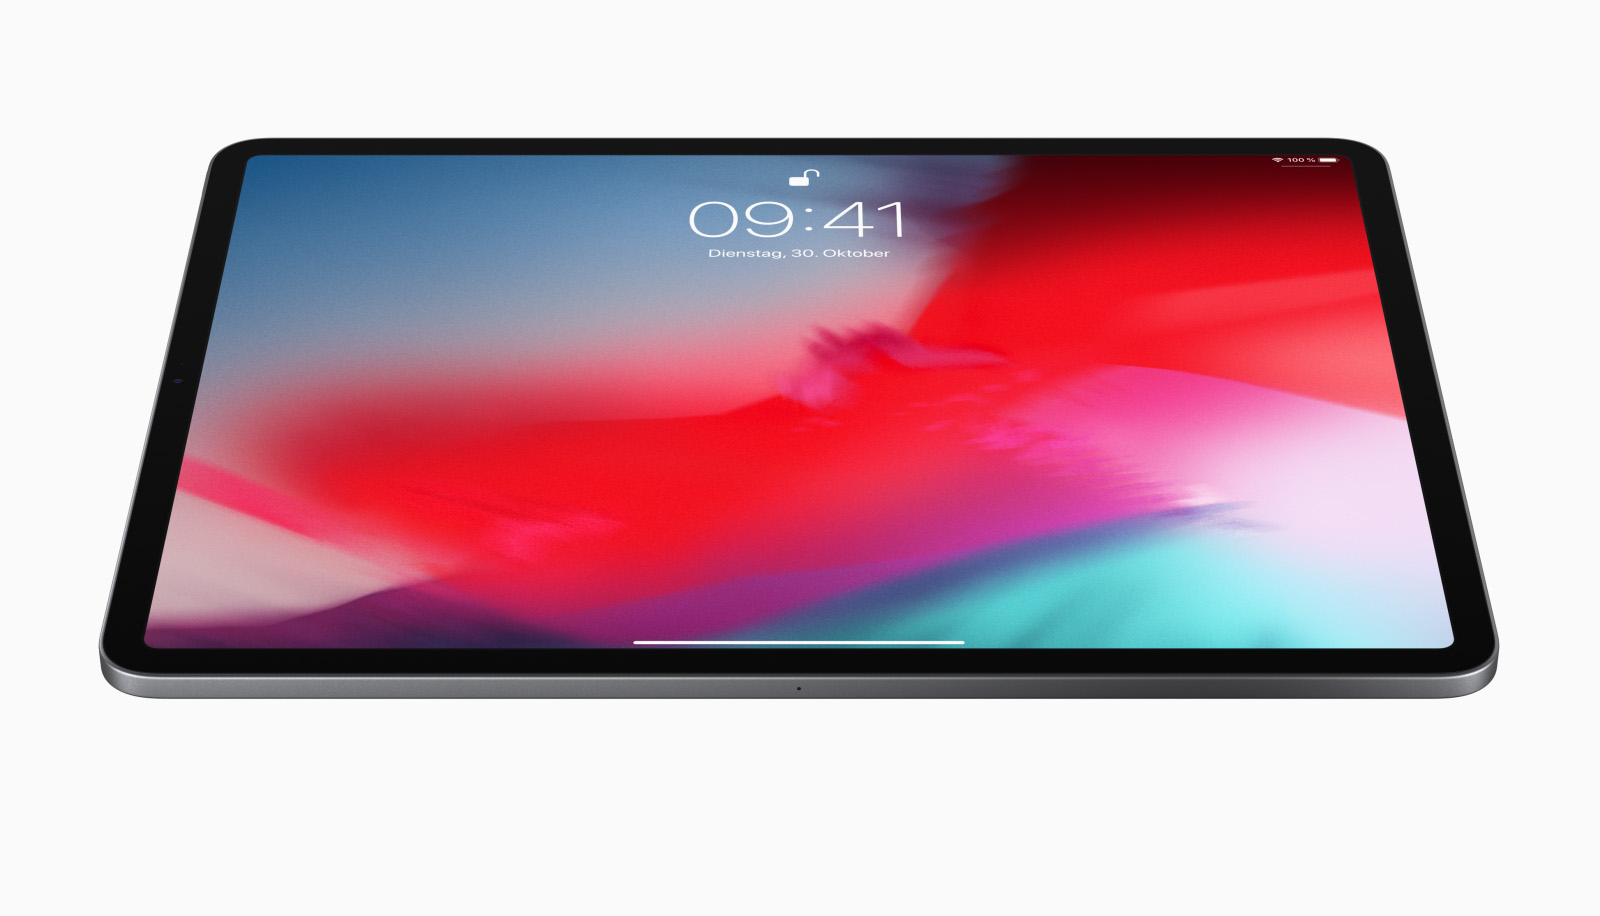
电池寿命和性能也得到了很大的改善,但是这一切都是更高的售价换来的。最贵的iPad Pro 11售价达到了12499元(1TB存储),对于一台平板电脑来说这实在太贵了。12.9英寸的型号价格则更加昂贵。
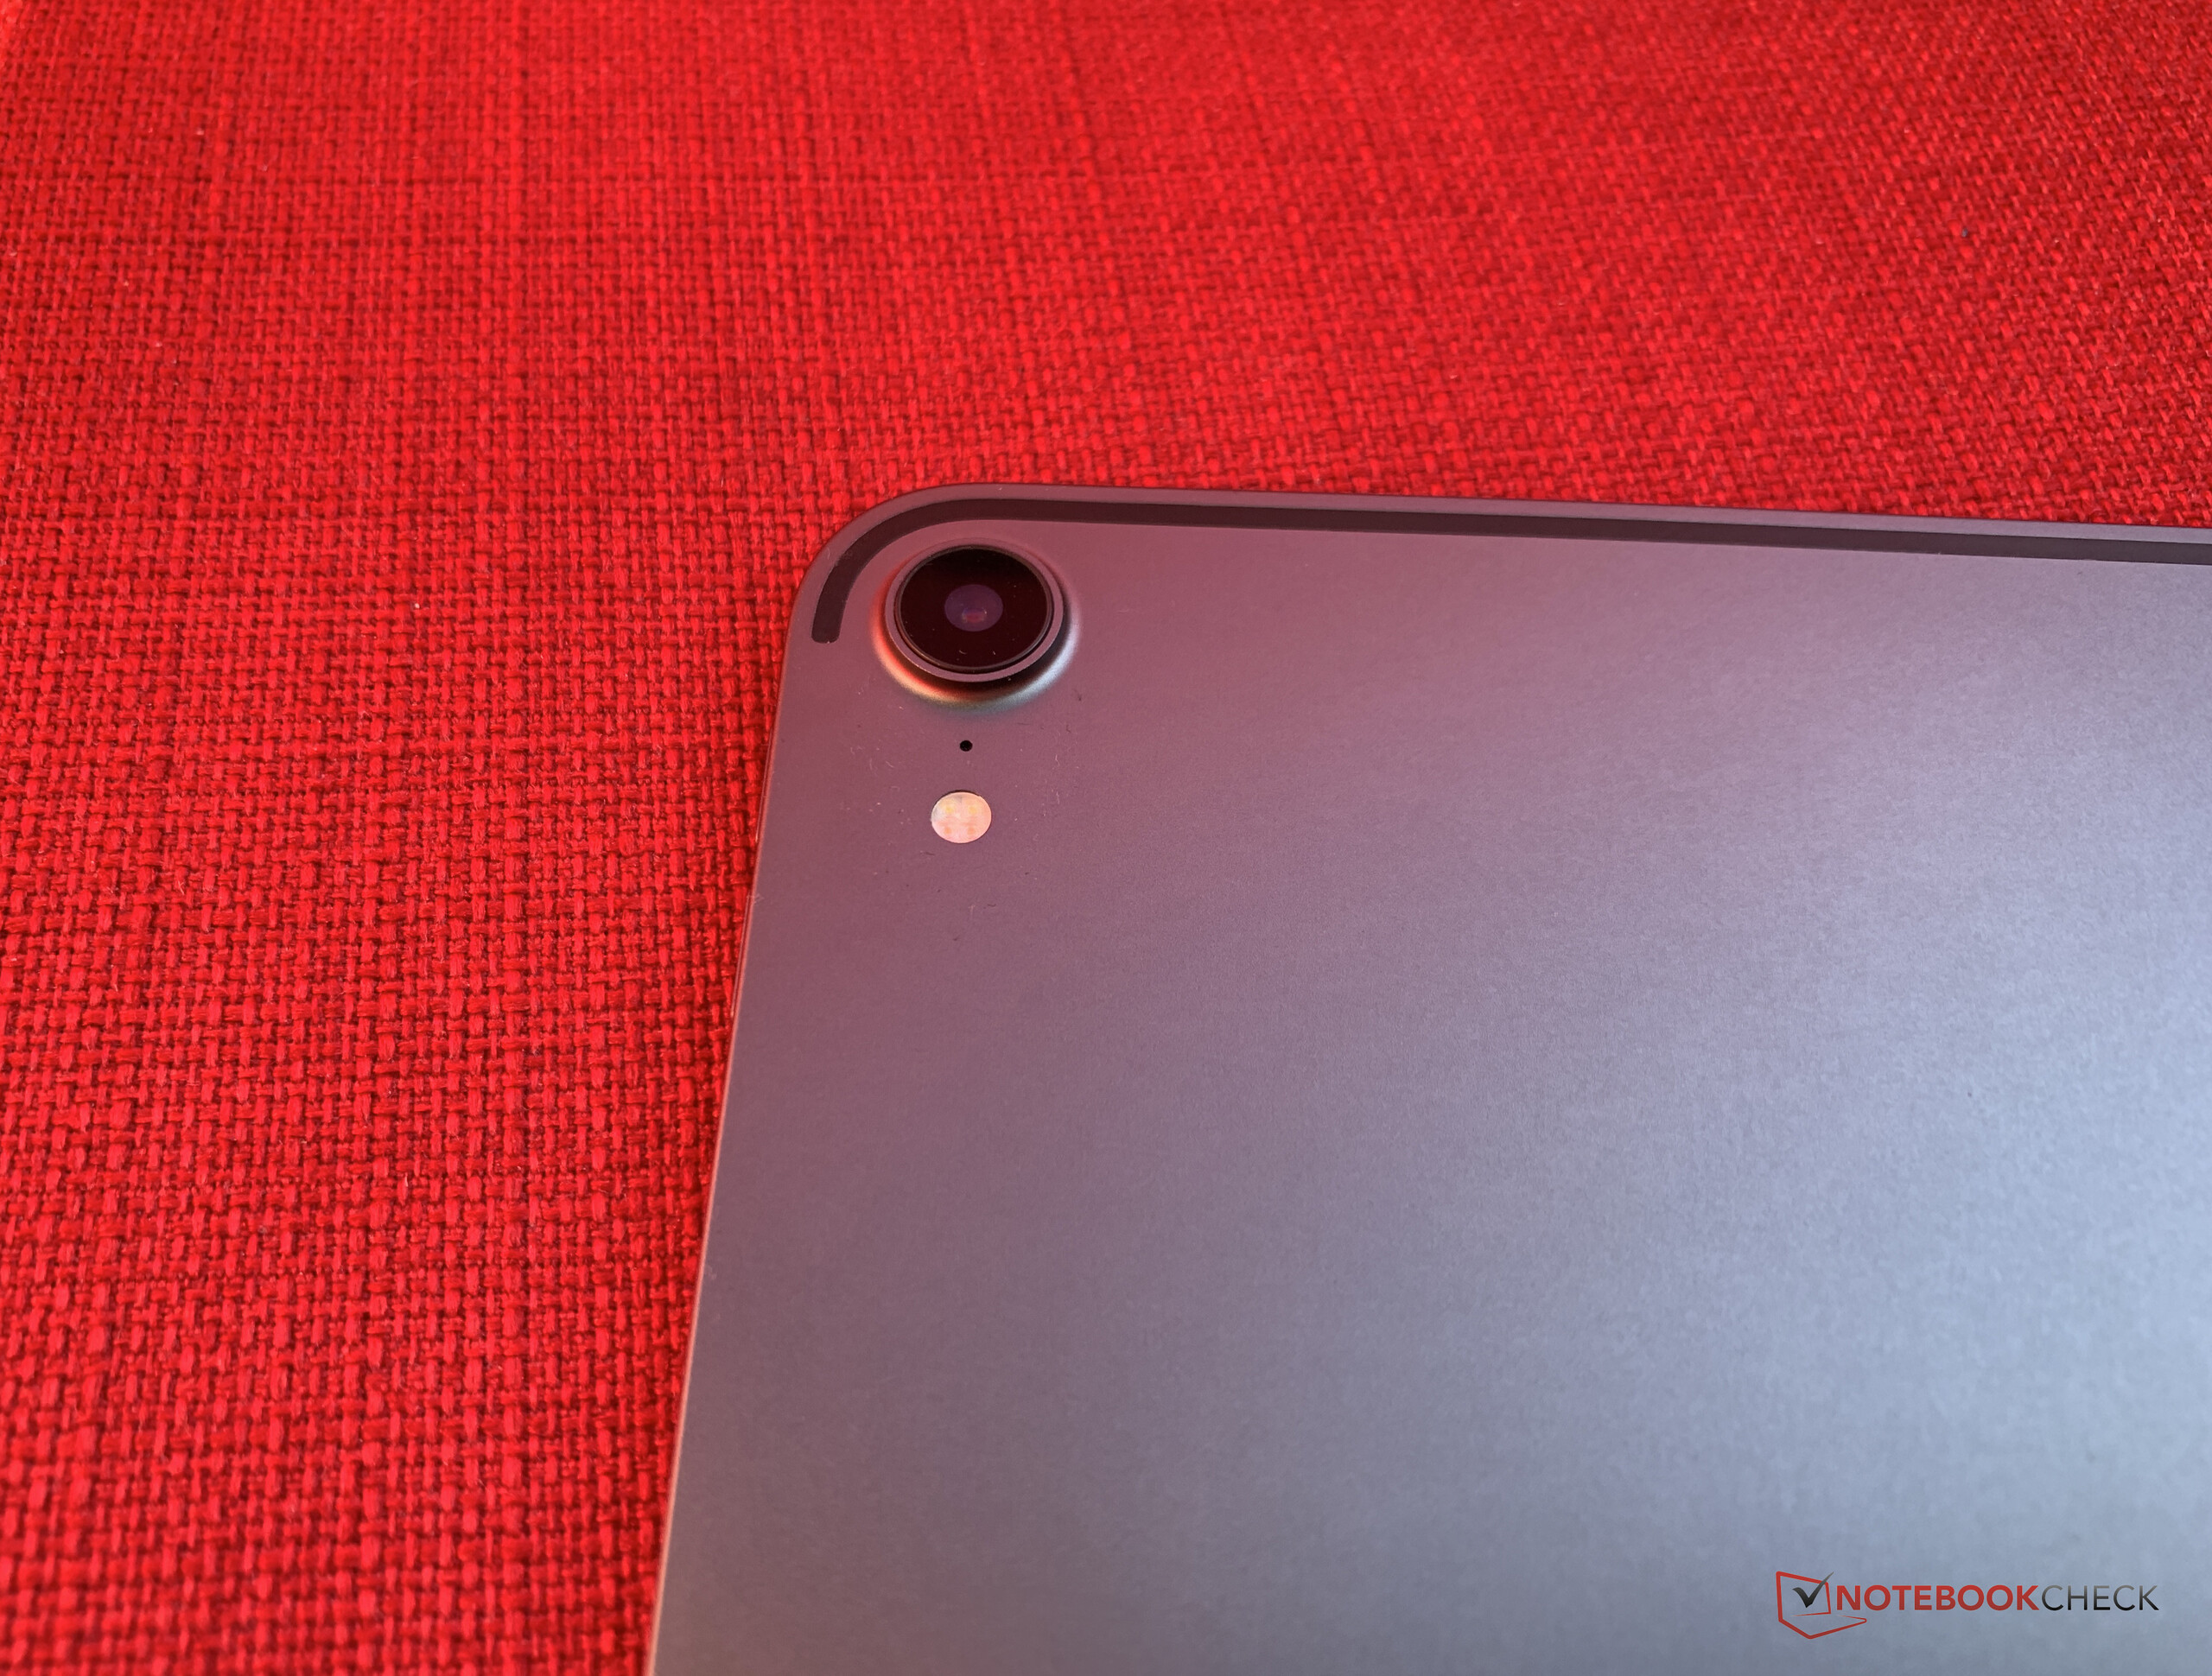
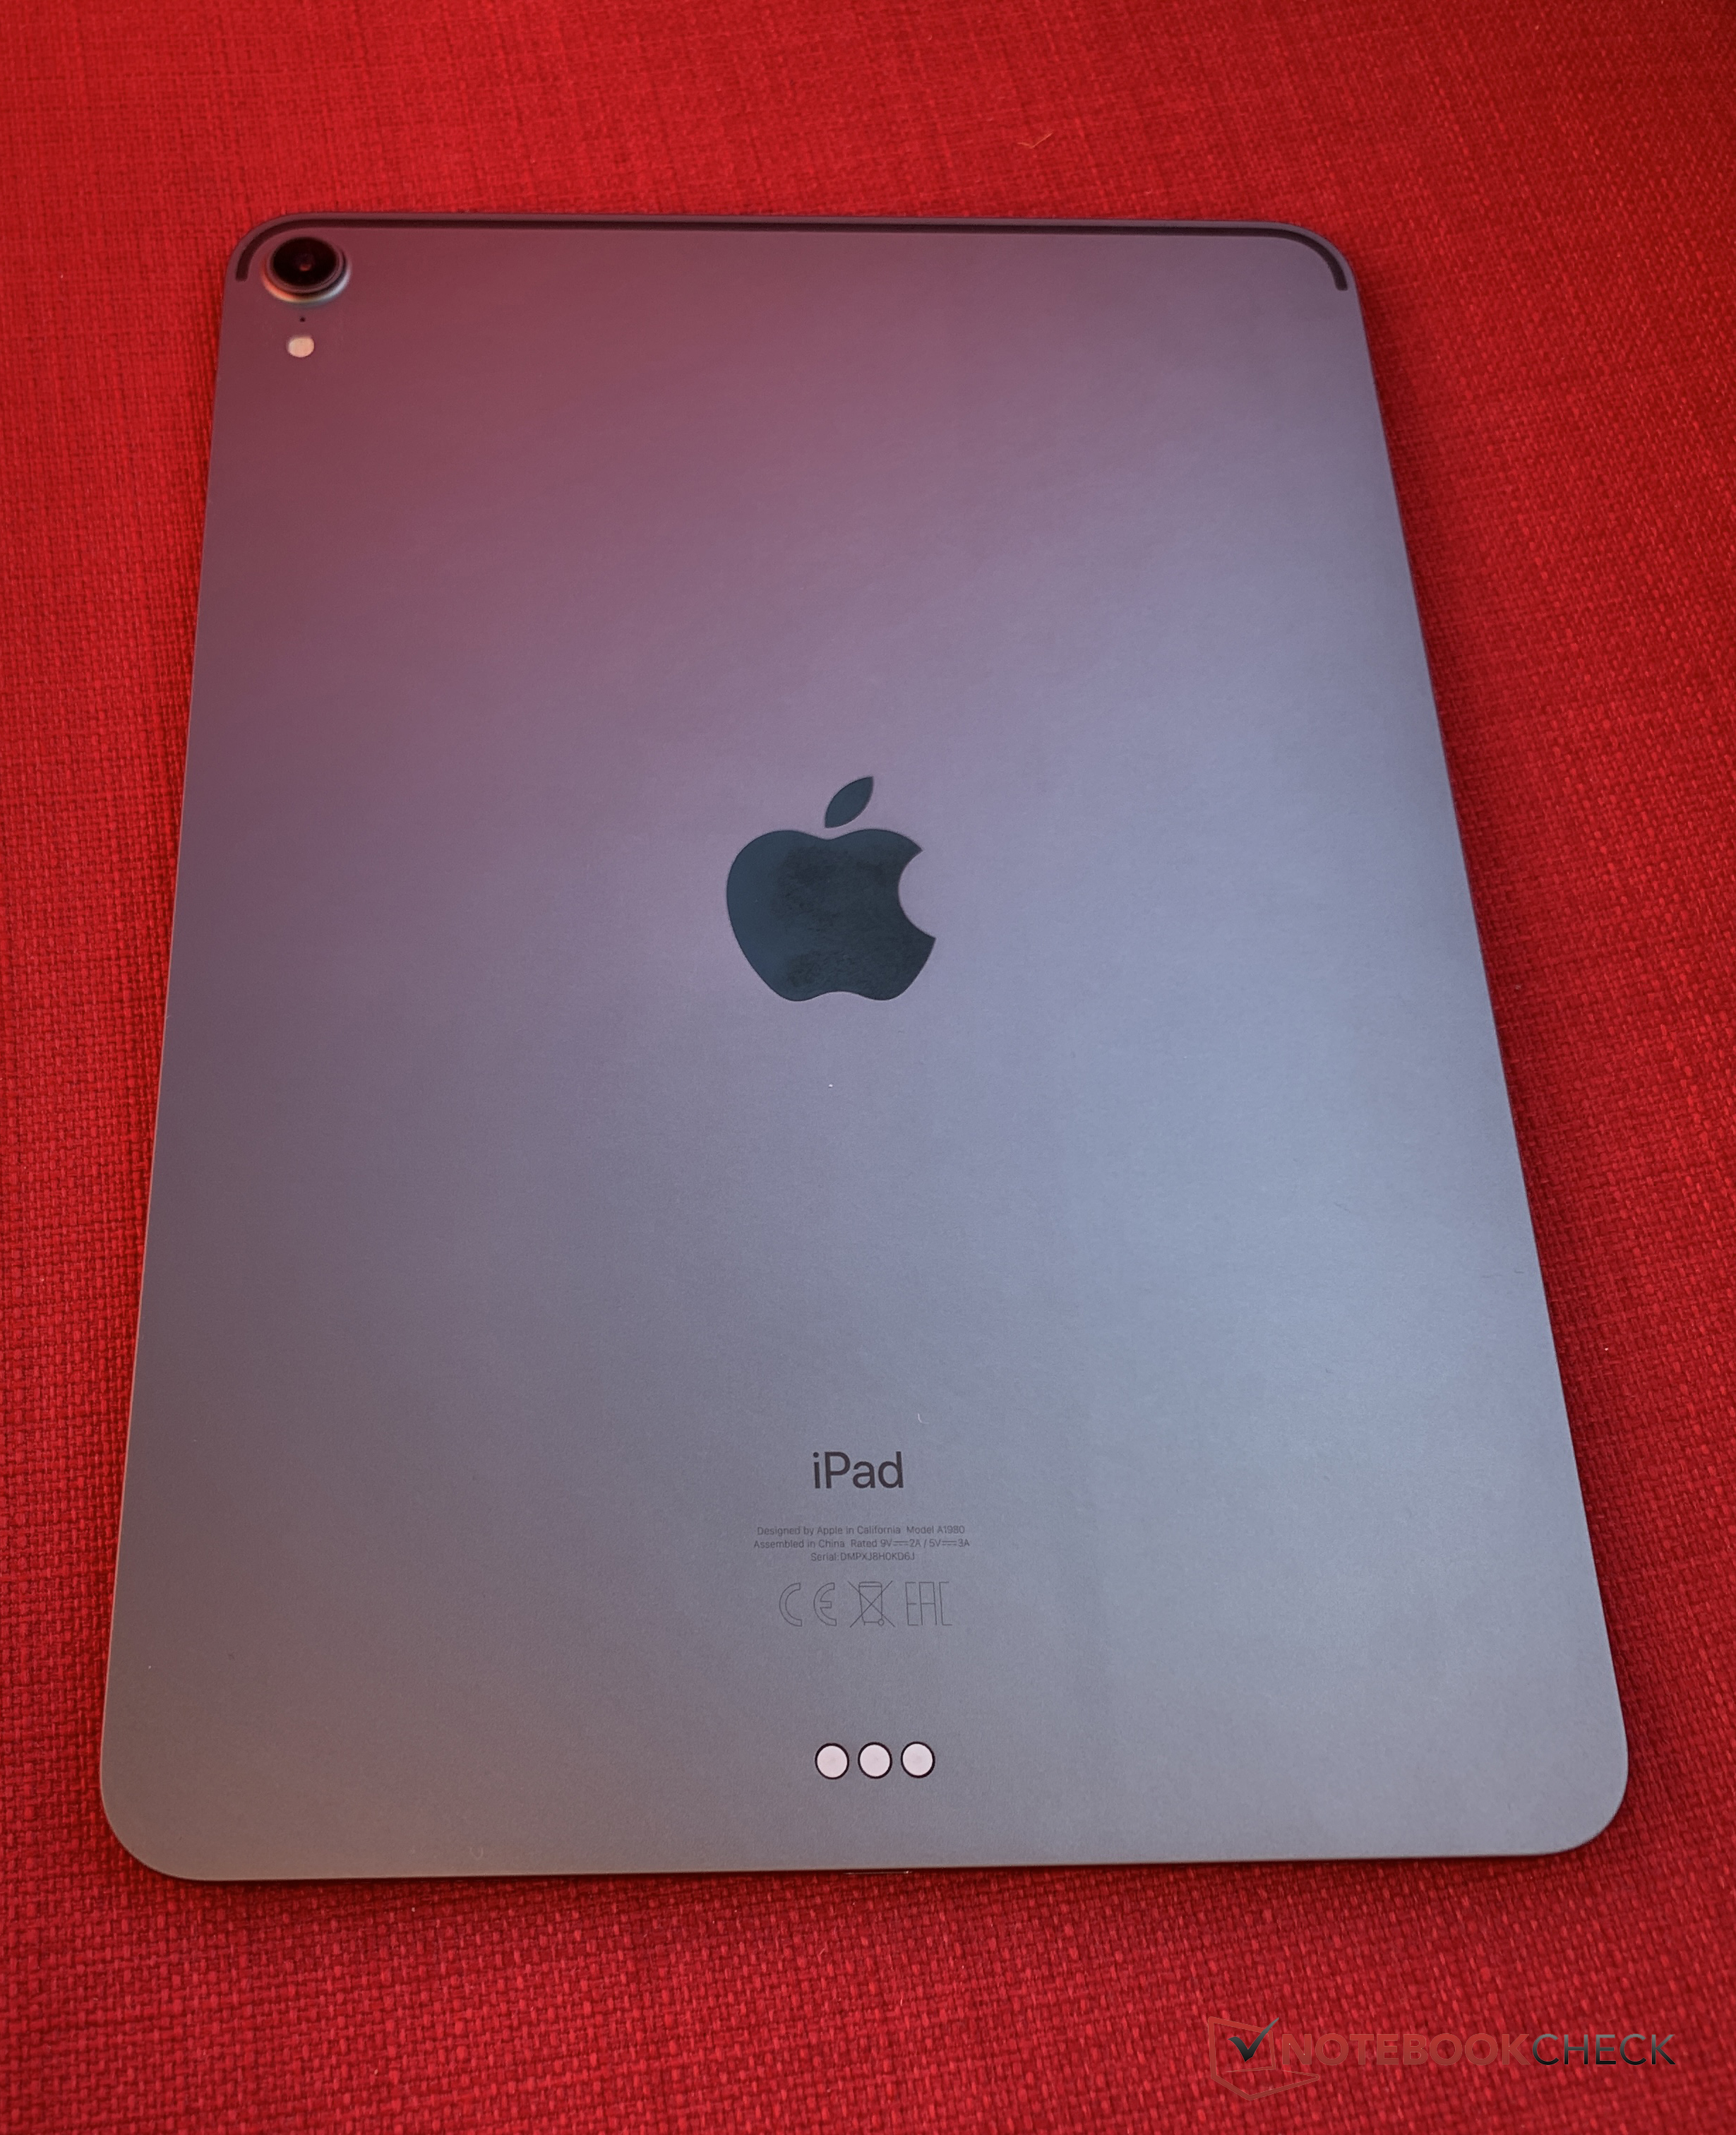
iPad Pro 11也有缺点,它的外壳没有我们想象的那么坚固,这对于这种价格不菲的设备来说极为致命。新iPad Pro 11是一台迷人的平板电脑,很适合那些有能力购买的人,因为在性能上很少有设备能与其匹敌。
Apple iPad Pro 11 2018
- 09/16/2019 v7 (old)
Florian Schmitt
Price comparison

