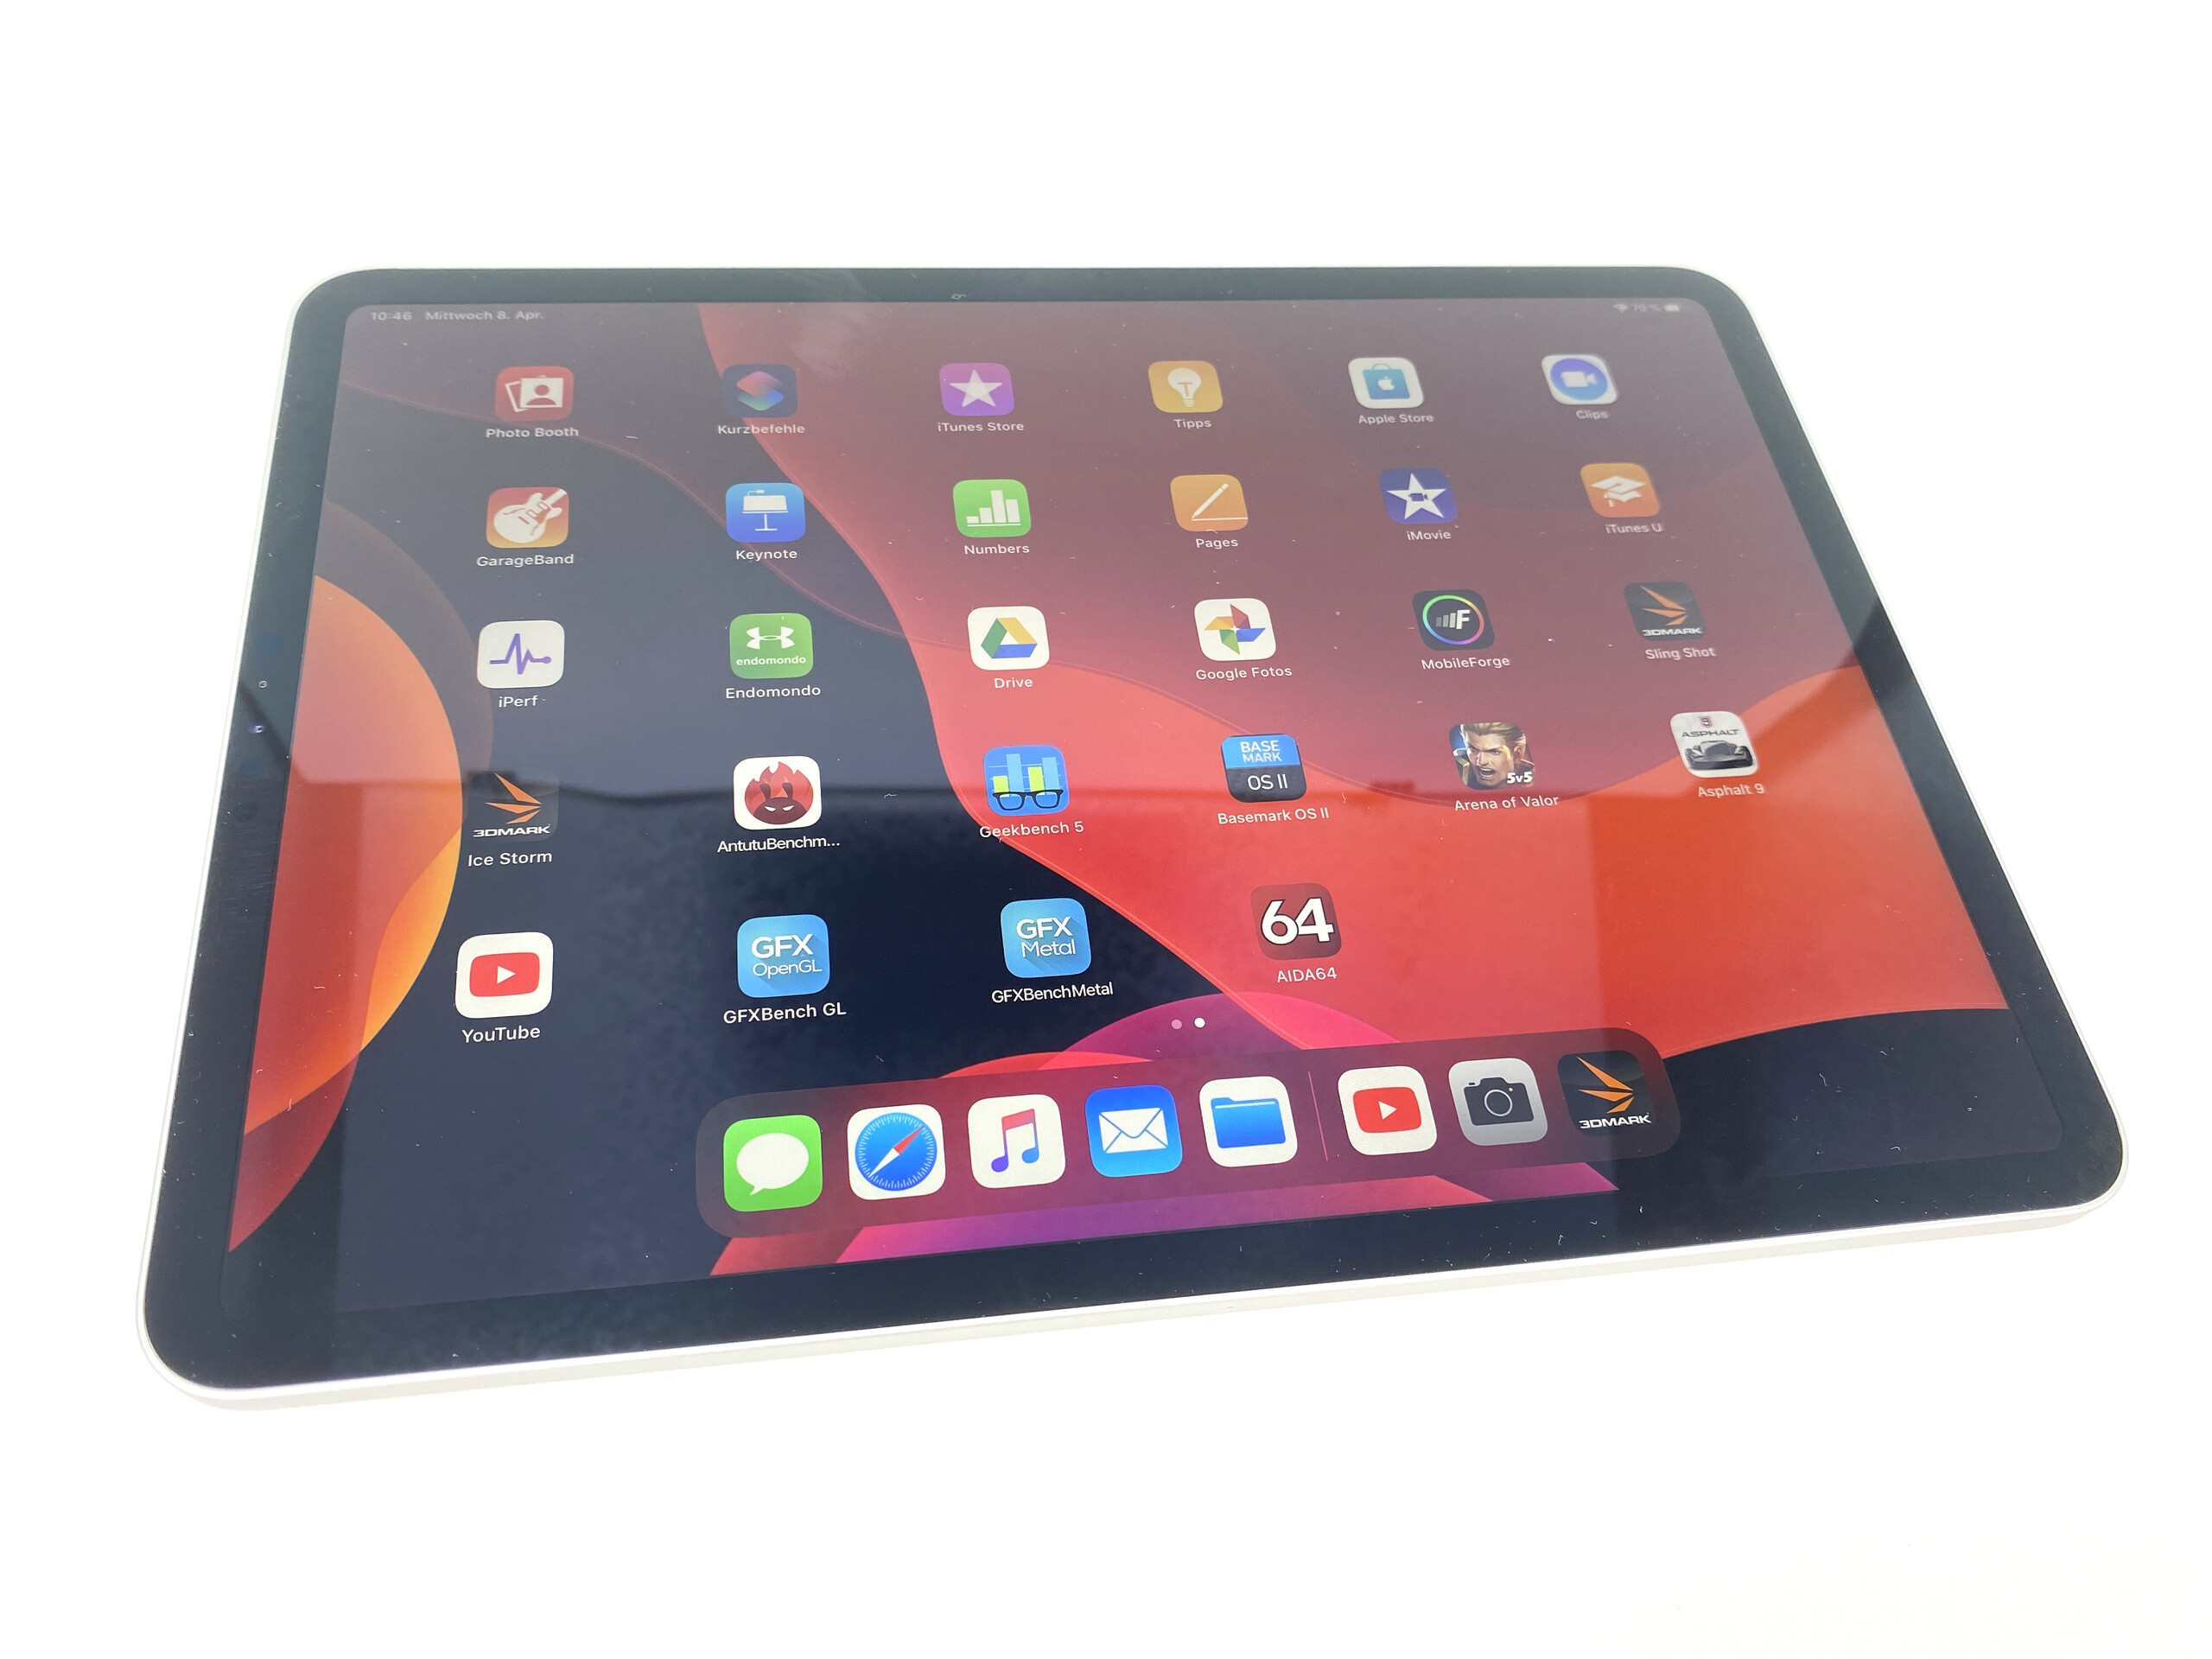
苹果iPad Pro 11 2020款平板电脑评测:这才是升级应该有的样子
Rating | Date | Model | Weight | Height | Size | Resolution | Price |
|---|---|---|---|---|---|---|---|
| 90.4 % v7 (old) | 06 / 2020 | Apple iPad Pro 11 2020 A12Z Bionic, A12Z Bionic GPU | 471 g | 5.9 mm | 11.00" | 2388x1668 | |
| 89.8 % v7 (old) | 11 / 2018 | Apple iPad Pro 11 2018 A12X Bionic, A12X Bionic GPU | 468 g | 5.9 mm | 11.00" | 2388x1668 | |
| 88.1 % v7 (old) | 03 / 2020 | Microsoft Surface Pro 7 i7-1065G7, Iris Plus Graphics G7 (Ice Lake 64 EU) | 790 g | 8.5 mm | 12.30" | 2736x1824 | |
| 87.8 % v7 (old) | 10 / 2019 | Samsung Galaxy Tab S6 SM-T860 SD 855, Adreno 640 | 420 g | 5.7 mm | 10.50" | 2560x1600 | |
| 83.4 % v7 (old) | 03 / 2018 | Huawei MediaPad M5 10.8 Kirin 960s, Mali-G71 MP8 | 498 g | 7.3 mm | 10.80" | 2560x1600 |


| |||||||||||||||||||||||||
Brightness Distribution: 84 %
Center on Battery: 617 cd/m²
Contrast: 1714:1 (Black: 0.36 cd/m²)
ΔE ColorChecker Calman: 0.94 | ∀{0.5-29.43 Ø4.71}
ΔE Greyscale Calman: 1.4 | ∀{0.09-98 Ø4.96}
99.9% sRGB (Calman 2D)
Gamma: 2.156
CCT: 6733 K
| Apple iPad Pro 11 2020 IPS, 2388x1668, 11" | Apple iPad Pro 11 2018 IPS, 2388x1668, 11" | Microsoft Surface Pro 7 IPS, 2736x1824, 12.3" | Samsung Galaxy Tab S6 SM-T860 Super AMOLED, 2560x1600, 10.5" | Huawei MediaPad M5 10.8 IPS, 2560x1600, 10.8" | |
|---|---|---|---|---|---|
| Screen | -8% | -11% | -79% | -76% | |
| Brightness middle (cd/m²) | 617 | 639 4% | 435 -29% | 446 -28% | 382 -38% |
| Brightness (cd/m²) | 585 | 591 1% | 422 -28% | 445 -24% | 378 -35% |
| Brightness Distribution (%) | 84 | 87 4% | 90 7% | 86 2% | 92 10% |
| Black Level * (cd/m²) | 0.36 | 0.45 -25% | 0.32 11% | 0.24 33% | |
| Contrast (:1) | 1714 | 1420 -17% | 1359 -21% | 1592 -7% | |
| Colorchecker dE 2000 * | 0.94 | 0.92 2% | 1.18 -26% | 2.7 -187% | 2.8 -198% |
| Colorchecker dE 2000 max. * | 1.87 | 2.59 -39% | 2.27 -21% | 5.4 -189% | 6 -221% |
| Greyscale dE 2000 * | 1.4 | 1.3 7% | 1.12 20% | 2.1 -50% | 3.5 -150% |
| Gamma | 2.156 102% | 2.22 99% | 2.3 96% | 2.05 107% | 2.33 94% |
| CCT | 6733 97% | 6656 98% | 6502 100% | 6468 100% | 6903 94% |
| Colorchecker dE 2000 calibrated * | 3.49 | ||||
| Color Space (Percent of AdobeRGB 1998) (%) | 60 | ||||
| Color Space (Percent of sRGB) (%) | 96 |
* ... smaller is better
Screen Flickering / PWM (Pulse-Width Modulation)
| Screen flickering / PWM detected | 1316 Hz | 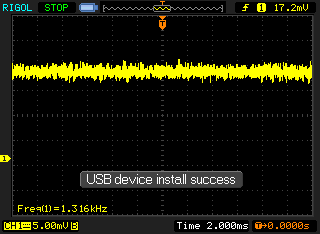 | |
The display backlight flickers at 1316 Hz (worst case, e.g., utilizing PWM) . The frequency of 1316 Hz is quite high, so most users sensitive to PWM should not notice any flickering. In comparison: 52 % of all tested devices do not use PWM to dim the display. If PWM was detected, an average of 7744 (minimum: 5 - maximum: 343500) Hz was measured. | |||
Display Response Times
| ↔ Response Time Black to White | ||
|---|---|---|
| 24 ms ... rise ↗ and fall ↘ combined | ↗ 9 ms rise | 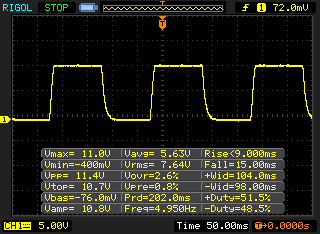 |
| ↘ 15 ms fall | ||
| The screen shows good response rates in our tests, but may be too slow for competitive gamers. In comparison, all tested devices range from 0.1 (minimum) to 240 (maximum) ms. » 54 % of all devices are better. This means that the measured response time is worse than the average of all tested devices (19.8 ms). | ||
| ↔ Response Time 50% Grey to 80% Grey | ||
| 52 ms ... rise ↗ and fall ↘ combined | ↗ 25 ms rise | 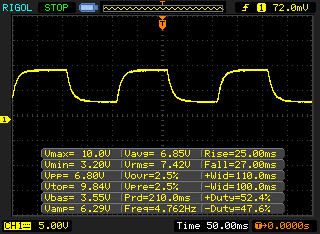 |
| ↘ 27 ms fall | ||
| The screen shows slow response rates in our tests and will be unsatisfactory for gamers. In comparison, all tested devices range from 0.165 (minimum) to 636 (maximum) ms. » 88 % of all devices are better. This means that the measured response time is worse than the average of all tested devices (30.9 ms). | ||
| 3DMark | |
| 1280x720 offscreen Ice Storm Unlimited Score | |
| Apple iPad Pro 11 2020 | |
| Average Apple A12Z Bionic (110582 - 110846, n=2) | |
| Samsung Galaxy Tab S6 SM-T860 | |
| Huawei MediaPad M5 10.8 | |
| 1280x720 offscreen Ice Storm Unlimited Graphics Score | |
| Apple iPad Pro 11 2020 | |
| Average Apple A12Z Bionic (220422 - 221941, n=2) | |
| Samsung Galaxy Tab S6 SM-T860 | |
| Huawei MediaPad M5 10.8 | |
| 1280x720 offscreen Ice Storm Unlimited Physics | |
| Average Apple A12Z Bionic (40279 - 40299, n=2) | |
| Apple iPad Pro 11 2020 | |
| Samsung Galaxy Tab S6 SM-T860 | |
| Huawei MediaPad M5 10.8 | |
| AnTuTu v8 - Total Score | |
| Average Apple A12Z Bionic (712218 - 751846, n=2) | |
| Apple iPad Pro 11 2020 | |
| Apple iPad Pro 11 2018 | |
| Basemark ES 3.1 / Metal - offscreen Overall Score | |
| Average Apple A12Z Bionic (5657 - 5709, n=2) | |
| Apple iPad Pro 11 2020 | |
| Apple iPad Pro 11 2018 | |
| Average of class Tablet (255 - 5784, n=6, last 2 years) | |
| Jetstream 2 - 2.0 Total | |
| Average of class Tablet (35.8 - 420, n=55, last 2 years) | |
| Apple iPad Pro 11 2020 (Safari 14.1) | |
| Apple iPad Pro 11 2020 (Chrome 80) | |
| Average Apple A12Z Bionic (124.5 - 127.4, n=3) | |
| Samsung Galaxy Tab S6 SM-T860 (Chrome 77.0.3865.116) | |
| JetStream 1.1 - 1.1 Total | |
| Apple iPad Pro 11 2018 (Safari 13) | |
| Apple iPad Pro 11 2020 (Chrome 80) | |
| Average Apple A12Z Bionic (272 - 274, n=2) | |
| Microsoft Surface Pro 7 (Microsoft Edge 44.18362.449.0) | |
| Samsung Galaxy Tab S6 SM-T860 (Chrome 77.0.3865.116) | |
| Huawei MediaPad M5 10.8 (Chrome 65) | |
| WebXPRT 3 - Overall | |
| Average of class Tablet (168 - 520, n=10, last 2 years) | |
| Apple iPad Pro 11 2020 (Safari 14.1) | |
| Apple iPad Pro 11 2020 (Chrome 80) | |
| Apple iPad Pro 11 2018 (Safari 13) | |
| Average Apple A12Z Bionic (140 - 194, n=3) | |
| Samsung Galaxy Tab S6 SM-T860 (Chrome 77.0.3865.116) | |
| Speedometer 2.0 - Result 2.0 | |
| Average of class Tablet (6.8 - 790, n=33, last 2 years) | |
| Apple iPad Pro 11 2020 (Safari 14.1) | |
| Average Apple A12Z Bionic (135 - 154, n=2) | |
| Apple iPad Pro 11 2018 (IOS 12.1.1) | |
| Samsung Galaxy Tab S6 SM-T860 (Chrome 77.0.3865.116) | |
| Octane V2 - Total Score | |
| Average of class Tablet (1633 - 138481, n=71, last 2 years) | |
| Apple iPad Pro 11 2018 (Safari 13) | |
| Average Apple A12Z Bionic (42372 - 43057, n=3) | |
| Apple iPad Pro 11 2020 (Safari 14.1) | |
| Apple iPad Pro 11 2020 (Chrome 80) | |
| Microsoft Surface Pro 7 (Microsoft Edge 44.18362.449.0) | |
| Samsung Galaxy Tab S6 SM-T860 (Chrome 77.0.3865.116) | |
| Huawei MediaPad M5 10.8 (Chrome 65) | |
| Mozilla Kraken 1.1 - Total | |
| Huawei MediaPad M5 10.8 (Chrome 65) | |
| Samsung Galaxy Tab S6 SM-T860 (Chrome 77.0.3865.116) | |
| Average of class Tablet (243 - 16233, n=65, last 2 years) | |
| Microsoft Surface Pro 7 (Microsoft Edge 44.18362.449.0) | |
| Apple iPad Pro 11 2020 (Chrome 80) | |
| Average Apple A12Z Bionic (646 - 646, n=2) | |
| Apple iPad Pro 11 2018 (Safari 13) | |
* ... smaller is better
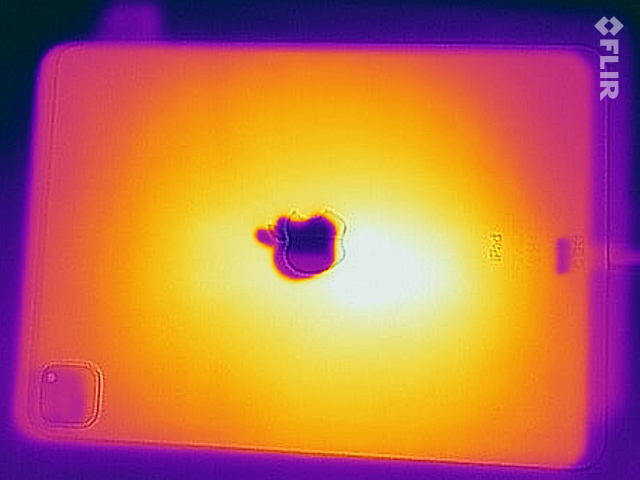
(+) The maximum temperature on the upper side is 37.9 °C / 100 F, compared to the average of 33.7 °C / 93 F, ranging from 20.7 to 53.2 °C for the class Tablet.
(±) The bottom heats up to a maximum of 40.1 °C / 104 F, compared to the average of 33.2 °C / 92 F
(±) In idle usage, the average temperature for the upper side is 33.2 °C / 92 F, compared to the device average of 30 °C / 86 F.
Apple iPad Pro 11 2020 audio analysis
(±) | speaker loudness is average but good (78.5 dB)
Bass 100 - 315 Hz
(±) | reduced bass - on average 6.3% lower than median
(±) | linearity of bass is average (7.6% delta to prev. frequency)
Mids 400 - 2000 Hz
(±) | higher mids - on average 6.4% higher than median
(+) | mids are linear (6% delta to prev. frequency)
Highs 2 - 16 kHz
(+) | balanced highs - only 1.9% away from median
(+) | highs are linear (6.2% delta to prev. frequency)
Overall 100 - 16.000 Hz
(+) | overall sound is linear (13% difference to median)
Compared to same class
» 23% of all tested devices in this class were better, 4% similar, 74% worse
» The best had a delta of 7%, average was 20%, worst was 129%
Compared to all devices tested
» 13% of all tested devices were better, 2% similar, 85% worse
» The best had a delta of 4%, average was 23%, worst was 134%
Apple iPad Pro 11 2018 audio analysis
(±) | speaker loudness is average but good (78.7 dB)
Bass 100 - 315 Hz
(±) | reduced bass - on average 8.9% lower than median
(±) | linearity of bass is average (12.2% delta to prev. frequency)
Mids 400 - 2000 Hz
(+) | balanced mids - only 1.9% away from median
(+) | mids are linear (2.4% delta to prev. frequency)
Highs 2 - 16 kHz
(+) | balanced highs - only 1.9% away from median
(+) | highs are linear (6.4% delta to prev. frequency)
Overall 100 - 16.000 Hz
(±) | linearity of overall sound is average (16.5% difference to median)
Compared to same class
» 38% of all tested devices in this class were better, 5% similar, 57% worse
» The best had a delta of 7%, average was 20%, worst was 129%
Compared to all devices tested
» 28% of all tested devices were better, 6% similar, 66% worse
» The best had a delta of 4%, average was 23%, worst was 134%
| Off / Standby | |
| Idle | |
| Load |
|
Key:
min: | |
| Apple iPad Pro 11 2020 7538 mAh | Apple iPad Pro 11 2018 7736 mAh | Microsoft Surface Pro 7 mAh | Samsung Galaxy Tab S6 SM-T860 7040 mAh | Huawei MediaPad M5 10.8 7500 mAh | |
|---|---|---|---|---|---|
| Power Consumption | -6% | -186% | 23% | -7% | |
| Idle Minimum * (Watt) | 1.3 | 1.2 8% | 4.4 -238% | 1.96 -51% | 2.01 -55% |
| Idle Average * (Watt) | 3.5 | 4.1 -17% | 8.7 -149% | 2.8 20% | 5.4 -54% |
| Idle Maximum * (Watt) | 5.6 | 7.5 -34% | 9.6 -71% | 2.82 50% | 5.44 3% |
| Load Average * (Watt) | 12.5 | 13.6 -9% | 44 -252% | 5.31 58% | 8.55 32% |
| Load Maximum * (Watt) | 19.2 | 15.2 21% | 61 -218% | 11.91 38% | 11.53 40% |
* ... smaller is better
| Apple iPad Pro 11 2020 7538 mAh | Apple iPad Pro 11 2018 7736 mAh | Microsoft Surface Pro 7 mAh | Samsung Galaxy Tab S6 SM-T860 7040 mAh | Huawei MediaPad M5 10.8 7500 mAh | |
|---|---|---|---|---|---|
| Battery runtime | 4% | -50% | -2% | -22% | |
| Reader / Idle (h) | 33.4 | 34.3 3% | 11.5 -66% | 21.3 -36% | 22.4 -33% |
| H.264 (h) | 15.6 | 16.4 5% | 6.7 -57% | 14.5 -7% | 11.7 -25% |
| WiFi v1.3 (h) | 15 | 15.3 2% | 9.8 -35% | 9.3 -38% | 10.8 -28% |
| Load (h) | 3.3 | 3.5 6% | 1.9 -42% | 5.7 73% | 3.3 0% |
Pros
Cons
Verdict – Sensible Updates and a Lower Price

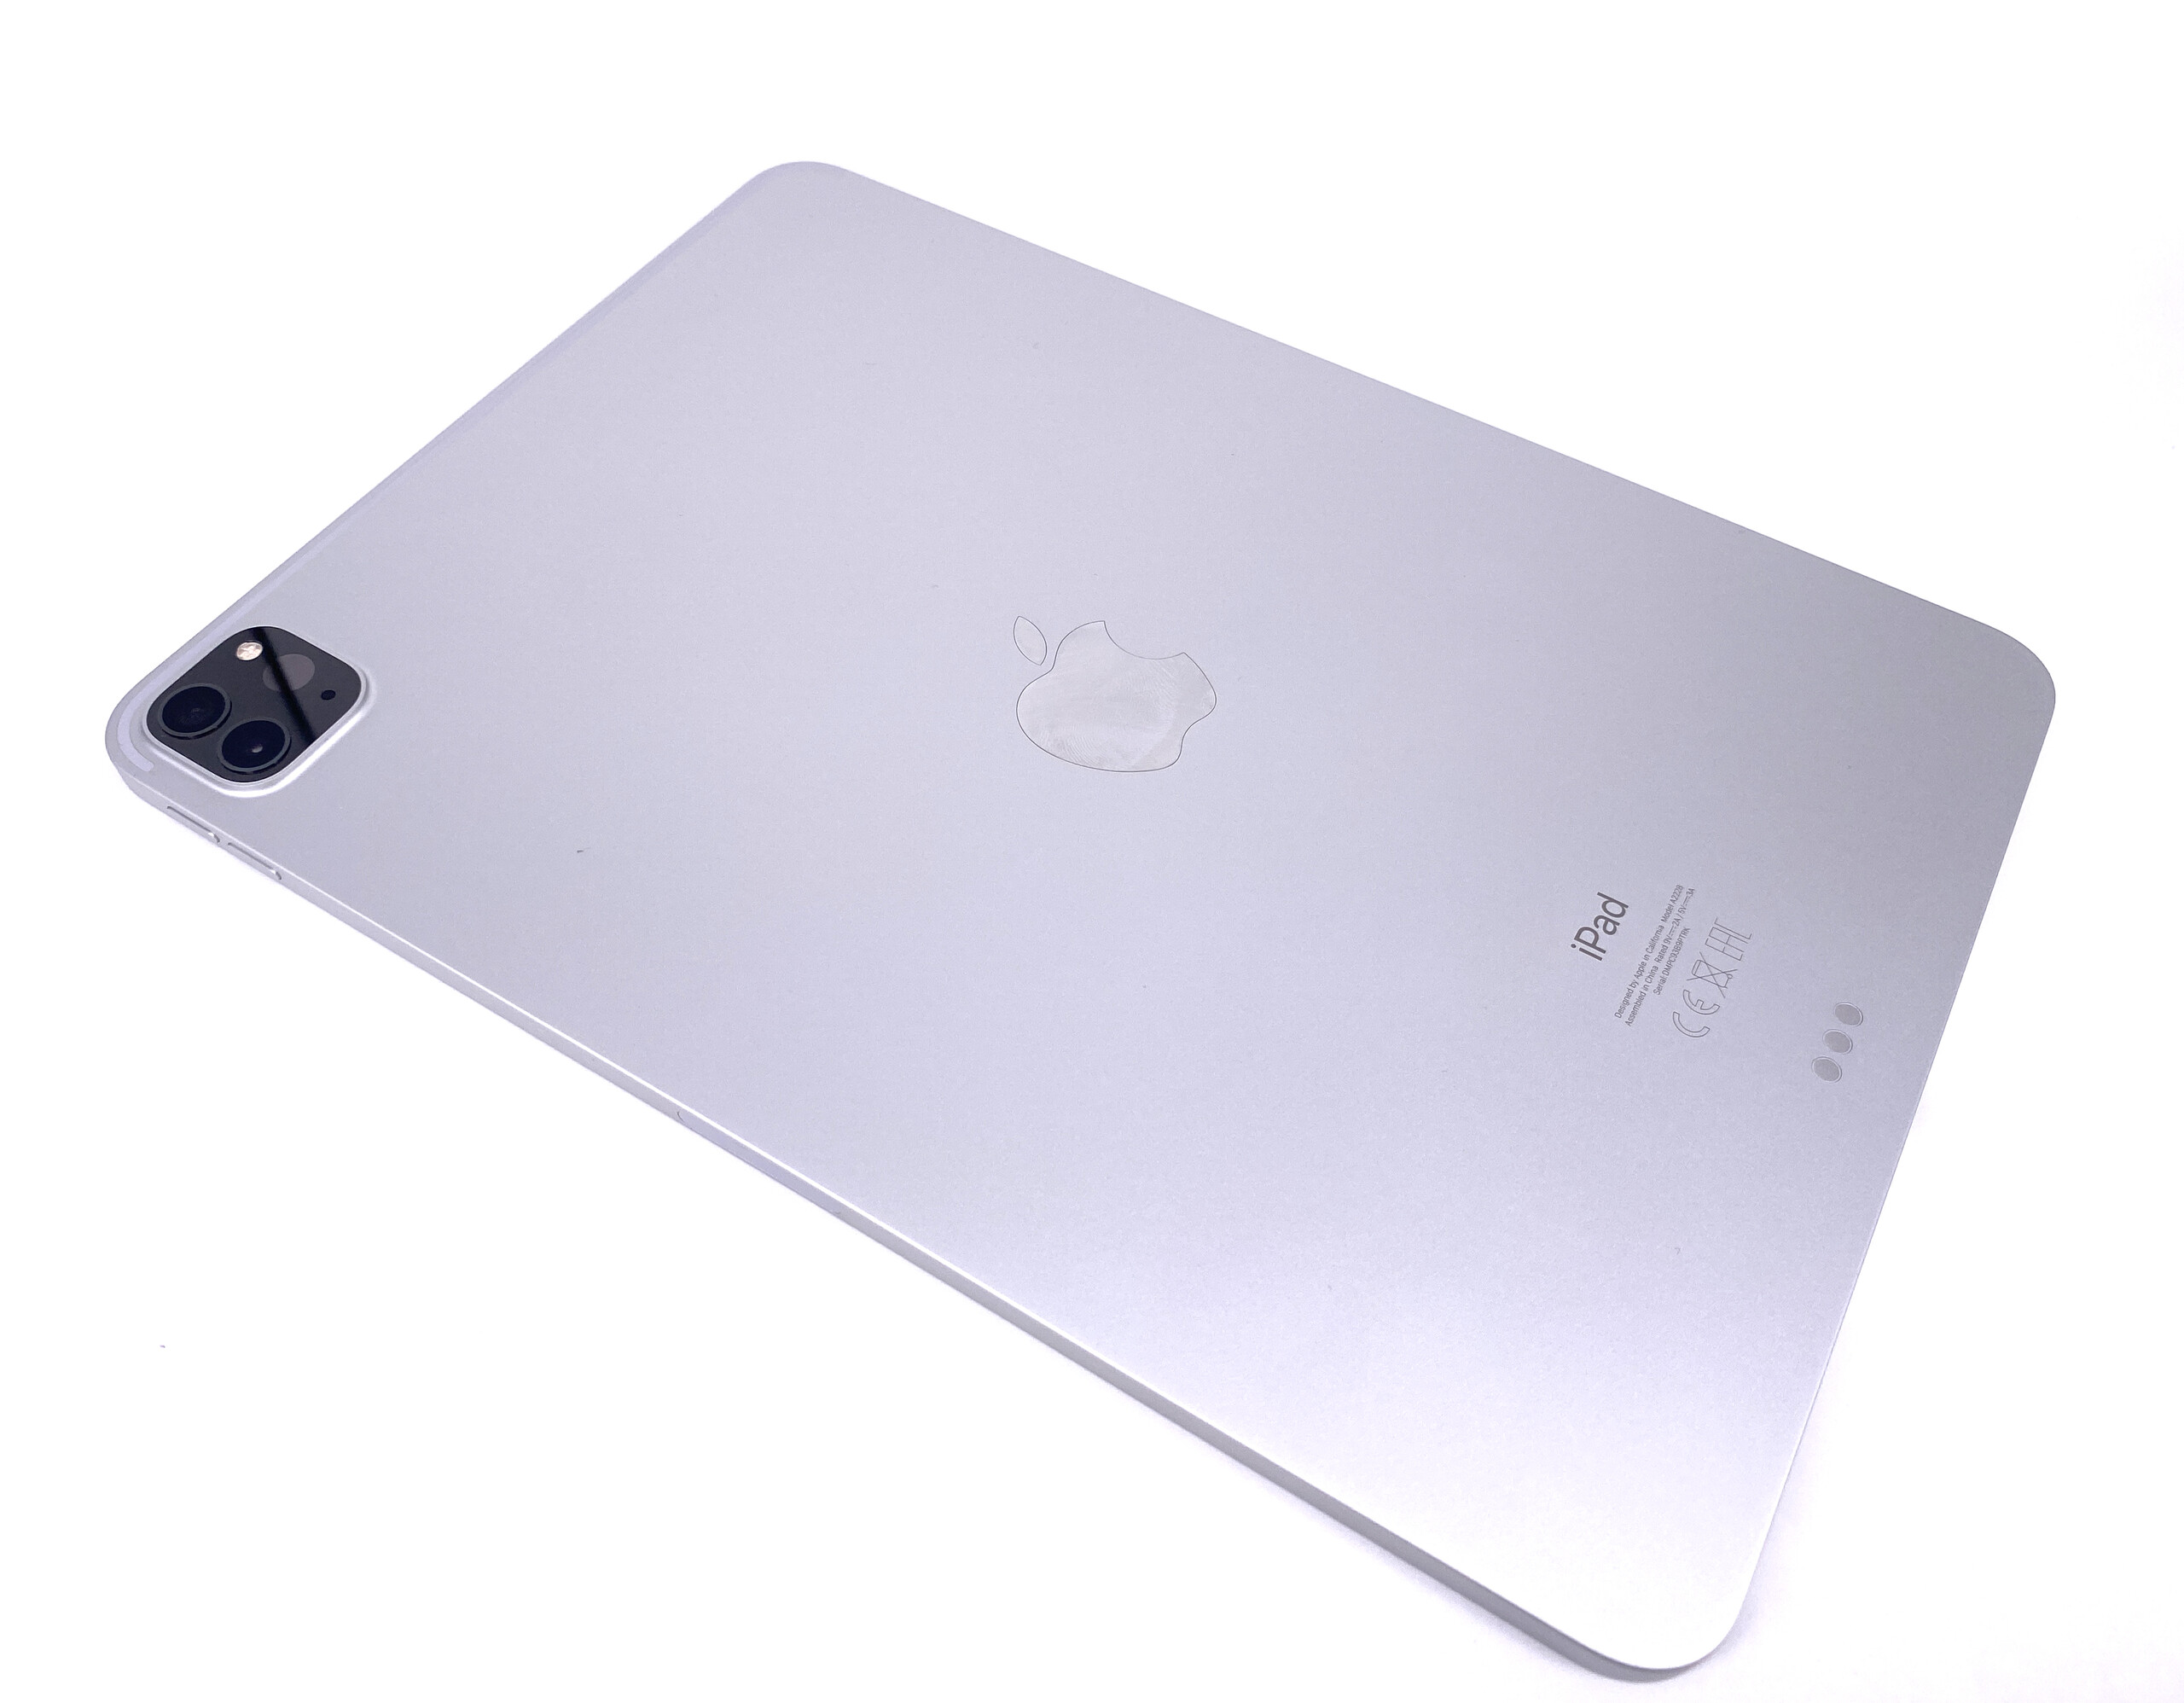
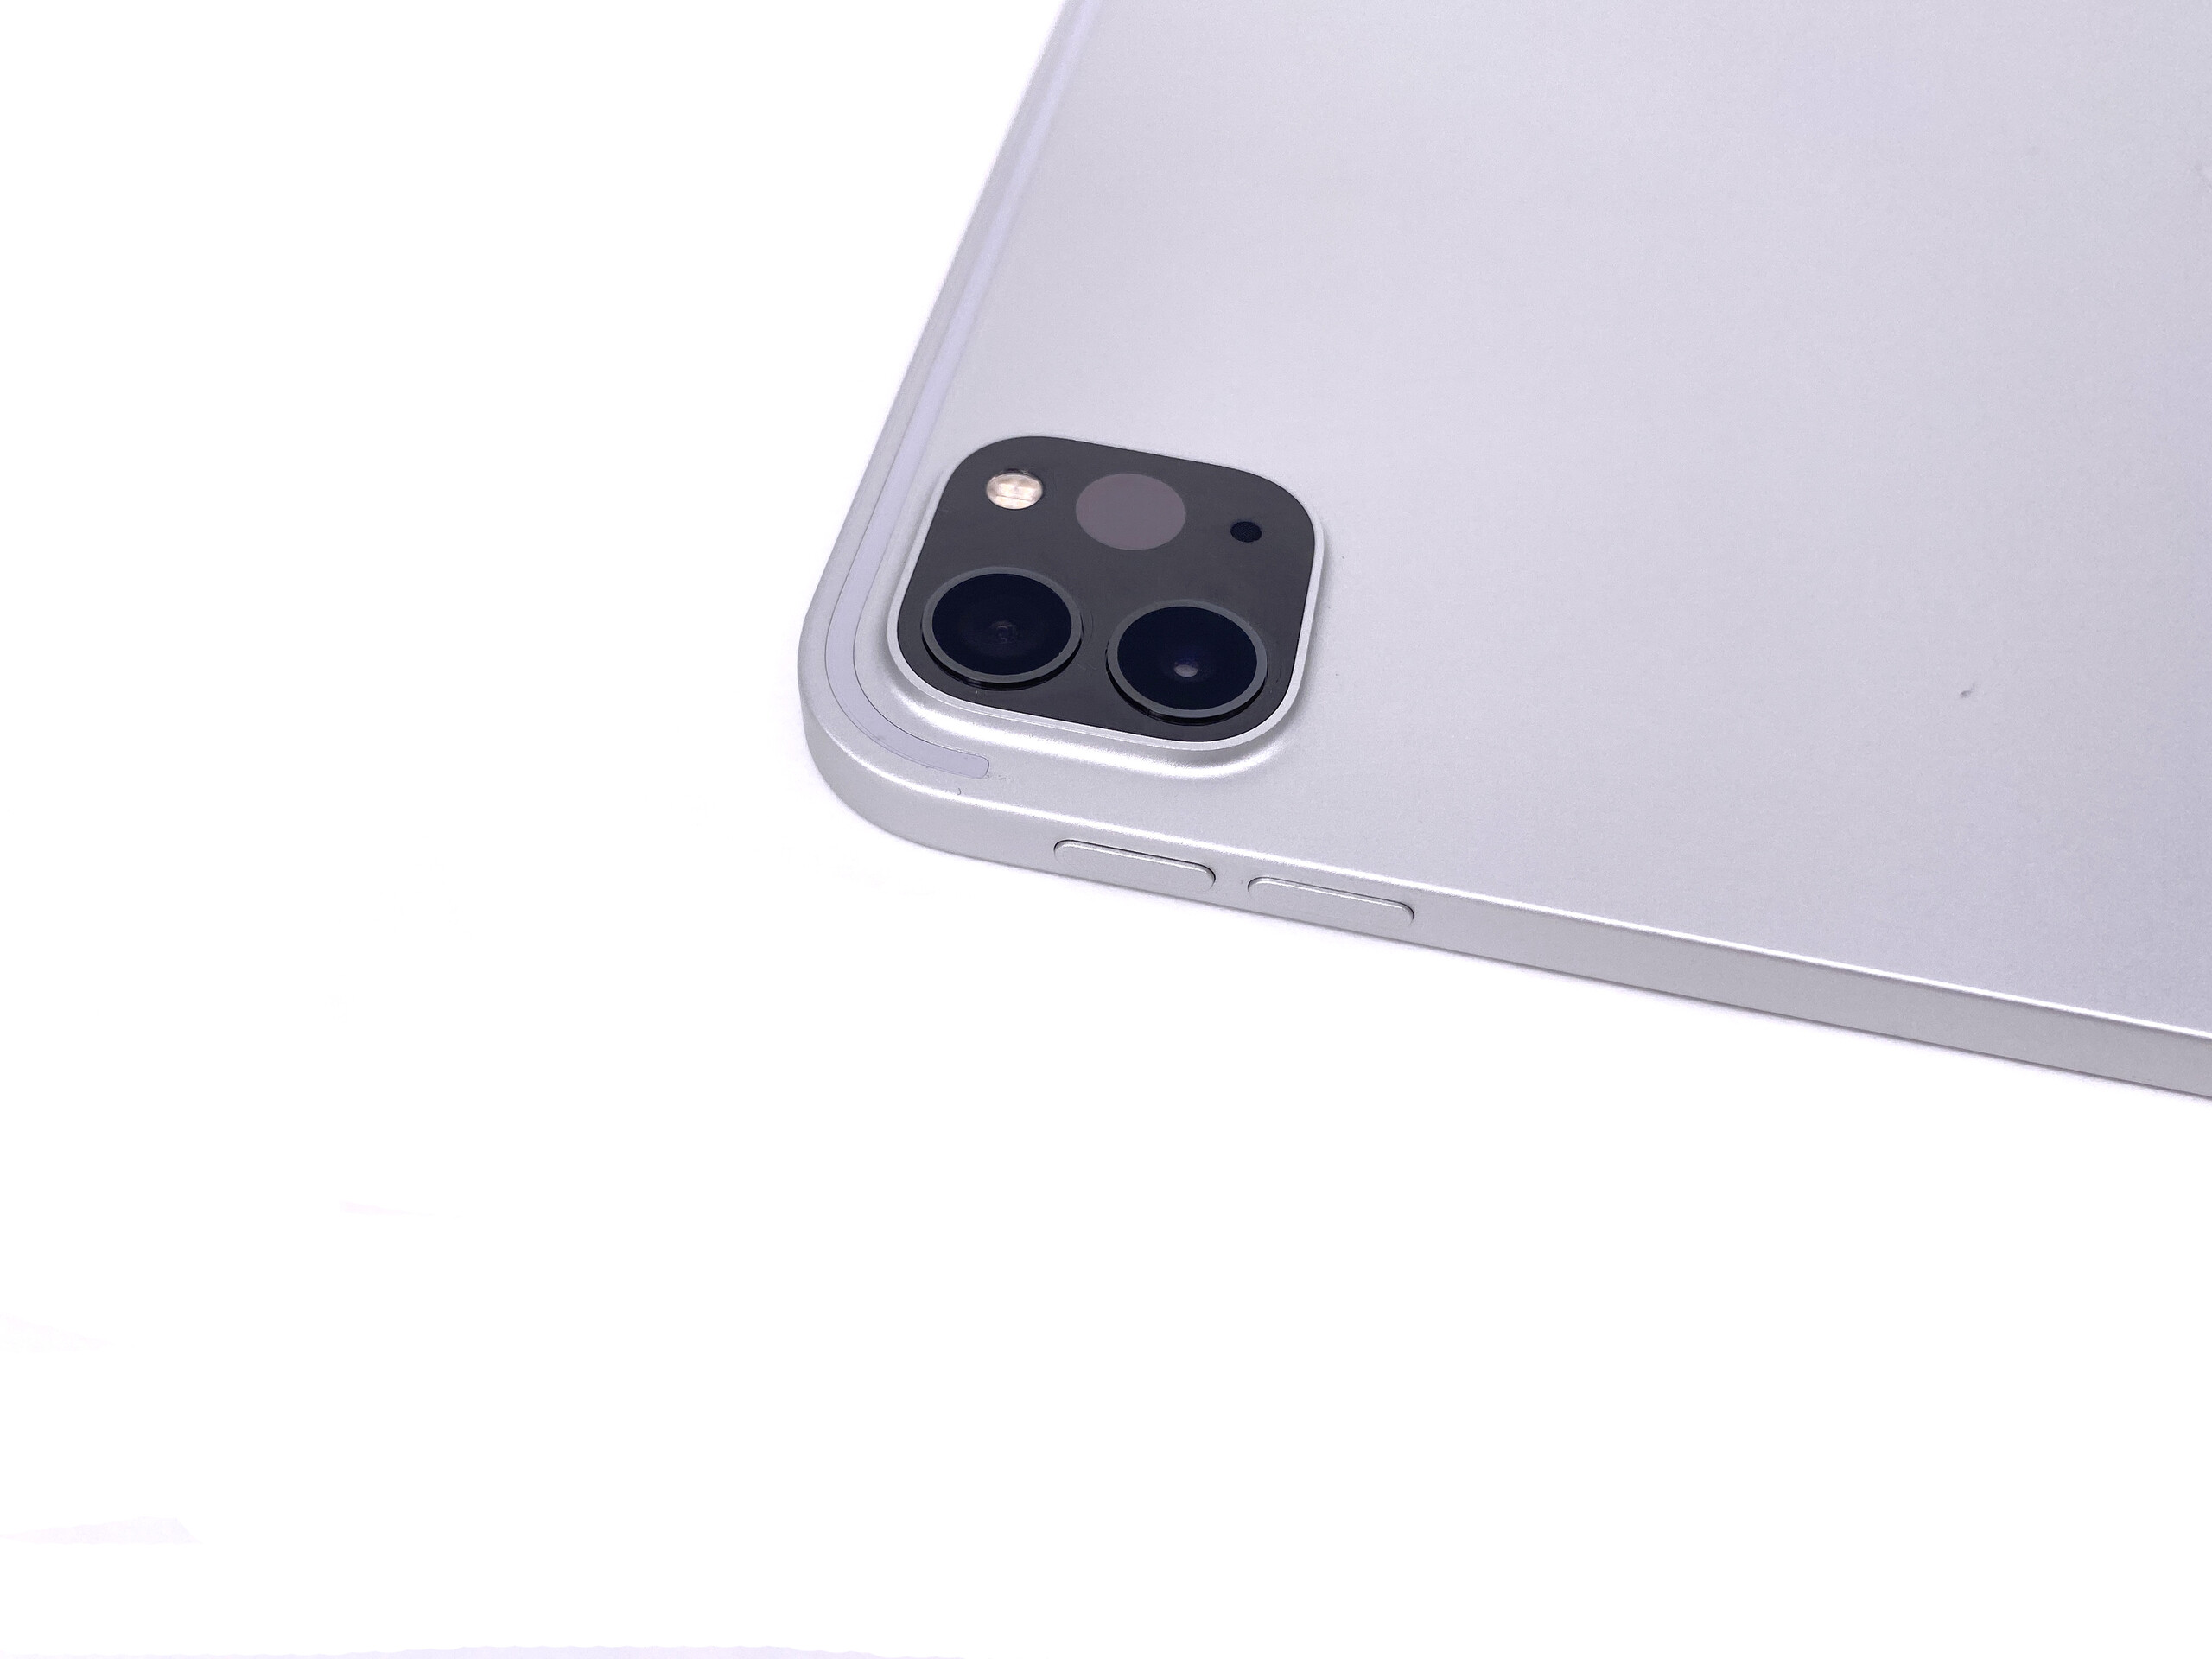
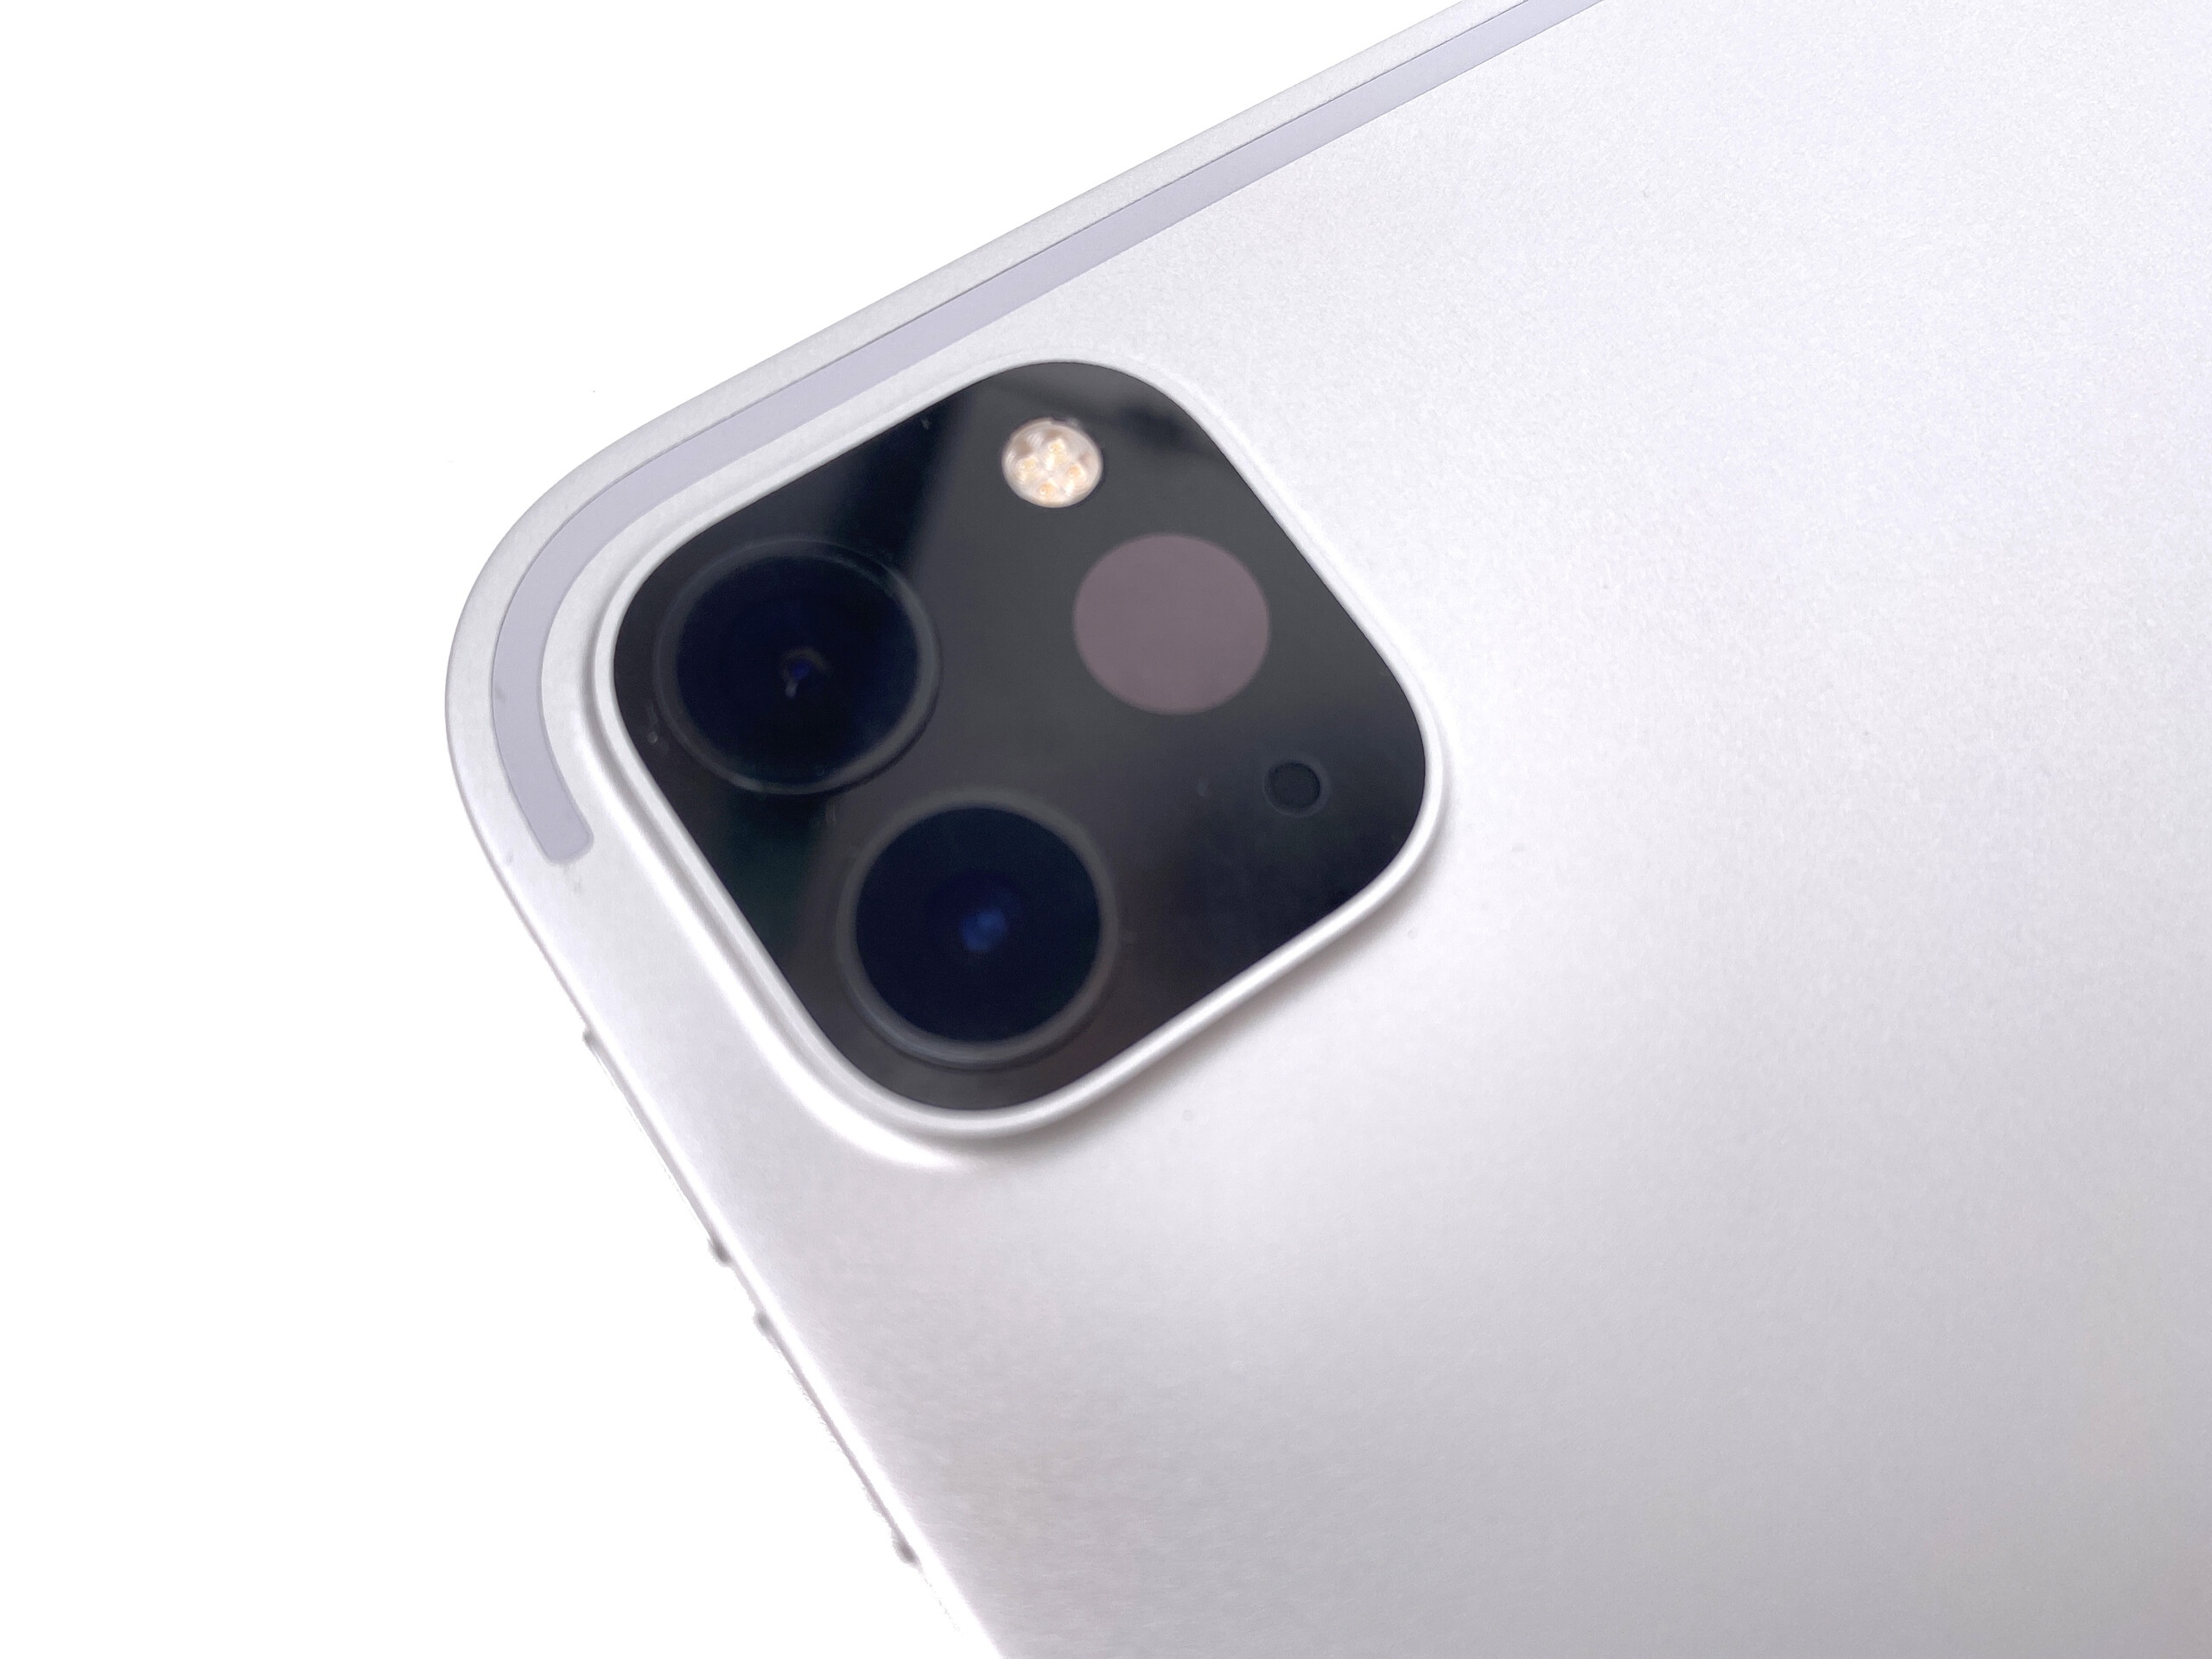
苹果对其2020 iPad Pro 11机型进行了一些改进,甚至降低了大多数配置的价格。尽管这听起来似乎很划算,但Apple iPad Pro仍然不便宜。但是,它的许多方面也对得起高昂的价格:尽管在平板电脑领域已经成为标杆,但相机得到了进一步的改进。尽管它们无法与最新的高端智能手机相机匹敌,但它们具有拍摄精美照片的能力。
魔术键盘扩展了各种各样的配件,USB Type-C端口也使Apple平板电脑可以使用第三方硬件。例如,由于有了新的光标,现在可以使用普通的USB鼠标在系统中导航。
该设备功能强大,配备有快速的Wi-Fi和存储设备,并且具有非常精确的色彩,并且由于其120 Hz的刷新率,因此能够显示极其流畅的动画。
合理的更新,且价格基本上处于较为适中的状态:如果您负担得起的话,Apple iPad Pro 11在2020年再次成为不错的选择。
由于Apple总体上进行了非常合理的更新,因此即使是上一代的升级也值得。机身容易弯的事实是唯一真正的缺点。
注意:由于我们的许多基准测试尚未与iPad OS 13.4兼容,并且Magic Keyboard作为重要附件将于5月发布,因此一旦获得新信息,我们将更新我们的评论。
Apple iPad Pro 11 2020
- 04/11/2020 v7 (old)
Florian Schmitt
Price comparison

