三星 Galaxy Tab S3 平板电脑简短评测
| Networking | |
| iperf3 transmit AX12 | |
| Samsung Galaxy Tab S3 SM-T825 | |
| Apple iPad (2017) | |
| Asus ZenPad 3s 10 Z500M | |
| Huawei MediaPad M3 8.4 inch | |
| iperf3 receive AX12 | |
| Samsung Galaxy Tab S3 SM-T825 | |
| Apple iPad (2017) | |
| Asus ZenPad 3s 10 Z500M | |
| Huawei MediaPad M3 8.4 inch | |

| |||||||||||||||||||||||||
Brightness Distribution: 82 %
Center on Battery: 452 cd/m²
Contrast: ∞:1 (Black: 0 cd/m²)
ΔE ColorChecker Calman: 1.8 | ∀{0.5-29.43 Ø4.71}
ΔE Greyscale Calman: 1.2 | ∀{0.09-98 Ø4.96}
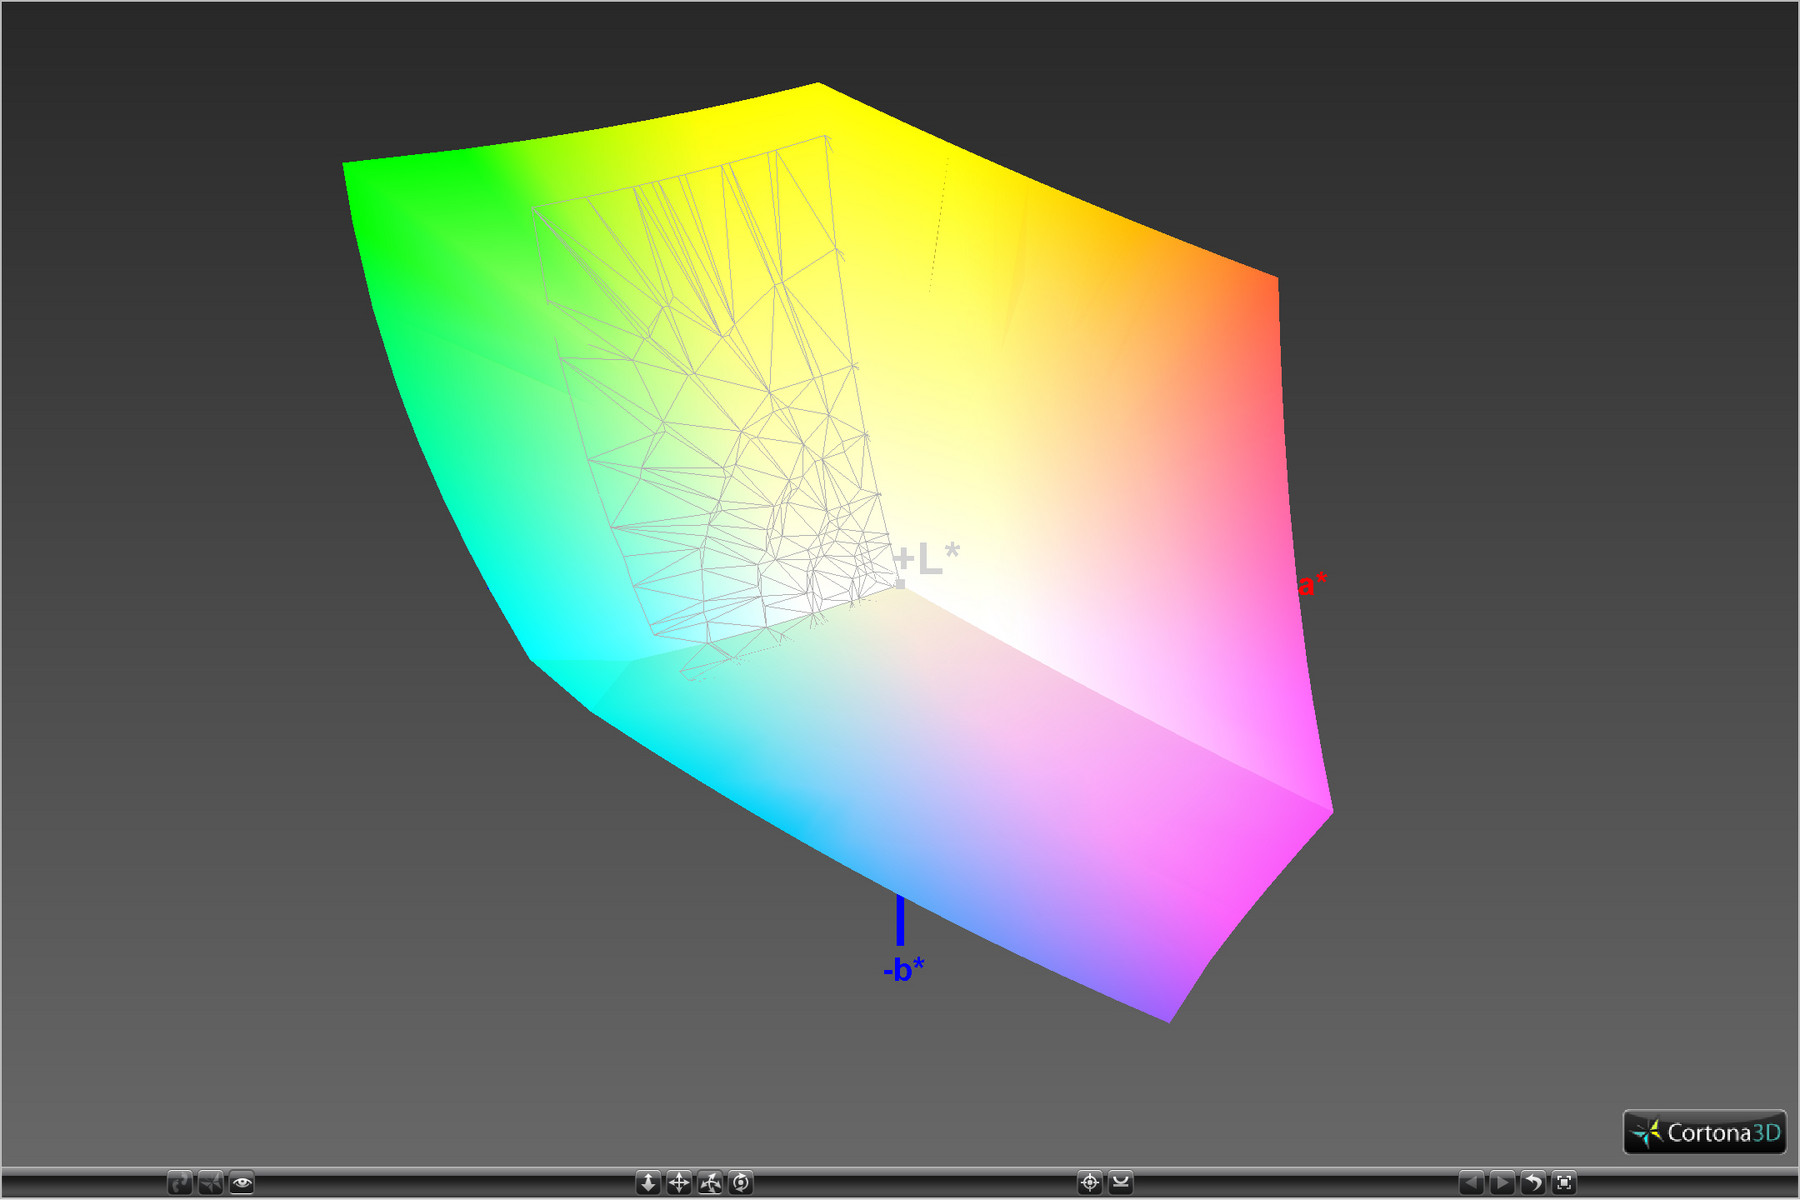
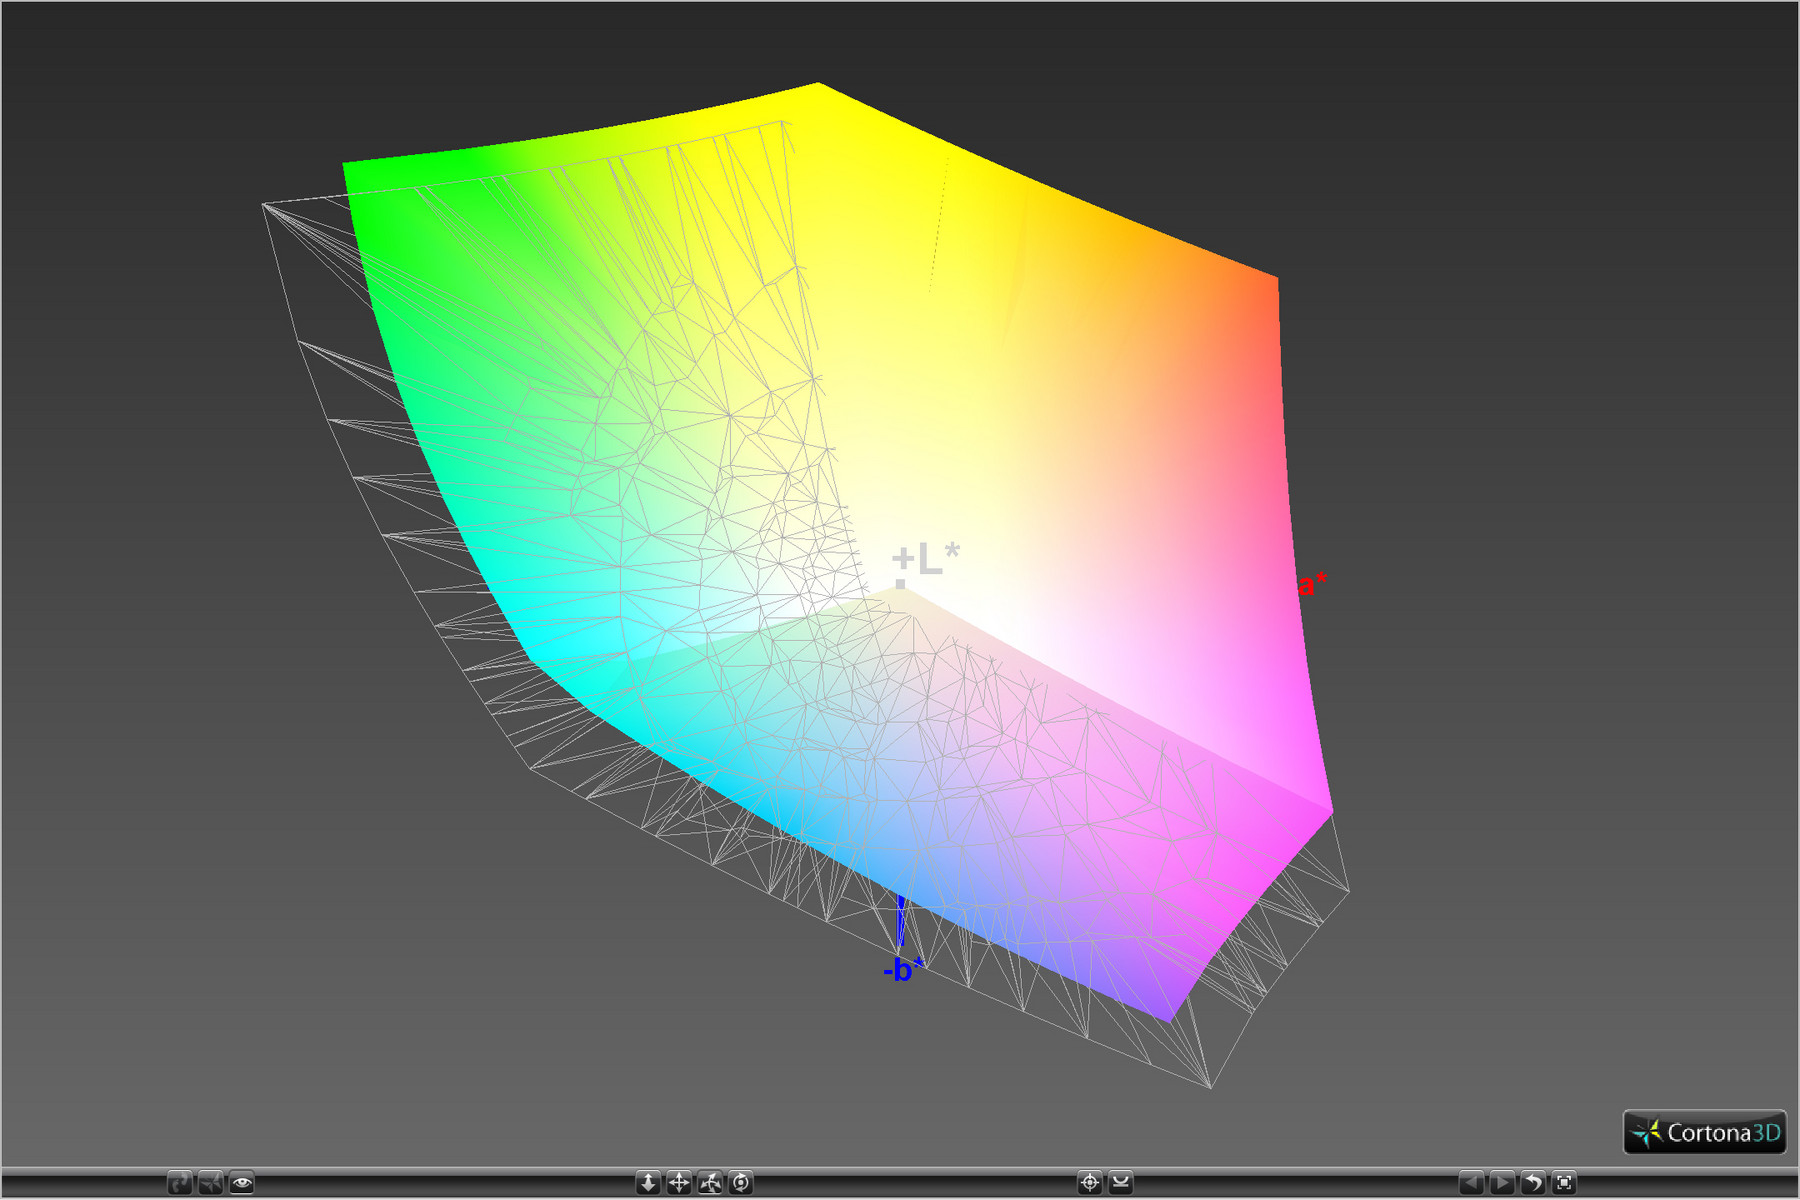
99.06% sRGB (Argyll 1.6.3 3D)
82.32% AdobeRGB 1998 (Argyll 1.6.3 3D)
94% AdobeRGB 1998 (Argyll 3D)
99.1% sRGB (Argyll 3D)
83.9% Display P3 (Argyll 3D)
Gamma: 2.11
CCT: 6500 K
| Samsung Galaxy Tab S3 SM-T825 Super AMOLED, 2048x1526, 9.7" | Samsung Galaxy Tab S2 9.7 LTE Super AMOLED, 2048x1536, 9.7" | Huawei MediaPad T2 10.0 Pro IPS, 1920x1200, 10.1" | Apple iPad Pro 9.7 IPS, 2048x1536, 9.7" | Google Pixel C LTPS, 2560x1800, 10.2" | Asus ZenPad 3s 10 Z500M IPS, 2048x1536, 9.7" | Apple iPad (2017) IPS, 2048x1536, 9.7" | |
|---|---|---|---|---|---|---|---|
| Screen | -11% | -94% | 11% | -145% | -141% | -0% | |
| Brightness middle (cd/m²) | 452 | 358 -21% | 392 -13% | 523 16% | 487 8% | 489 8% | 514 14% |
| Brightness (cd/m²) | 468 | 357 -24% | 385 -18% | 500 7% | 510 9% | 443 -5% | 485 4% |
| Brightness Distribution (%) | 82 | 86 5% | 91 11% | 93 13% | 91 11% | 86 5% | 88 7% |
| Black Level * (cd/m²) | 0.59 | 0.52 | 0.39 | 0.43 | 0.46 | ||
| Colorchecker dE 2000 * | 1.8 | 1.78 1% | 4.5 -150% | 1.1 39% | 5.24 -191% | 5.5 -206% | 1.4 22% |
| Colorchecker dE 2000 max. * | 4 | 7.8 -95% | 1.9 52% | 11.6 -190% | 2.9 27% | ||
| Greyscale dE 2000 * | 1.2 | 1.38 -15% | 4.8 -300% | 1.4 -17% | 7.95 -563% | 6.7 -458% | 2.1 -75% |
| Gamma | 2.11 104% | 2.24 98% | 2.47 89% | 2.11 104% | 2.16 102% | 2.06 107% | 2.22 99% |
| CCT | 6500 100% | 6366 102% | 7426 88% | 6662 98% | 6565 99% | 7457 87% | 6647 98% |
| Color Space (Percent of AdobeRGB 1998) (%) | 82.32 | 62.97 -24% | |||||
| Color Space (Percent of sRGB) (%) | 99.06 | 99.55 0% | |||||
| Contrast (:1) | 664 | 1006 | 1249 | 1137 | 1117 |
* ... smaller is better
Screen Flickering / PWM (Pulse-Width Modulation)
| Screen flickering / PWM detected | 221.2 Hz | ≤ 100 % brightness setting | 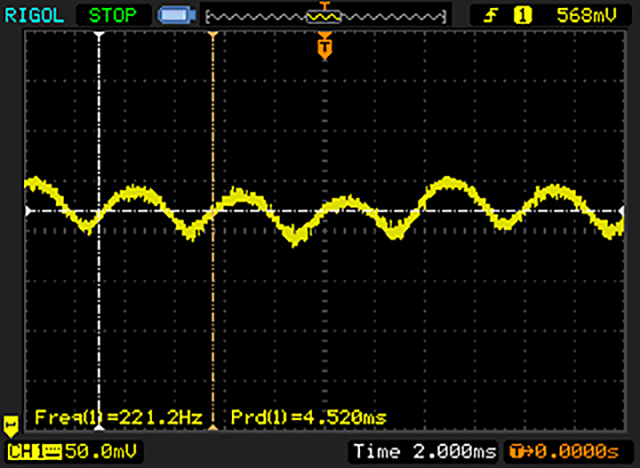 |
The display backlight flickers at 221.2 Hz (worst case, e.g., utilizing PWM) Flickering detected at a brightness setting of 100 % and below. There should be no flickering or PWM above this brightness setting. The frequency of 221.2 Hz is relatively low, so sensitive users will likely notice flickering and experience eyestrain at the stated brightness setting and below. In comparison: 52 % of all tested devices do not use PWM to dim the display. If PWM was detected, an average of 7757 (minimum: 5 - maximum: 343500) Hz was measured. | |||
Display Response Times
| ↔ Response Time Black to White | ||
|---|---|---|
| 3.2 ms ... rise ↗ and fall ↘ combined | ↗ 2 ms rise | 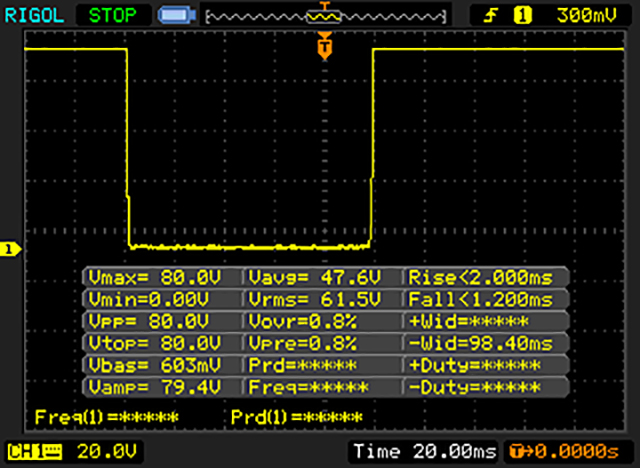 |
| ↘ 1.2 ms fall | ||
| The screen shows very fast response rates in our tests and should be very well suited for fast-paced gaming. In comparison, all tested devices range from 0.1 (minimum) to 240 (maximum) ms. » 15 % of all devices are better. This means that the measured response time is better than the average of all tested devices (19.8 ms). | ||
| ↔ Response Time 50% Grey to 80% Grey | ||
| 4 ms ... rise ↗ and fall ↘ combined | ↗ 2 ms rise | 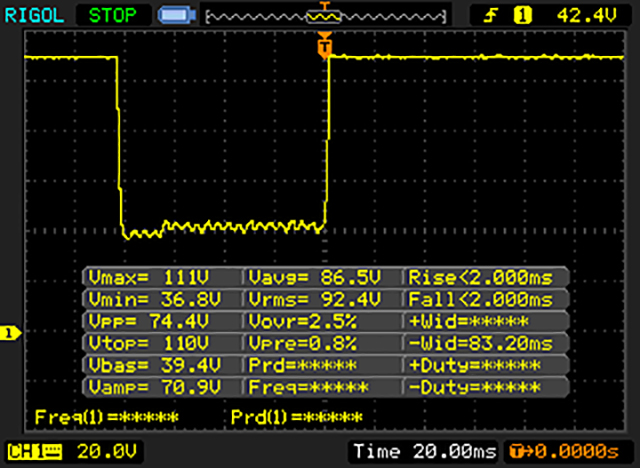 |
| ↘ 2 ms fall | ||
| The screen shows very fast response rates in our tests and should be very well suited for fast-paced gaming. In comparison, all tested devices range from 0.165 (minimum) to 636 (maximum) ms. » 15 % of all devices are better. This means that the measured response time is better than the average of all tested devices (31 ms). | ||
| GFXBench | |
| on screen Car Chase Onscreen | |
| Samsung Galaxy Tab S3 SM-T825 | |
| Samsung Galaxy S8 Plus | |
| Google Pixel C | |
| Huawei MediaPad M3 8.4 inch | |
| Asus ZenPad 3s 10 Z500M | |
| 1920x1080 Car Chase Offscreen | |
| Samsung Galaxy S8 Plus | |
| Google Pixel C | |
| Samsung Galaxy Tab S3 SM-T825 | |
| Huawei MediaPad M3 8.4 inch | |
| Asus ZenPad 3s 10 Z500M | |
| PCMark for Android | |
| Work performance score | |
| Google Pixel C | |
| Samsung Galaxy S8 Plus | |
| Samsung Galaxy Tab S3 SM-T825 | |
| Samsung Galaxy Tab S2 9.7 LTE | |
| Huawei MediaPad M3 8.4 inch | |
| Lenovo Yoga Book Android YB1-X90F | |
| Asus ZenPad 3s 10 Z500M | |
| Huawei MediaPad T2 10.0 Pro | |
| Work 2.0 performance score | |
| Samsung Galaxy Tab S3 SM-T825 | |
| Samsung Galaxy S8 Plus | |
| Storage score | |
| Samsung Galaxy S8 Plus | |
| Samsung Galaxy Tab S3 SM-T825 | |
| Geekbench 4.4 | |
| 64 Bit Single-Core Score | |
| Samsung Galaxy S8 Plus | |
| Samsung Galaxy Tab S3 SM-T825 | |
| 64 Bit Multi-Core Score | |
| Samsung Galaxy S8 Plus | |
| Samsung Galaxy Tab S3 SM-T825 | |
| Basemark ES 3.1 / Metal - offscreen Overall Score | |
| Samsung Galaxy S8 Plus | |
| Apple iPad Pro 9.7 | |
| Apple iPad (2017) | |
| Google Pixel C | |
| Samsung Galaxy Tab S3 SM-T825 | |
| ANDEBench PRO | |
| Device Score | |
| Google Pixel C | |
| Samsung Galaxy Tab S3 SM-T825 | |
| CoreMark-PRO/HPC (Base) | |
| Samsung Galaxy Tab S3 SM-T825 | |
| Google Pixel C | |
| Memory Bandwidth | |
| Samsung Galaxy Tab S3 SM-T825 | |
| Google Pixel C | |
| Memory Latency | |
| Google Pixel C | |
| Samsung Galaxy Tab S3 SM-T825 | |
| Storage | |
| Google Pixel C | |
| Samsung Galaxy Tab S3 SM-T825 | |
| Platform | |
| Google Pixel C | |
| Samsung Galaxy Tab S3 SM-T825 | |
| 3D | |
| Google Pixel C | |
| Samsung Galaxy Tab S3 SM-T825 | |
| Epic Citadel - Ultra High Quality | |
| Samsung Galaxy S8 Plus | |
| Google Pixel C | |
| Samsung Galaxy Tab S3 SM-T825 | |
* ... smaller is better
| Samsung Galaxy Tab S3 SM-T825 | Samsung Galaxy Tab S2 9.7 LTE | Huawei MediaPad T2 10.0 Pro | Google Pixel C | Huawei MediaPad M3 8.4 inch | Asus ZenPad 3s 10 Z500M | Lenovo Yoga Book Android YB1-X90F | Samsung Galaxy S8 Plus | |
|---|---|---|---|---|---|---|---|---|
| AndroBench 3-5 | -32% | -52% | -25% | 9% | -27% | -34% | 80% | |
| Sequential Read 256KB (MB/s) | 288.6 | 248.2 -14% | 131 -55% | 154.3 -47% | 249.7 -13% | 209.3 -27% | 143.4 -50% | 788 173% |
| Sequential Write 256KB (MB/s) | 87.6 | 49.37 -44% | 78.2 -11% | 109.4 25% | 117.2 34% | 136.5 56% | 80.6 -8% | 194.2 122% |
| Random Read 4KB (MB/s) | 45.82 | 25.56 -44% | 14.59 -68% | 19.96 -56% | 32.04 -30% | 24.85 -46% | 23.5 -49% | 127.2 178% |
| Random Write 4KB (MB/s) | 13.13 | 9.82 -25% | 9.86 -25% | 10.08 -23% | 31.35 139% | 6.8 -48% | 11.7 -11% | 15.27 16% |
| Sequential Read 256KB SDCard (MB/s) | 76.4 | 17.57 -77% | 61.7 -19% | 45.15 -41% | 48.9 -36% | 71.1 -7% | ||
| Sequential Write 256KB SDCard (MB/s) | 58.6 | 13.98 -76% | 23.52 -60% | 26.9 -54% | 30.6 -48% | 57.2 -2% |
| Dead Trigger 2 | |||
| Settings | Value | ||
| high | 30 fps | ||
| Asphalt 8: Airborne | |||
| Settings | Value | ||
| high | 30 fps | ||
| very low | 30 fps | ||
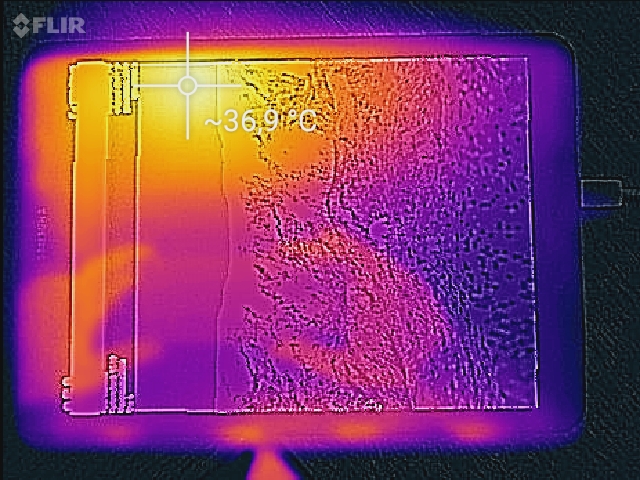
(+) The maximum temperature on the upper side is 34.4 °C / 94 F, compared to the average of 33.7 °C / 93 F, ranging from 20.7 to 53.2 °C for the class Tablet.
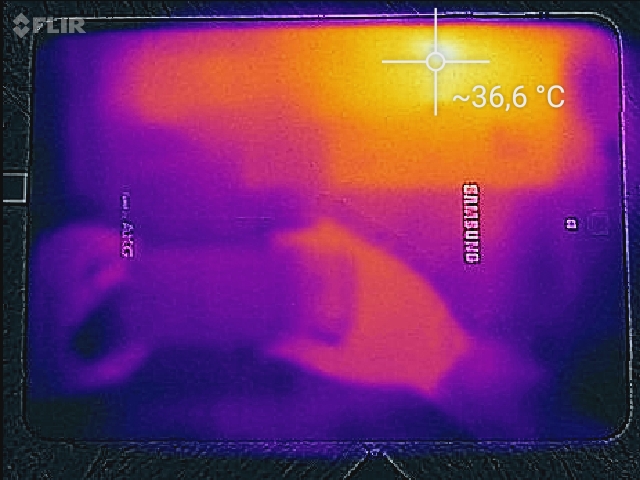
(+) The bottom heats up to a maximum of 31.1 °C / 88 F, compared to the average of 33.2 °C / 92 F
(+) In idle usage, the average temperature for the upper side is 27.8 °C / 82 F, compared to the device average of 30 °C / 86 F.
Samsung Galaxy Tab S3 SM-T825 audio analysis
(+) | speakers can play relatively loud (86.5 dB)
Bass 100 - 315 Hz
(-) | nearly no bass - on average 26.5% lower than median
(±) | linearity of bass is average (14.5% delta to prev. frequency)
Mids 400 - 2000 Hz
(±) | higher mids - on average 5.1% higher than median
(+) | mids are linear (5.2% delta to prev. frequency)
Highs 2 - 16 kHz
(+) | balanced highs - only 1.9% away from median
(+) | highs are linear (5.6% delta to prev. frequency)
Overall 100 - 16.000 Hz
(±) | linearity of overall sound is average (17.9% difference to median)
Compared to same class
» 45% of all tested devices in this class were better, 6% similar, 48% worse
» The best had a delta of 7%, average was 20%, worst was 129%
Compared to all devices tested
» 37% of all tested devices were better, 8% similar, 55% worse
» The best had a delta of 4%, average was 23%, worst was 134%
Apple iPad Pro 9.7 audio analysis
(+) | speakers can play relatively loud (90.6 dB)
Bass 100 - 315 Hz
(-) | nearly no bass - on average 23.2% lower than median
(±) | linearity of bass is average (8.6% delta to prev. frequency)
Mids 400 - 2000 Hz
(+) | balanced mids - only 4.7% away from median
(+) | mids are linear (4.9% delta to prev. frequency)
Highs 2 - 16 kHz
(+) | balanced highs - only 4.6% away from median
(+) | highs are linear (4.1% delta to prev. frequency)
Overall 100 - 16.000 Hz
(±) | linearity of overall sound is average (16.8% difference to median)
Compared to same class
» 41% of all tested devices in this class were better, 4% similar, 55% worse
» The best had a delta of 7%, average was 20%, worst was 129%
Compared to all devices tested
» 30% of all tested devices were better, 8% similar, 63% worse
» The best had a delta of 4%, average was 23%, worst was 134%
Google Pixel C audio analysis
(+) | speakers can play relatively loud (92.8 dB)
Bass 100 - 315 Hz
(-) | nearly no bass - on average 29.9% lower than median
(±) | linearity of bass is average (7.5% delta to prev. frequency)
Mids 400 - 2000 Hz
(+) | balanced mids - only 4.8% away from median
(±) | linearity of mids is average (7% delta to prev. frequency)
Highs 2 - 16 kHz
(±) | higher highs - on average 7.5% higher than median
(±) | linearity of highs is average (8.6% delta to prev. frequency)
Overall 100 - 16.000 Hz
(±) | linearity of overall sound is average (24.2% difference to median)
Compared to same class
» 76% of all tested devices in this class were better, 6% similar, 18% worse
» The best had a delta of 7%, average was 20%, worst was 129%
Compared to all devices tested
» 73% of all tested devices were better, 6% similar, 21% worse
» The best had a delta of 4%, average was 23%, worst was 134%
| Off / Standby | |
| Idle | |
| Load |
|
Key:
min: | |
| Samsung Galaxy Tab S3 SM-T825 6000 mAh | Samsung Galaxy Tab S2 9.7 LTE 5870 mAh | Apple iPad Pro 9.7 7306 mAh | Huawei MediaPad T2 10.0 Pro 6600 mAh | Google Pixel C mAh | Asus ZenPad 3s 10 Z500M 5900 mAh | Apple iPad (2017) 8.827 mAh | |
|---|---|---|---|---|---|---|---|
| Power Consumption | -31% | -59% | -5% | -32% | -25% | -64% | |
| Idle Minimum * (Watt) | 2.08 | 2.3 -11% | 1.71 18% | 1.58 24% | 1.82 12% | 1.59 24% | 2.06 1% |
| Idle Average * (Watt) | 3.5 | 4.5 -29% | 7.55 -116% | 4.12 -18% | 4.26 -22% | 4.14 -18% | 7.42 -112% |
| Idle Maximum * (Watt) | 3.58 | 5 -40% | 7.62 -113% | 4.15 -16% | 4.33 -21% | 4.23 -18% | 7.47 -109% |
| Load Average * (Watt) | 6.97 | 9.4 -35% | 8.39 -20% | 6.2 11% | 9.82 -41% | 10.89 -56% | 9.45 -36% |
| Load Maximum * (Watt) | 7.4 | 10.4 -41% | 12.08 -63% | 9.27 -25% | 13.99 -89% | 11.58 -56% | 12.31 -66% |
* ... smaller is better
| Samsung Galaxy Tab S3 SM-T825 6000 mAh | Samsung Galaxy Tab S2 9.7 LTE 5870 mAh | Huawei MediaPad T2 10.0 Pro 6600 mAh | Asus ZenPad 3s 10 Z500M 5900 mAh | Apple iPad (2017) 8.827 mAh | Apple iPad Pro 9.7 7306 mAh | |
|---|---|---|---|---|---|---|
| Battery runtime | -26% | -27% | -22% | -2% | -6% | |
| Reader / Idle (h) | 31.7 | 15.3 -52% | 20.5 -35% | 24.2 -24% | 24.9 -21% | 30.8 -3% |
| H.264 (h) | 9.2 | 10.9 18% | 9.9 8% | 10 9% | 14.1 53% | 11.8 28% |
| WiFi v1.3 (h) | 12.7 | 6.6 -48% | 6.9 -46% | 8.6 -32% | 12.7 0% | 13 2% |
| Load (h) | 6.3 | 4.9 -22% | 4.1 -35% | 3.8 -40% | 3.8 -40% | 3.1 -51% |
Pros
Cons
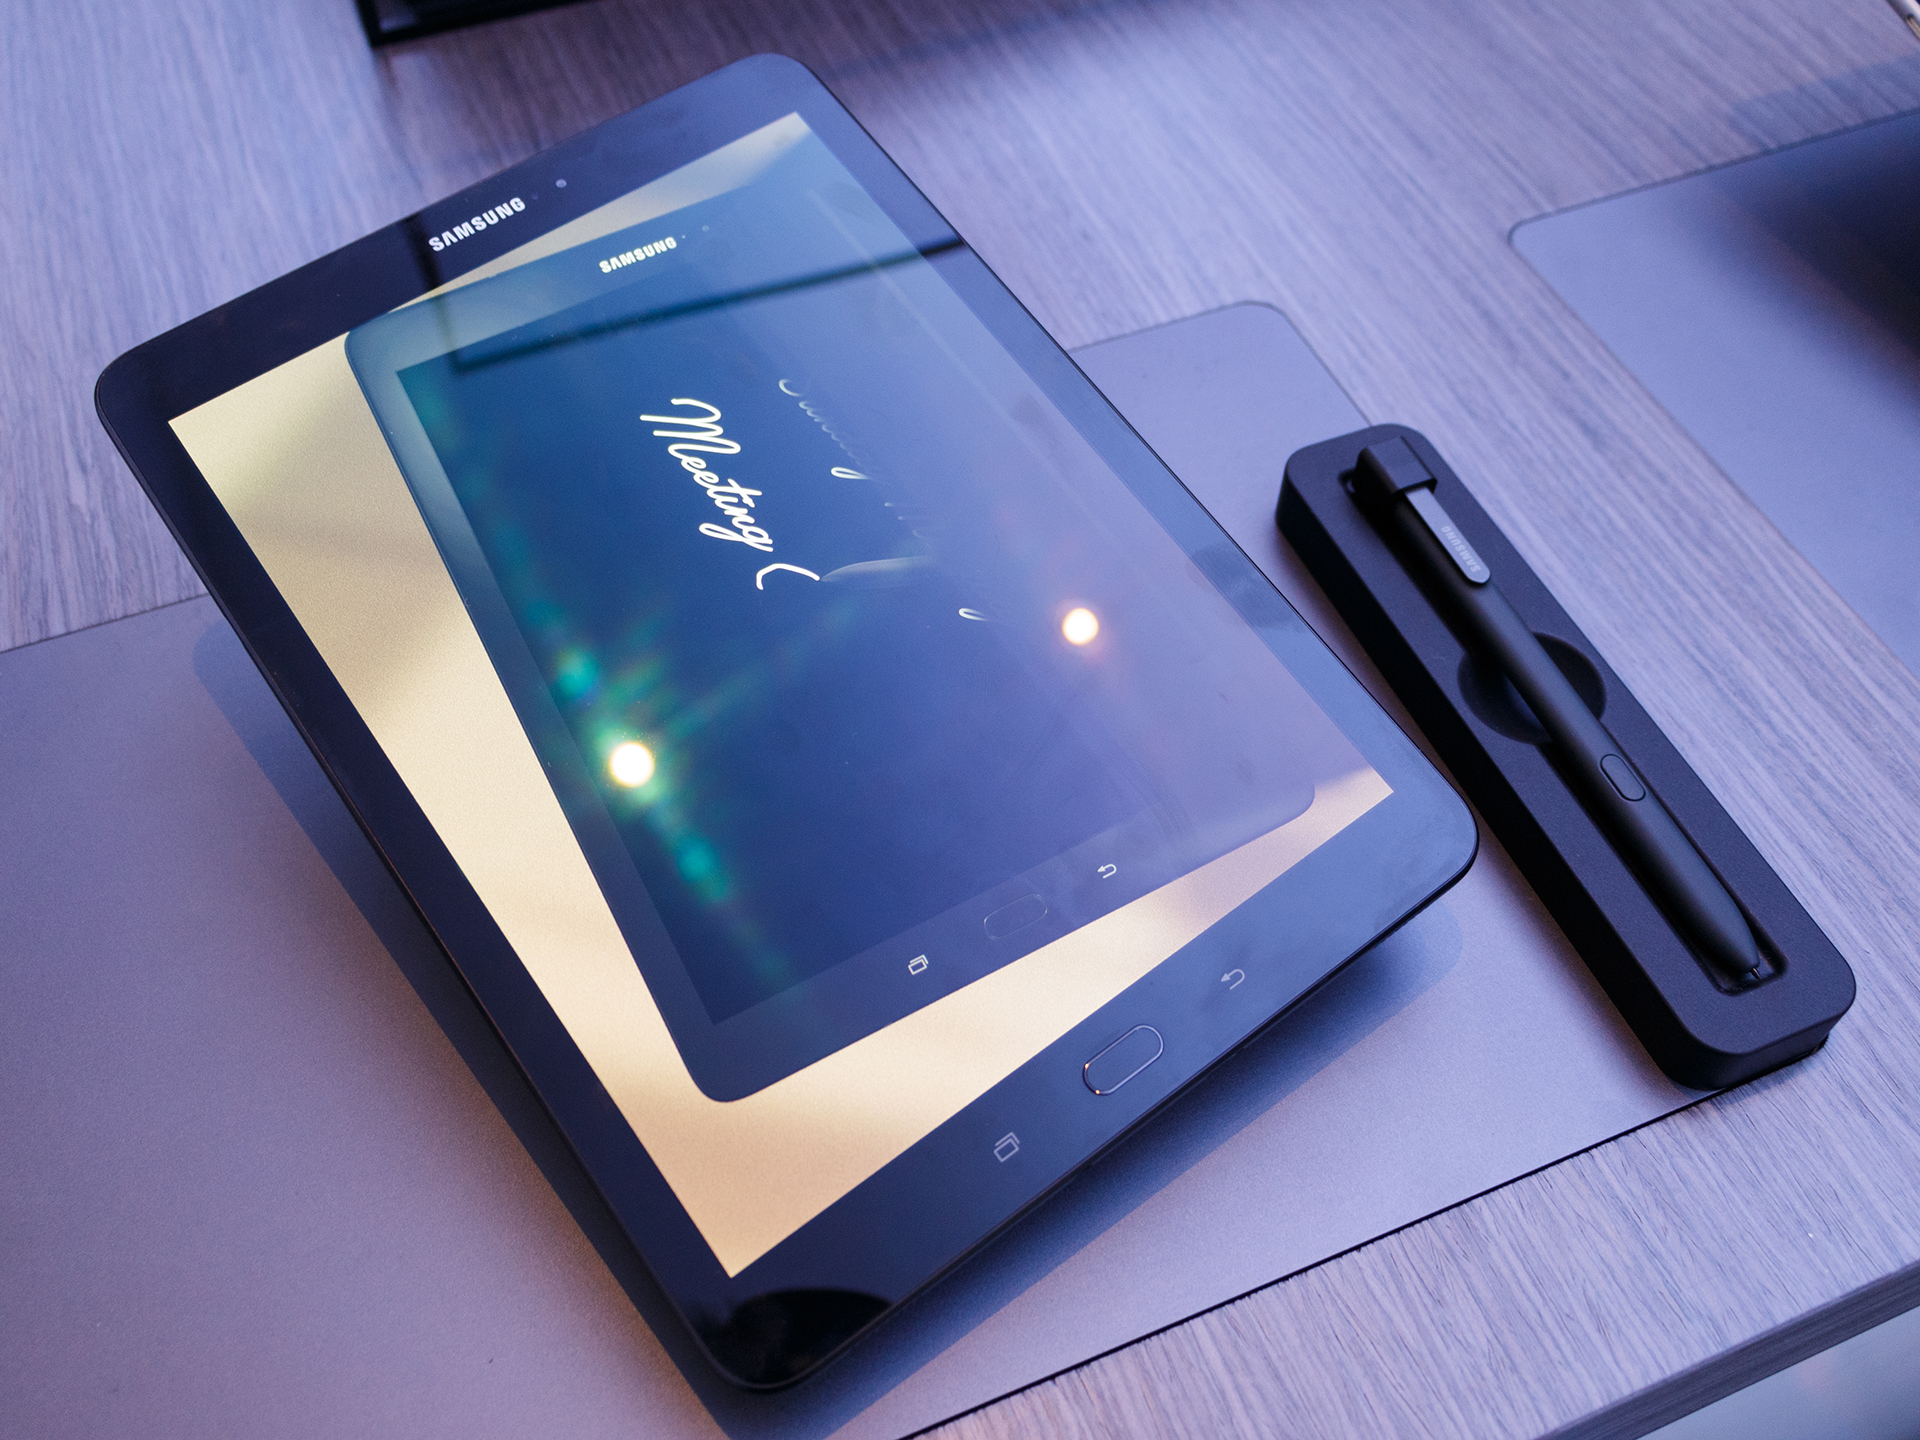
三星Galaxy Tab S3 LTE是一款非常出色的平板电脑,不依赖高端硬件(就像Apple iPad 2017那样),但整体包装非常引人注目。
三星Galaxy Tab S3可能不会那么出类拔萃,但它是目前最好的Android平板电脑。
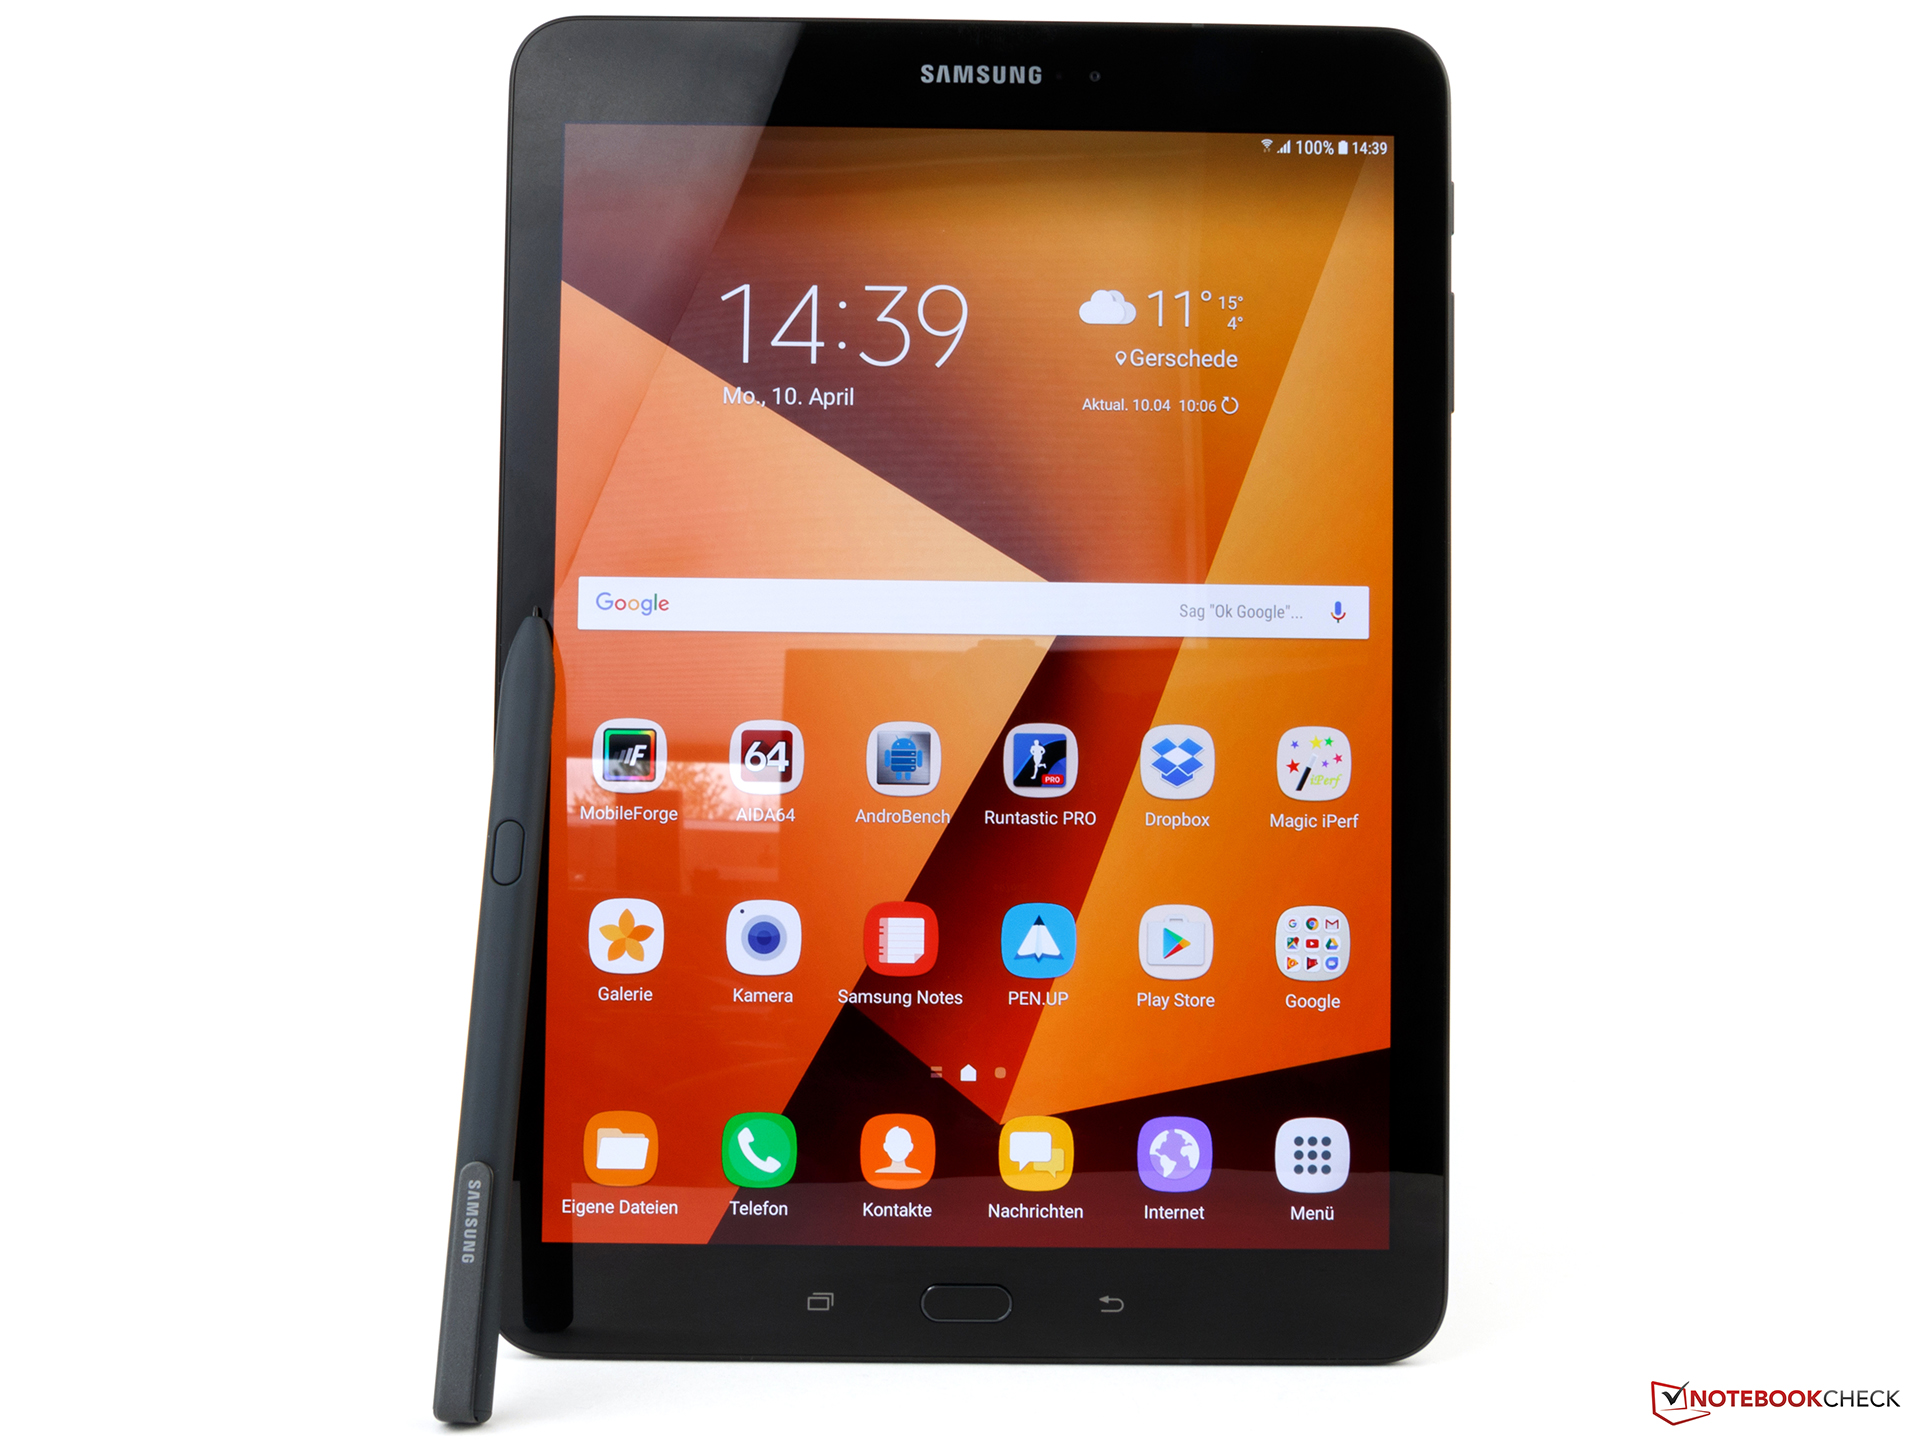
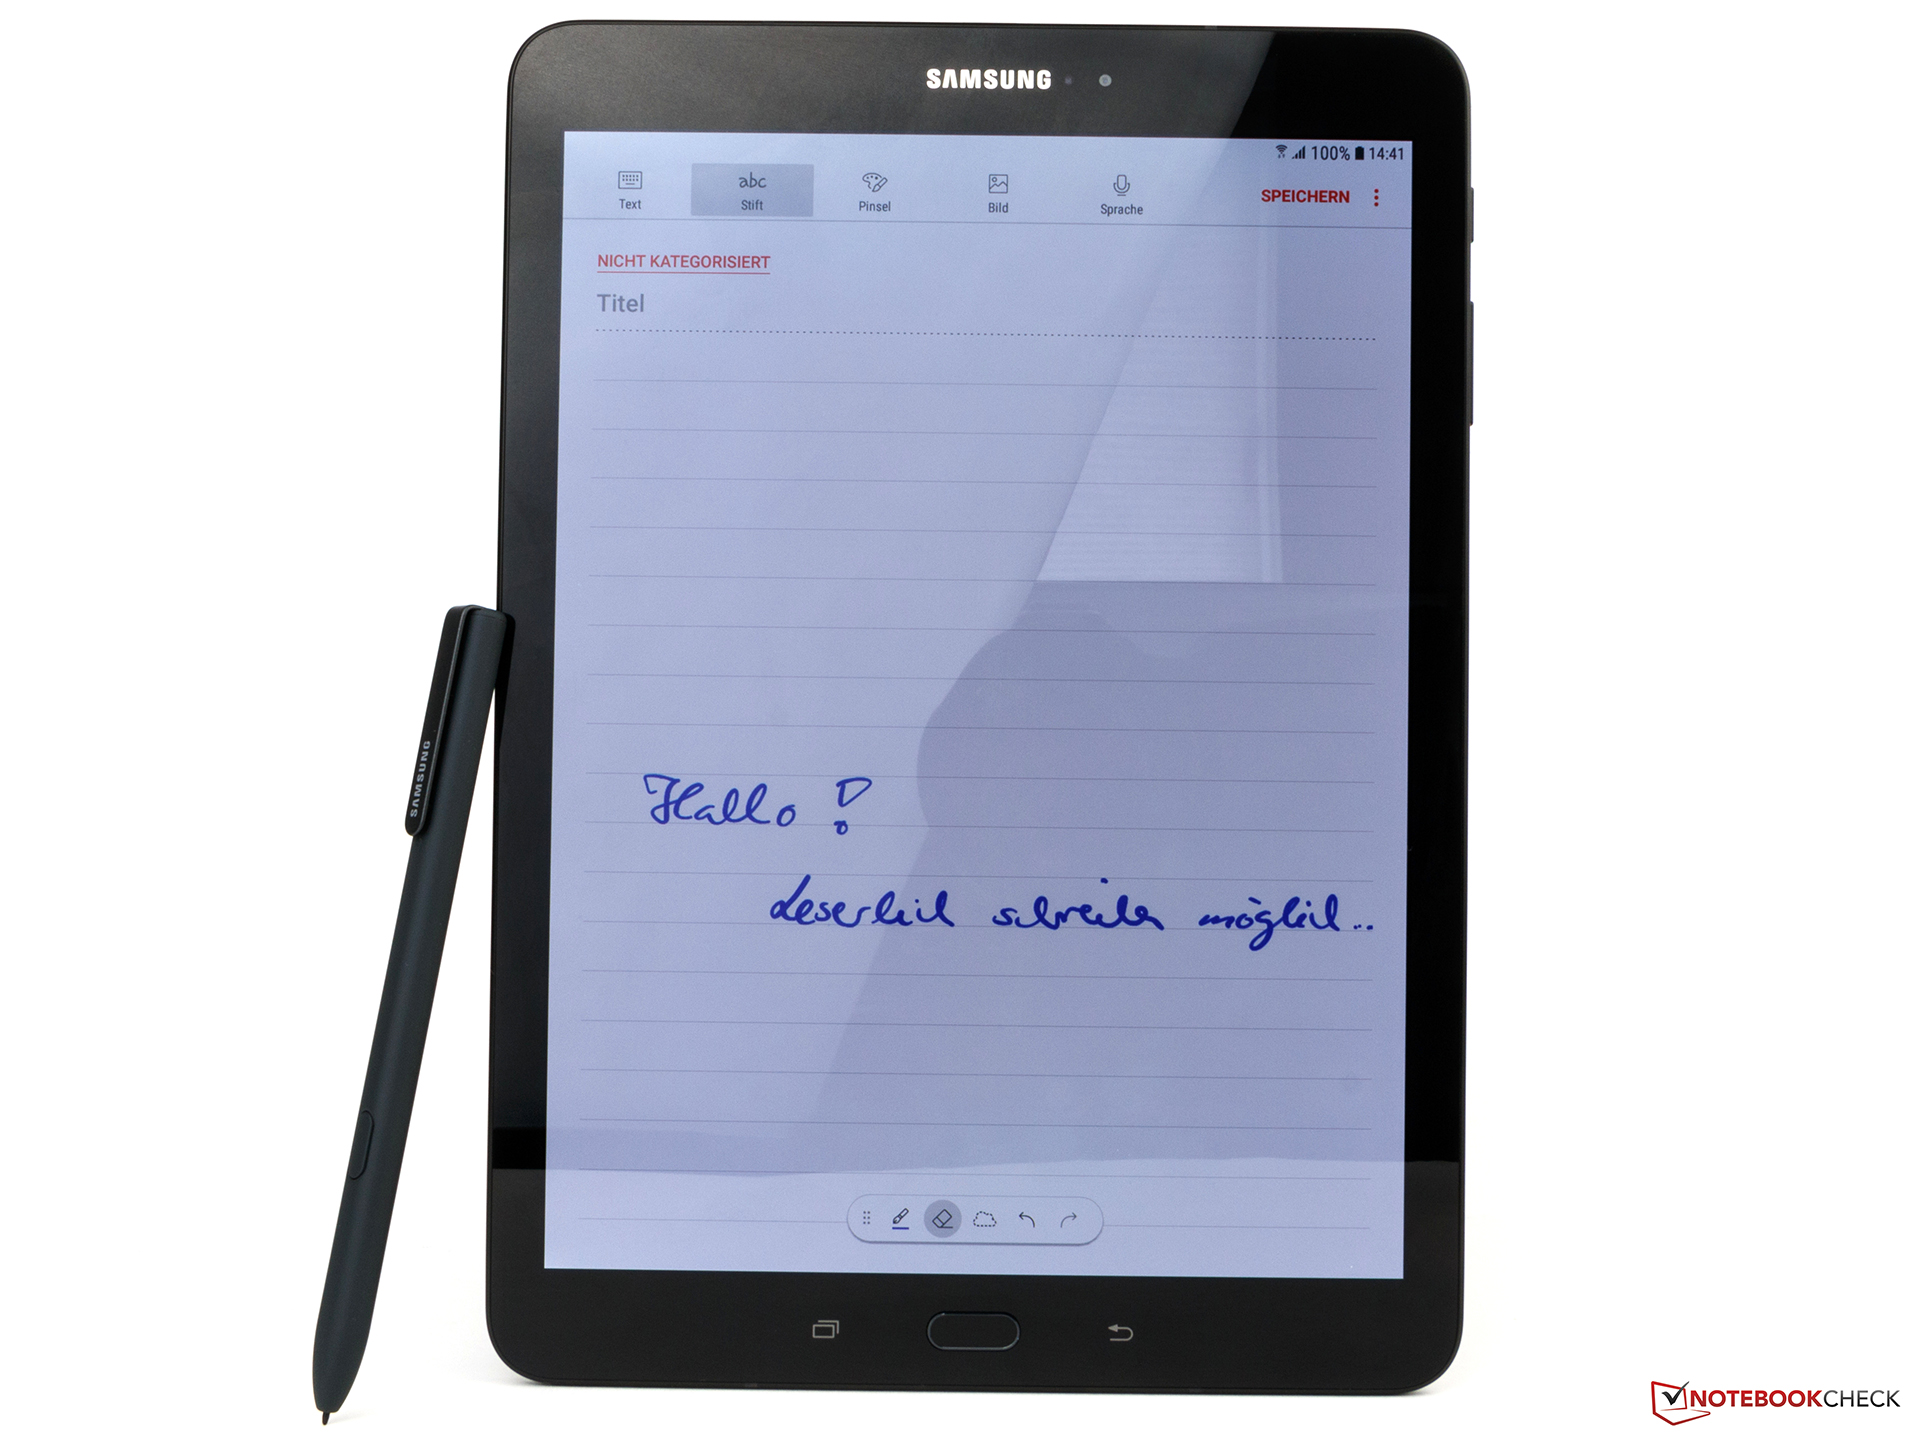
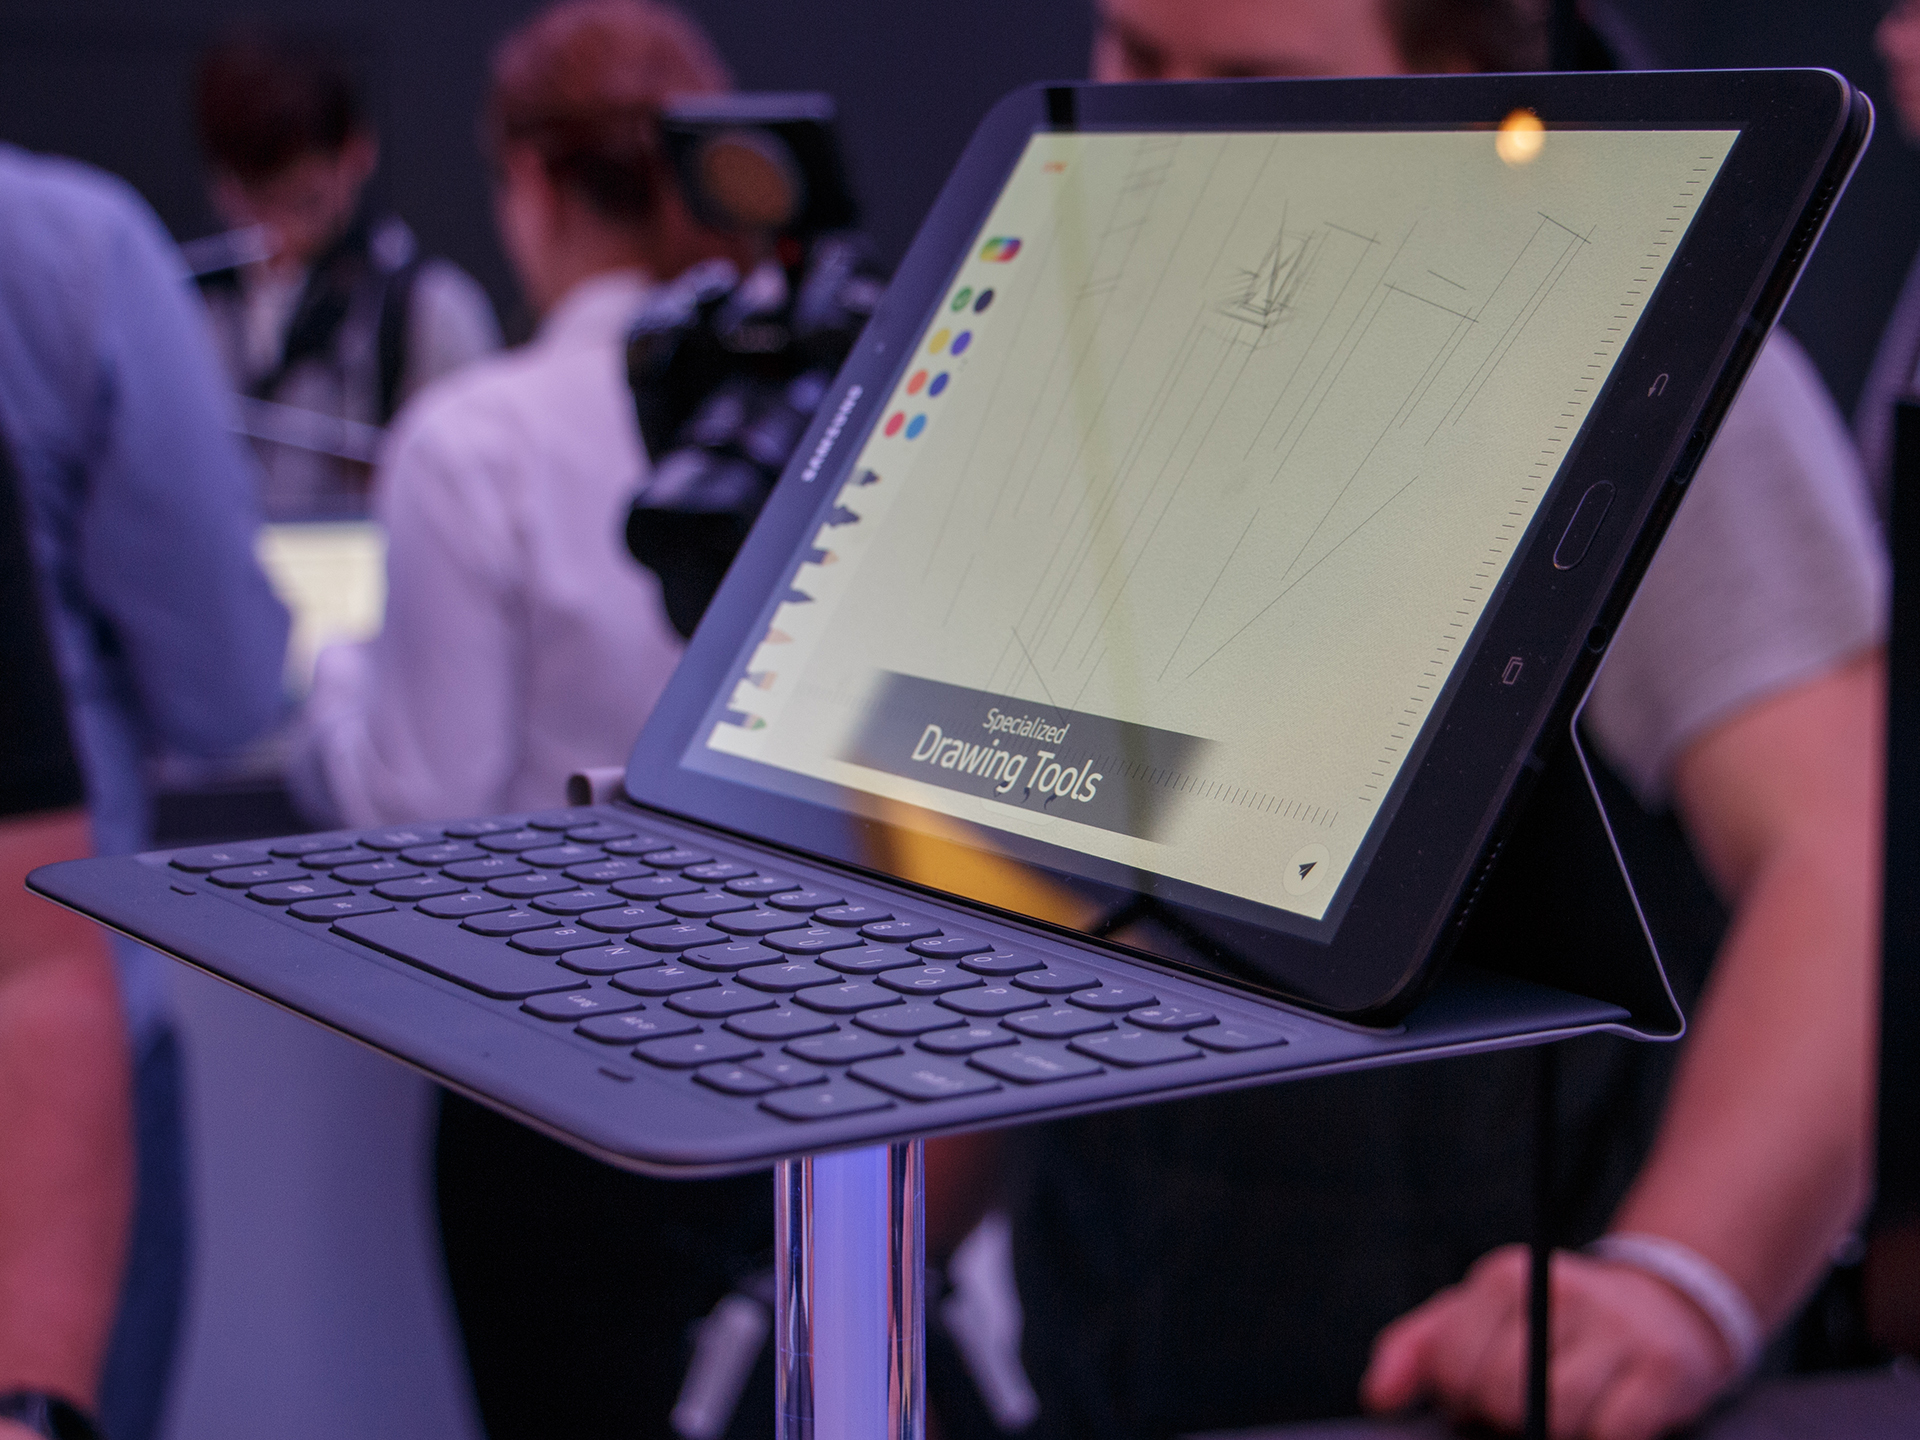
除了支持HDR的显示器,良好的扬声器,增强后的电池续航时间和支持S触控笔之外,Wi-Fi模块还特别快。集成的骁龙820虽然说比不上最新的高通SoC,但它的性能还是很棒。只不过小而慢的eMMC存储不太适合高级多媒体平板电脑。三星同样没有配备非常好的摄像头,所以没有真正的物超所值的感觉。
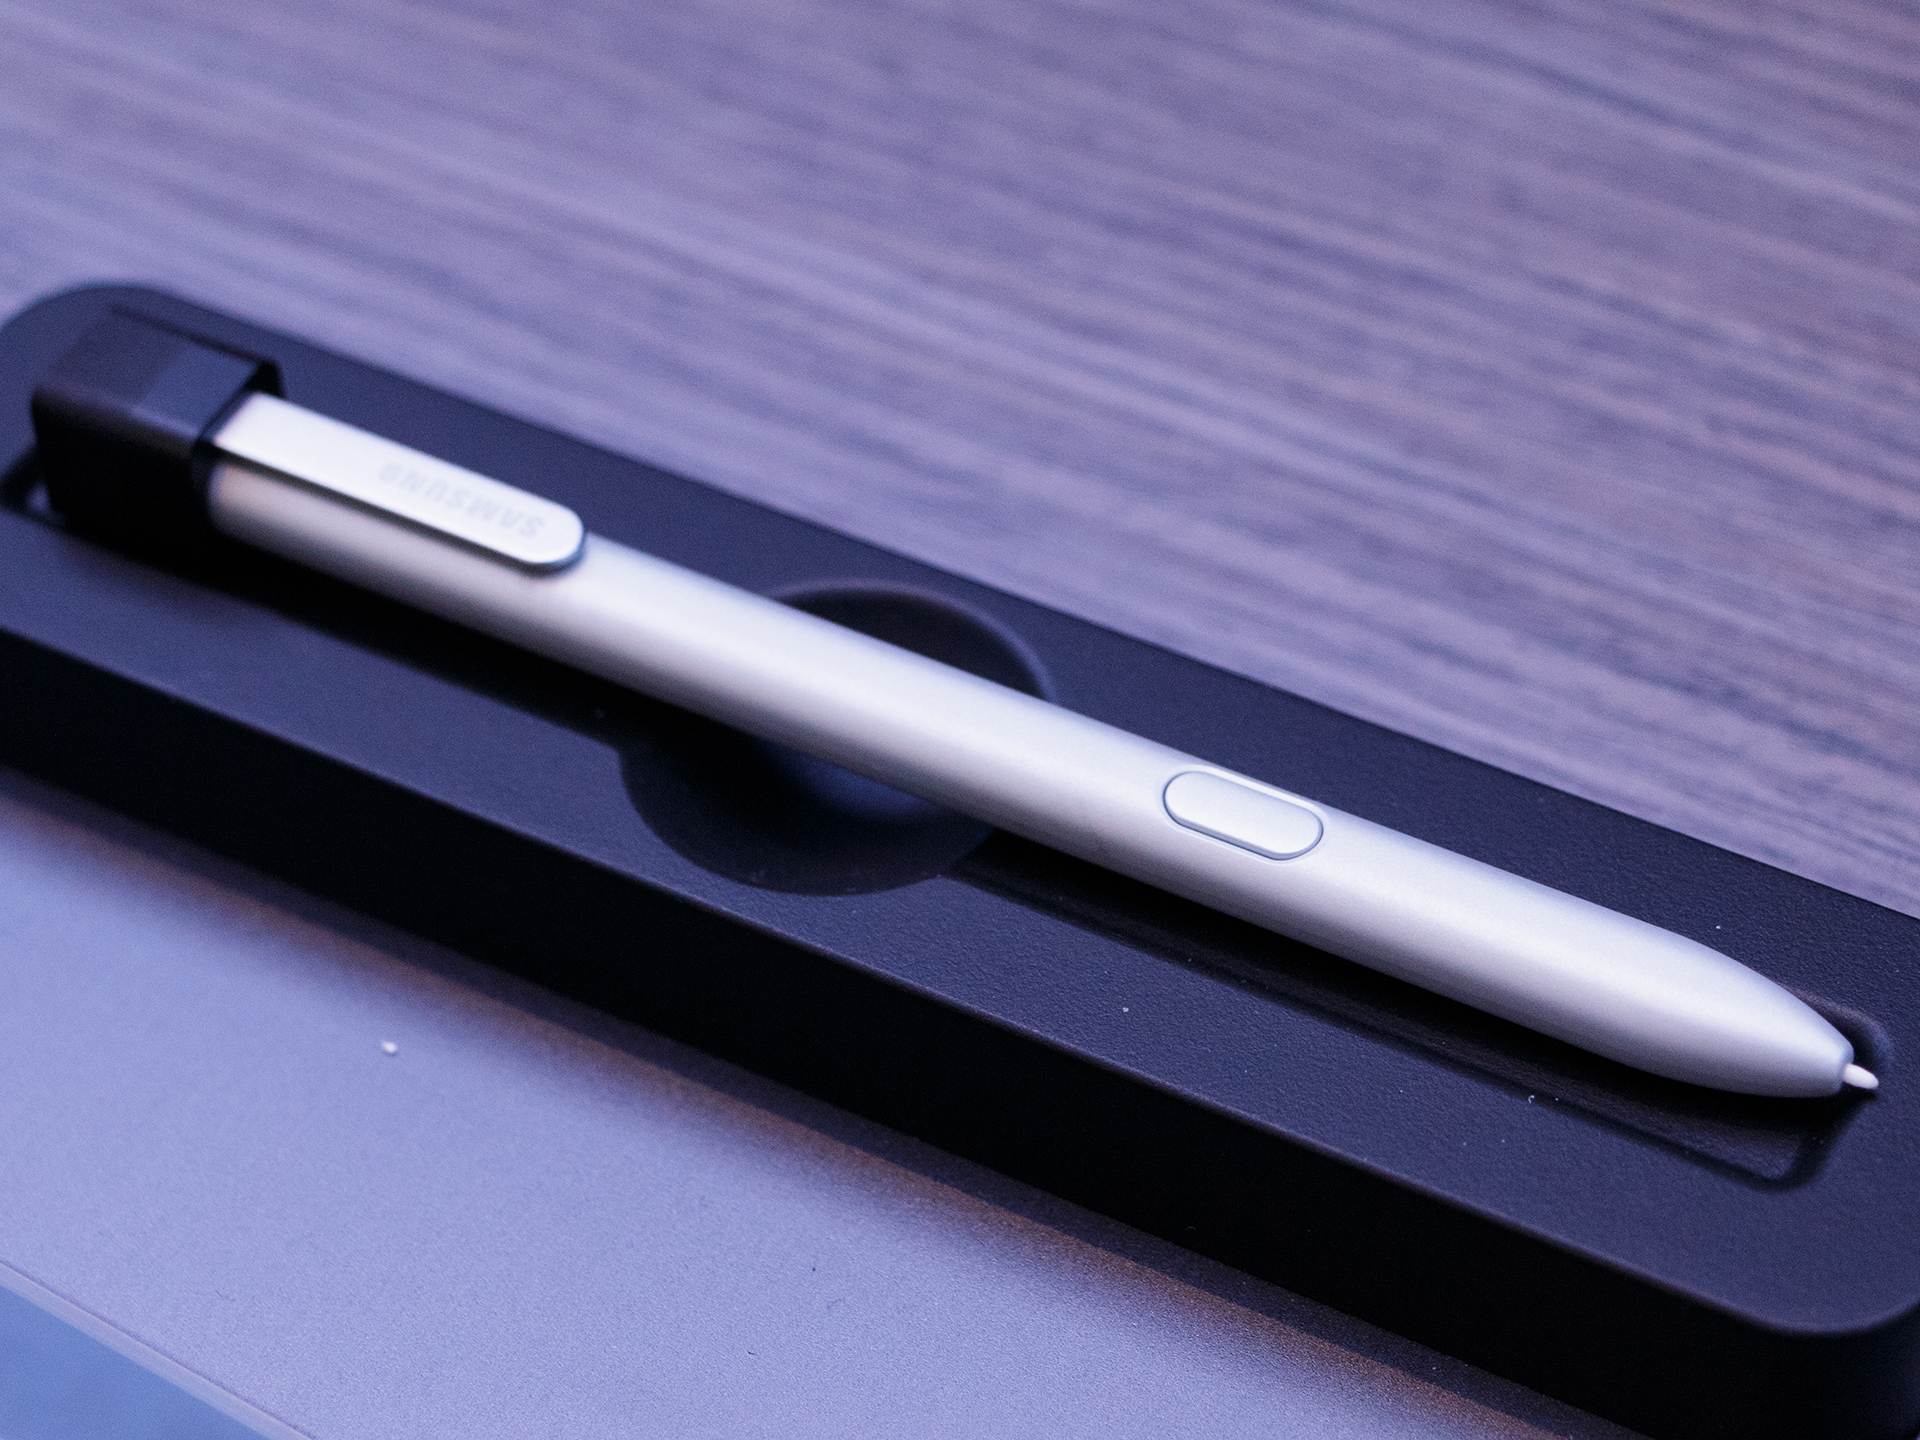
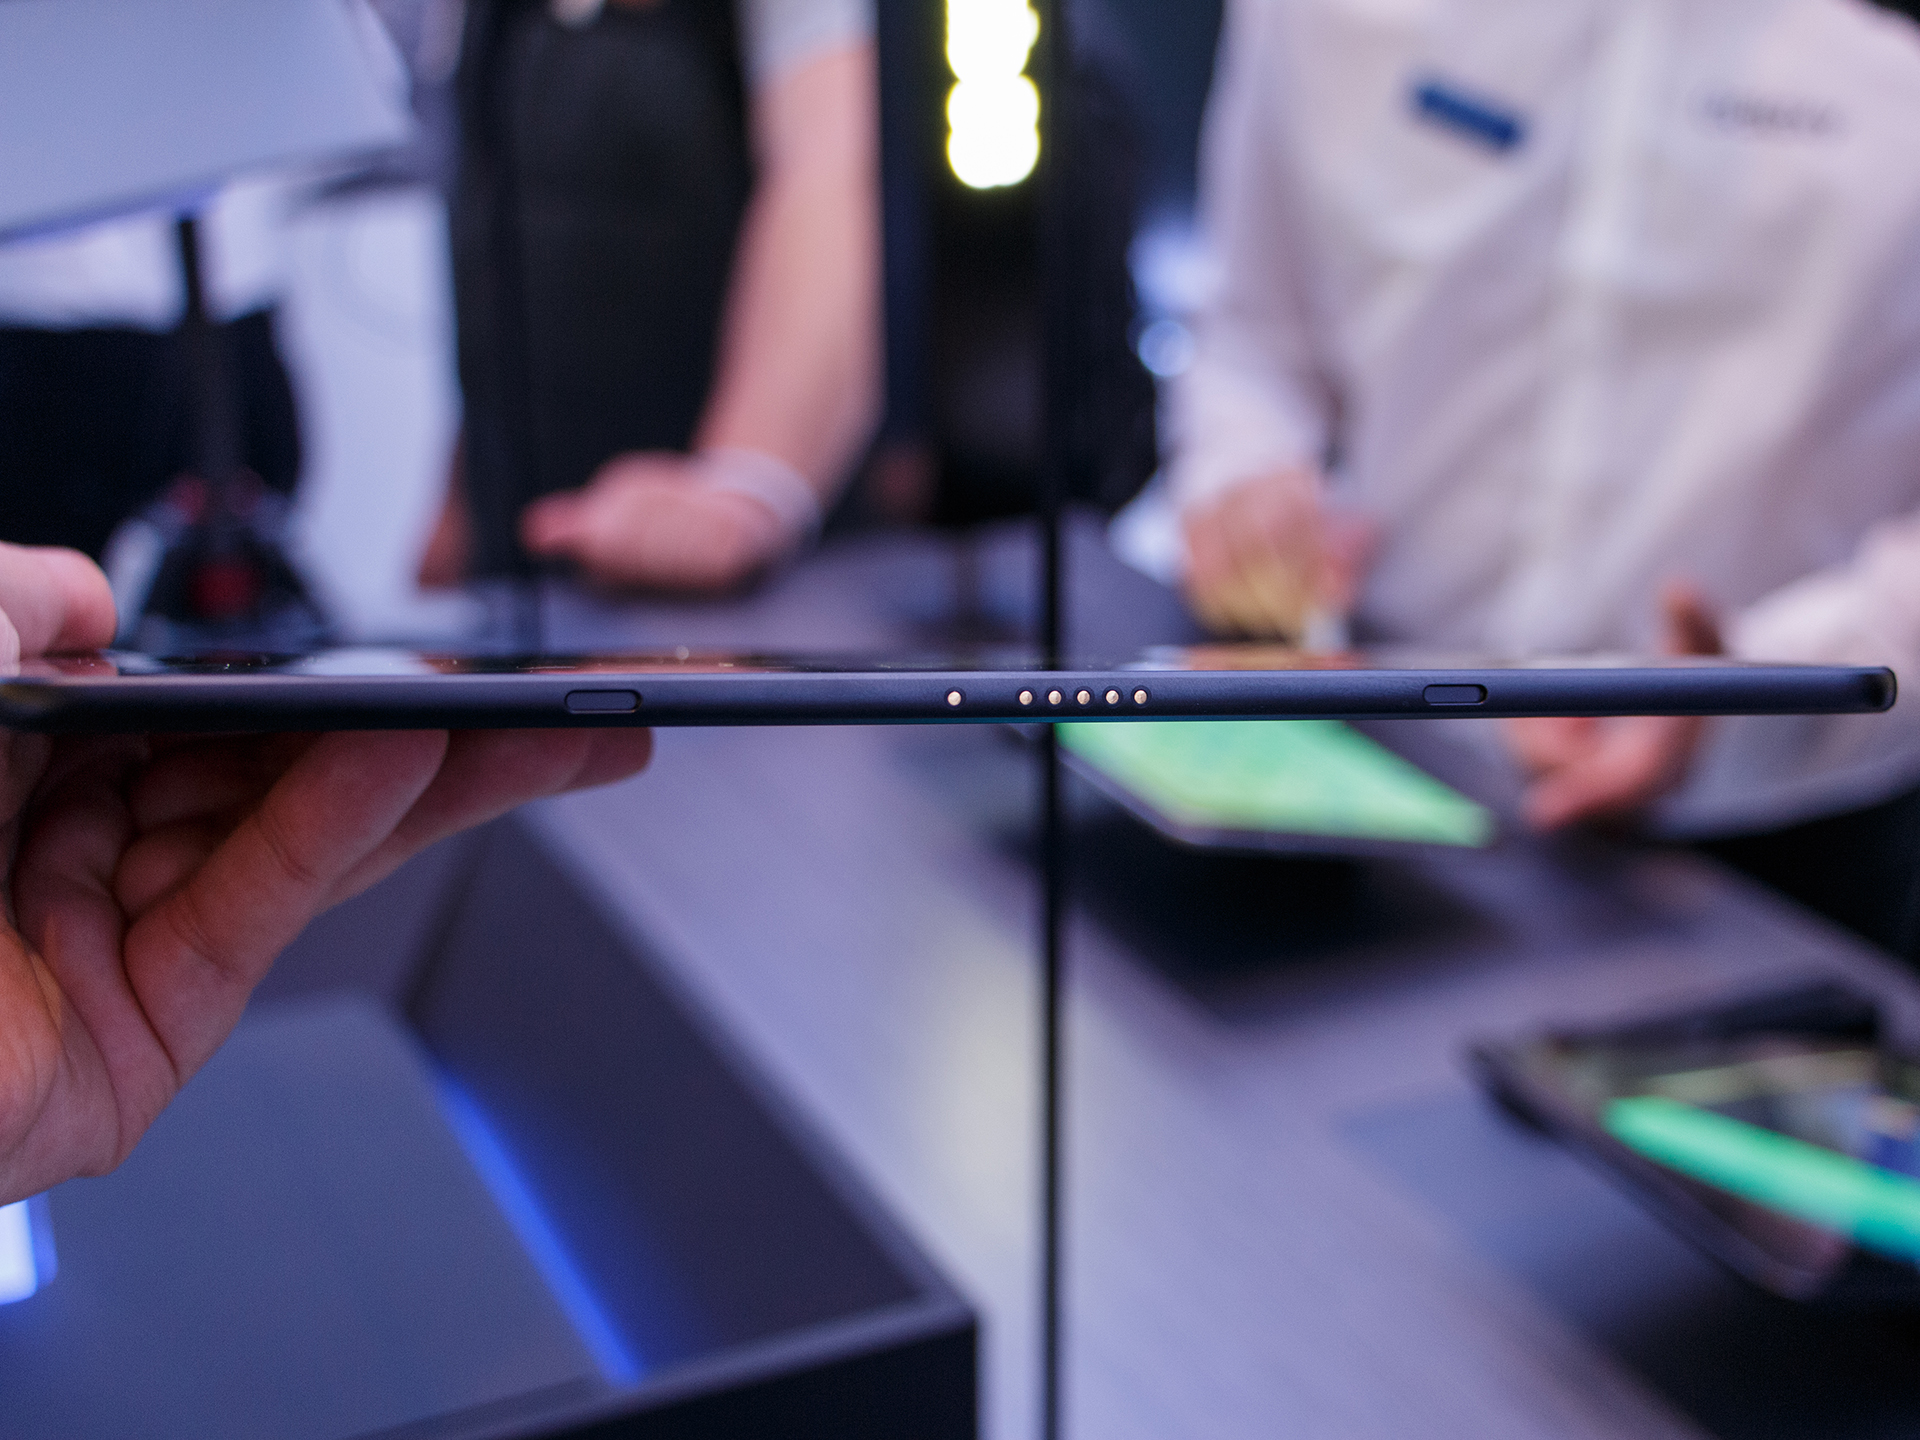
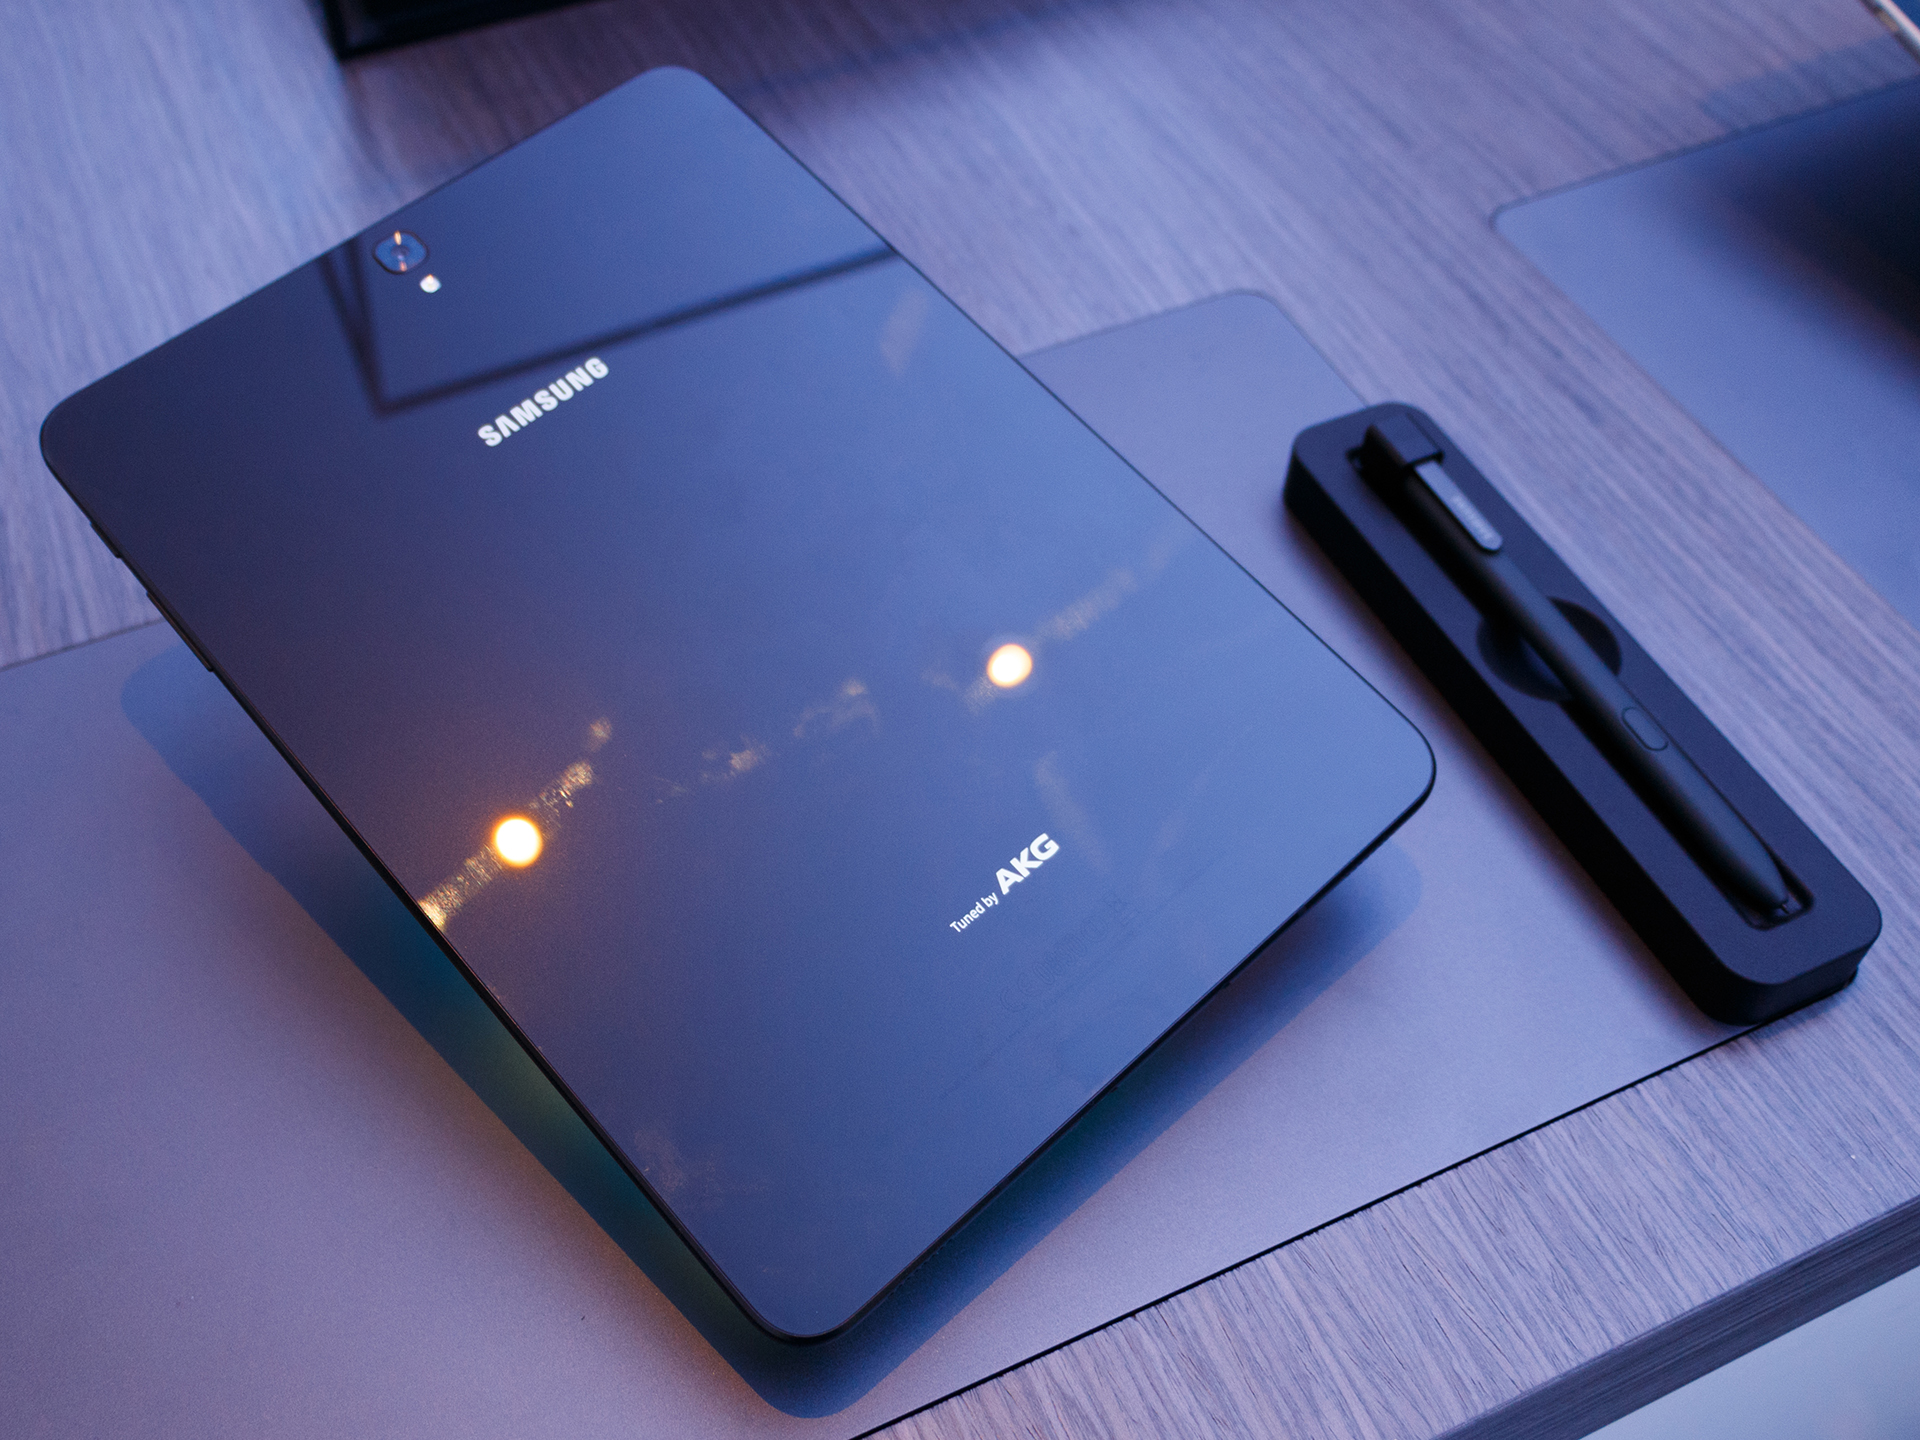
我们真的很喜欢S触控笔。它将随Tab S3一起发货。这给我们留下了很好的印象。770欧元(〜839美元)对于平板电脑来说,依旧昂贵。如果您已经有了Galaxy Tab S2 9.7 而且不需要触控笔,那就没有必要换新机。
注:本文是基于完整评测的缩减版本,阅读完整的英文评测,请点击这里。
Samsung Galaxy Tab S3 SM-T825
- 04/26/2017 v6 (old)
Daniel Schmidt
Price comparison
