苹果 iPad (2017) 平板电脑简短评测
| Networking | |
| iperf3 transmit AX12 | |
| Apple iPhone 7 (Klaus I211) | |
| Apple iPad (2017) | |
| Samsung Galaxy S7 | |
| iperf3 receive AX12 | |
| Apple iPhone 7 (Klaus I211) | |
| Apple iPad (2017) | |
| Samsung Galaxy S7 | |

| |||||||||||||||||||||||||
Brightness Distribution: 88 %
Center on Battery: 514 cd/m²
Contrast: 1117:1 (Black: 0.46 cd/m²)
ΔE ColorChecker Calman: 1.4 | ∀{0.5-29.43 Ø4.71}
ΔE Greyscale Calman: 2.1 | ∀{0.09-98 Ø4.96}
97.4% sRGB (Calman 2D)
Gamma: 2.22
CCT: 6647 K
| Apple iPad (2017) IPS, 2048x1536, 9.7" | Apple iPad Air 1 2013 IPS, 2048x1536, 9.7" | Apple iPad Pro 9.7 IPS, 2048x1536, 9.7" | Apple iPad Pro 12.9 IPS, 2732x2048, 12.9" | Google Pixel C LTPS, 2560x1800, 10.2" | Huawei MediaPad T2 10.0 Pro IPS, 1920x1200, 10.1" | |
|---|---|---|---|---|---|---|
| Screen | -10% | 10% | -11% | -75% | -79% | |
| Brightness middle (cd/m²) | 514 | 473 -8% | 523 2% | 399 -22% | 487 -5% | 392 -24% |
| Brightness (cd/m²) | 485 | 442 -9% | 500 3% | 393 -19% | 510 5% | 385 -21% |
| Brightness Distribution (%) | 88 | 90 2% | 93 6% | 92 5% | 91 3% | 91 3% |
| Black Level * (cd/m²) | 0.46 | 0.41 11% | 0.52 -13% | 0.22 52% | 0.39 15% | 0.59 -28% |
| Contrast (:1) | 1117 | 1154 3% | 1006 -10% | 1814 62% | 1249 12% | 664 -41% |
| Colorchecker dE 2000 * | 1.4 | 2.82 -101% | 1.1 21% | 2.96 -111% | 5.24 -274% | 4.5 -221% |
| Colorchecker dE 2000 max. * | 2.9 | 1.9 34% | 7.8 -169% | |||
| Greyscale dE 2000 * | 2.1 | 1.45 31% | 1.4 33% | 3 -43% | 7.95 -279% | 4.8 -129% |
| Gamma | 2.22 99% | 2.47 89% | 2.11 104% | 2.21 100% | 2.16 102% | 2.47 89% |
| CCT | 6647 98% | 6768 96% | 6662 98% | 7049 92% | 6565 99% | 7426 88% |
| Color Space (Percent of AdobeRGB 1998) (%) | 62.97 | 71.15 | ||||
| Color Space (Percent of sRGB) (%) | 99.55 | 97.87 |
* ... smaller is better
Screen Flickering / PWM (Pulse-Width Modulation)
| Screen flickering / PWM not detected |  | ||
In comparison: 52 % of all tested devices do not use PWM to dim the display. If PWM was detected, an average of 7754 (minimum: 5 - maximum: 343500) Hz was measured. | |||
Display Response Times
| ↔ Response Time Black to White | ||
|---|---|---|
| 26 ms ... rise ↗ and fall ↘ combined | ↗ 15 ms rise | 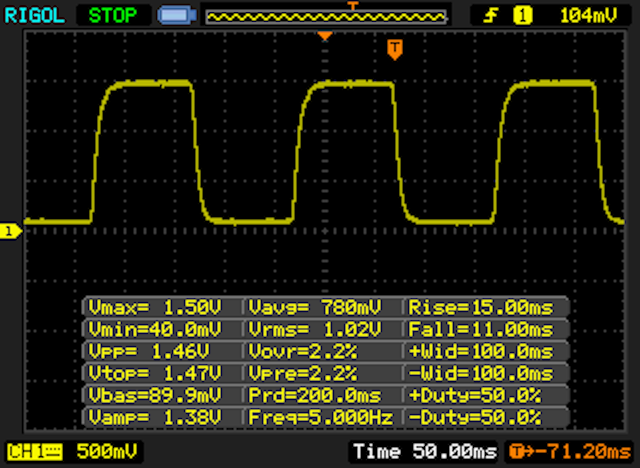 |
| ↘ 11 ms fall | ||
| The screen shows relatively slow response rates in our tests and may be too slow for gamers. In comparison, all tested devices range from 0.1 (minimum) to 240 (maximum) ms. » 63 % of all devices are better. This means that the measured response time is worse than the average of all tested devices (19.8 ms). | ||
| ↔ Response Time 50% Grey to 80% Grey | ||
| 40 ms ... rise ↗ and fall ↘ combined | ↗ 23 ms rise | 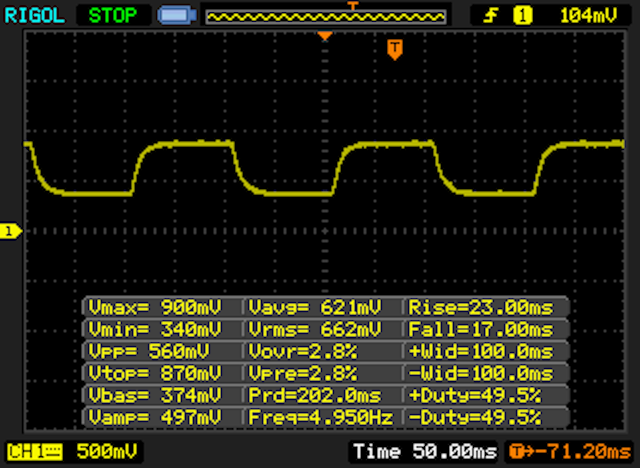 |
| ↘ 17 ms fall | ||
| The screen shows slow response rates in our tests and will be unsatisfactory for gamers. In comparison, all tested devices range from 0.165 (minimum) to 636 (maximum) ms. » 61 % of all devices are better. This means that the measured response time is worse than the average of all tested devices (31 ms). | ||
| AnTuTu v6 - Total Score | |
| Apple iPad Pro 12.9 | |
| Apple iPad Pro 9.7 | |
| Samsung Galaxy Tab S3 SM-T825 | |
| Apple iPhone 7 | |
| Apple iPad (2017) | |
| Google Pixel C | |
| Huawei MediaPad T2 10.0 Pro | |
| GFXBench 3.0 | |
| on screen Manhattan Onscreen OGL | |
| Apple iPhone 7 | |
| Apple iPad Pro 9.7 | |
| Samsung Galaxy Tab S3 SM-T825 | |
| Apple iPad Pro 12.9 | |
| Apple iPad (2017) | |
| Google Pixel C | |
| Huawei MediaPad T2 10.0 Pro | |
| 1920x1080 1080p Manhattan Offscreen | |
| Apple iPad Pro 12.9 | |
| Apple iPhone 7 | |
| Apple iPad Pro 9.7 | |
| Samsung Galaxy Tab S3 SM-T825 | |
| Apple iPad (2017) | |
| Google Pixel C | |
| Huawei MediaPad T2 10.0 Pro | |
| GFXBench 3.1 | |
| on screen Manhattan ES 3.1 Onscreen | |
| Apple iPhone 7 | |
| Apple iPad Pro 12.9 | |
| Apple iPad Pro 9.7 | |
| Samsung Galaxy Tab S3 SM-T825 | |
| Apple iPad (2017) | |
| Google Pixel C | |
| 1920x1080 Manhattan ES 3.1 Offscreen | |
| Apple iPad Pro 12.9 | |
| Apple iPhone 7 | |
| Apple iPad Pro 9.7 | |
| Samsung Galaxy Tab S3 SM-T825 | |
| Google Pixel C | |
| Apple iPad (2017) | |
| Basemark ES 3.1 / Metal - offscreen Overall Score | |
| Apple iPad Pro 12.9 | |
| Apple iPhone 7 | |
| Apple iPhone 7 | |
| Apple iPad Pro 9.7 | |
| Apple iPad (2017) | |
| Google Pixel C | |
| Samsung Galaxy Tab S3 SM-T825 | |
| Octane V2 - Total Score | |
| Apple iPhone 7 | |
| Apple iPad Pro 12.9 | |
| Apple iPad Pro 9.7 | |
| Apple iPad (2017) | |
| Samsung Galaxy Tab S3 SM-T825 | |
| Google Pixel C | |
| Apple iPad Air 1 2013 | |
| Huawei MediaPad T2 10.0 Pro | |
| Mozilla Kraken 1.1 - Total | |
| Huawei MediaPad T2 10.0 Pro | |
| Apple iPad Air 1 2013 | |
| Google Pixel C | |
| Samsung Galaxy Tab S3 SM-T825 | |
| Apple iPad Pro 9.7 | |
| Apple iPad Pro 12.9 | |
| Apple iPad (2017) | |
| Apple iPhone 7 | |
| JetStream 1.1 - 1.1 Total | |
| Apple iPhone 7 | |
| Apple iPad Pro 9.7 | |
| Apple iPad Pro 12.9 | |
| Apple iPad (2017) | |
| Google Pixel C | |
| Samsung Galaxy Tab S3 SM-T825 | |
| Huawei MediaPad T2 10.0 Pro | |
| WebXPRT 2015 - Overall | |
| Apple iPad Pro 9.7 | |
| Apple iPad Pro 12.9 | |
| Apple iPad (2017) | |
| Apple iPhone 7 | |
| Samsung Galaxy Tab S3 SM-T825 | |
| Google Pixel C | |
| Huawei MediaPad T2 10.0 Pro | |
* ... smaller is better
| PassMark PerformanceTest Mobile V1 - Disk Tests | |
| Apple iPad Pro 12.9 | |
| Apple iPad Pro 9.7 | |
| Apple iPad (2017) | |
| Apple iPhone 7 | |
| Apple iPad Air 1 2013 | |
| Google Pixel C | |
| BaseMark OS II - Memory | |
| Apple iPad Pro 9.7 | |
| Apple iPad Pro 12.9 | |
| Samsung Galaxy Tab S3 SM-T825 | |
| Apple iPad (2017) | |
| Apple iPhone 7 | |
| Google Pixel C | |
| Huawei MediaPad T2 10.0 Pro | |
(+) The maximum temperature on the upper side is 35.2 °C / 95 F, compared to the average of 33.7 °C / 93 F, ranging from 20.7 to 53.2 °C for the class Tablet.
(+) The bottom heats up to a maximum of 37.7 °C / 100 F, compared to the average of 33.2 °C / 92 F
(+) In idle usage, the average temperature for the upper side is 31 °C / 88 F, compared to the device average of 30 °C / 86 F.
Apple iPad (2017) audio analysis
(+) | speakers can play relatively loud (86.1 dB)
Bass 100 - 315 Hz
(-) | nearly no bass - on average 17.5% lower than median
(±) | linearity of bass is average (10.8% delta to prev. frequency)
Mids 400 - 2000 Hz
(+) | balanced mids - only 2.8% away from median
(+) | mids are linear (5.3% delta to prev. frequency)
Highs 2 - 16 kHz
(±) | higher highs - on average 8.5% higher than median
(+) | highs are linear (3.9% delta to prev. frequency)
Overall 100 - 16.000 Hz
(±) | linearity of overall sound is average (19% difference to median)
Compared to same class
» 52% of all tested devices in this class were better, 5% similar, 43% worse
» The best had a delta of 7%, average was 20%, worst was 129%
Compared to all devices tested
» 45% of all tested devices were better, 7% similar, 47% worse
» The best had a delta of 4%, average was 23%, worst was 134%
Apple iPad Pro 9.7 audio analysis
(+) | speakers can play relatively loud (90.6 dB)
Bass 100 - 315 Hz
(-) | nearly no bass - on average 23.2% lower than median
(±) | linearity of bass is average (8.6% delta to prev. frequency)
Mids 400 - 2000 Hz
(+) | balanced mids - only 4.7% away from median
(+) | mids are linear (4.9% delta to prev. frequency)
Highs 2 - 16 kHz
(+) | balanced highs - only 4.6% away from median
(+) | highs are linear (4.1% delta to prev. frequency)
Overall 100 - 16.000 Hz
(±) | linearity of overall sound is average (16.8% difference to median)
Compared to same class
» 41% of all tested devices in this class were better, 4% similar, 55% worse
» The best had a delta of 7%, average was 20%, worst was 129%
Compared to all devices tested
» 30% of all tested devices were better, 8% similar, 63% worse
» The best had a delta of 4%, average was 23%, worst was 134%
| Off / Standby | |
| Idle | |
| Load |
|
Key:
min: | |
| Apple iPad (2017) 8.827 mAh | Apple iPad Pro 9.7 7306 mAh | Apple iPad Pro 12.9 10307 mAh | Apple iPad Air 1 2013 mAh | Google Pixel C mAh | Huawei MediaPad T2 10.0 Pro 6600 mAh | |
|---|---|---|---|---|---|---|
| Power Consumption | 5% | -31% | 15% | 16% | 34% | |
| Idle Minimum * (Watt) | 2.06 | 1.71 17% | 2.69 -31% | 1.8 13% | 1.82 12% | 1.58 23% |
| Idle Average * (Watt) | 7.42 | 7.55 -2% | 10.95 -48% | 5.9 20% | 4.26 43% | 4.12 44% |
| Idle Maximum * (Watt) | 7.47 | 7.62 -2% | 11.14 -49% | 7.1 5% | 4.33 42% | 4.15 44% |
| Load Average * (Watt) | 9.45 | 8.39 11% | 11.54 -22% | 7.5 21% | 9.82 -4% | 6.2 34% |
| Load Maximum * (Watt) | 12.31 | 12.08 2% | 12.8 -4% | 10.4 16% | 13.99 -14% | 9.27 25% |
* ... smaller is better
| Apple iPad (2017) 8.827 mAh | Apple iPad Pro 9.7 7306 mAh | Apple iPad Pro 12.9 10307 mAh | Apple iPad Air 1 2013 mAh | Samsung Galaxy Tab S3 SM-T825 6000 mAh | Google Pixel C mAh | Huawei MediaPad T2 10.0 Pro 6600 mAh | |
|---|---|---|---|---|---|---|---|
| Battery runtime | -2% | -5% | -5% | 15% | 10% | -22% | |
| Reader / Idle (h) | 24.9 | 30.8 24% | 32.2 29% | 23.8 -4% | 31.7 27% | 34.8 40% | 20.5 -18% |
| H.264 (h) | 14.1 | 11.8 -16% | 10.5 -26% | 10.7 -24% | 9.2 -35% | 12.3 -13% | 9.9 -30% |
| WiFi v1.3 (h) | 12.7 | 13 2% | 11.6 -9% | 12.7 0% | 10.6 -17% | 6.9 -46% | |
| Load (h) | 3.8 | 3.1 -18% | 3.3 -13% | 4.3 13% | 6.3 66% | 4.9 29% | 4.1 8% |
| WiFi (h) | 9.2 |
Pros
Cons
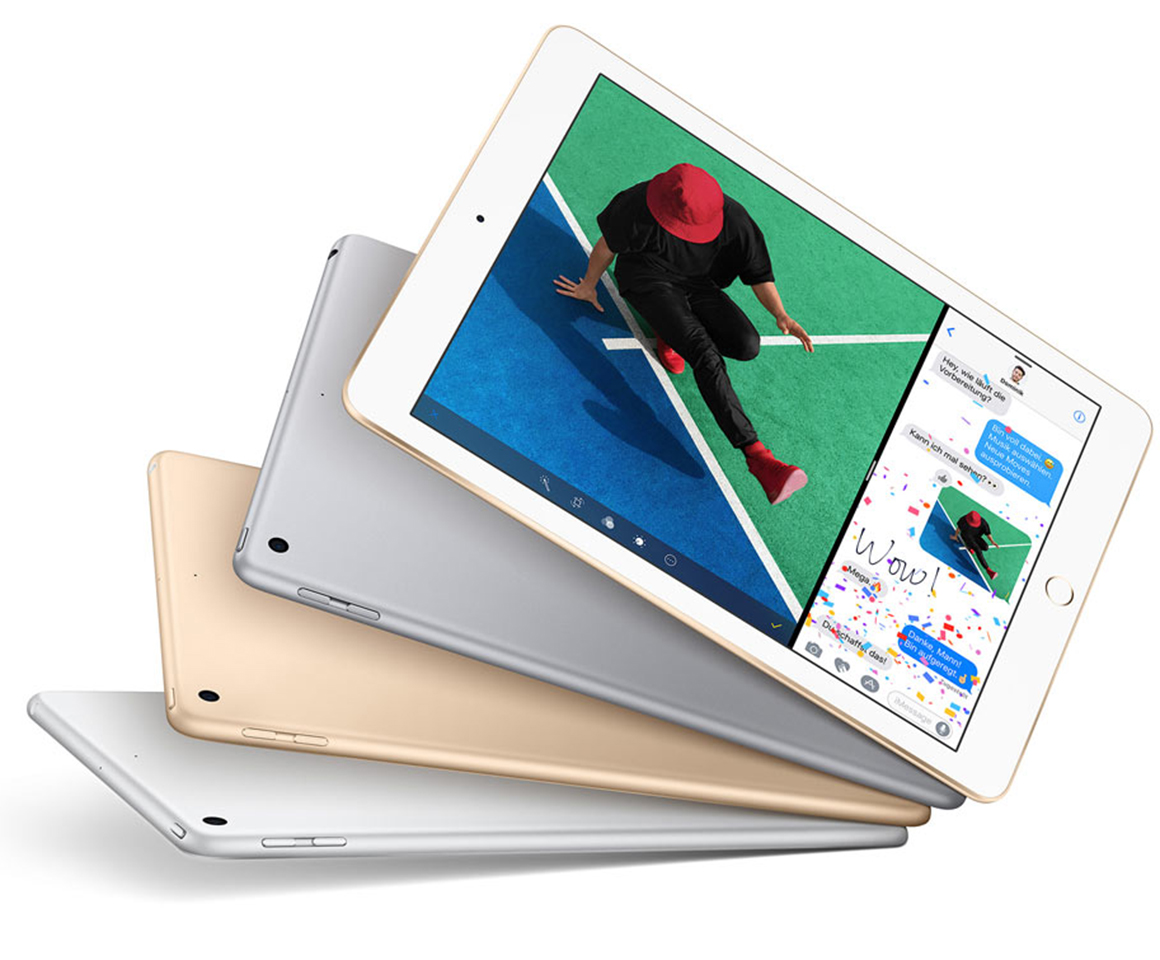
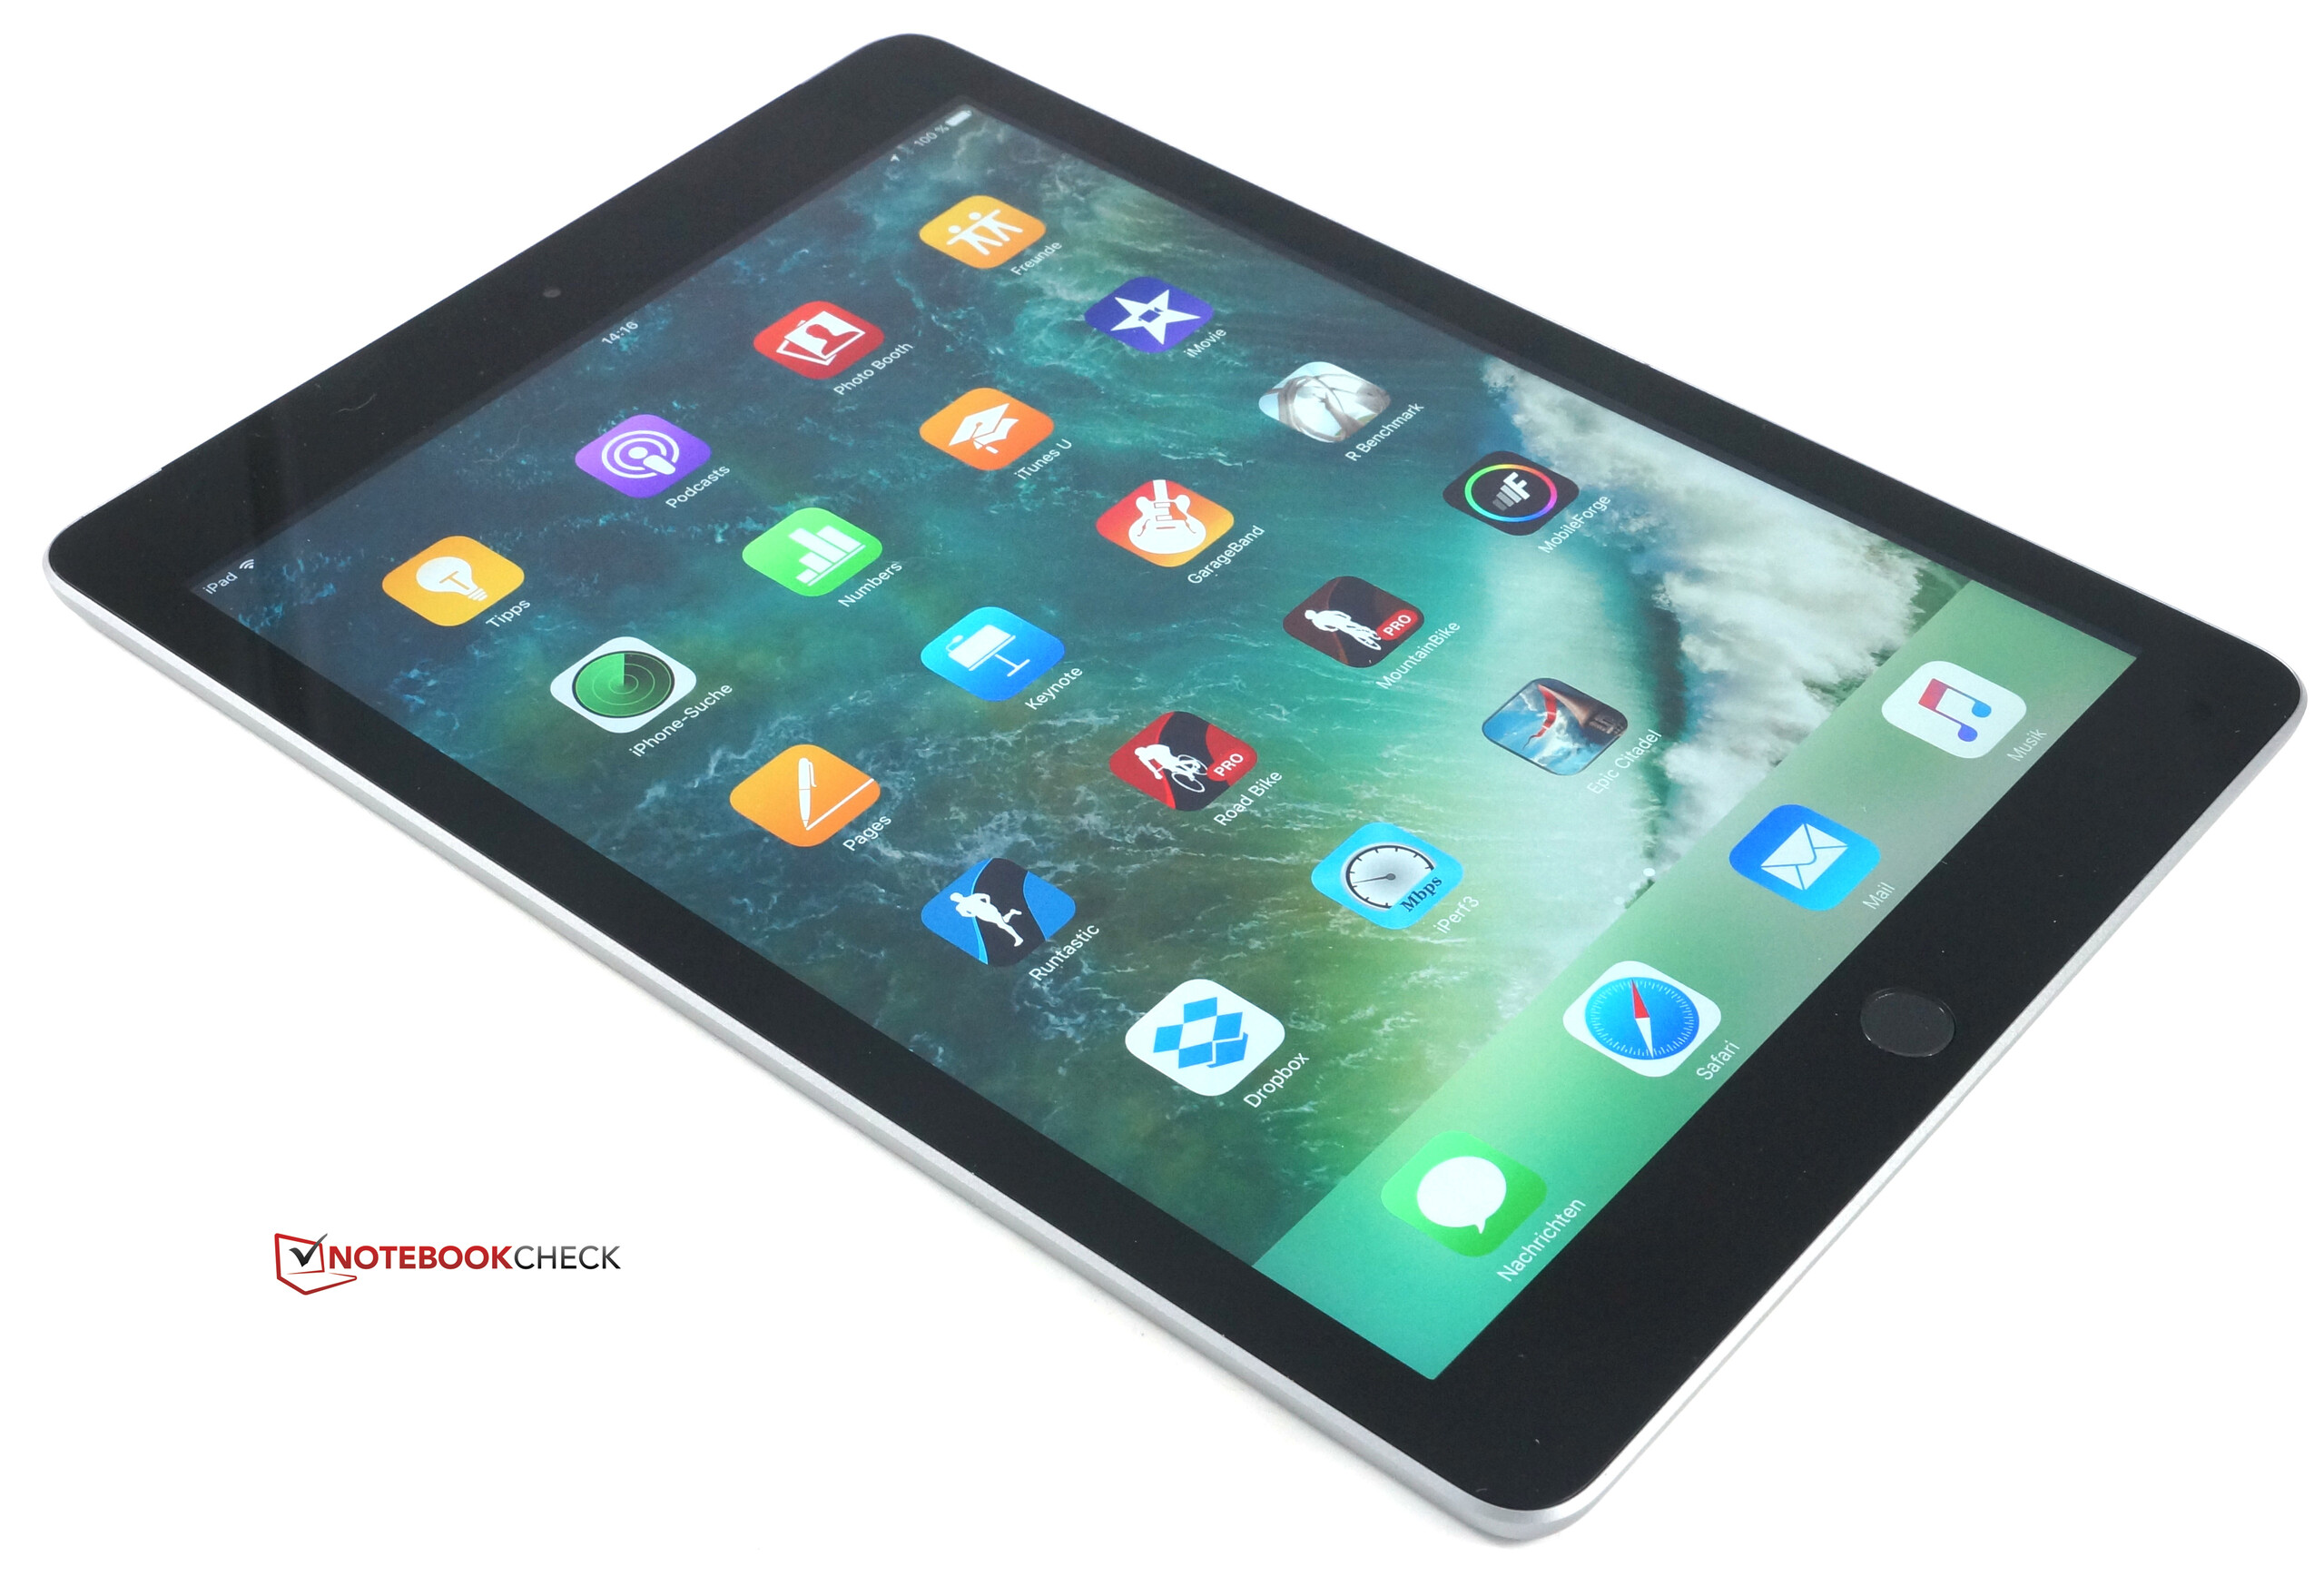
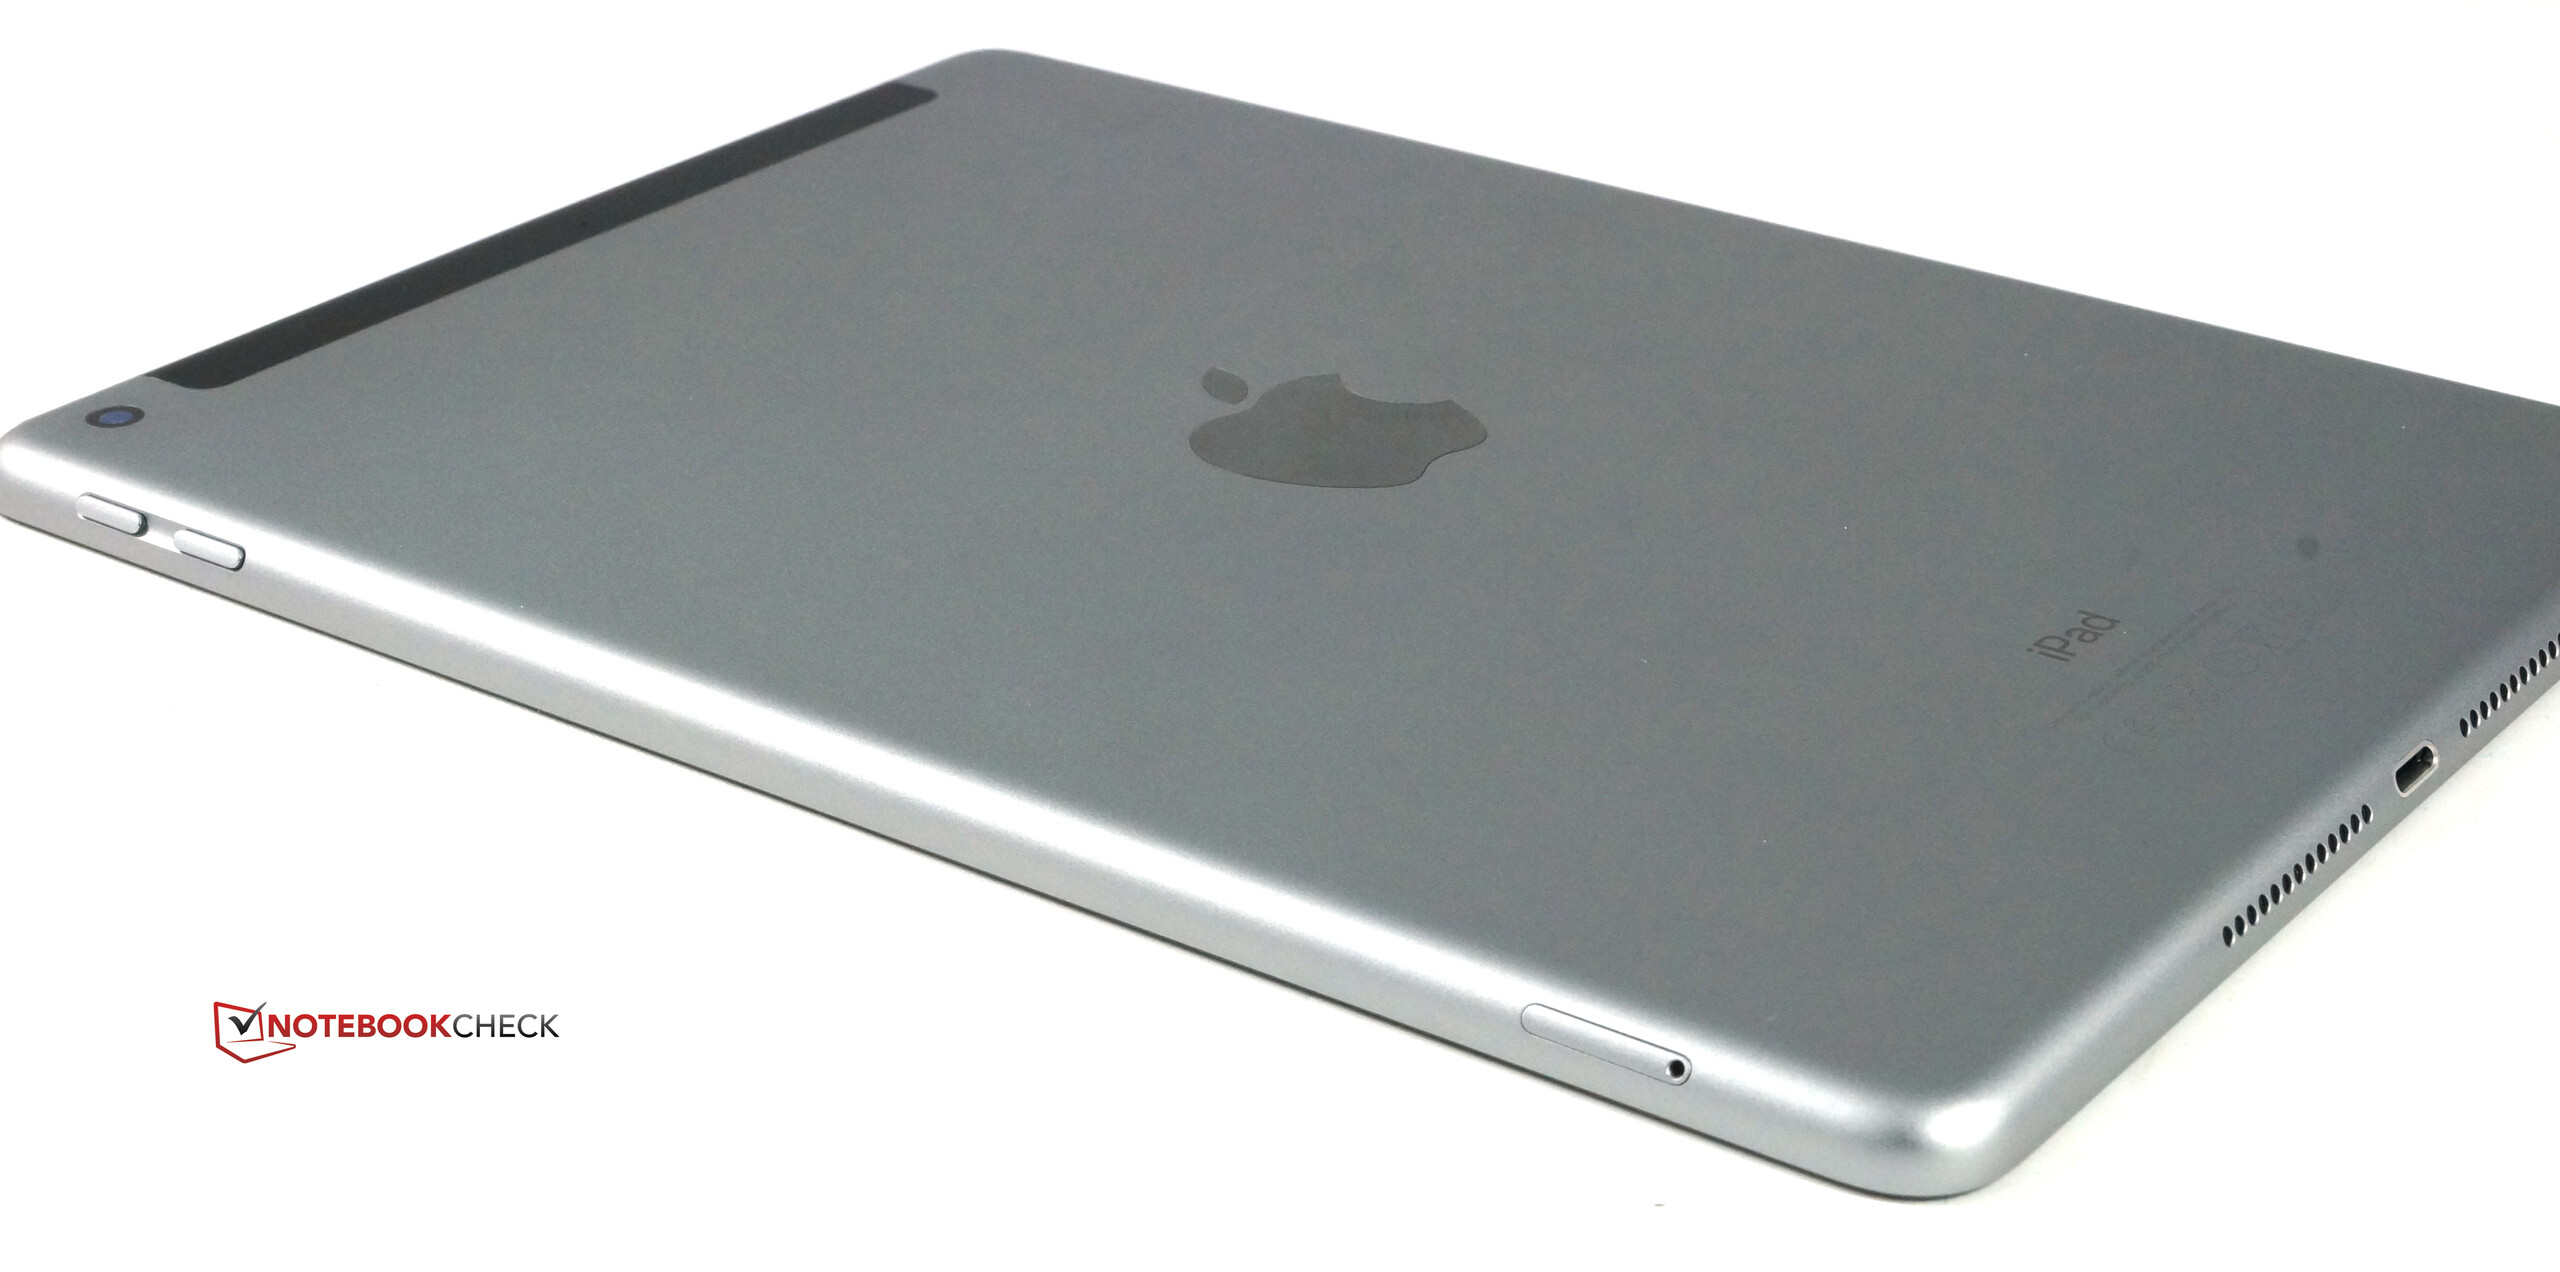
新瓶装旧酒——这句话经常用于形容厂商重制某款旧产品,尤其当其仍使用老旧的技术的时候。这种情况也适用于苹果公司最新的iPad 。这款2017年的iOS平板电脑设备就是这样:回收再利用,将老旧的硬件装在更旧的外壳中。 可是,这款入门级的设备仅需400欧元(约合329美元),可以说是苹果平板电脑中的便宜货。若是只看外表,理论上来说,我们就可以在此下结论了。
但仔细观察以下的话,便能够移除很多一开始认为的缺点。的确,Soc是老了点,但是对于平板来说它的性能依旧是很不错的。而且诚然,这个外壳已经用了好多年,而且现在已经被更加轻薄的型号代替。但是,其所用的制造质量及材料仍然是顶级的。我们认为了除了iPad Air 2和iPad Pro 9.7之外可能没有其他更加轻薄的平板会比iPad 2017更加吸引人。
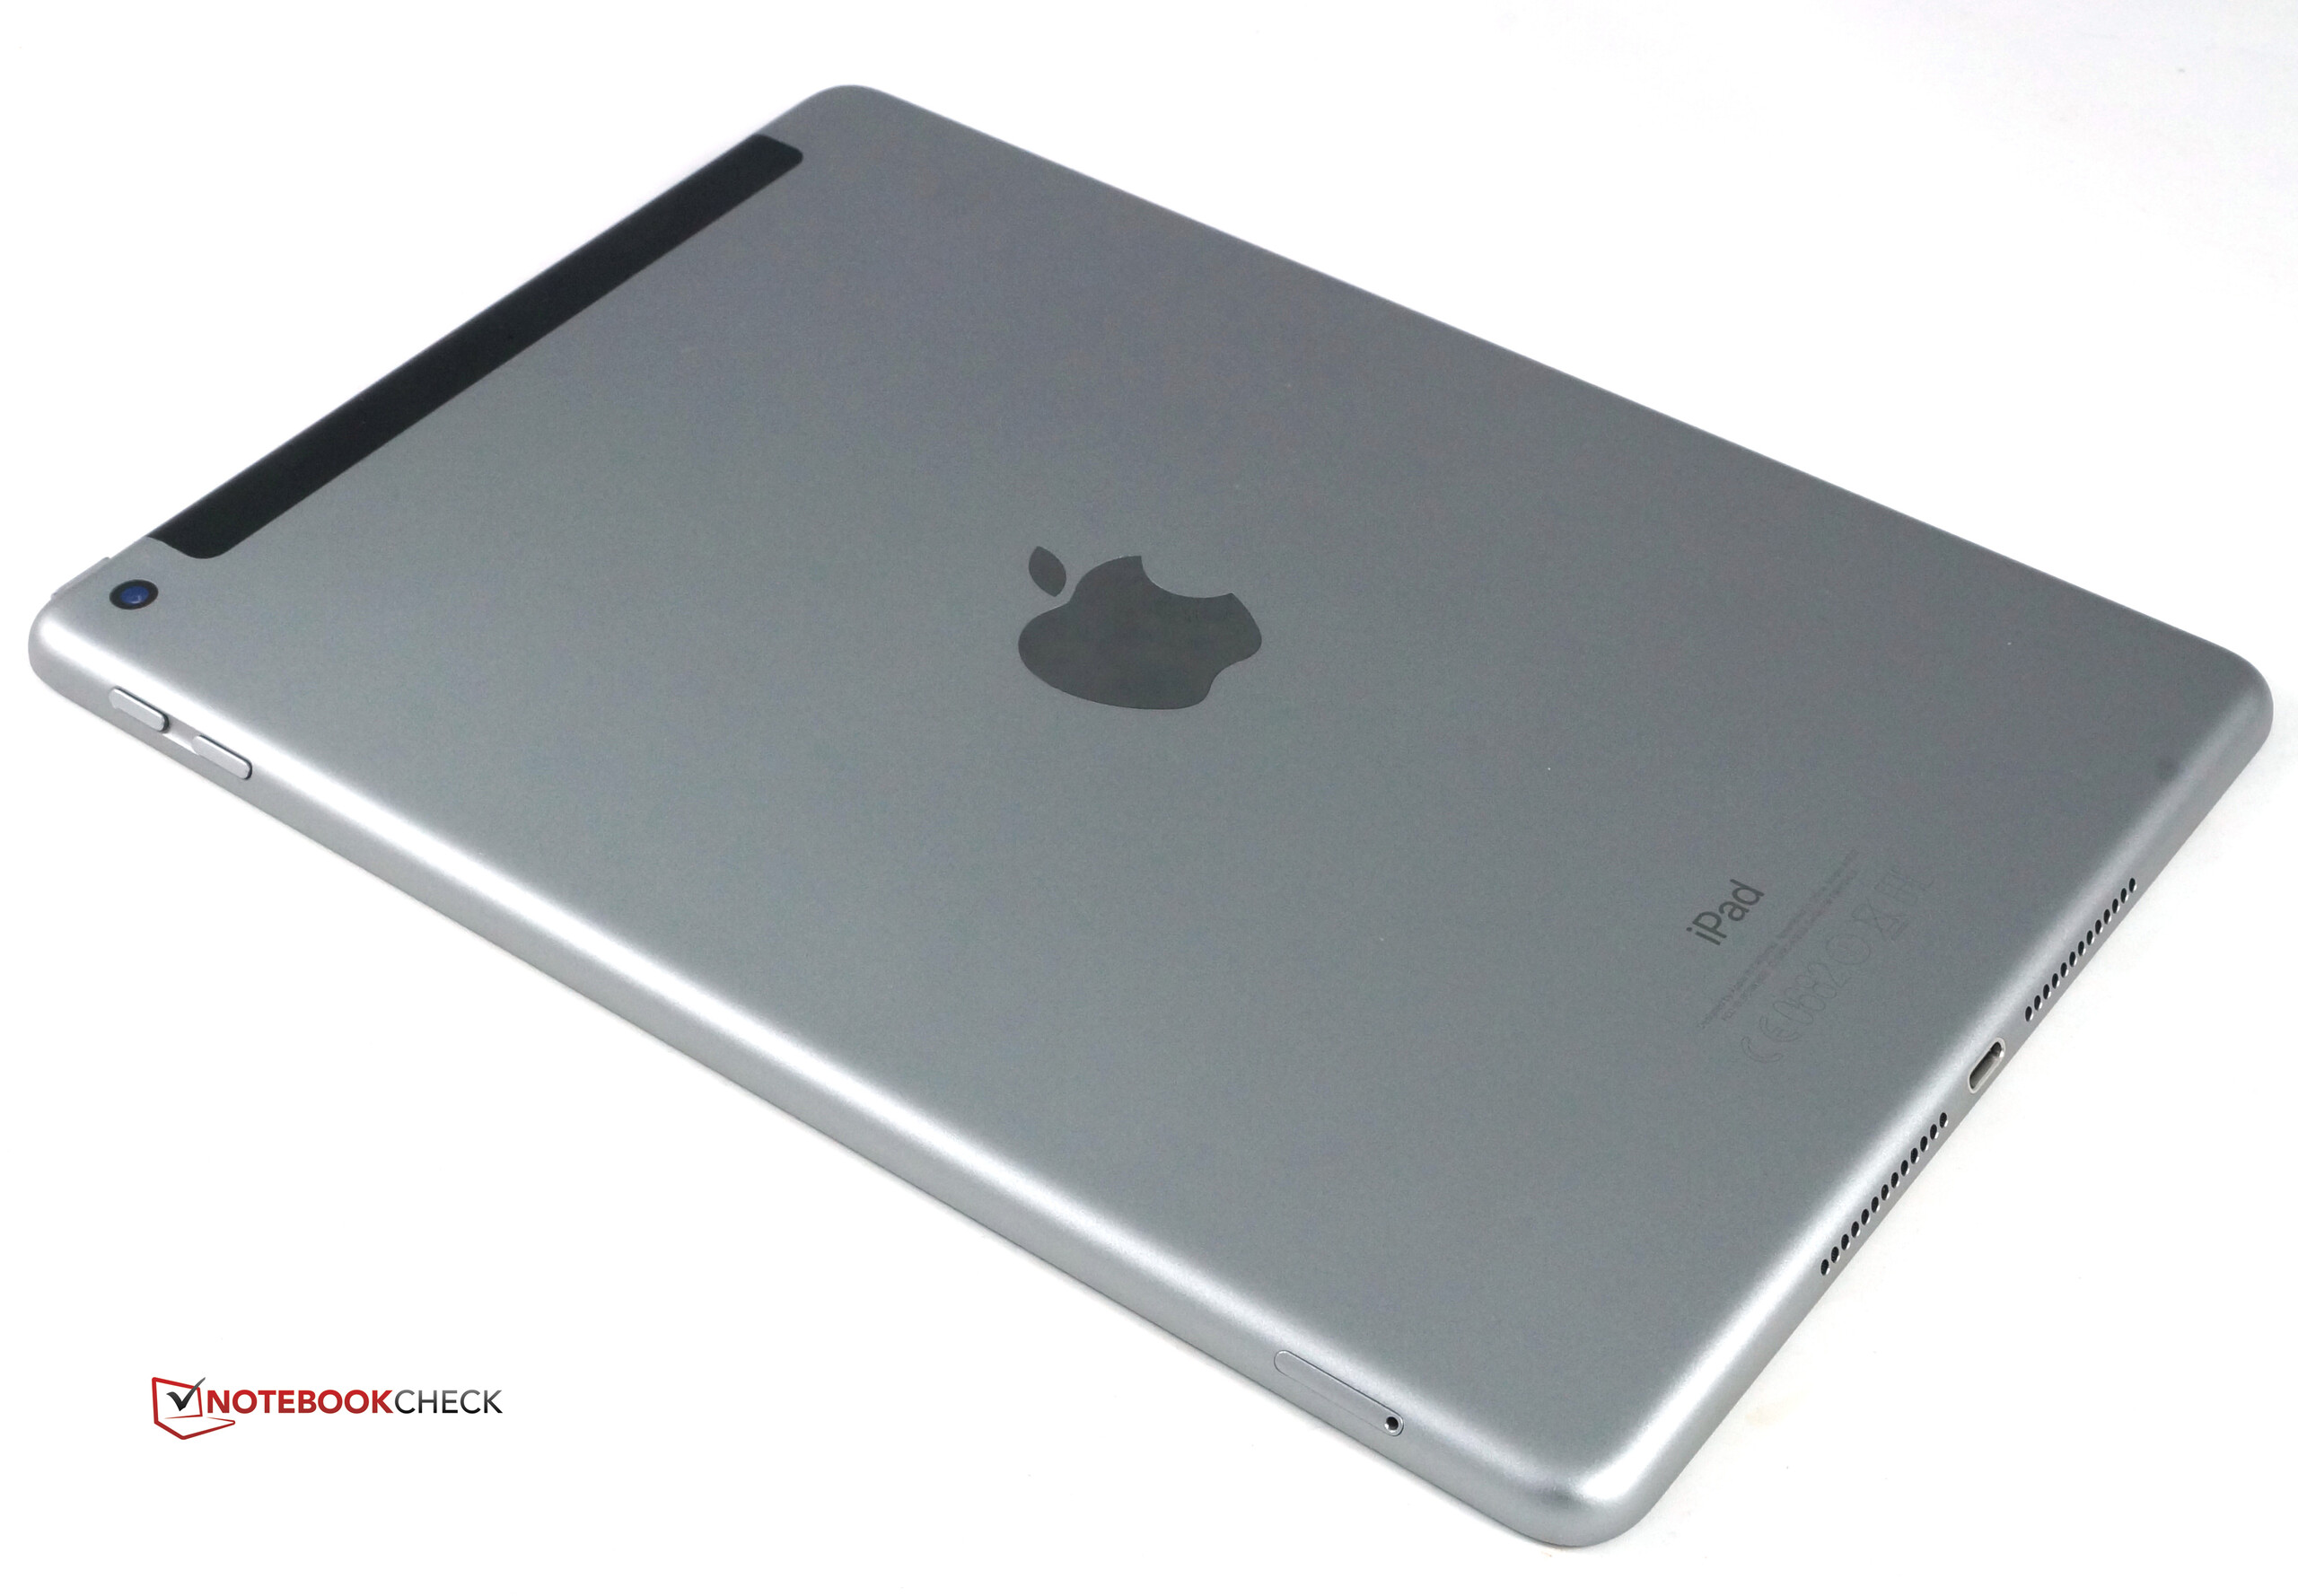
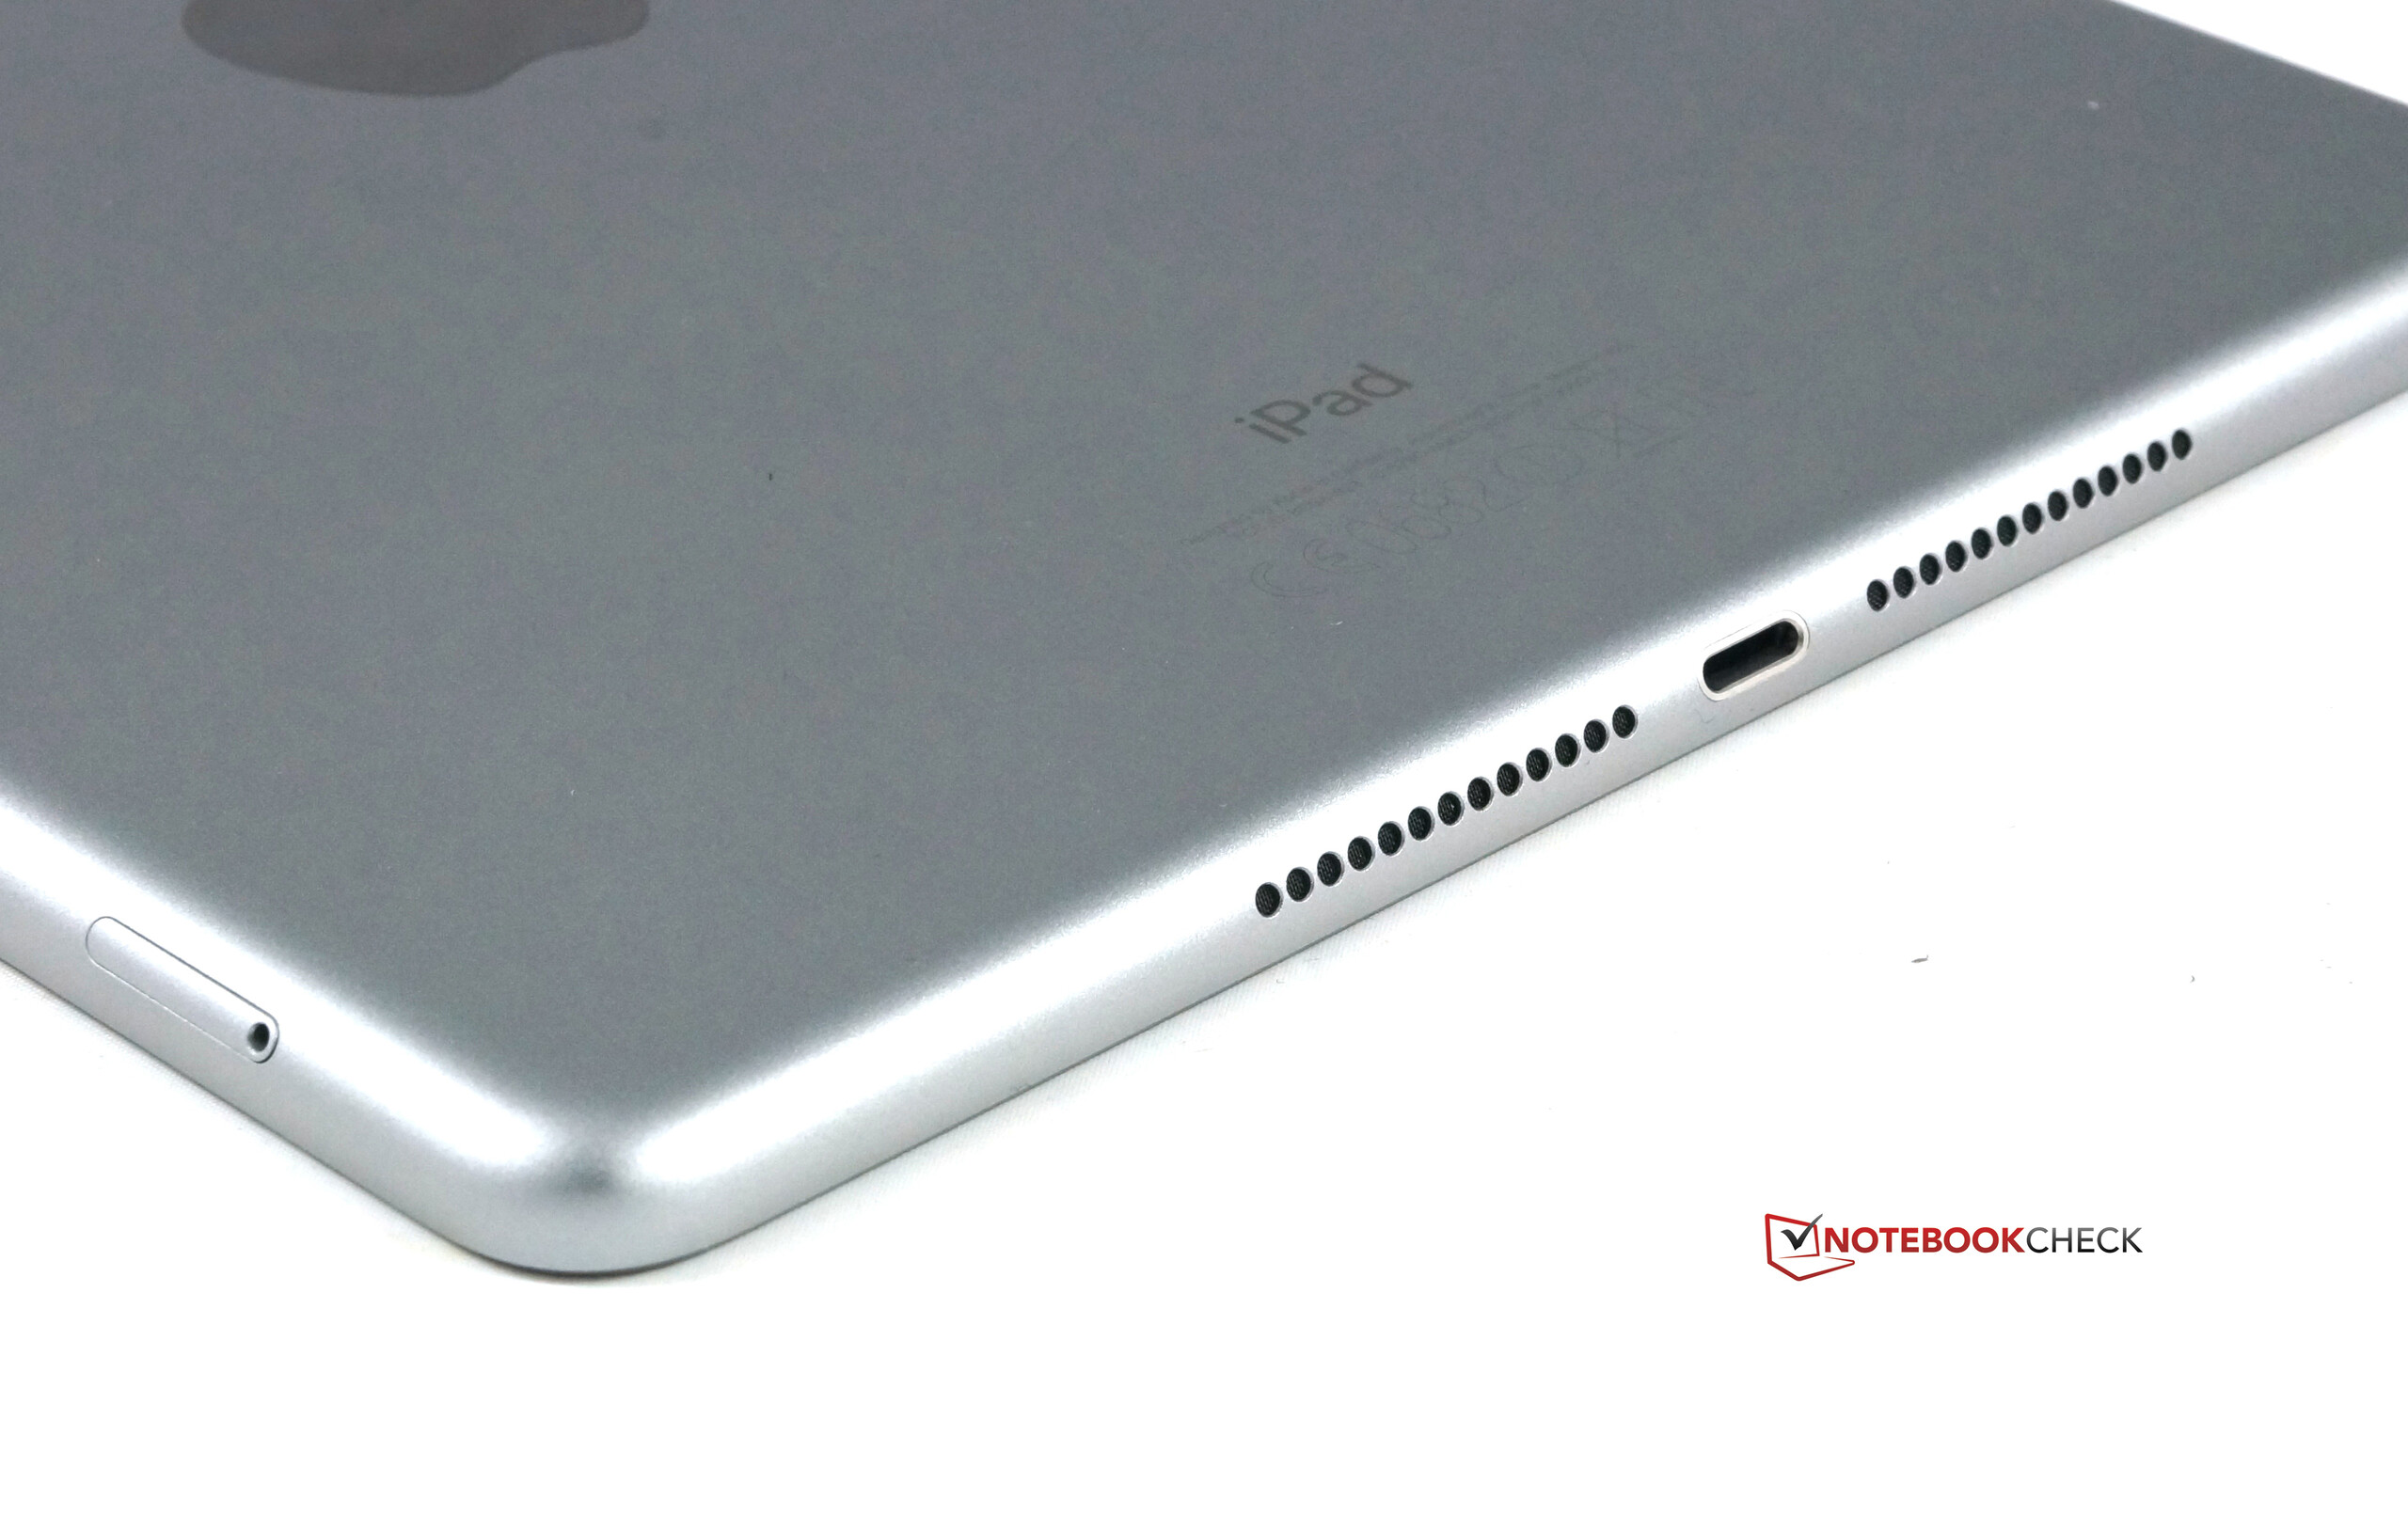
当然,苹果也相较于原本的iPad Air对新iPad做了部分改进。首当其冲的是更快的芯片。同时,屏幕亮度提高许多,电池续航也有所增强。搭配有更快的Wi-Fi,众多的LTE频段,极佳的GPS芯片以及又能够满足基本需求的摄像头,这瓶老酒突然之间看起来吸引人了许多。
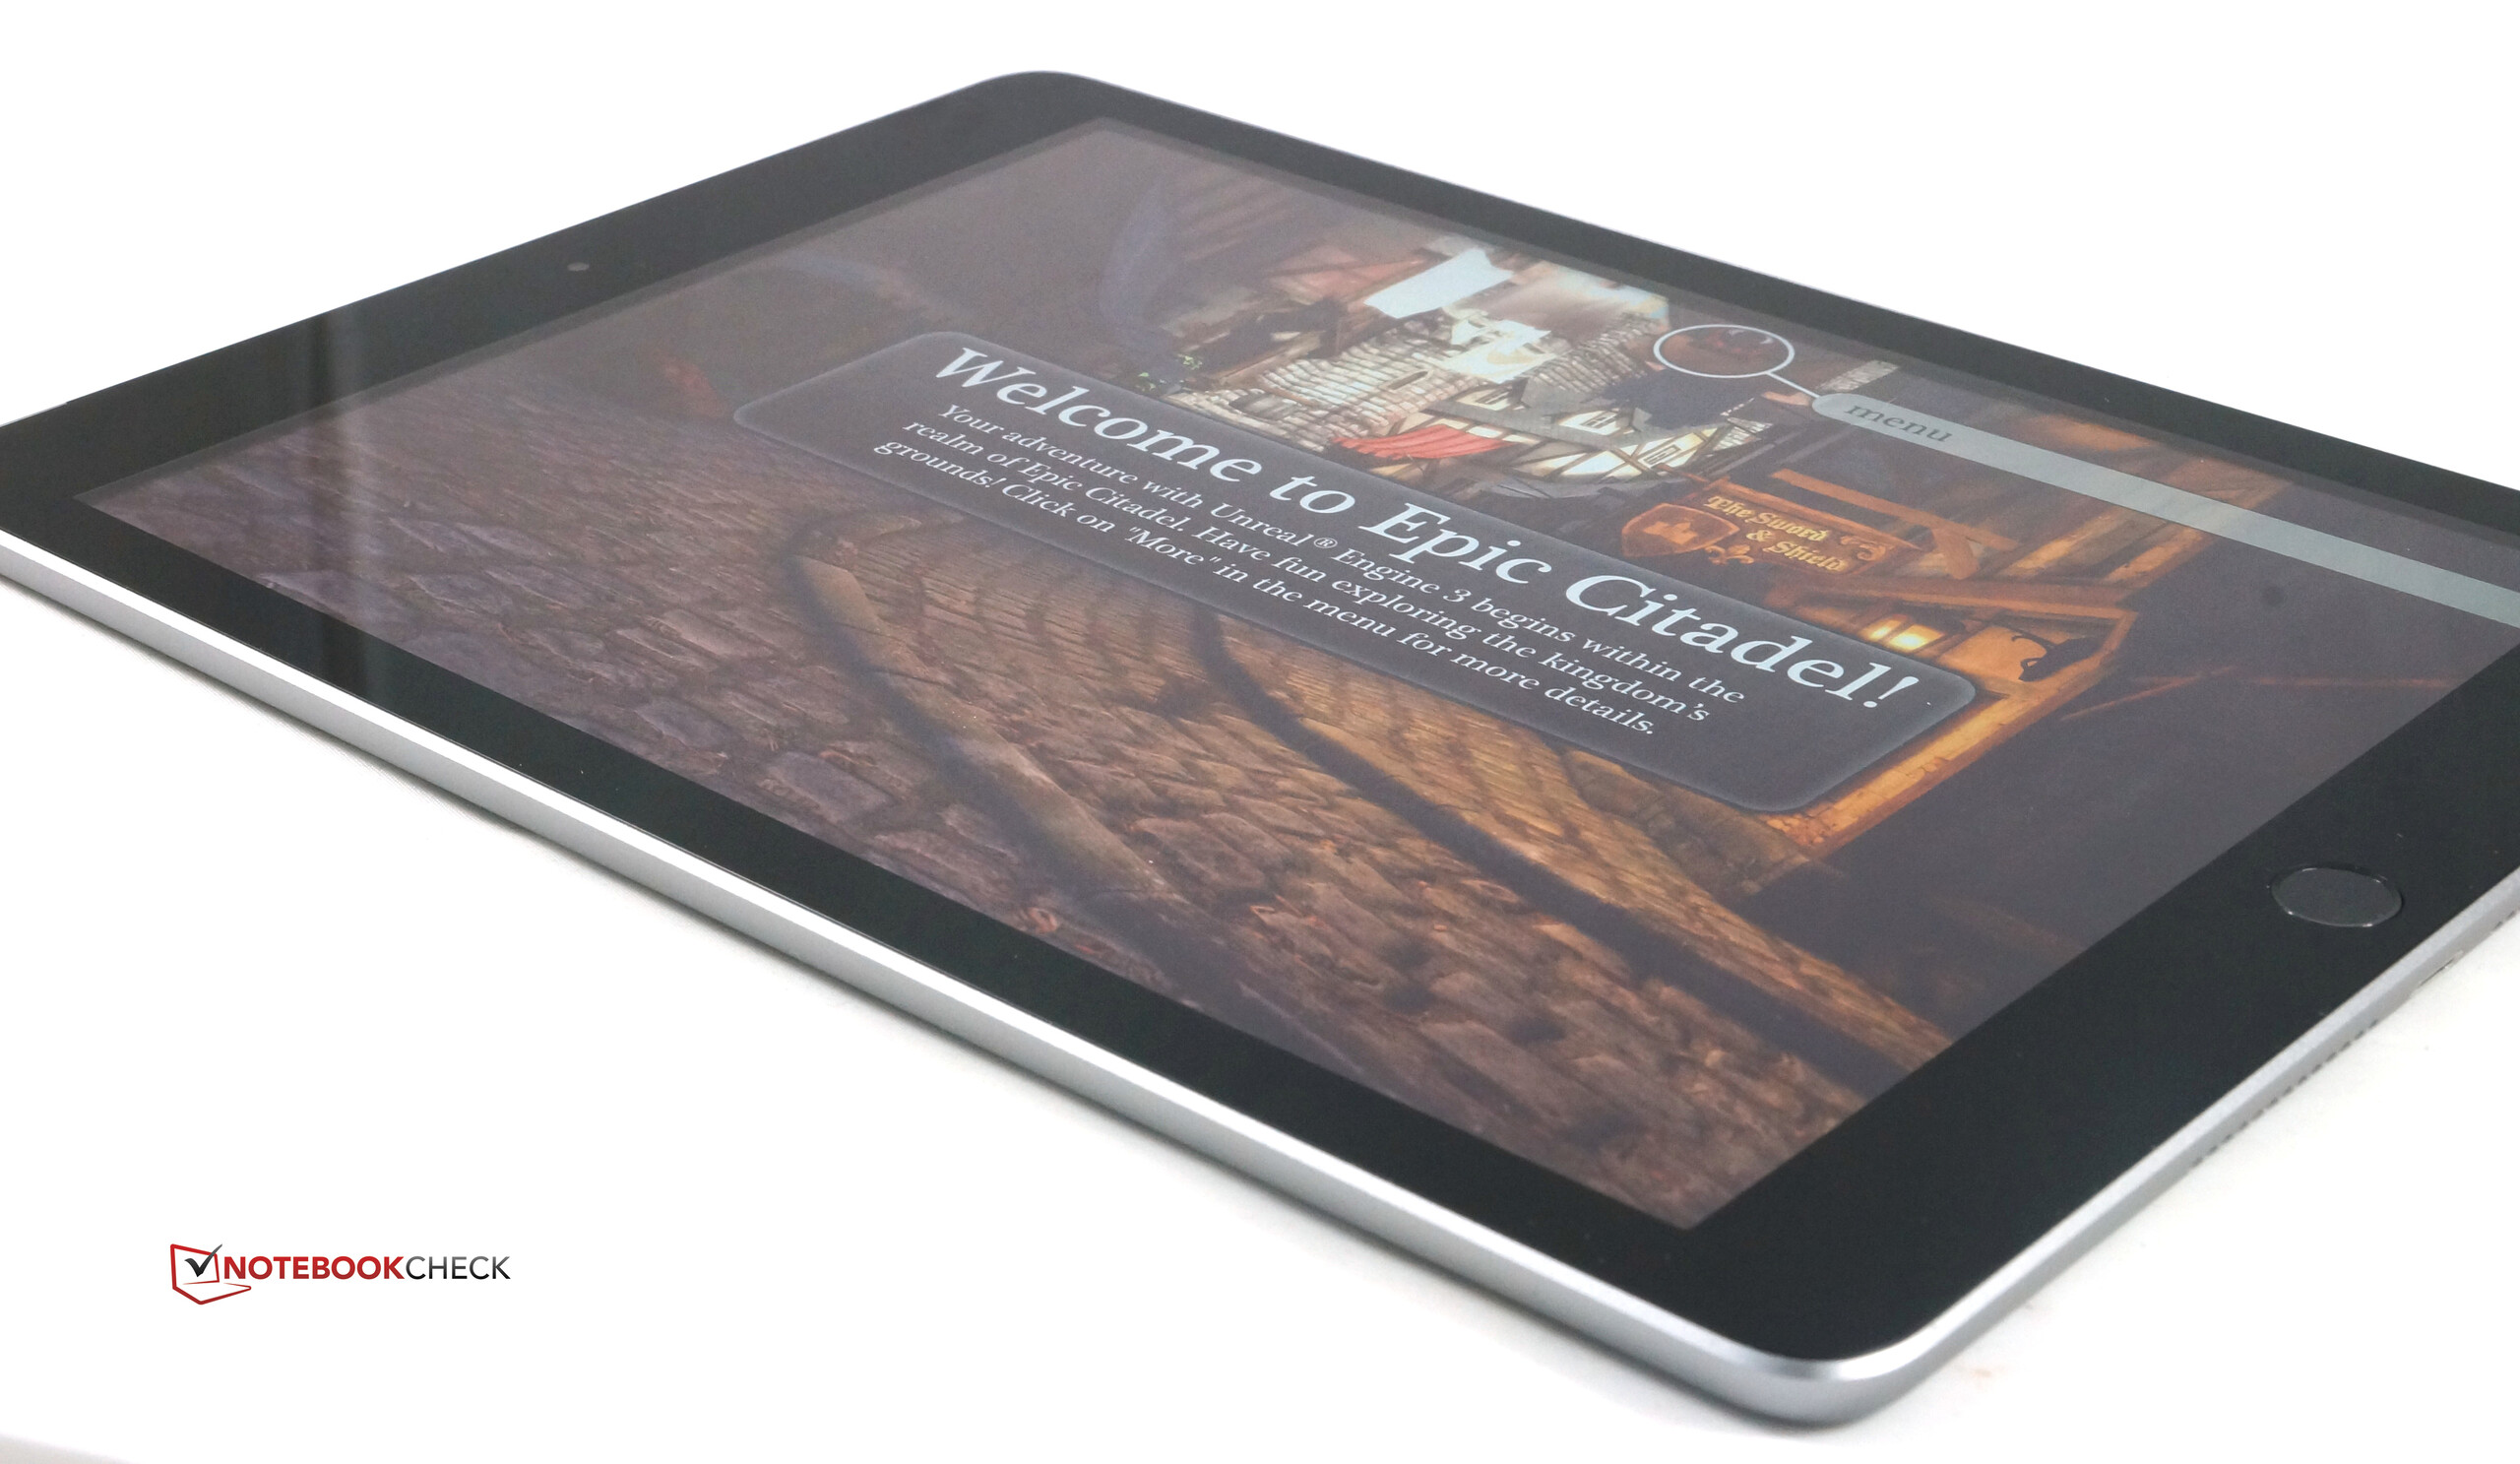
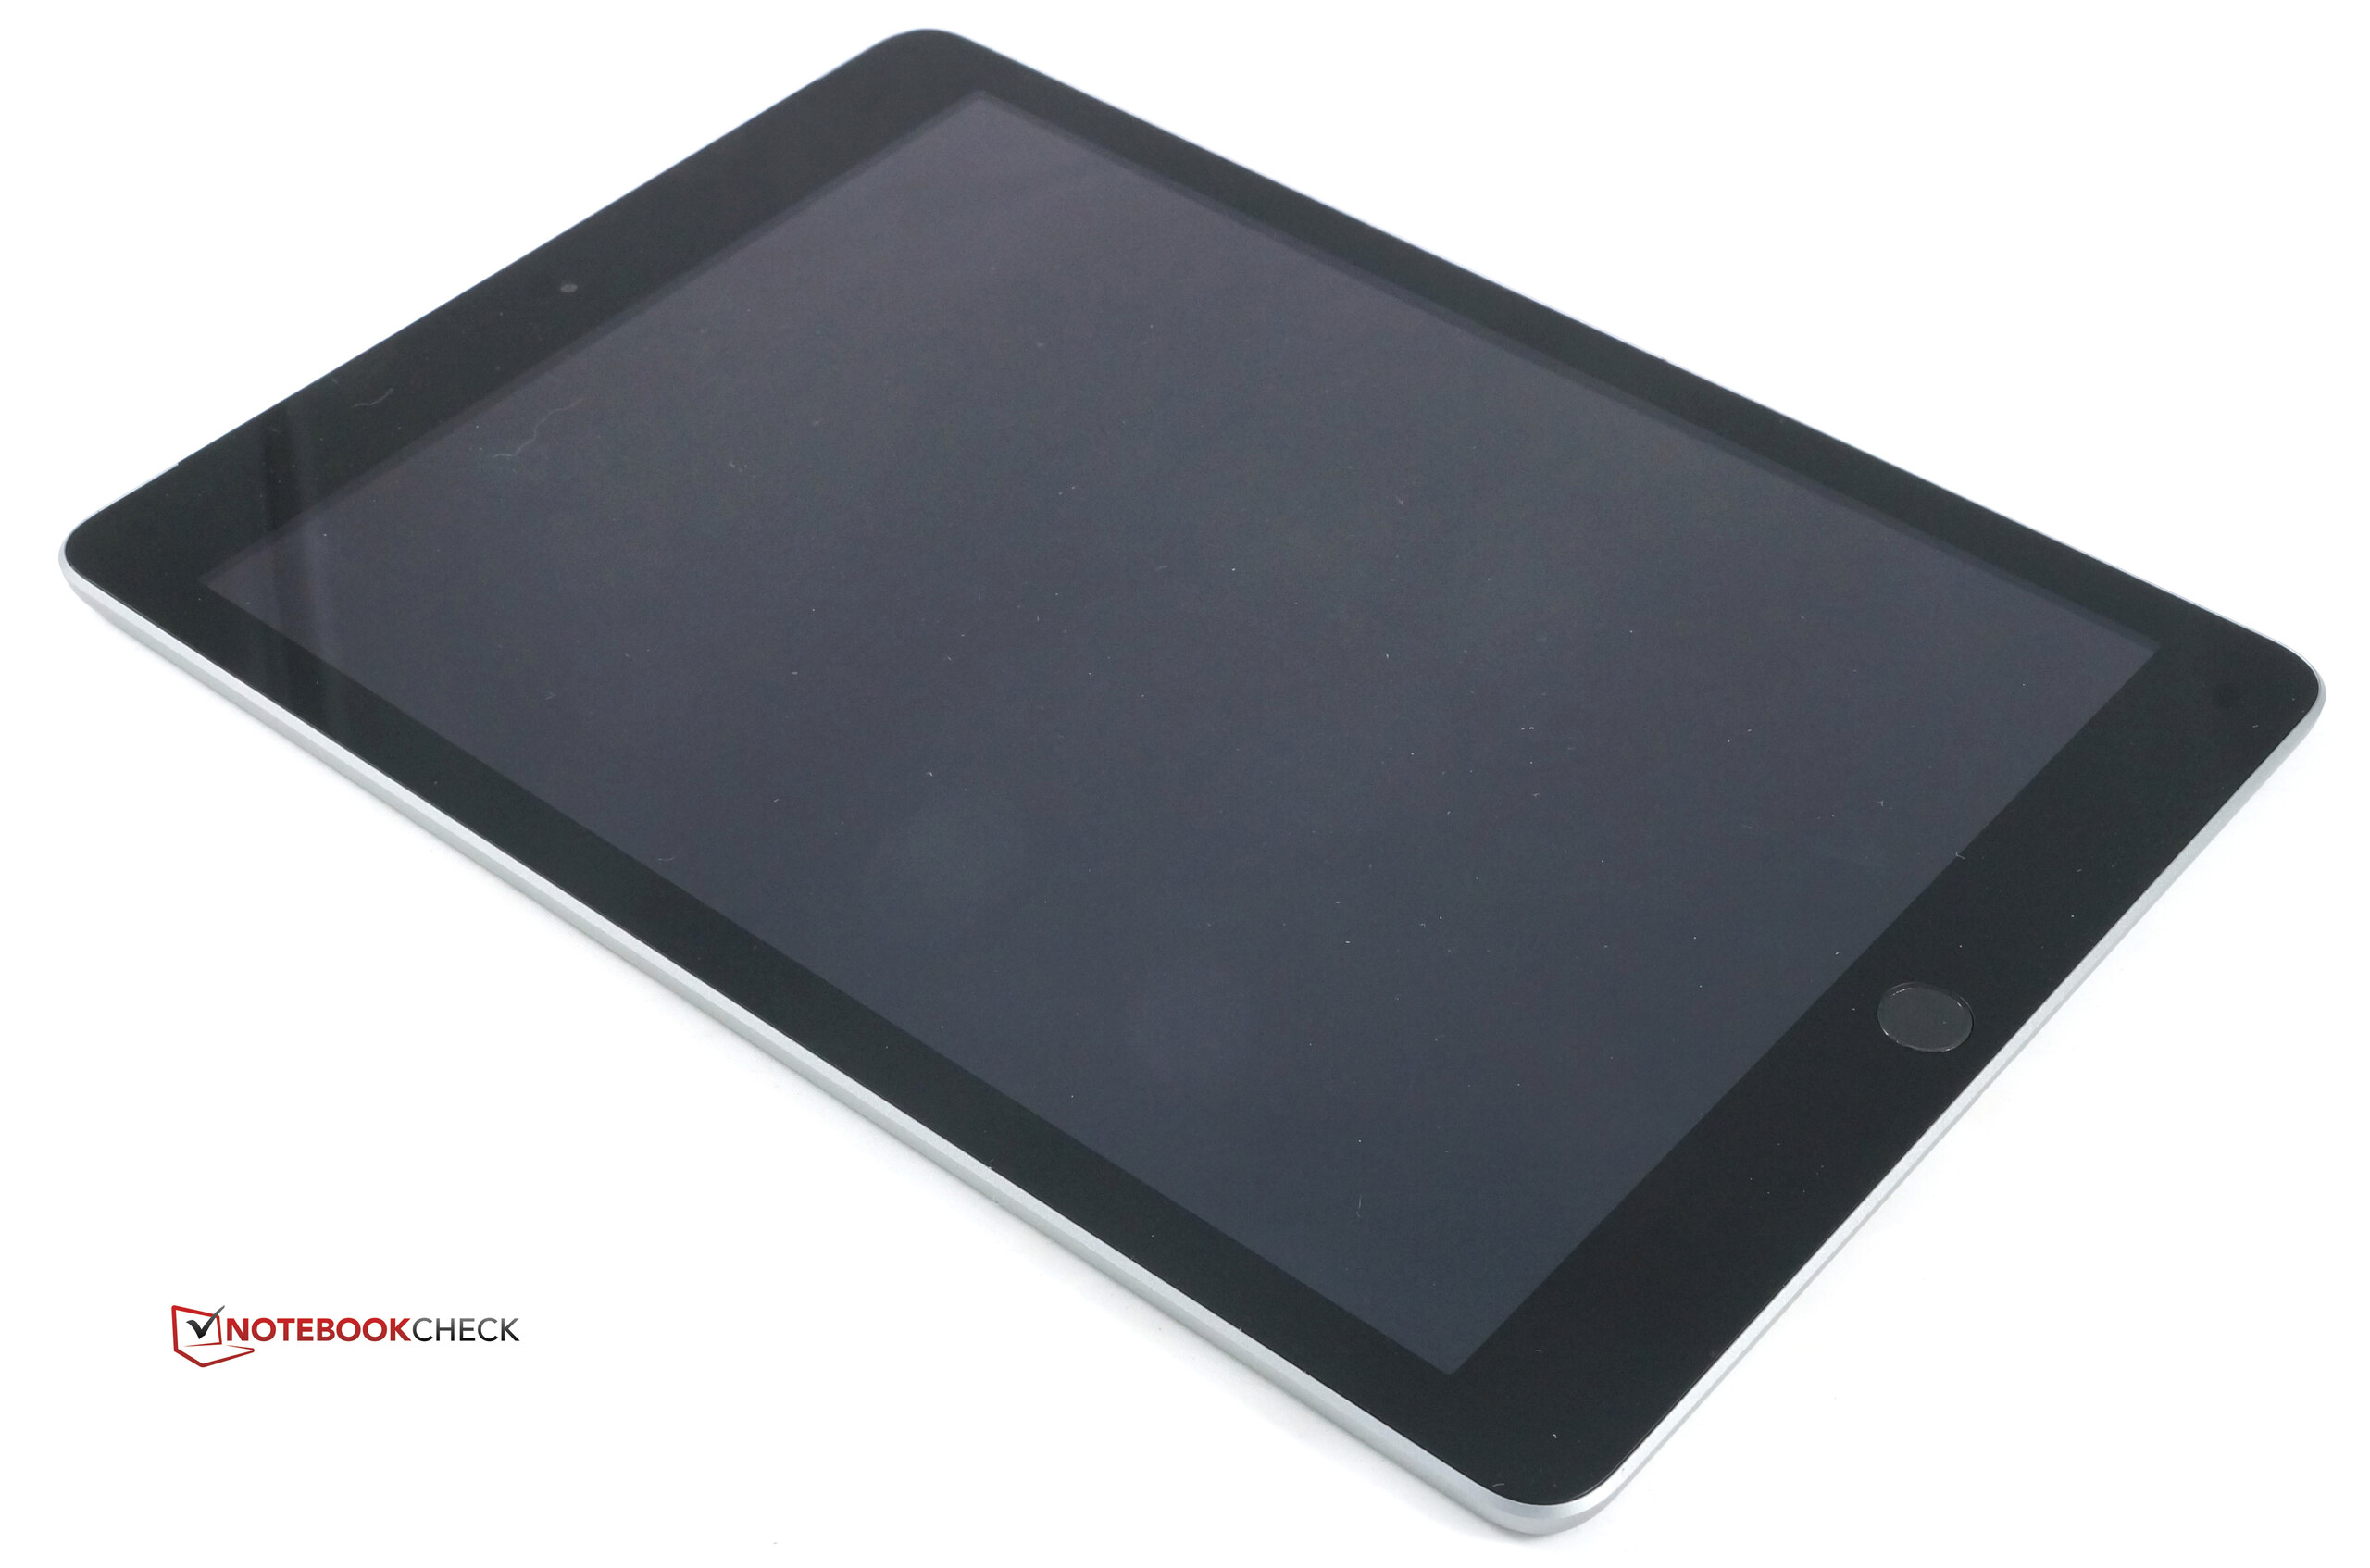
但缺点还是存在的。全贴合屏幕的缺失带来了一个平板电脑界的老问题:直射的阳光会使得平板成为一面镜子。这对于那些已经用过iPad Mini 4或是 Air 2的用户来说将会是一个烦人的退步。新iPad “仅仅”覆盖了sRGB色域,但这并不是关键性问题。而且400欧元的价位意味着你无法获得对于Apple Pencil的支持,这也是那些更昂贵的Pro型号的卖点之一。
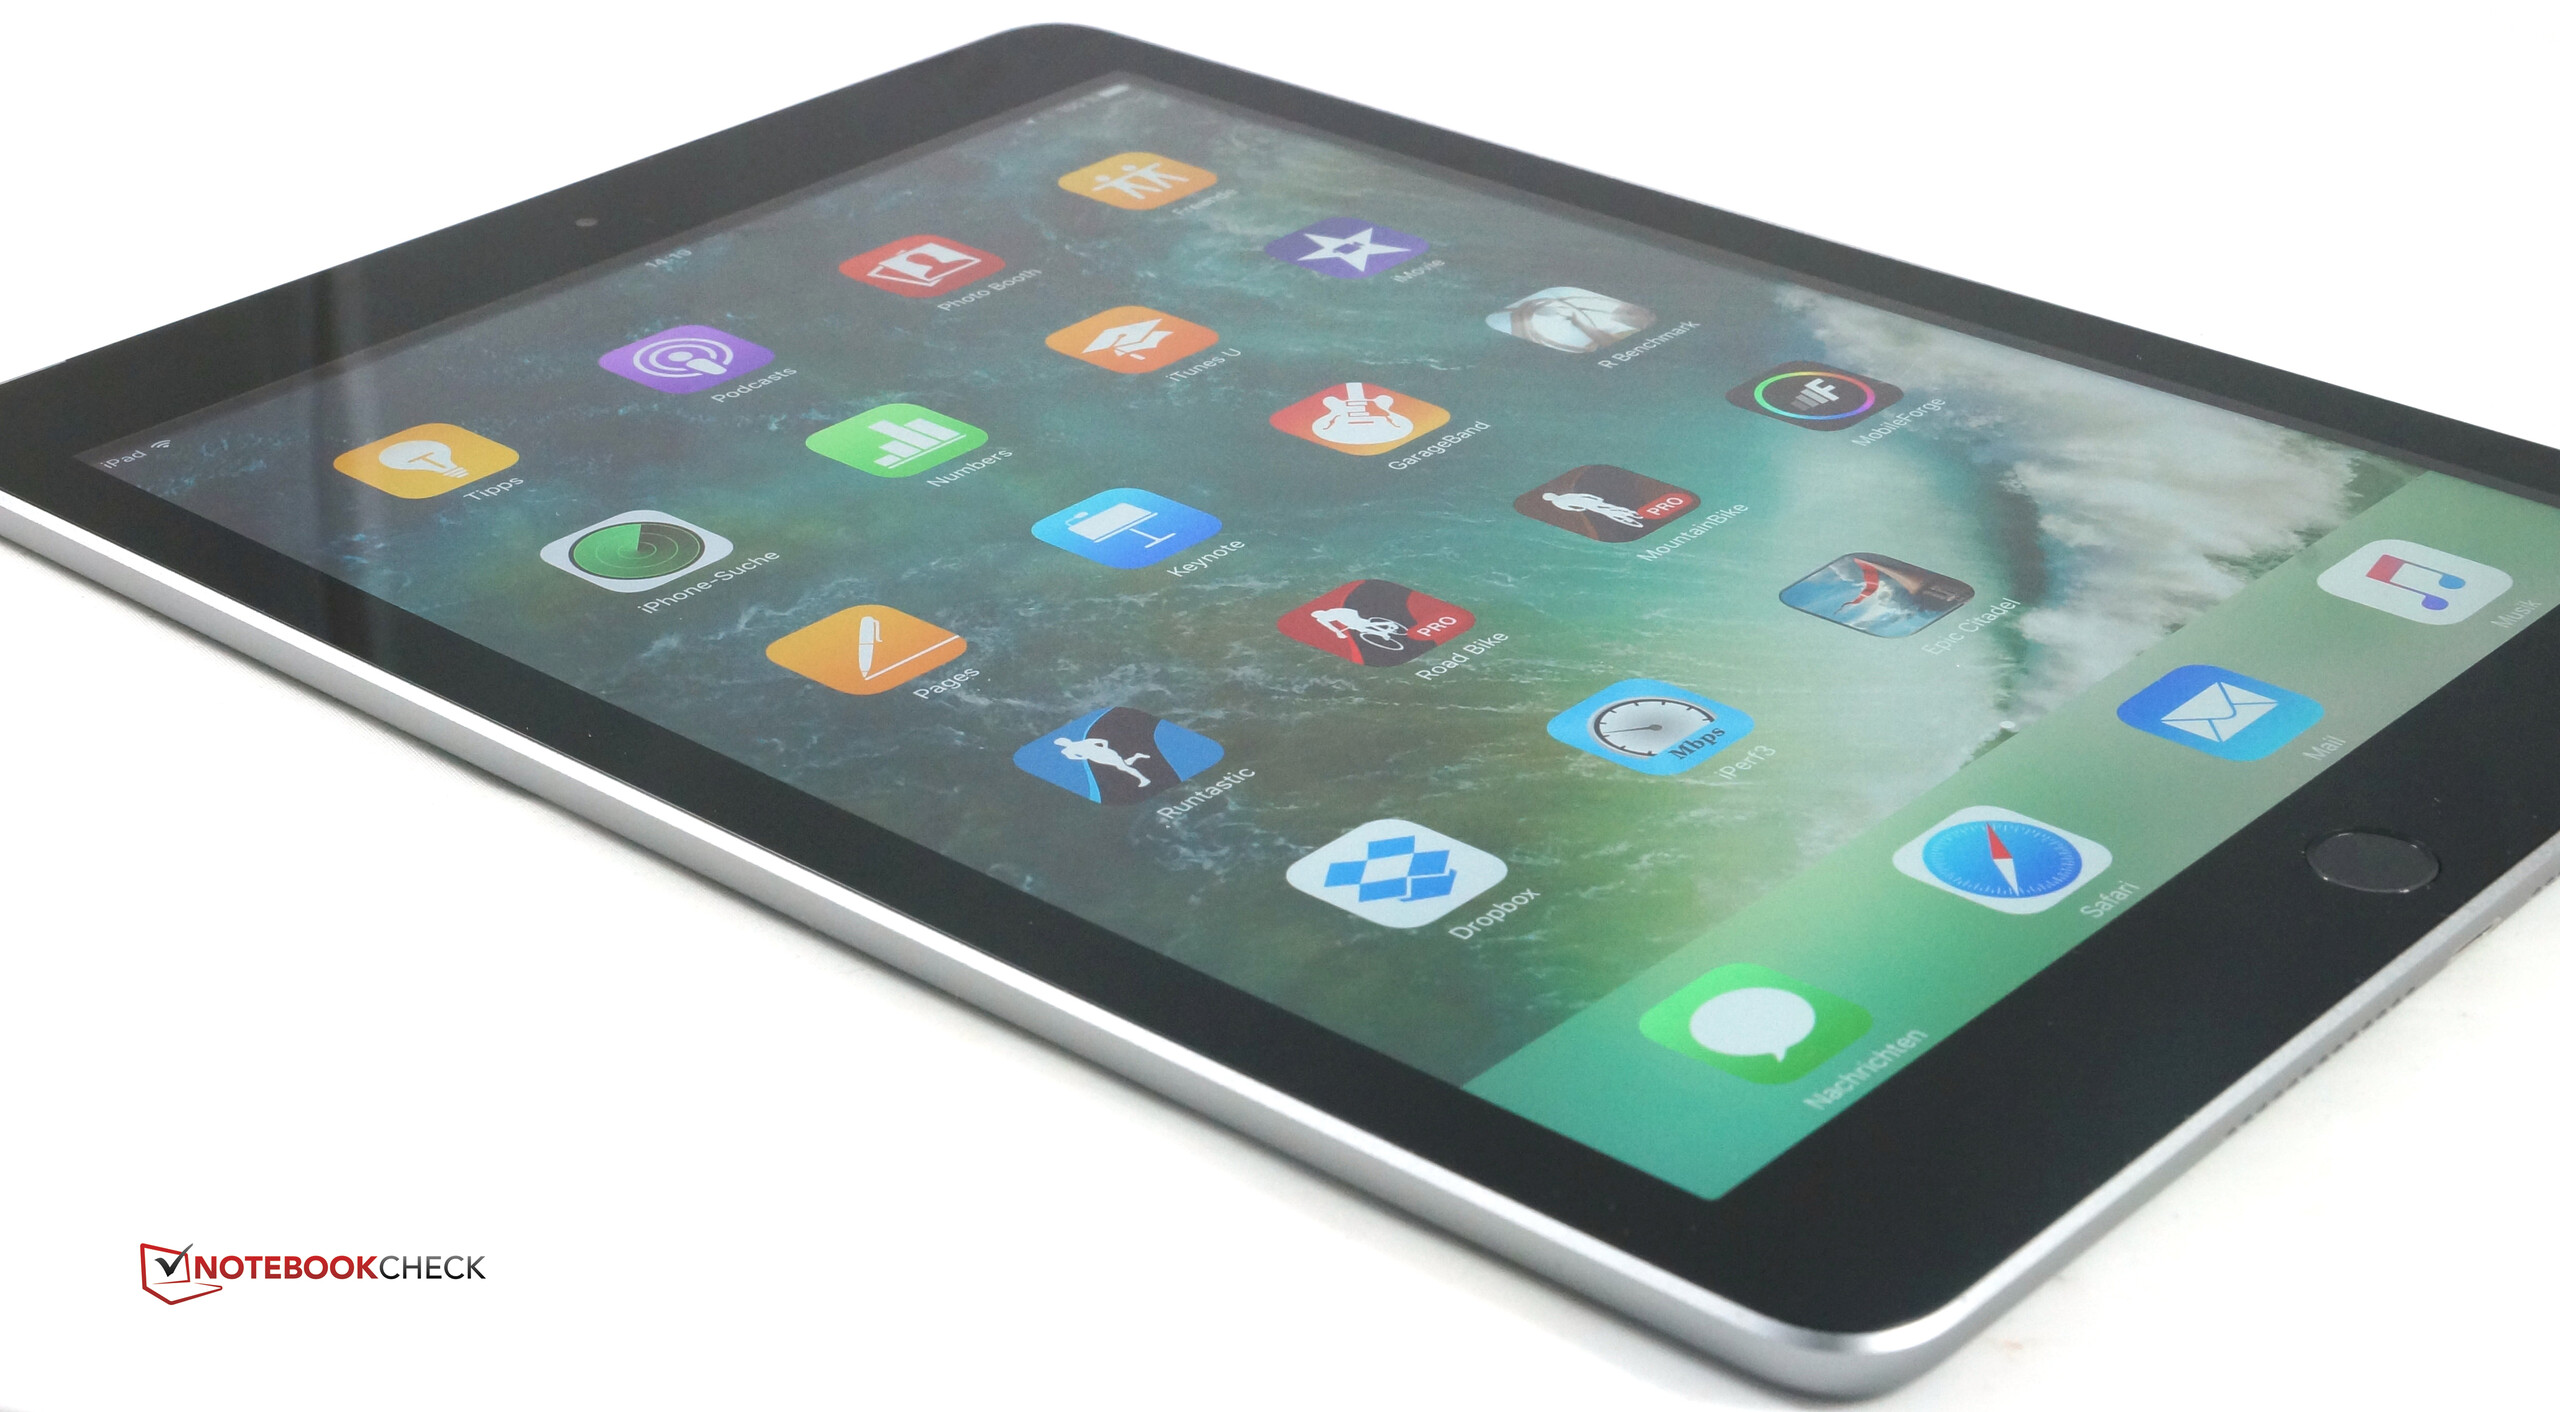
那么总结:苹果的新 iPad 几乎就是太棒了。如果不考虑到过时的硬件的话,除了苹果自己的平板外它在性能上没有对手。总体评分对于“弱者”来说几乎是梦幻级别的,但这也是平板市场竞争弱化的结果之一。
注:本文是基于完整评测的缩减版本,阅读完整的英文评测,请点击这里。
Apple iPad (2017)
- 03/31/2018 v6 (old)
Patrick Afschar Kaboli
Price comparison
