Apple iPad 10评论--作为iPad Air的瘦身版的周年纪念平板电脑
在这一点上,2022年的Apple iPad代表其第十代,庆祝其周年纪念。在此之际,Apple ,用现代设计对待最实惠的iPad,同时也将价格提高了一大截。从技术上讲,它是一个混合的 iPad 9和 iPad Air 4.
Apple ,这款平板电脑有两个存储版本。较小的版本提供64GB,售价579欧元(约合人民币603元);较大的256GB,售价779欧元(约合人民币812元)。可选的移动通信模块需要额外支付200欧元(约合人民币208元)。在这个测试中,找出最新的Apple 平板电脑是否值得它的价格,它与其他型号的区别是什么,以及最好的替代品是什么。
潜在的竞争对手比较
Rating | Date | Model | Weight | Height | Size | Resolution | Price |
|---|---|---|---|---|---|---|---|
| 88.6 % v7 (old) | 11 / 2022 | Apple iPad 10 A14, A14 Bionic GPU | 477 g | 7 mm | 10.90" | 2360x1640 | |
| 91.7 % v7 (old) | 03 / 2022 | Apple iPad Air 5 2022 M1, M1 8-Core GPU | 461 g | 6.1 mm | 10.90" | 2360x1640 | |
| 88.5 % v7 (old) | 10 / 2021 | Apple iPad 2021 A13 Bionic, A13 Bionic GPU | 487 g | 7.5 mm | 10.20" | 2160x1620 | |
| 85.8 % v7 (old) | 03 / 2023 | Samsung Galaxy Tab S7 FE 5G SD 750G 5G, Adreno 619 | 608 g | 6.3 mm | 12.40" | 2560x1600 | |
| 88.7 % v7 (old) | 11 / 2021 | Xiaomi Pad 5 Pro SD 870, Adreno 650 | 515 g | 6.85 mm | 11.00" | 2560x1600 | |
| 89.2 % v7 (old) | 11 / 2022 | Lenovo Tab P11 Pro Gen 2 Kompanio 1300T, Mali-G77 MP9 | 480 g | 6.8 mm | 11.20" | 2560x1536 |
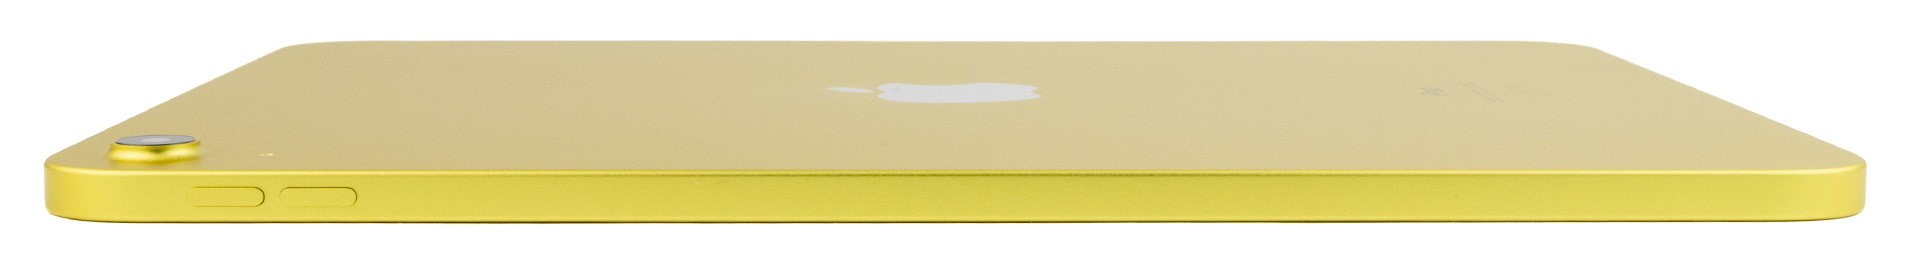
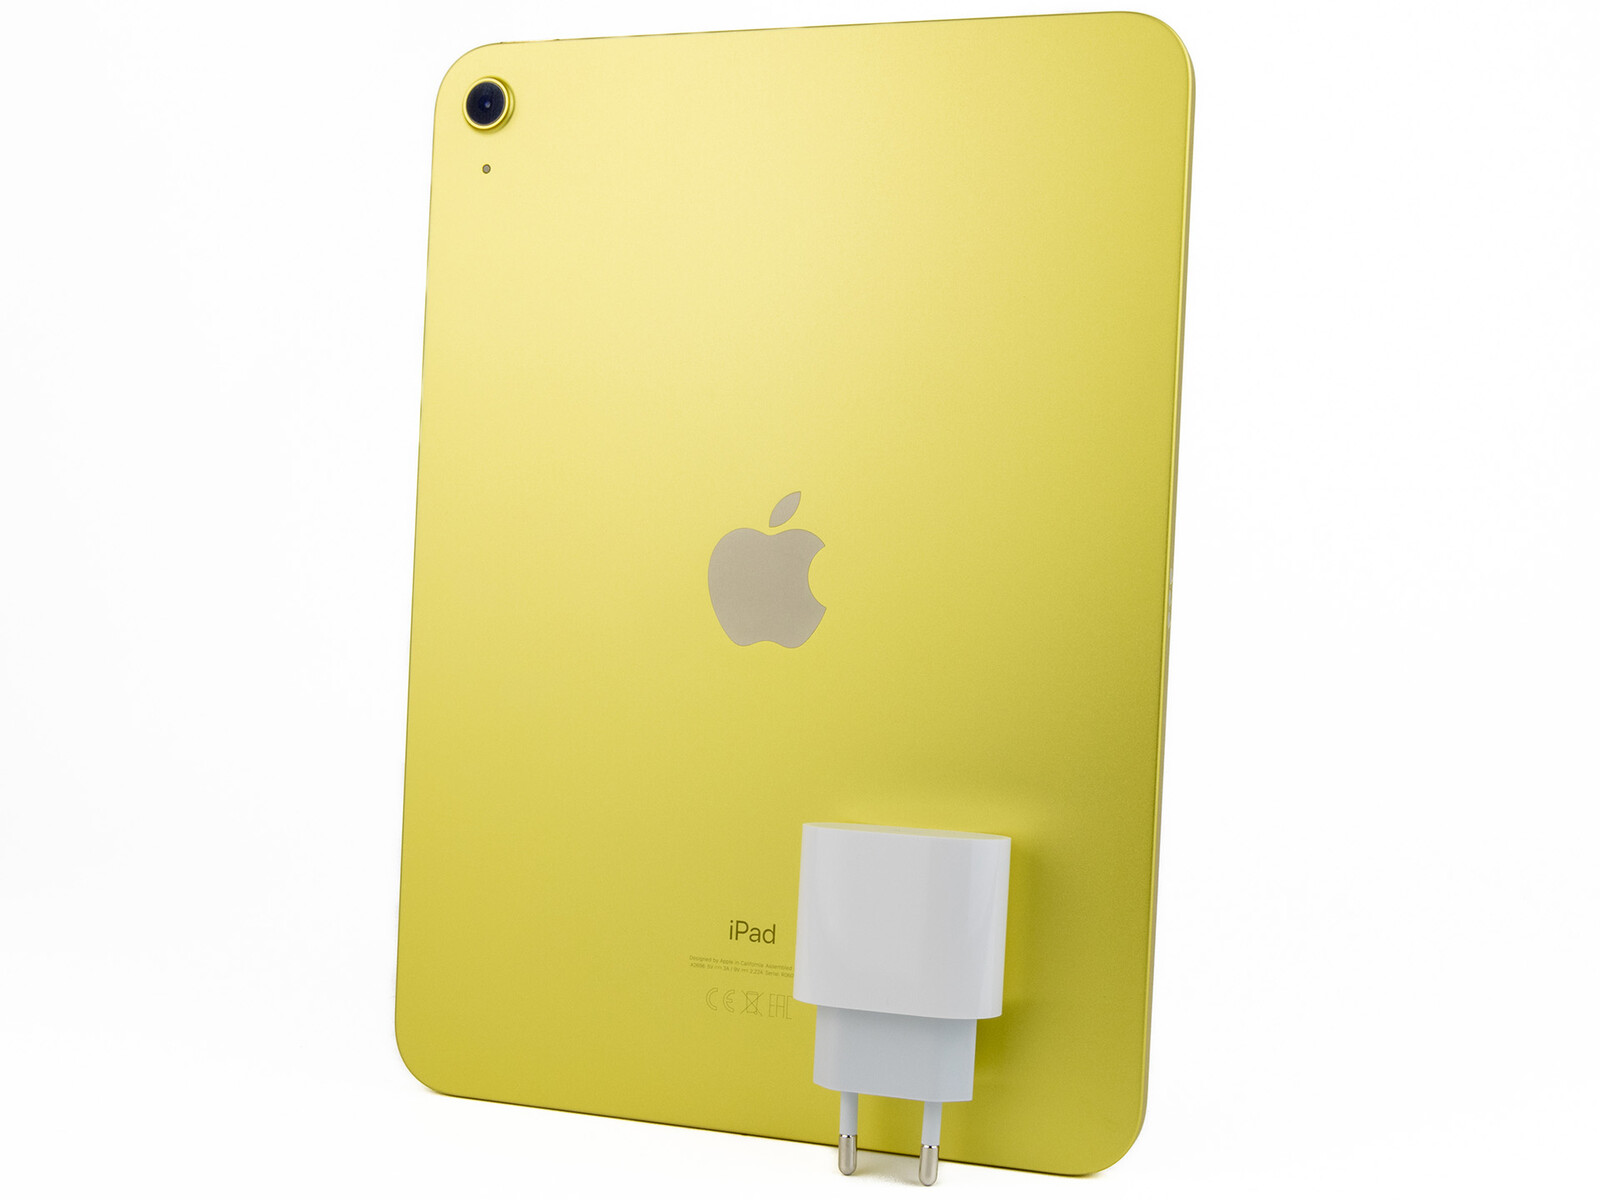
外壳 - 有多种颜色的回收铝
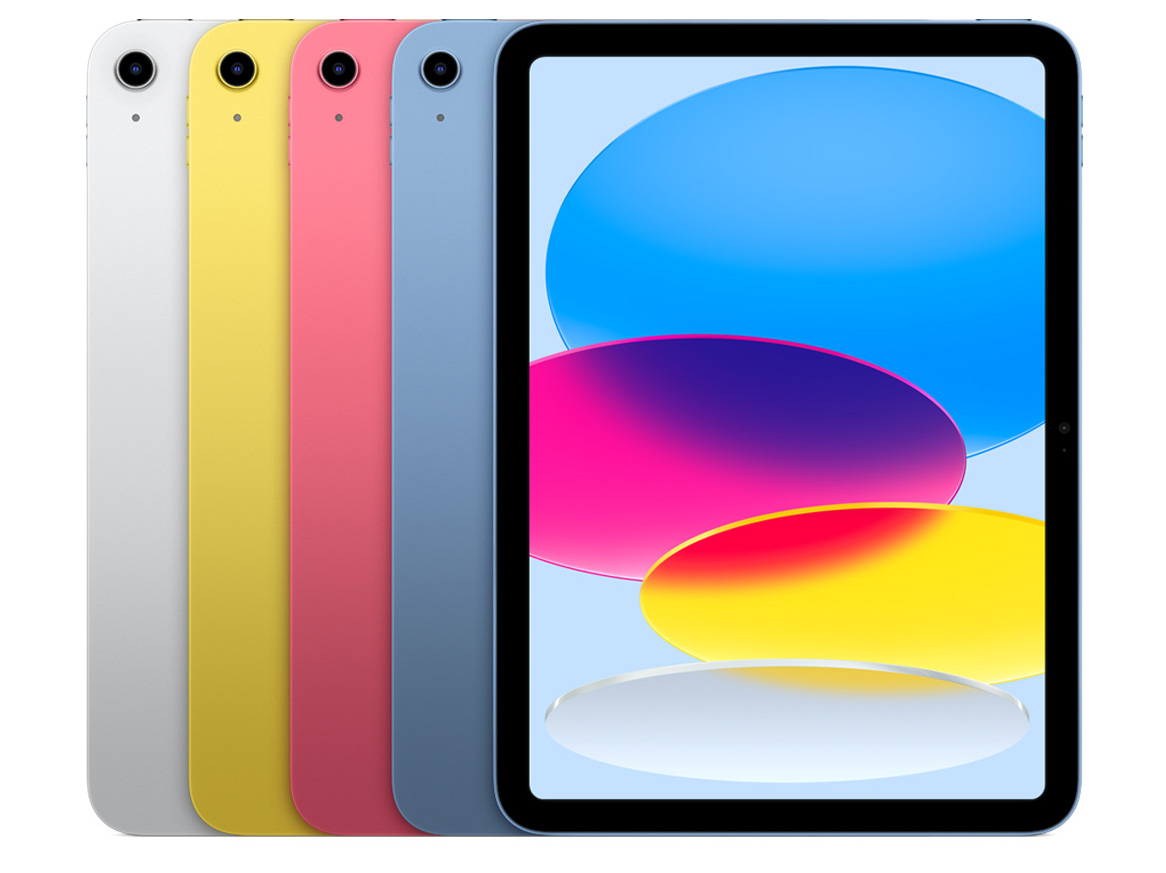
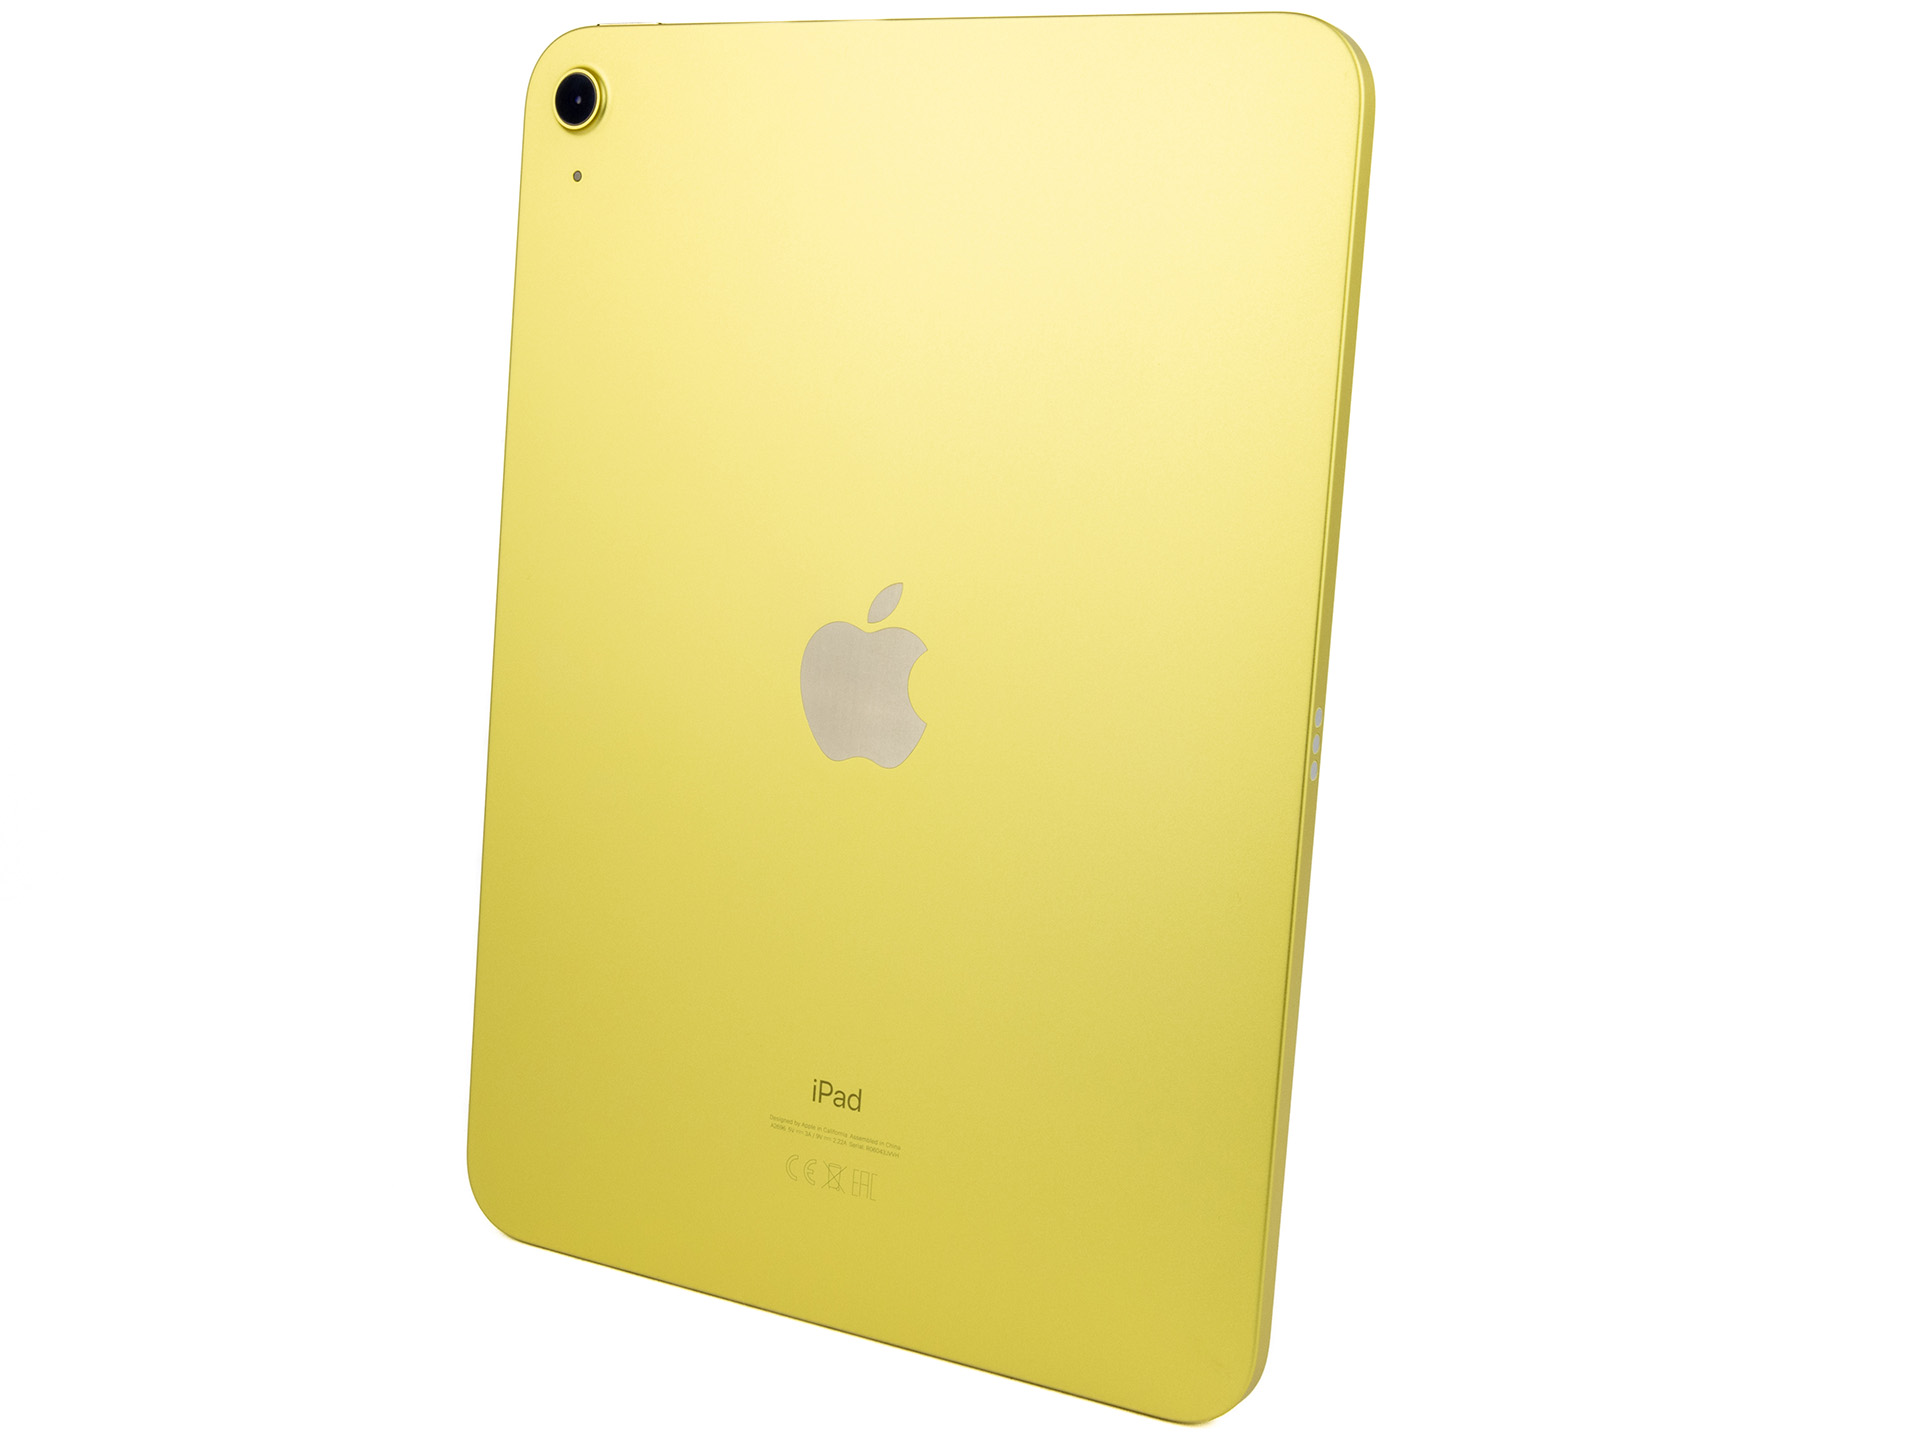
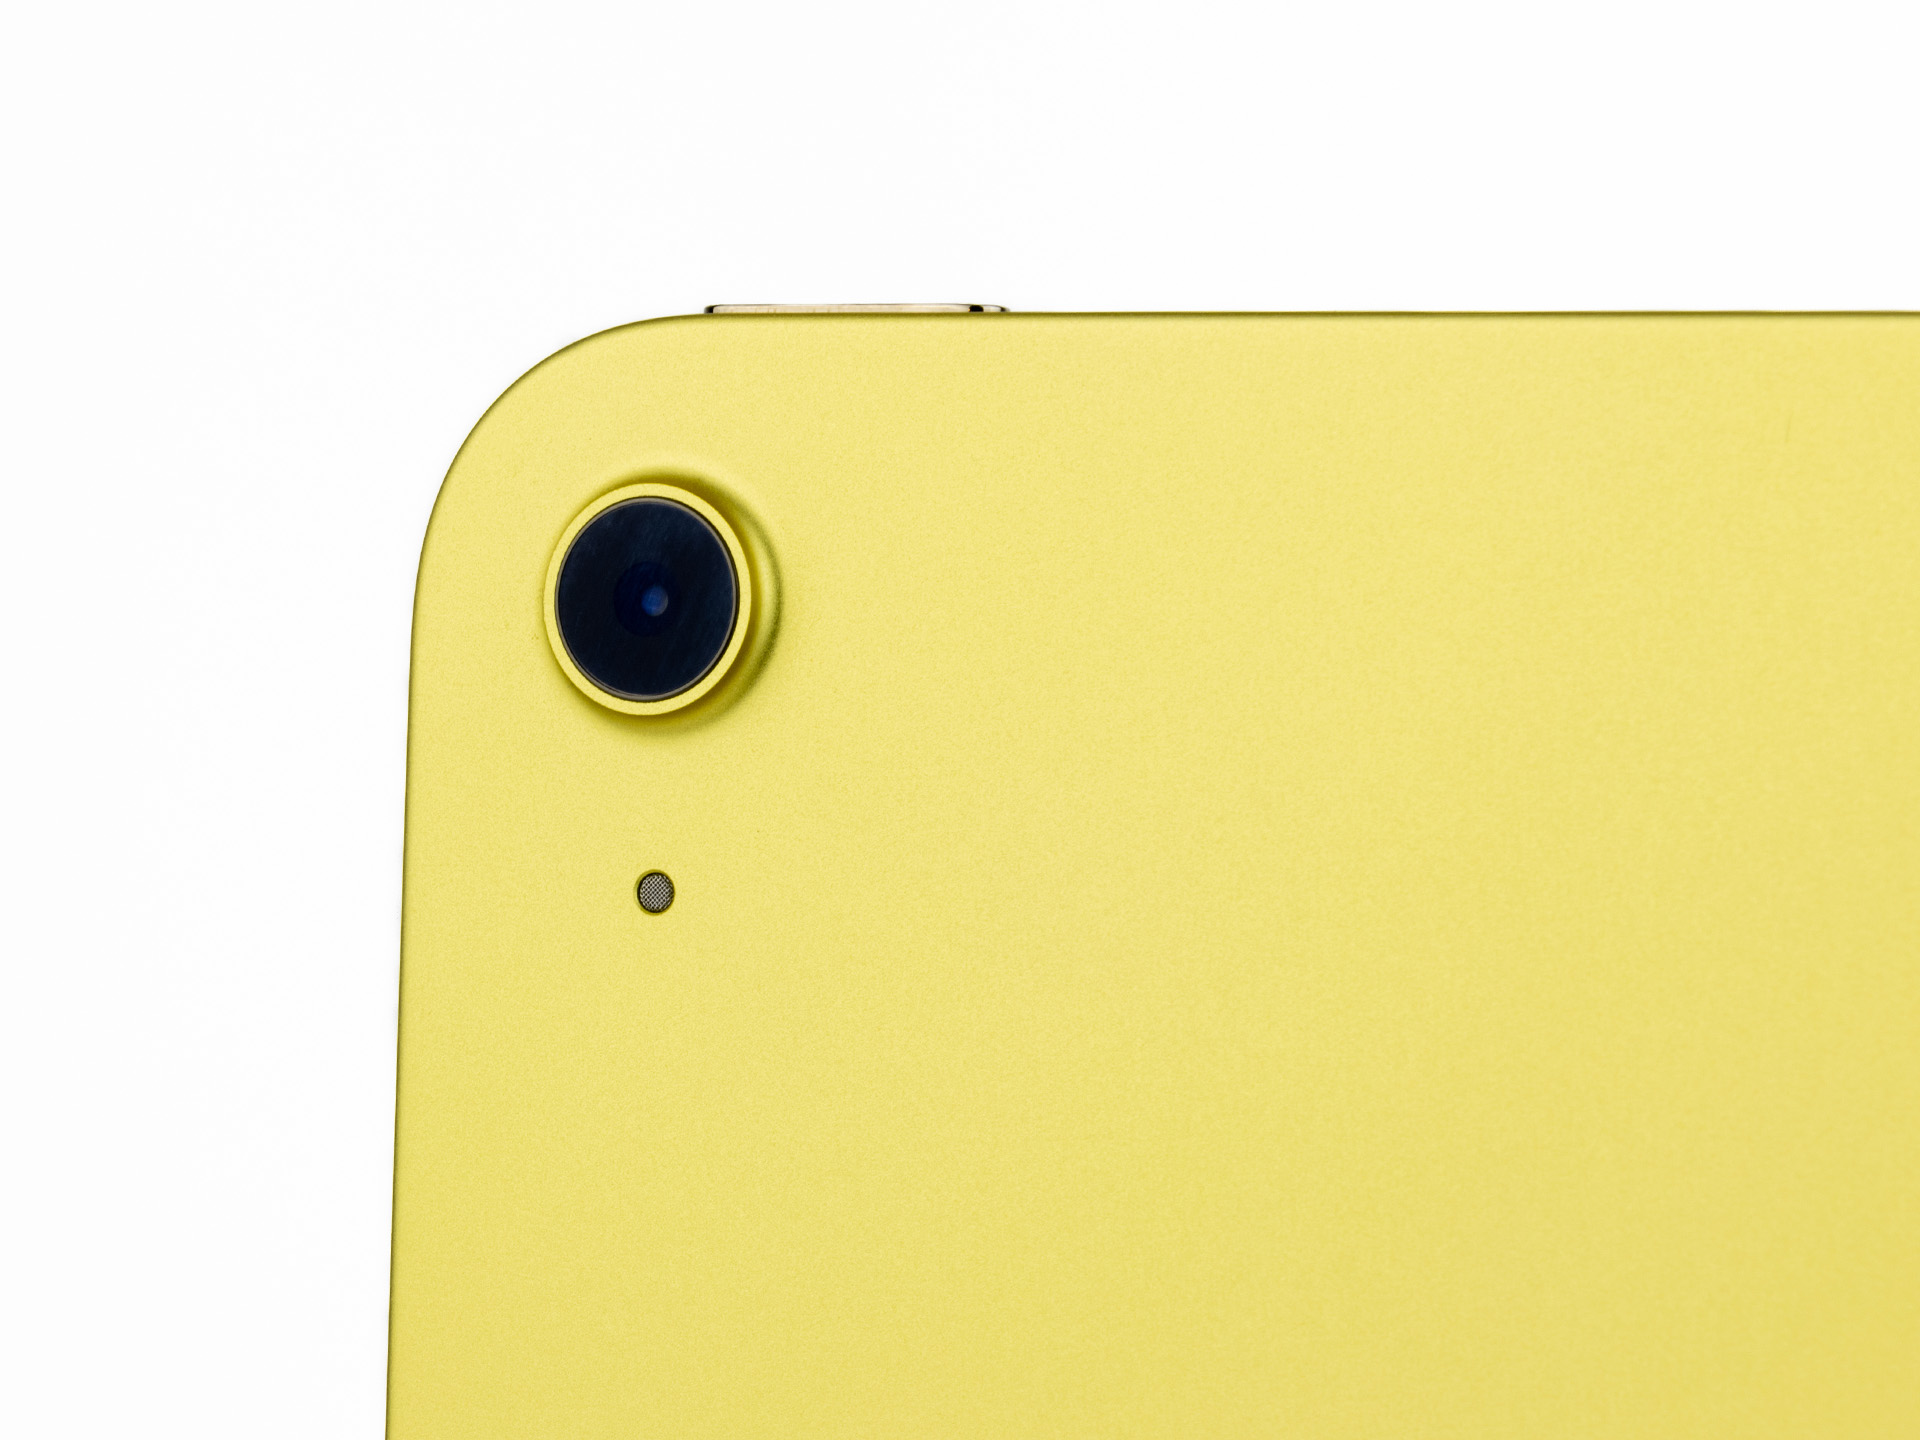
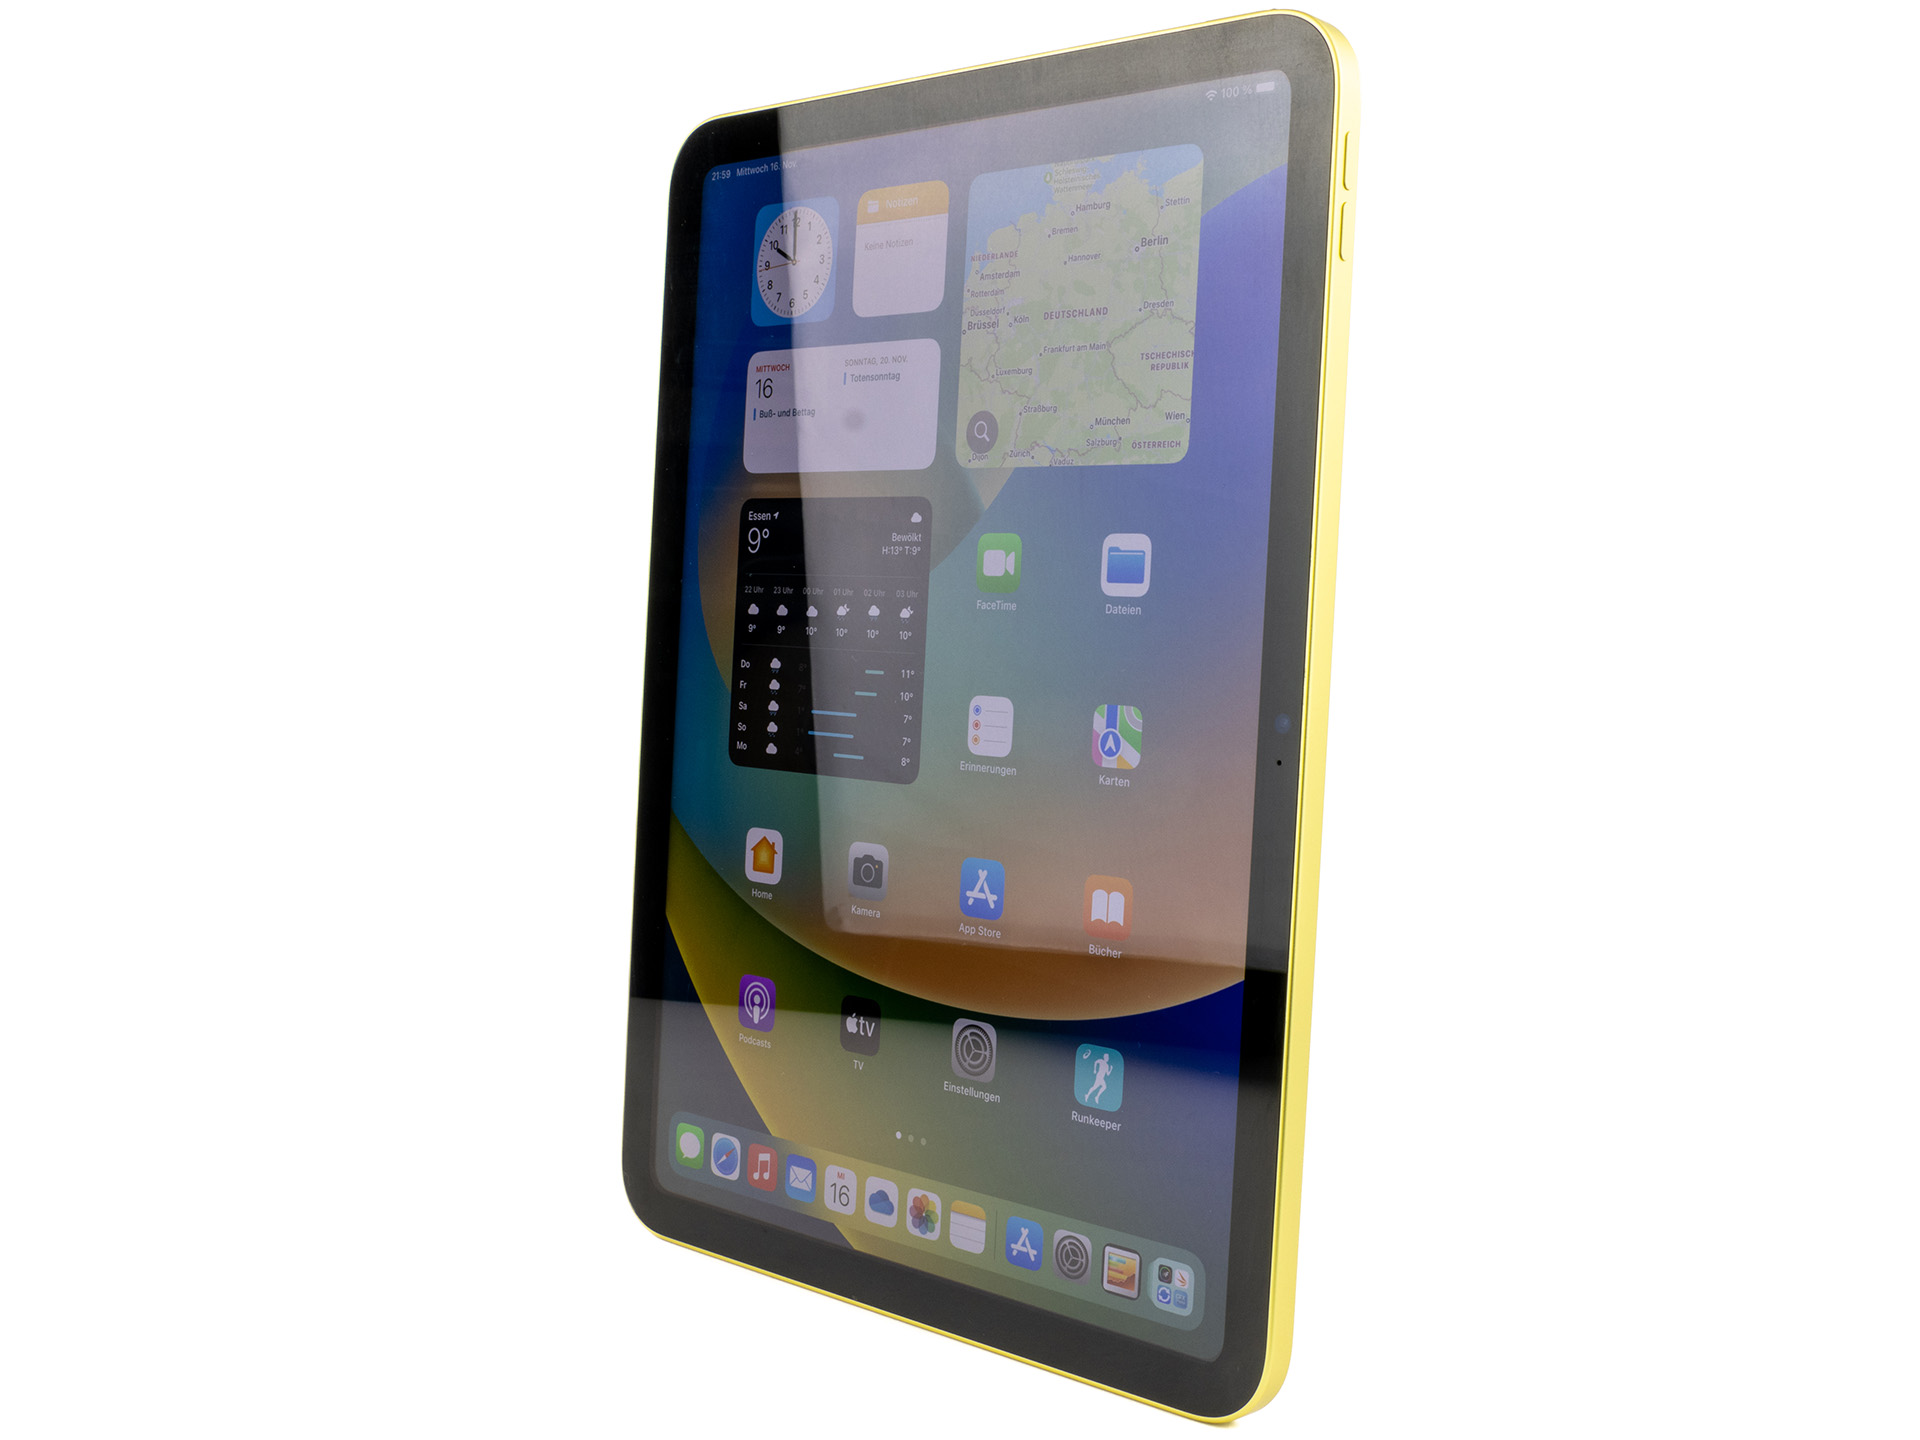
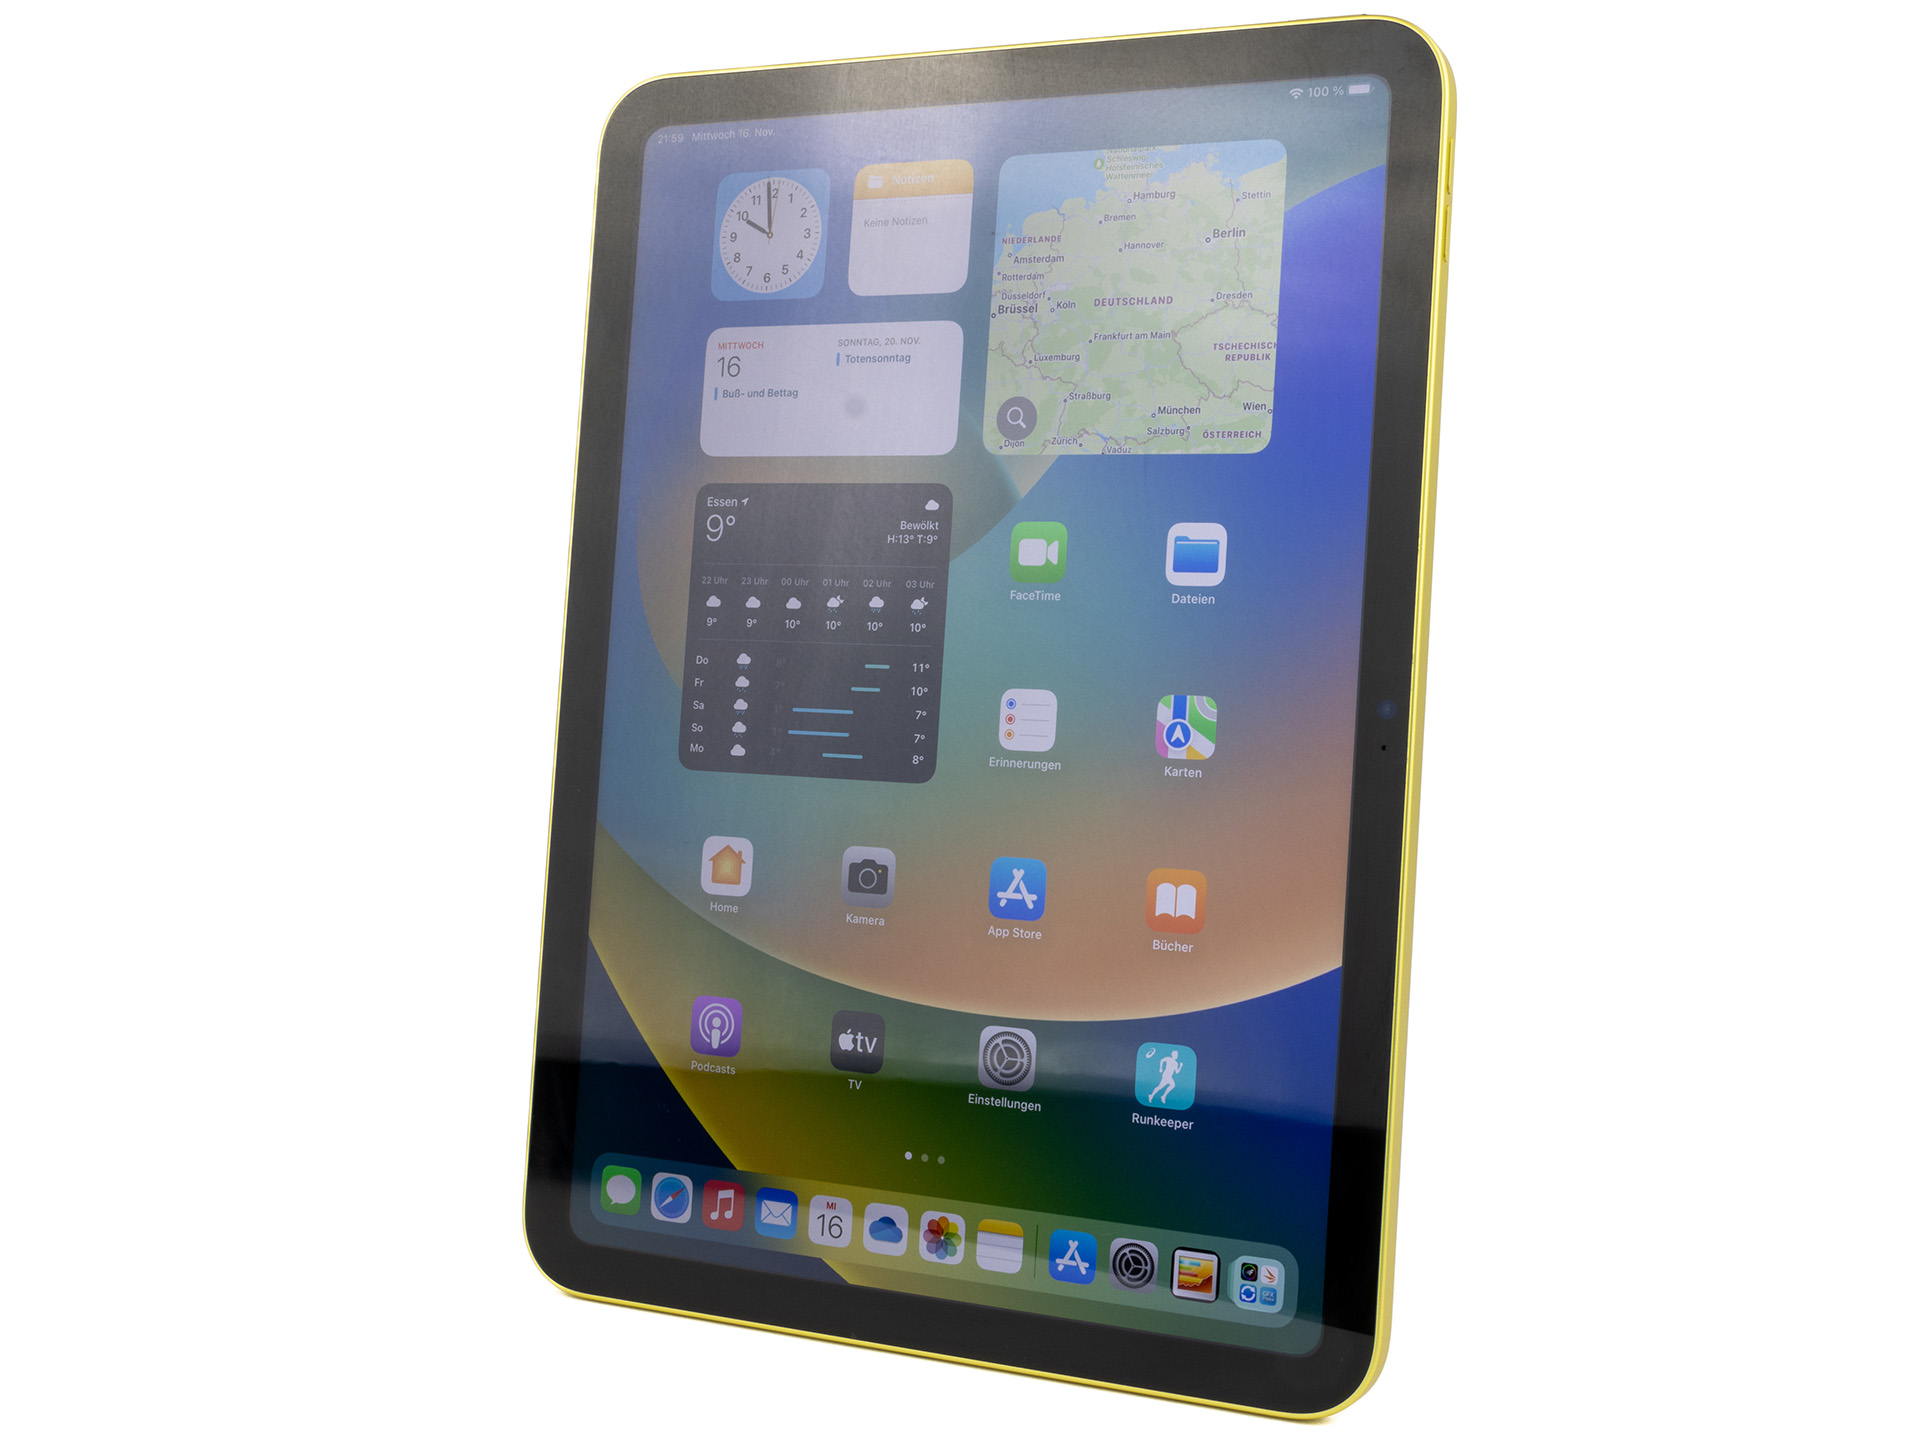
Apple iPad 10继承了iPad Air的外壳设计。 iPad Air,后者于2020年首次推出。iPad 10有银色、蓝色、玫瑰色和黄色四种颜色。摄像头从铝制一体式机身中略微伸出,所以当你把它放在一个平面上时,平板电脑会摇晃。
做工质量很好。由于一体成型的设计,几乎没有任何缝隙,材料的过渡也很紧密和均匀。铝制表面容易出现指纹,但握起来非常舒适。与目前的 iPad Air,iPad 10在所有尺寸上都略大,尽管拥有相同大小的面板。
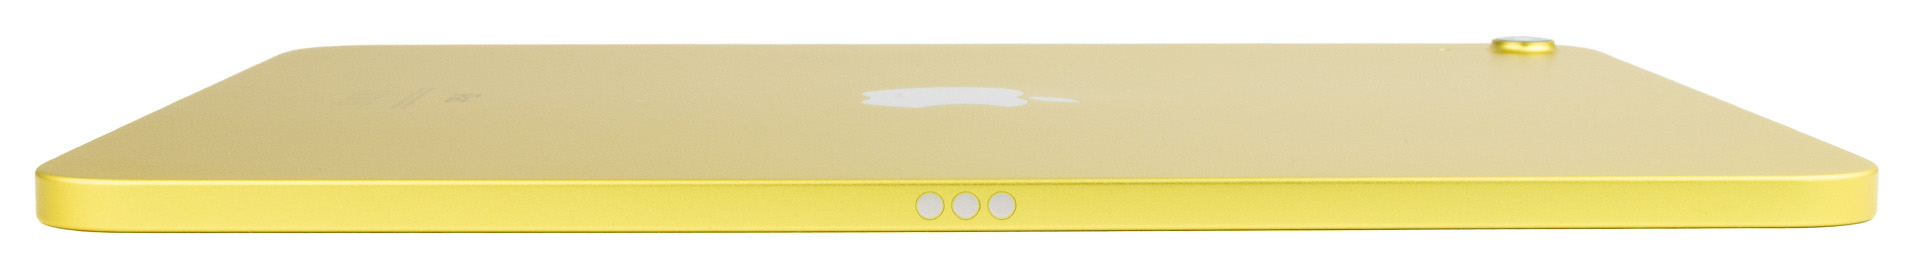
这款平板电脑的电池是内置的,不能由用户自己更换。没有认证的防尘或防水保护。相比之下 iPad 9相比,效率得到了提高,包装中的塑料量进一步减少,并首次使用了回收的金和铜。在可持续发展方面,Apple ,在一份的详细报告中公布了所有的细节.


设备 - iPad 10首次采用USB-C接口
虽然iPad 9仍然包括一个Lightning ,但iPad 10现在提供USB-C。这是有道理的,考虑到欧盟规定USB-C为统一的连接标准(我们报道),但与iPad兼容的第一代Apple Pencil仍使用旧的连接方式。因此,那些想直接从平板电脑上给笔充电或仍然没有Lightning 电缆的人必须投资购买一个额外的适配器,价格为10欧元(约10美元)。通过另一个相应的适配器,该端口也可用于有线图像输出。
在存储设备方面,有64的版本和256GB的较大版本。那些需要更多存储空间的人必须使用云,或者可以通过USB端口连接外部数据存储。
可选的Magic Keyboard Folio可以通过智能连接器连接。触摸ID在电源按钮上。


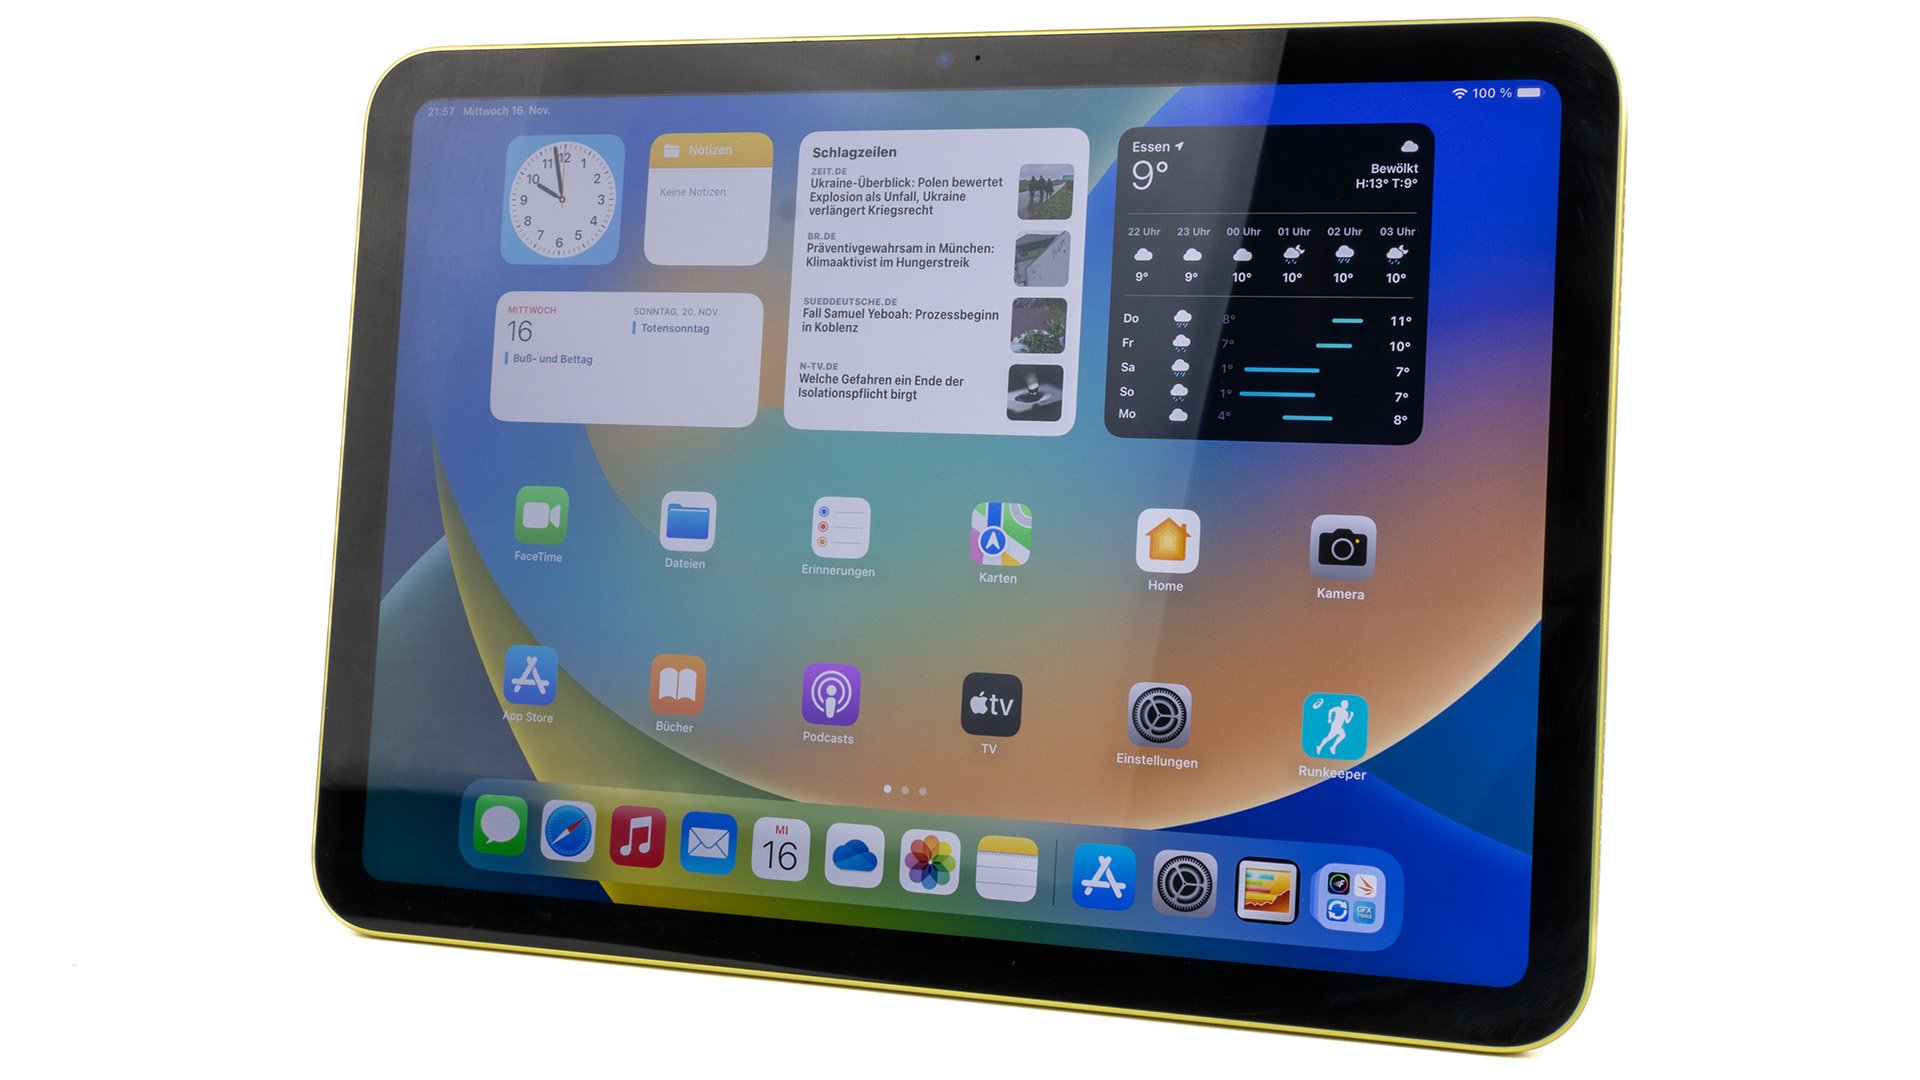
软件--iPadOS 16.1,有很长一段时间的更新。
Apple iPad 10交付时使用的是iPadOS 16.1,在我们的测试中已经获得了一个错误修复更新到16.1.1版本。但与专业机型相比,新的舞台管理器不能在这里使用。
除了它自己的服务和应用程序,Apple ,不在iPad上安装任何其他程序。通常情况下,你可以期待iPad的更新,从其推出之日开始,大约五年的时间。然而,Apple 对此没有正式宣布。
通信和GNSS--Wi-Fi 6和可选的5G,用于iPad 2022。
Apple iPad 10能够通过双频WLAN连接到2.4和5.0-GHz网络。结合我们的华硕ROG Rapture GT-AXE11000参考路由器,传输速度变得相当稳定,符合宣传的Wi-Fi 6标准。范围是非常好的。
作为选择,你也可以得到一个带有5G调制解调器的模型,可以配备Nano-SIM或eSIM。它支持广泛的频段选择以及GNSS。
| Networking | |
| iperf3 transmit AX12 | |
| Xiaomi Pad 5 Pro | |
| Apple iPad Air 5 2022 | |
| Samsung Galaxy Tab S7 FE 5G | |
| Apple iPad 2021 | |
| iperf3 receive AX12 | |
| Xiaomi Pad 5 Pro | |
| Apple iPad Air 5 2022 | |
| Samsung Galaxy Tab S7 FE 5G | |
| Apple iPad 2021 | |
| iperf3 receive AXE11000 | |
| Lenovo Tab P11 Pro Gen 2 | |
| Apple iPad Air 5 2022 | |
| Apple iPad 10 | |
| iperf3 transmit AXE11000 | |
| Apple iPad Air 5 2022 | |
| Lenovo Tab P11 Pro Gen 2 | |
| Apple iPad 10 | |
WLAN型号不支持通过GNSS定位。相反,Apple 平板电脑使用WLAN、数字罗盘和iBeacon微定位来确定自己的位置。然而,这对于导航任务或记录路线来说是不够的。
摄像机 - 家庭办公室的良好标准

Apple iPad(2022)的前置摄像头使用了一个1200万像素的超广角镜头,支持视频会议的跟随模式。有了它,摄像头会自动调整图像角度,使一个或多个人保持在图像的中心。在光线充足的情况下,录制的效果相当好。你可以以每秒60帧的全高清分辨率录制视频。
背面的主摄像头也提供1200万像素的分辨率,但它可以使用智能HDR 3和带聚焦像素的自动对焦。在日常摄影中,记录提供了一个良好的色彩再现,具有体面的图像捕捉能力,但特别是在深度方面,它们相当早地显示出一些轻微的噪音。虽然这绝对不是一个顶级的性能,但对于记录的目的来说,它完全足够。
主摄像头能够以高达60 FPS的速度录制超高清视频。
Image comparison
Choose a scene and navigate within the first image. One click changes the position on touchscreens. One click on the zoomed-in image opens the original in a new window. The first image shows the scaled photograph of the test device.
HauptkameraHauptkamera5-fach ZoomLow-Light


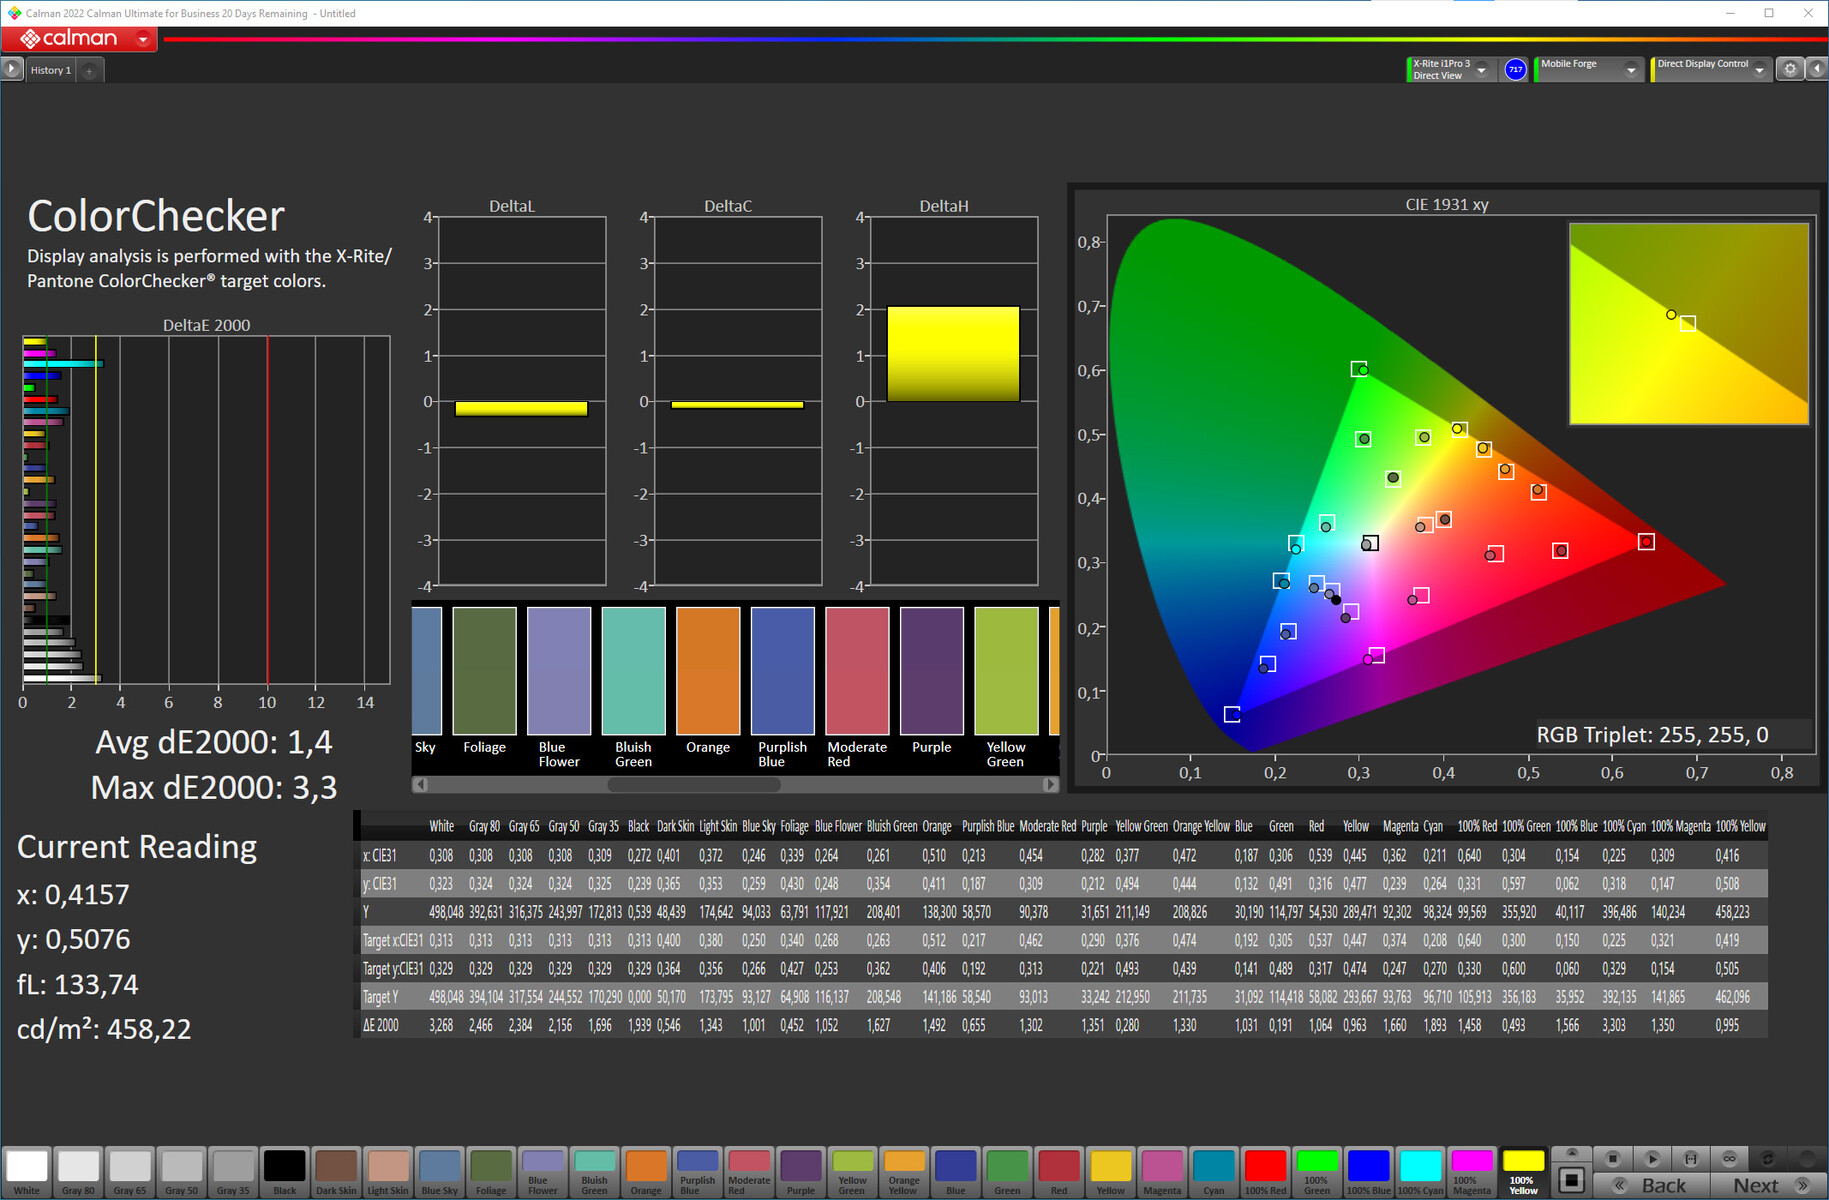
在受控的光线条件下,我们日常摄影的经验得到了证实。ColorChecker图表的记录性能相对自然,只显示出一些轻微的DeltaE偏差,没有任何粗略的颜色反转。只有深绿色的亮度略微过高。
测试图显示了中心的良好细节,一直延伸到边缘区域,尽管它在对比度方面有轻微的损失,但还是很纠结。


配件和保修 - 有了键盘,它就变得非常昂贵了
第10代Apple iPad的包装盒包括一条USB-C电缆和一个20瓦的模块化充电器。
制造商的保修期只有12个月,但任何销售商的保修期都不会受此影响。作为选择,你还可以为iPad购买Apple Care+,有效期为两年,费用为79欧元(约82美元),或每月约4欧元(约4美元)。除了专家支持外,在这期间你可以得到无限量的维修,只要损坏是无意的。然而,每次维修你还必须支付通用服务费,如果是iPad,49欧元(约51美元),如果是笔或键盘,29欧元(约30美元)。
此外,你还可以选择购买Apple Pencil(第1代,119欧元,约合人民币124元)、相应颜色的Smart Folios(99欧元,每个约合人民币103元)或Magic Keyboard Folio(299欧元,约合人民币312元)。决定使用铅笔的人还必须购买相应的USB适配器,以便能够将笔与Apple 。
输入设备和操作 - 带有Touch ID的iPad 10
Apple iPad 2022的电容式触摸屏对输入的反应迅速而可靠。正如在 iPad 9,面板和前面的玻璃之间有一点距离。因此,那些希望得到完全贴合的显示屏的人将会感到失望。然而,这并不影响操作,只有那些使用铅笔的人将不得不习惯铅笔在显示屏内容上方轻微徘徊的感觉。
来自Apple 的键盘布局被安装为屏幕键盘,但你也可以用App Store中的任何其他键盘来代替它。另外,你还可以购买一个外部键盘。不幸的是,直到现在我们还没能测试这个。
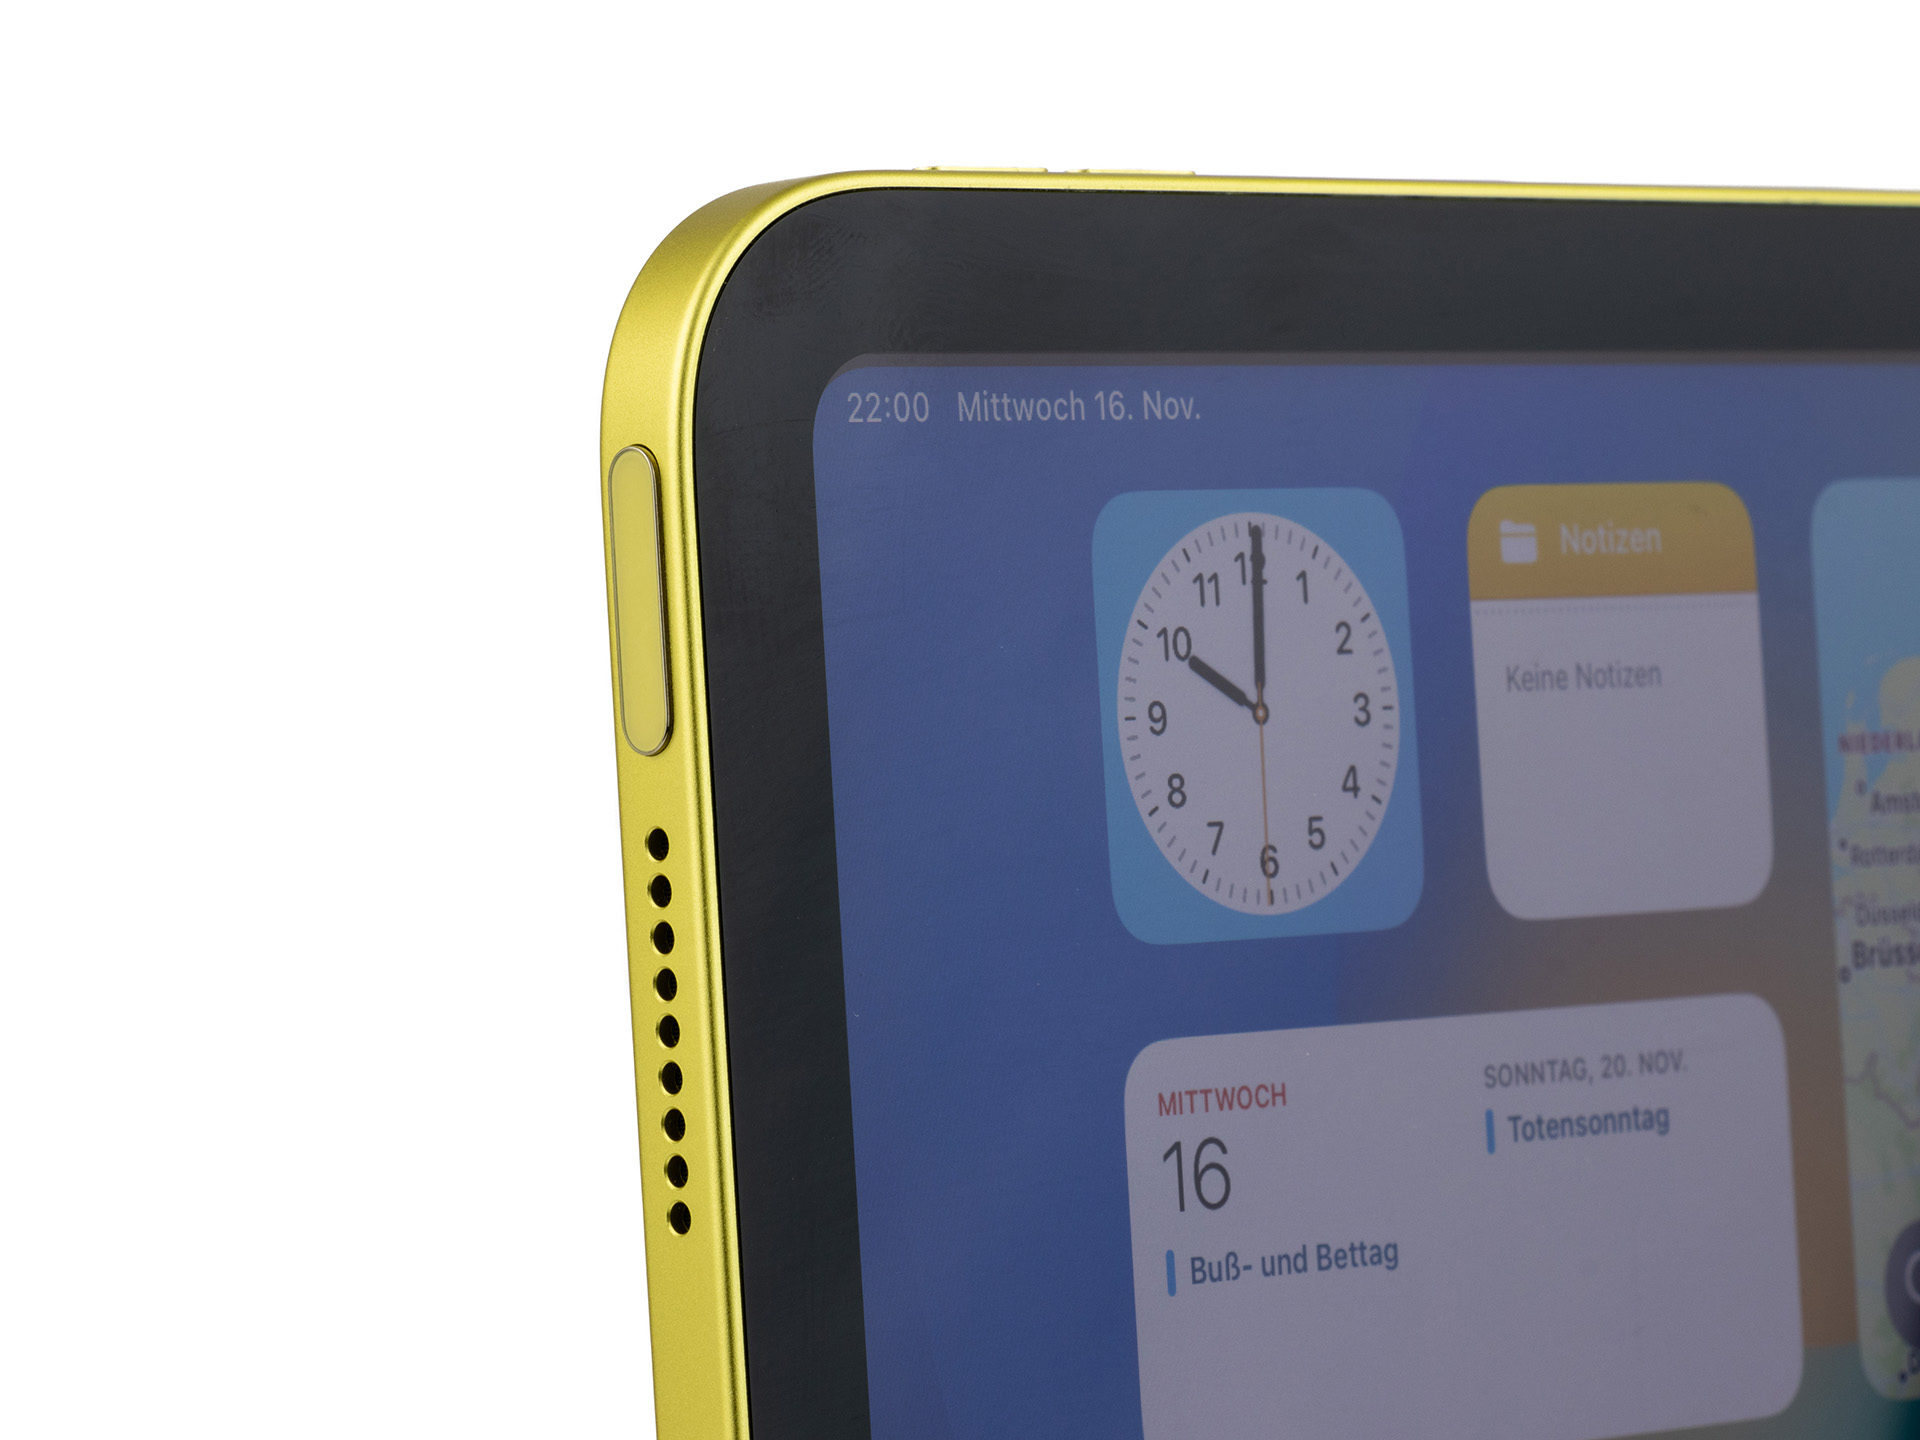
电源键中的指纹扫描仪(Touch ID)提供生物识别安全。尽管它能非常可靠地识别存储的指纹,但它并不属于同类产品中最快的。
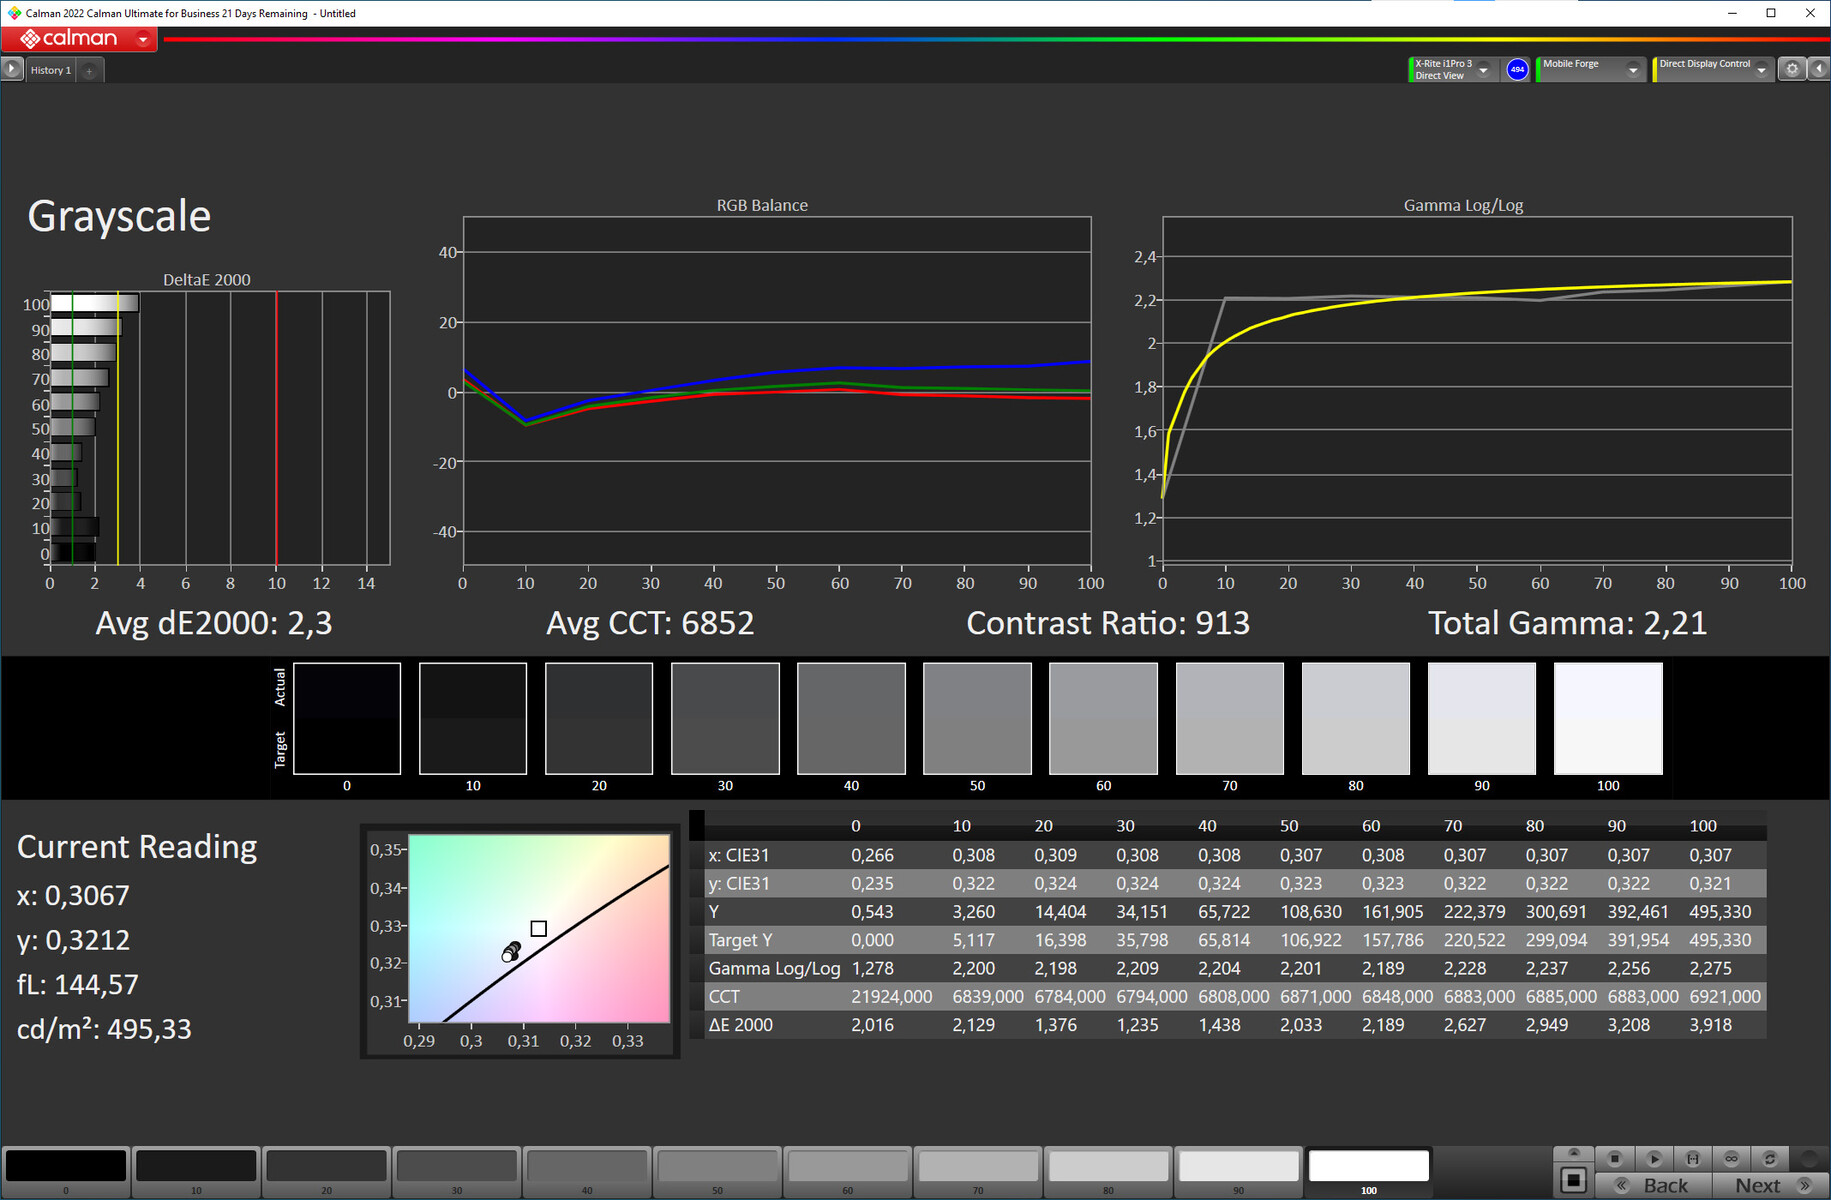
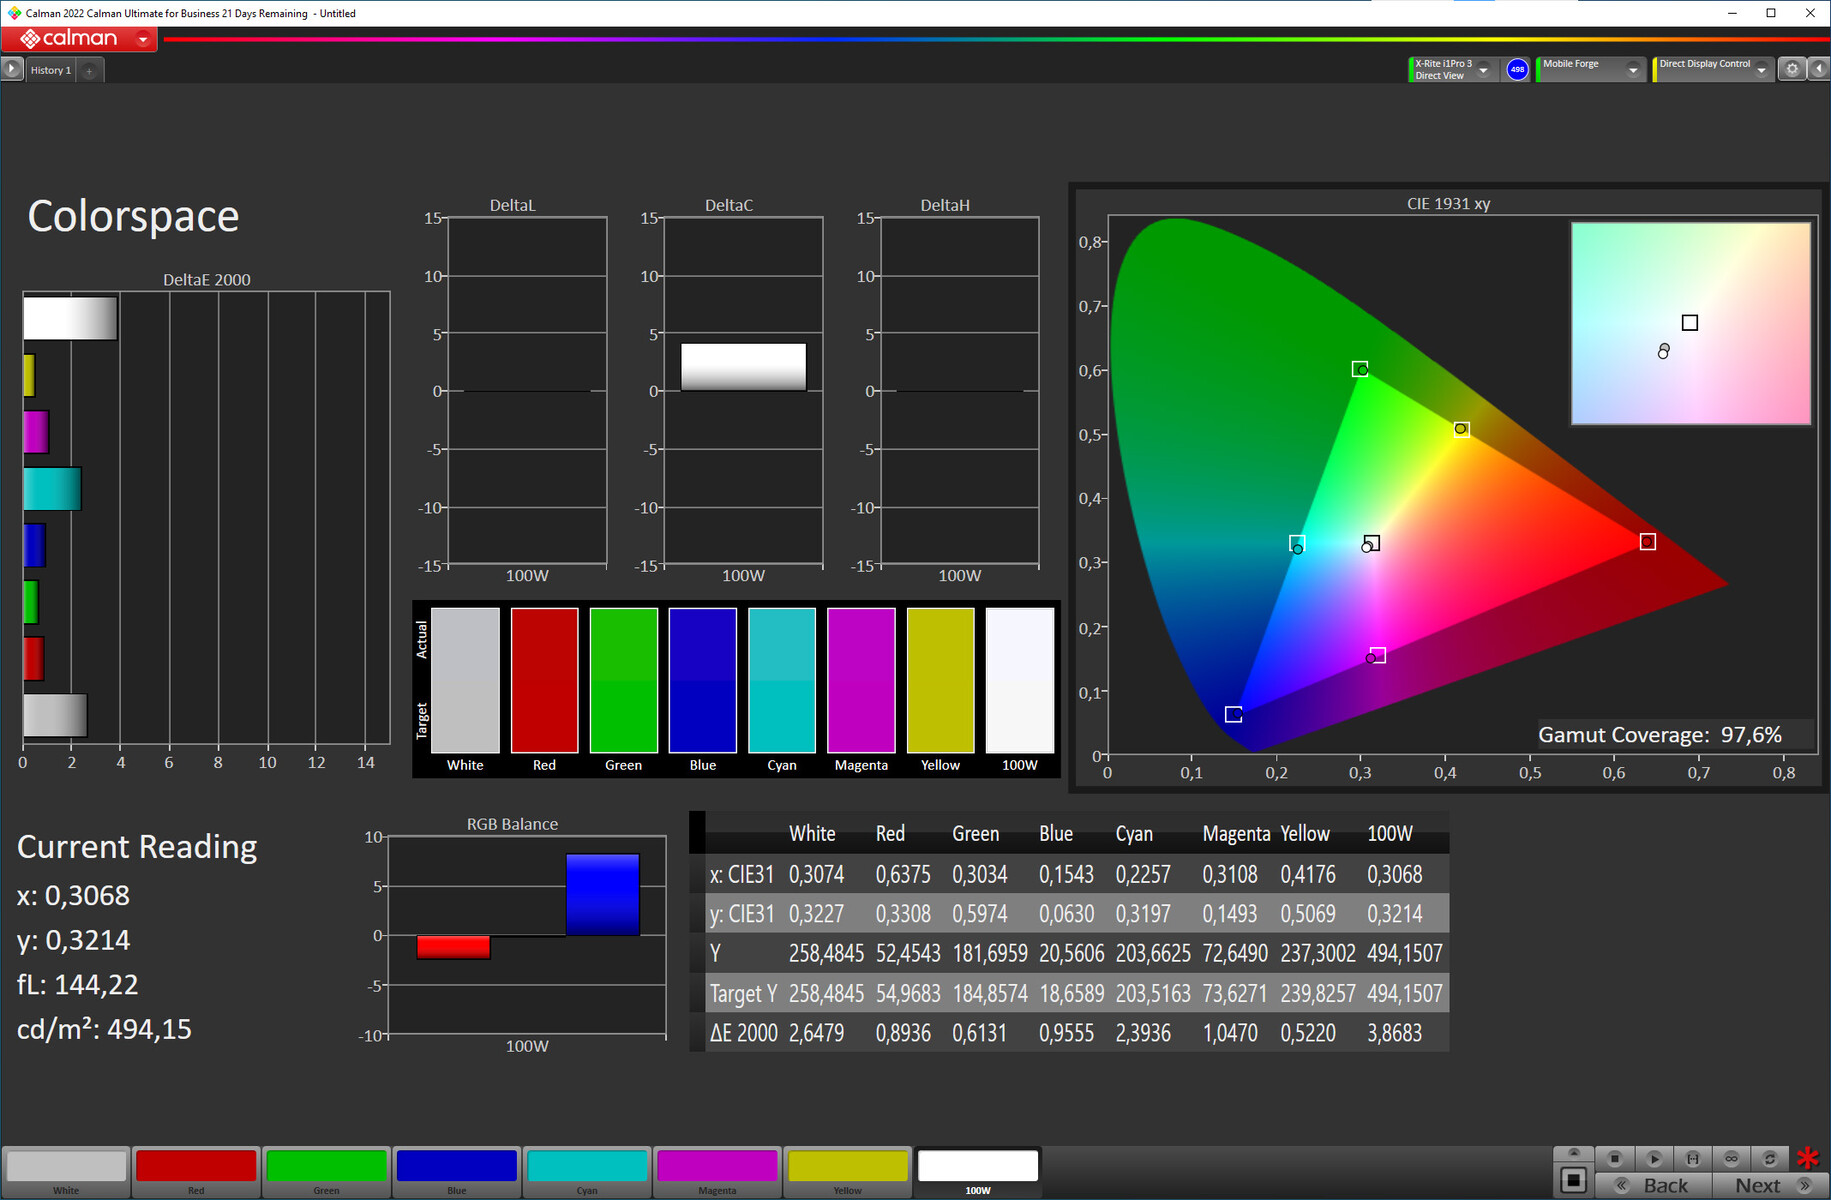
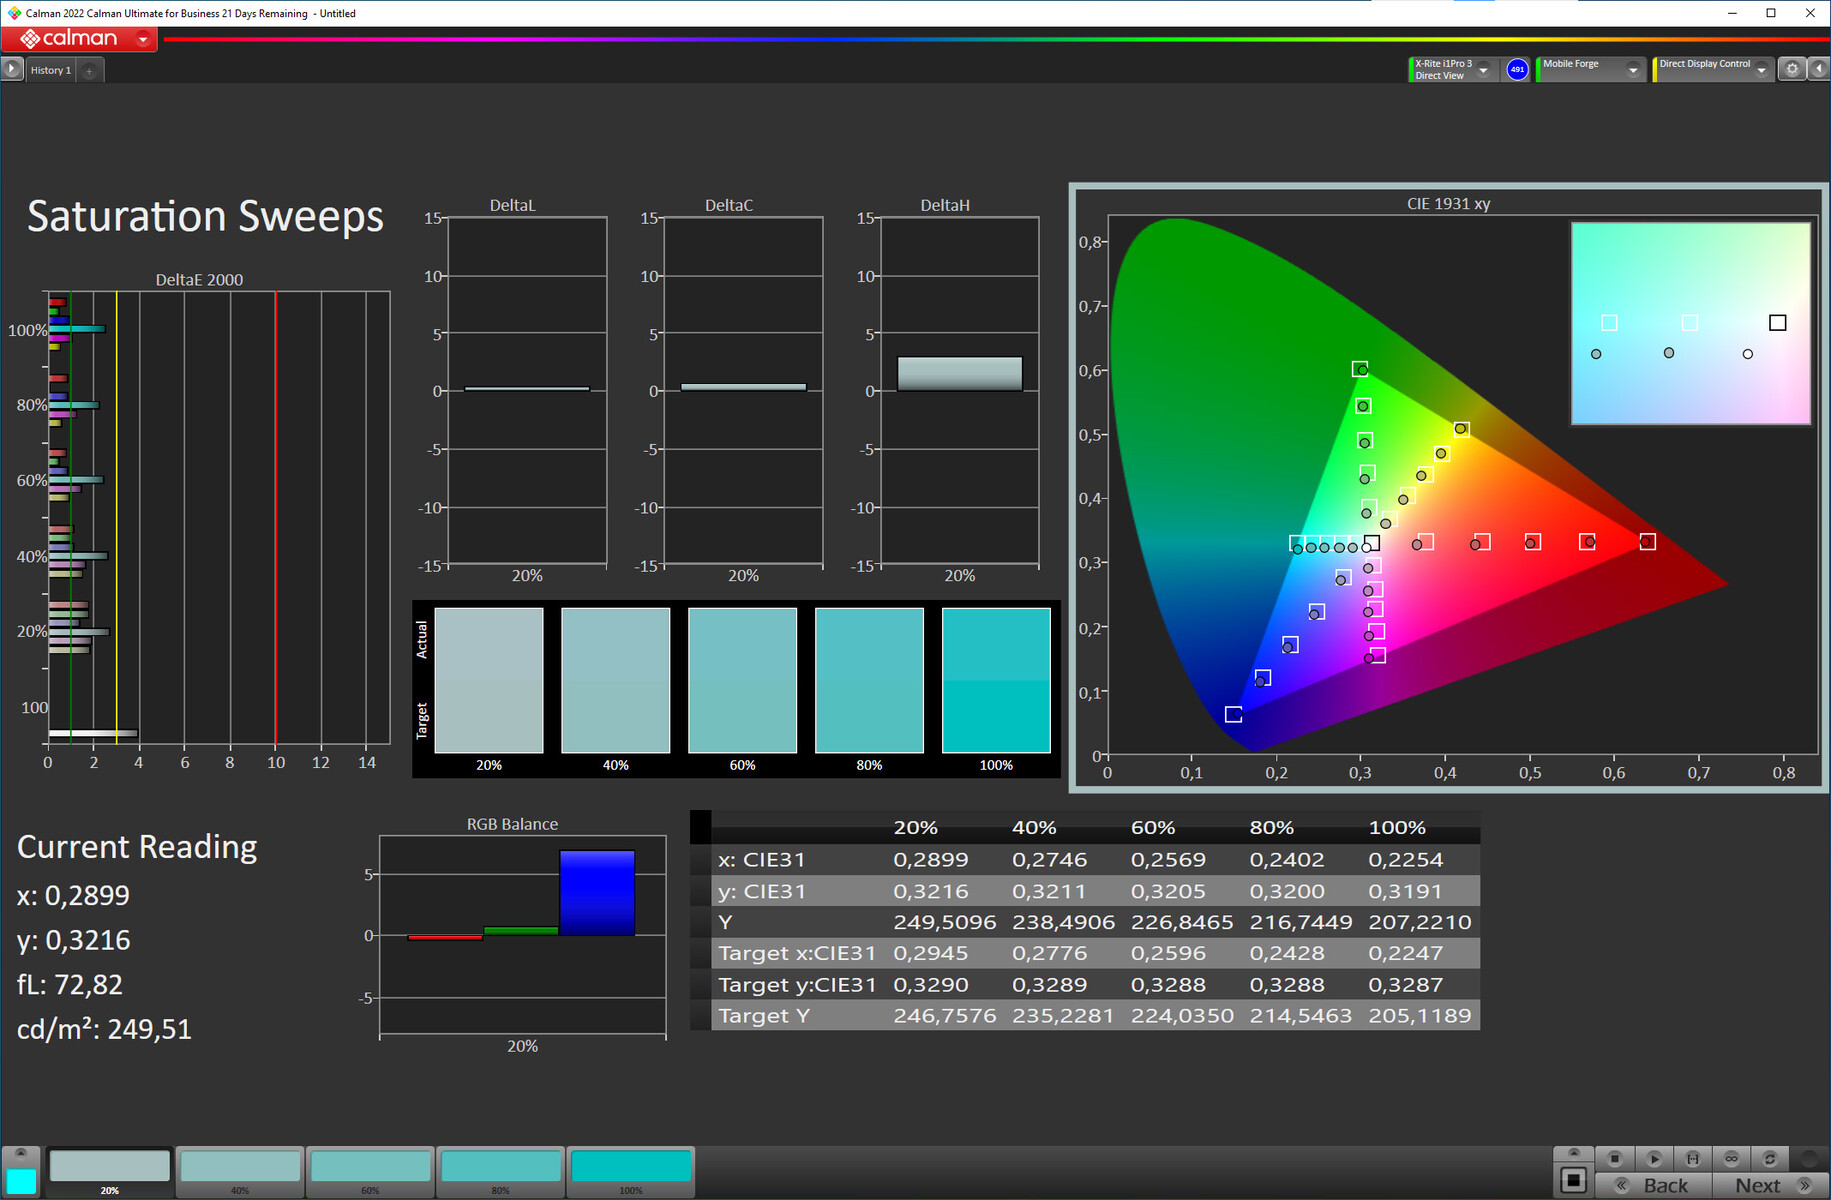
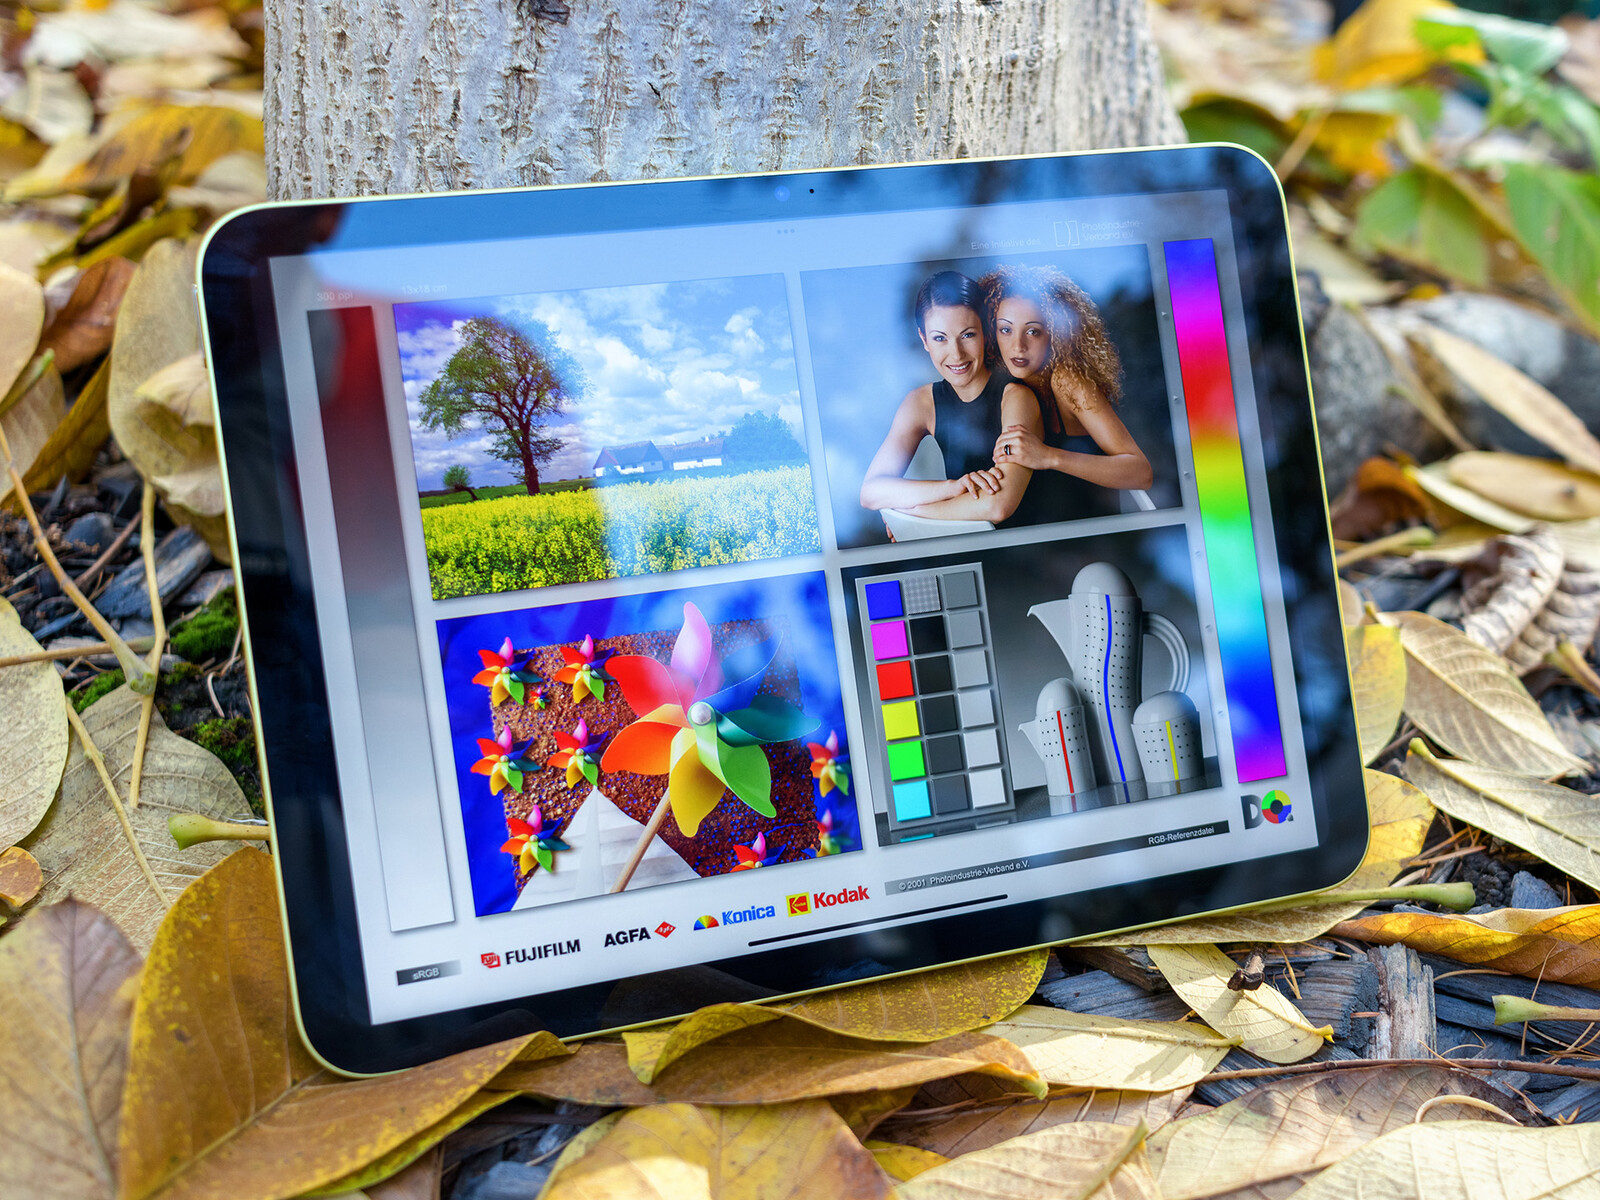
显示屏 - iPad 10.9采用60赫兹的IPS面板
Apple iPad的IPS显示屏的尺寸已经增加到10.9英寸(27.7厘米)的对角线,提供2360 x 1640像素。虽然从名义上看,这对应的是在 iPad Air但它并没有完全贴合,没有覆盖DCI-P3色彩空间,也没有提供抗反射层。
LCD的亮度应该达到500尼特。然而,在我们的测量中,iPad 10并没有完全达到这个数值。在全白显示和激活亮度传感器的情况下,该平板电脑平均达到468cd/m²。在光区和暗区均匀分布的情况下(APL18),亮度只变的最低,达到474 cd/m²。那些喜欢手动调节亮度的人甚至会得到更多,因为这样可以达到492 cd/m²。
黑色数值稍有提高,但仍足以实现良好的对比度。我们没有注意到任何脉冲宽度调制(PWM)。正如通过显微镜进行的慢动作观察所示,也没有使用时间抖动。
| |||||||||||||||||||||||||
Brightness Distribution: 92 %
Center on Battery: 467 cd/m²
Contrast: 953:1 (Black: 0.49 cd/m²)
ΔE ColorChecker Calman: 1.4 | ∀{0.5-29.43 Ø4.71}
ΔE Greyscale Calman: 2.3 | ∀{0.09-98 Ø4.96}
97.6% sRGB (Calman 2D)
Gamma: 2.21
CCT: 6852 K
| Apple iPad 10 IPS, 2360x1640, 10.9" | Apple iPad Air 5 2022 IPS, 2360x1640, 10.9" | Apple iPad 2021 IPS, 2160x1620, 10.2" | Samsung Galaxy Tab S7 FE 5G LCD IPS, 2560x1600, 12.4" | Xiaomi Pad 5 Pro IPS, 2560x1600, 11" | Lenovo Tab P11 Pro Gen 2 OLED, 2560x1536, 11.2" | |
|---|---|---|---|---|---|---|
| Screen | 16% | -3% | 6% | 6% | 1% | |
| Brightness middle (cd/m²) | 467 | 529 13% | 507 9% | 619 33% | 497 6% | 631 35% |
| Brightness (cd/m²) | 468 | 490 5% | 491 5% | 593 27% | 475 1% | 633 35% |
| Brightness Distribution (%) | 92 | 86 -7% | 90 -2% | 91 -1% | 89 -3% | 91 -1% |
| Black Level * (cd/m²) | 0.49 | 0.37 24% | 0.5 -2% | 0.22 55% | 0.42 14% | |
| Contrast (:1) | 953 | 1430 50% | 1014 6% | 2814 195% | 1183 24% | |
| Colorchecker dE 2000 * | 1.4 | 1.35 4% | 1.7 -21% | 2.6 -86% | 1.4 -0% | 1.7 -21% |
| Colorchecker dE 2000 max. * | 3.3 | 2.45 26% | 3.9 -18% | 6.6 -100% | 3 9% | 4.2 -27% |
| Greyscale dE 2000 * | 2.3 | 2.1 9% | 2.4 -4% | 4 -74% | 2.3 -0% | 2.6 -13% |
| Gamma | 2.21 100% | 2.183 101% | 2.25 98% | 2.17 101% | 2.25 98% | 2.23 99% |
| CCT | 6852 95% | 6939 94% | 6923 94% | 6973 93% | 6744 96% | 6496 100% |
* ... smaller is better
Screen Flickering / PWM (Pulse-Width Modulation)
| Screen flickering / PWM not detected | 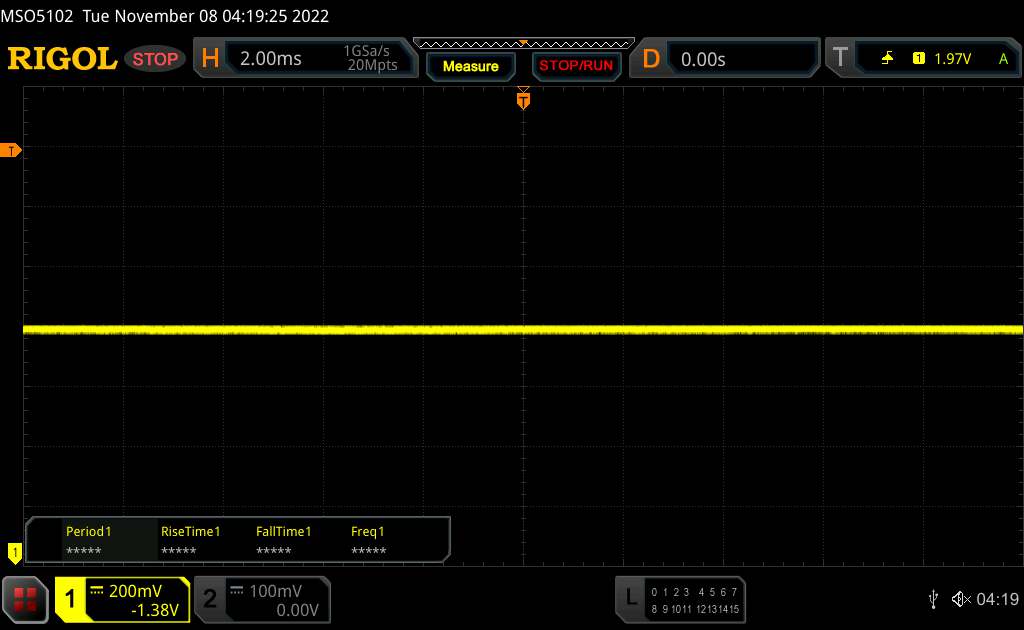 | ||
In comparison: 52 % of all tested devices do not use PWM to dim the display. If PWM was detected, an average of 7754 (minimum: 5 - maximum: 343500) Hz was measured. | |||
用照片光谱仪和CalMAN软件进行的色彩分析证明,Apple iPad 10.9具有良好的显示性能。我们在停用True Tone功能的情况下取得了最自然的结果,但即使如此,我们仍然注意到在明亮的灰色调中出现了略微偏暖的白平衡。几乎所有的颜色偏差仅凭人眼是看不出来的。唯一的例外是青色,但即使是青色也没有任何失真,在日常操作中也无法察觉。
Display Response Times
| ↔ Response Time Black to White | ||
|---|---|---|
| 22.31 ms ... rise ↗ and fall ↘ combined | ↗ 10.08 ms rise | 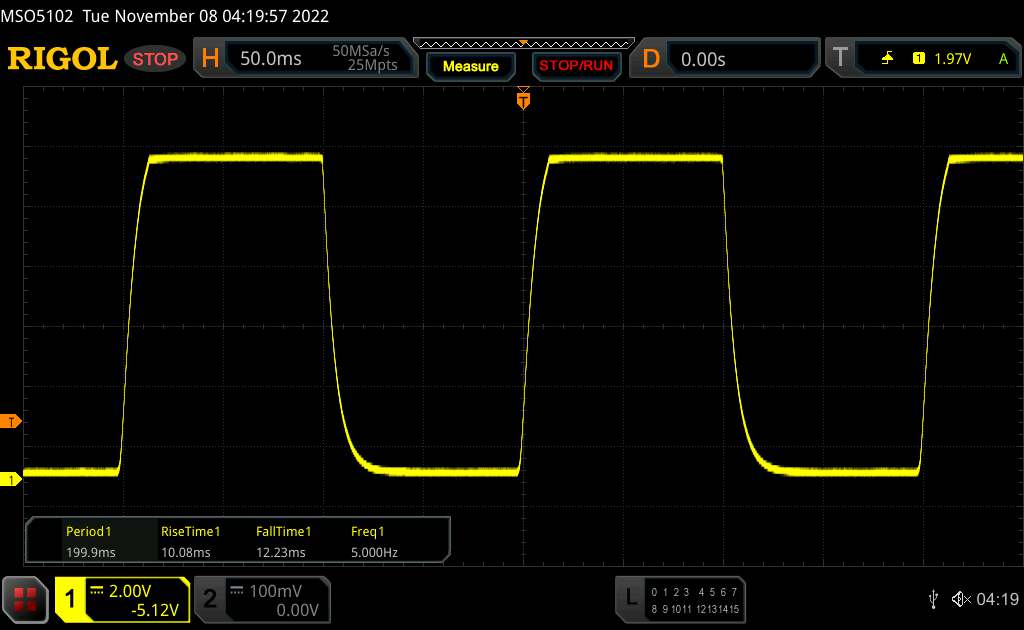 |
| ↘ 12.23 ms fall | ||
| The screen shows good response rates in our tests, but may be too slow for competitive gamers. In comparison, all tested devices range from 0.1 (minimum) to 240 (maximum) ms. » 51 % of all devices are better. This means that the measured response time is worse than the average of all tested devices (19.8 ms). | ||
| ↔ Response Time 50% Grey to 80% Grey | ||
| 42.68 ms ... rise ↗ and fall ↘ combined | ↗ 21.08 ms rise | 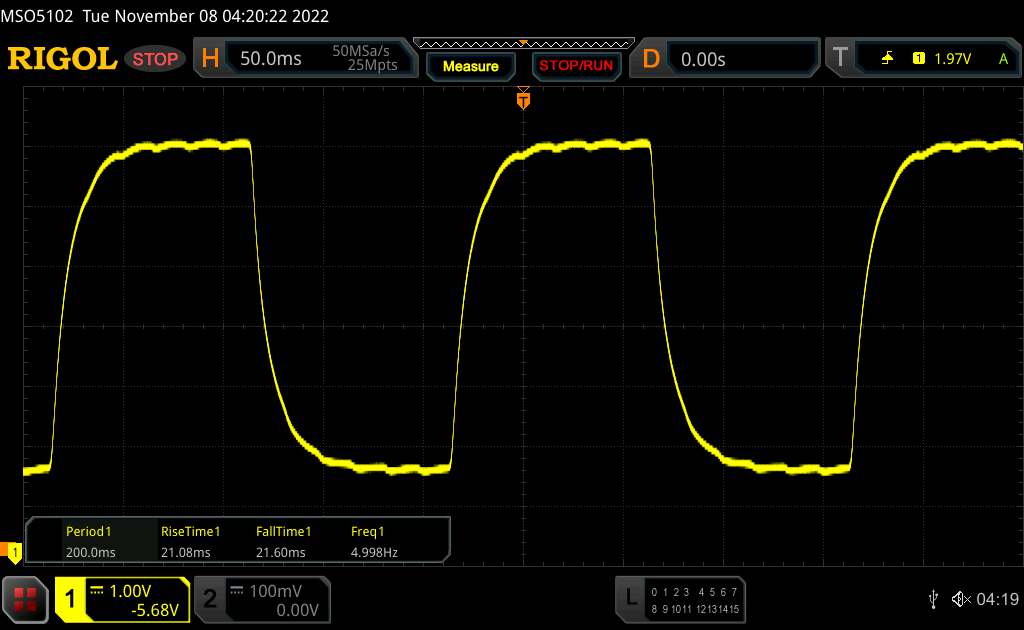 |
| ↘ 21.6 ms fall | ||
| The screen shows slow response rates in our tests and will be unsatisfactory for gamers. In comparison, all tested devices range from 0.165 (minimum) to 636 (maximum) ms. » 70 % of all devices are better. This means that the measured response time is worse than the average of all tested devices (31 ms). | ||
在户外,Apple iPad给人以体面的印象。在阴天,通常可以轻松阅读内容。然而,一旦光线变亮,显示屏表面的反光和低亮度储备会使阅读显示屏更加困难。
Apple ,这款平板电脑的视角稳定性确实不错。尽管前面的玻璃和面板之间有一定距离,但我们没有注意到任何重影效应。在黑色区域也没有任何典型的IPS光晕。然而,从陡峭的视角来看,亮度略有下降。

性能 -Apple ,采用A14 SoC的平板电脑
Apple iPad 10使用内部的 A14 SoC,这在iPad Air 2020中是第一次使用。它可以访问4GB的工作内存。
基准测试显示了一个混合的画面。虽然Geekbench的结果略高于平均水平,但系统基准测试结果却略低。 然而,在日常操作中,你不会注意到任何一个或另一个,SoC以高性能运行,确保系统顺利运行。
| Geekbench ML | |
| 0.5 TensorFlow Lite CPU 0.5 | |
| Apple iPad Air 5 2022 | |
| Apple iPad 10 | |
| Average Apple A14 Bionic (n=1) | |
| 0.5 TensorFlow Lite GPU | |
| Apple iPad Air 5 2022 | |
| Apple iPad 10 | |
| Average Apple A14 Bionic (n=1) | |
| 0.5 TensorFlow Lite NNAPI / Core ML | |
| Apple iPad Air 5 2022 | |
| Apple iPad 10 | |
| Average Apple A14 Bionic (n=1) | |
| PassMark PerformanceTest Mobile V10 | |
| Storage Write | |
| Average of class Tablet (n=1last 2 years) | |
| Lenovo Tab P11 Pro Gen 2 | |
| Apple iPad 10 | |
| Average Apple A14 Bionic (n=1) | |
| Storage Read | |
| Average of class Tablet (n=1last 2 years) | |
| Apple iPad 10 | |
| Average Apple A14 Bionic (n=1) | |
| Lenovo Tab P11 Pro Gen 2 | |
芯片Apple A14 GPU集成在SoC中的A14 GPU处理图形计算,确保了非常高的性能,很容易将Android 竞争对手甩在后面。另一方面,它仍然被以下产品所超越 iPad Air搭配M1处理器。
GFXBench (DX / GLBenchmark) 2.7: T-Rex Onscreen | 1920x1080 T-Rex Offscreen
GFXBench 3.0: on screen Manhattan Onscreen OGL | 1920x1080 1080p Manhattan Offscreen
GFXBench 3.1: on screen Manhattan ES 3.1 Onscreen | 1920x1080 Manhattan ES 3.1 Offscreen
GFXBench: on screen Car Chase Onscreen | 1920x1080 Car Chase Offscreen | on screen Aztec Ruins High Tier Onscreen | 2560x1440 Aztec Ruins High Tier Offscreen | on screen Aztec Ruins Normal Tier Onscreen | 1920x1080 Aztec Ruins Normal Tier Offscreen
Basemark ES 3.1 / Metal: offscreen Overall Score
Basemark GPU 1.2: Vulkan Medium Native | 1920x1080 Vulkan Medium Offscreen | OpenGL Medium Native | 1920x1080 OpenGL Medium Offscreen | 1920x1080 Metal Medium Offscreen | Metal Medium Native
| 3DMark / Wild Life Extreme Unlimited | |
| Apple iPad Air 5 2022 | |
| Apple iPad 10 | |
| Apple iPad 2021 | |
| Xiaomi Pad 5 Pro | |
| Lenovo Tab P11 Pro Gen 2 | |
| Samsung Galaxy Tab S7 FE 5G | |
| 3DMark / Wild Life Extreme | |
| Apple iPad Air 5 2022 | |
| Apple iPad 10 | |
| Apple iPad 2021 | |
| Lenovo Tab P11 Pro Gen 2 | |
| Xiaomi Pad 5 Pro | |
| Samsung Galaxy Tab S7 FE 5G | |
| 3DMark / Wild Life Unlimited Score | |
| Apple iPad Air 5 2022 | |
| Apple iPad 10 | |
| Apple iPad 2021 | |
| Lenovo Tab P11 Pro Gen 2 | |
| Xiaomi Pad 5 Pro | |
| Samsung Galaxy Tab S7 FE 5G | |
| GFXBench (DX / GLBenchmark) 2.7 / T-Rex Onscreen | |
| Xiaomi Pad 5 Pro | |
| Lenovo Tab P11 Pro Gen 2 | |
| Apple iPad 2021 | |
| Apple iPad Air 5 2022 | |
| Apple iPad 10 | |
| Samsung Galaxy Tab S7 FE 5G | |
| GFXBench (DX / GLBenchmark) 2.7 / T-Rex Offscreen | |
| Apple iPad Air 5 2022 | |
| Apple iPad 10 | |
| Apple iPad 2021 | |
| Xiaomi Pad 5 Pro | |
| Lenovo Tab P11 Pro Gen 2 | |
| Samsung Galaxy Tab S7 FE 5G | |
| GFXBench 3.0 / Manhattan Onscreen OGL | |
| Xiaomi Pad 5 Pro | |
| Lenovo Tab P11 Pro Gen 2 | |
| Apple iPad 2021 | |
| Apple iPad Air 5 2022 | |
| Apple iPad 10 | |
| Samsung Galaxy Tab S7 FE 5G | |
| GFXBench 3.0 / 1080p Manhattan Offscreen | |
| Apple iPad Air 5 2022 | |
| Apple iPad 10 | |
| Apple iPad 2021 | |
| Xiaomi Pad 5 Pro | |
| Lenovo Tab P11 Pro Gen 2 | |
| Samsung Galaxy Tab S7 FE 5G | |
| GFXBench 3.1 / Manhattan ES 3.1 Onscreen | |
| Apple iPad Air 5 2022 | |
| Apple iPad 10 | |
| Apple iPad 2021 | |
| Xiaomi Pad 5 Pro | |
| Lenovo Tab P11 Pro Gen 2 | |
| Samsung Galaxy Tab S7 FE 5G | |
| GFXBench 3.1 / Manhattan ES 3.1 Offscreen | |
| Apple iPad Air 5 2022 | |
| Apple iPad 10 | |
| Apple iPad 2021 | |
| Xiaomi Pad 5 Pro | |
| Lenovo Tab P11 Pro Gen 2 | |
| Samsung Galaxy Tab S7 FE 5G | |
| GFXBench / Car Chase Onscreen | |
| Apple iPad Air 5 2022 | |
| Apple iPad 10 | |
| Apple iPad 2021 | |
| Xiaomi Pad 5 Pro | |
| Lenovo Tab P11 Pro Gen 2 | |
| Samsung Galaxy Tab S7 FE 5G | |
| GFXBench / Car Chase Offscreen | |
| Apple iPad Air 5 2022 | |
| Apple iPad 10 | |
| Apple iPad 2021 | |
| Xiaomi Pad 5 Pro | |
| Lenovo Tab P11 Pro Gen 2 | |
| Samsung Galaxy Tab S7 FE 5G | |
| GFXBench / Aztec Ruins High Tier Onscreen | |
| Apple iPad Air 5 2022 | |
| Apple iPad 2021 | |
| Apple iPad 10 | |
| Xiaomi Pad 5 Pro | |
| Lenovo Tab P11 Pro Gen 2 | |
| Samsung Galaxy Tab S7 FE 5G | |
| GFXBench / Aztec Ruins High Tier Offscreen | |
| Apple iPad Air 5 2022 | |
| Apple iPad 10 | |
| Apple iPad 2021 | |
| Xiaomi Pad 5 Pro | |
| Lenovo Tab P11 Pro Gen 2 | |
| Samsung Galaxy Tab S7 FE 5G | |
| GFXBench / Aztec Ruins Normal Tier Onscreen | |
| Apple iPad Air 5 2022 | |
| Apple iPad 2021 | |
| Apple iPad 10 | |
| Xiaomi Pad 5 Pro | |
| Lenovo Tab P11 Pro Gen 2 | |
| Samsung Galaxy Tab S7 FE 5G | |
| GFXBench / Aztec Ruins Normal Tier Offscreen | |
| Apple iPad Air 5 2022 | |
| Apple iPad 10 | |
| Apple iPad 2021 | |
| Xiaomi Pad 5 Pro | |
| Lenovo Tab P11 Pro Gen 2 | |
| Samsung Galaxy Tab S7 FE 5G | |
| Basemark ES 3.1 / Metal / Overall Score | |
| Apple iPad Air 5 2022 | |
| Apple iPad 10 | |
| Apple iPad 2021 | |
| Lenovo Tab P11 Pro Gen 2 | |
| Basemark GPU 1.2 / Vulkan Medium Native | |
| Lenovo Tab P11 Pro Gen 2 | |
| Basemark GPU 1.2 / Vulkan Medium Offscreen | |
| Lenovo Tab P11 Pro Gen 2 | |
| Basemark GPU 1.2 / OpenGL Medium Native | |
| Lenovo Tab P11 Pro Gen 2 | |
| Basemark GPU 1.2 / OpenGL Medium Offscreen | |
| Lenovo Tab P11 Pro Gen 2 | |
| Basemark GPU 1.2 / Metal Medium Offscreen | |
| Apple iPad 10 | |
| Apple iPad 2021 | |
| Basemark GPU 1.2 / Metal Medium Native | |
| Apple iPad 10 | |
| Apple iPad 2021 | |
Basemark GPUScore
使用iPad 10浏览世界网络的速度很快,这也反映在基准测试中。
| Jetstream 2 - 2.0 Total | |
| Apple iPad Air 5 2022 (Safari 15) | |
| Apple iPad 10 (Safari Mobile 16.1) | |
| Average of class Tablet (35.8 - 420, n=55, last 2 years) | |
| Average Apple A14 Bionic (158.2 - 178.9, n=6) | |
| Apple iPad 2021 (Safari 15) | |
| Xiaomi Pad 5 Pro (Chrome 94.0.4606.85) | |
| Lenovo Tab P11 Pro Gen 2 (Chrome 107.0.5304.105) | |
| Samsung Galaxy Tab S7 FE 5G (Chrome91) | |
| WebXPRT 4 - Overall | |
| Average of class Tablet (39 - 376, n=54, last 2 years) | |
| Apple iPad 10 (Safari Mobile 16.1) | |
| Average Apple A14 Bionic (n=1) | |
| Lenovo Tab P11 Pro Gen 2 (Chrome 107.0.5304.105) | |
| WebXPRT 3 - Overall | |
| Average of class Tablet (168 - 520, n=10, last 2 years) | |
| Apple iPad Air 5 2022 (Safari 15) | |
| Apple iPad 10 (Safari Mobile 16.1) | |
| Apple iPad 2021 (Safari 15) | |
| Average Apple A14 Bionic (191 - 214, n=6) | |
| Xiaomi Pad 5 Pro (Chrome 94.0.4606.85) | |
| Samsung Galaxy Tab S7 FE 5G (Chrome91) | |
| Lenovo Tab P11 Pro Gen 2 (Chrome 107.0.5304.105) | |
| Speedometer 2.0 - Result 2.0 | |
| Apple iPad 10 (Safari Mobile 16.1) | |
| Apple iPad Air 5 2022 (Safari 15) | |
| Average of class Tablet (6.8 - 790, n=33, last 2 years) | |
| Average Apple A14 Bionic (188 - 272, n=6) | |
| Apple iPad 2021 (Safari 15) | |
| Xiaomi Pad 5 Pro (Chrome 94.0.4606.85) | |
| Lenovo Tab P11 Pro Gen 2 (Chrome 107.0.5304.105) | |
| Samsung Galaxy Tab S7 FE 5G (Chrome91) | |
| Octane V2 - Total Score | |
| Apple iPad Air 5 2022 (Safari 15) | |
| Apple iPad 10 (Safari Mobile 16.1) | |
| Average Apple A14 Bionic (55710 - 59963, n=6) | |
| Average of class Tablet (1633 - 138481, n=71, last 2 years) | |
| Apple iPad 2021 (Safari 15) | |
| Xiaomi Pad 5 Pro (Chrome 94.0.4606.85) | |
| Lenovo Tab P11 Pro Gen 2 (Chrome 107.0.5304.105) | |
| Samsung Galaxy Tab S7 FE 5G (Chrome91) | |
| Mozilla Kraken 1.1 - Total | |
| Samsung Galaxy Tab S7 FE 5G (Chrome91) | |
| Average of class Tablet (243 - 16233, n=65, last 2 years) | |
| Lenovo Tab P11 Pro Gen 2 (Chrome 107.0.5304.105) | |
| Xiaomi Pad 5 Pro (Chrome 94.0.4606.85) | |
| Apple iPad 10 (Safari Mobile 16.1) | |
| Apple iPad 2021 (Safari 15) | |
| Apple iPad Air 5 2022 (Safari 15) | |
| Average Apple A14 Bionic (460 - 547, n=6) | |
* ... smaller is better
游戏--大量的力量
不幸的是,我们的合作伙伴GameBench在本次测试时还不支持当前的iPadOS,因此我们无法在这里向你展示任何结果。
然而,Apple A14提供的性能足以在高细节设置下显示所有常见的游戏,而完全不需要限制帧率。只有在《源氏冲击》中,即设置为最高质量水平的60FPS时,我们注意到偶尔会有小的停顿。
由于其重量,这款平板电脑在长期使用中会变得有点重,但它也提供了一个舒适的大显示区域和体面的扬声器。


排放 - 负载下的性能只有很小的损失
温度
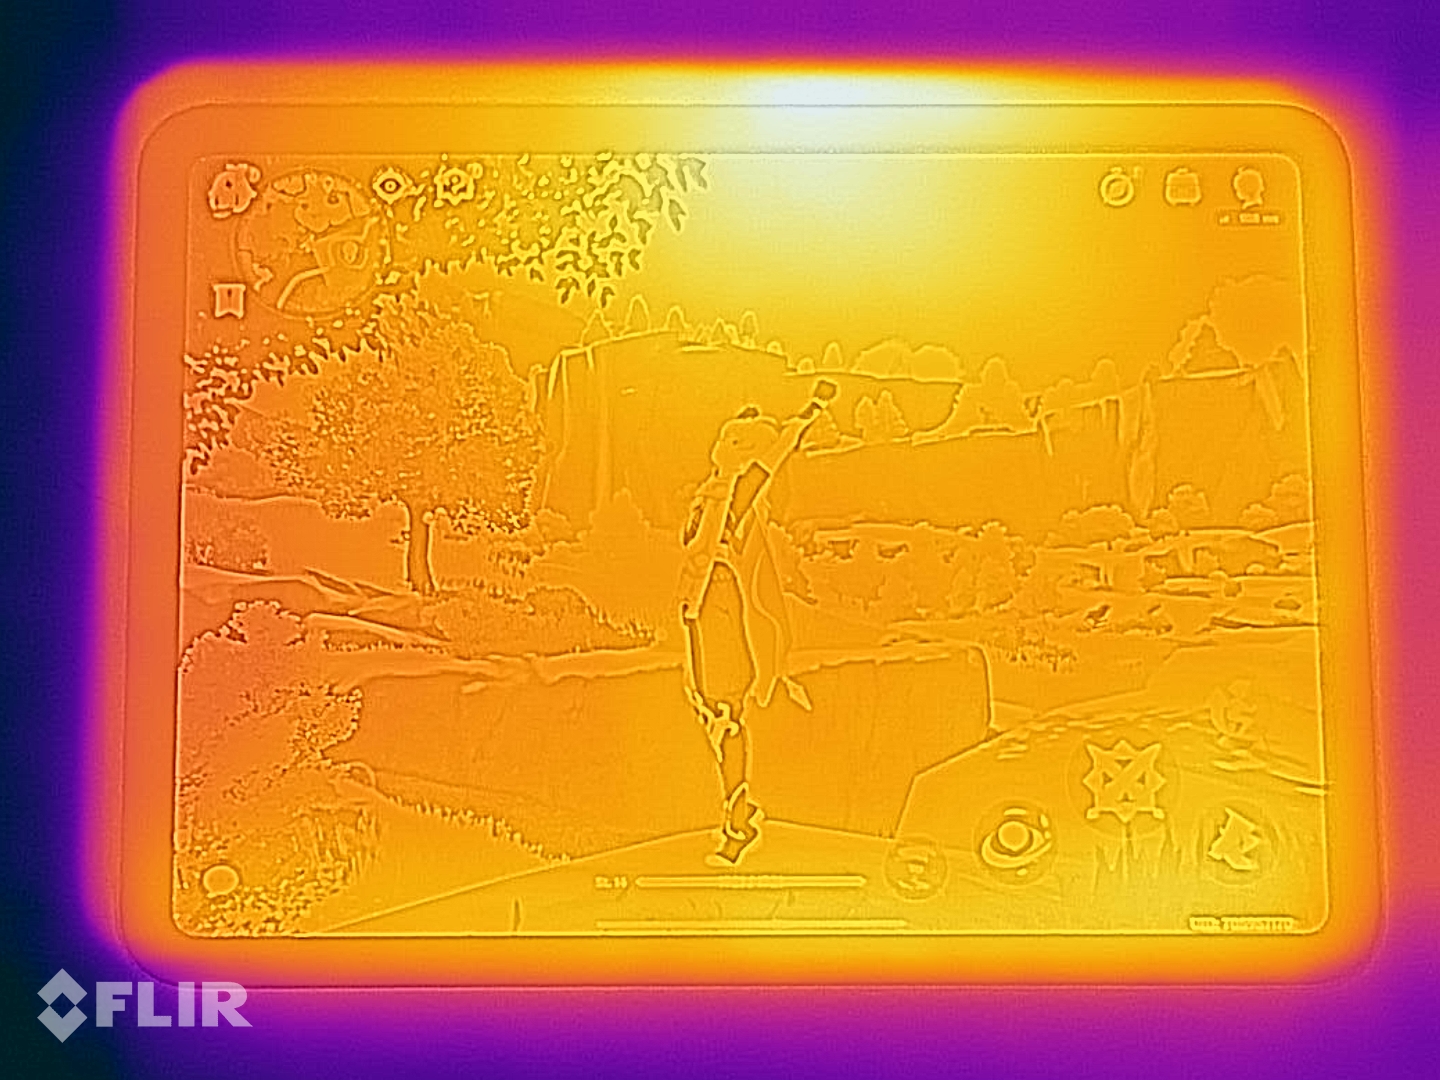
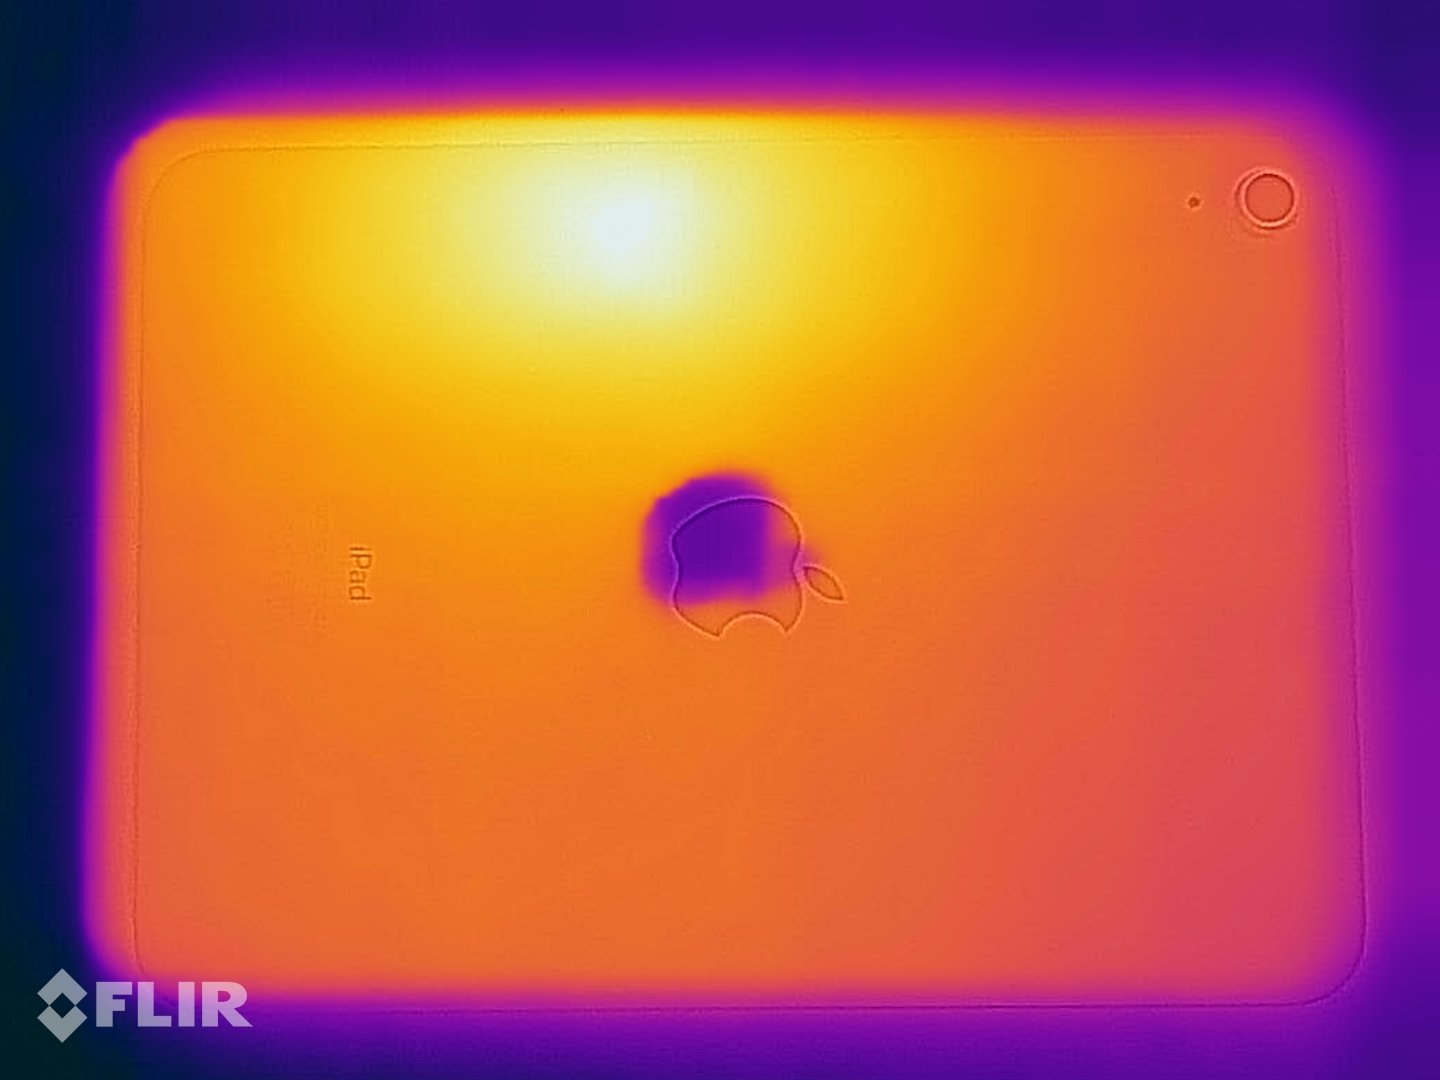
Apple iPad 10在怠速运行时已经明显升温,但这绝不会变得令人不舒服。在负载情况下,一些部件甚至会明显变热。然而,温度始终保持在37ºC(99 ºF)以下。
在3DMark压力测试中,在前4次运行中,性能已经略有下降,尽管之后保持稳定。在14%左右,这种性能下降相对较小,即使如此,Apple 平板电脑每秒产生的帧数比 小米Pad 5 Pro多60%。 骁龙870.
3DMark Wild Life Stress Test
(+) The maximum temperature on the upper side is 35.1 °C / 95 F, compared to the average of 33.7 °C / 93 F, ranging from 20.7 to 53.2 °C for the class Tablet.
(+) The bottom heats up to a maximum of 36.9 °C / 98 F, compared to the average of 33.2 °C / 92 F
(±) In idle usage, the average temperature for the upper side is 32 °C / 90 F, compared to the device average of 30 °C / 86 F.
发言人
Apple iPad 10在每个短边上都有两个扬声器,能产生一个体面的音量,尽管高音调的声音略微太大。在日常操作中,所提供的性能很容易满足听一点音乐或以中等音量观看电影的需要。
USB-C接口还允许你连接有线耳机或扬声器。对于无线收听,可以使用蓝牙5.2,但该平板电脑只支持SBC和AAC音频编解码。
Apple iPad 10 audio analysis
(+) | speakers can play relatively loud (84.6 dB)
Bass 100 - 315 Hz
(-) | nearly no bass - on average 18.2% lower than median
(±) | linearity of bass is average (10.5% delta to prev. frequency)
Mids 400 - 2000 Hz
(+) | balanced mids - only 3.9% away from median
(+) | mids are linear (4.8% delta to prev. frequency)
Highs 2 - 16 kHz
(±) | higher highs - on average 7.8% higher than median
(+) | highs are linear (5.3% delta to prev. frequency)
Overall 100 - 16.000 Hz
(±) | linearity of overall sound is average (18.3% difference to median)
Compared to same class
» 48% of all tested devices in this class were better, 6% similar, 46% worse
» The best had a delta of 7%, average was 20%, worst was 129%
Compared to all devices tested
» 40% of all tested devices were better, 8% similar, 52% worse
» The best had a delta of 4%, average was 23%, worst was 134%
Lenovo Tab P11 Pro Gen 2 audio analysis
(+) | speakers can play relatively loud (87.5 dB)
Bass 100 - 315 Hz
(-) | nearly no bass - on average 15% lower than median
(±) | linearity of bass is average (11.1% delta to prev. frequency)
Mids 400 - 2000 Hz
(±) | higher mids - on average 5.7% higher than median
(+) | mids are linear (5.9% delta to prev. frequency)
Highs 2 - 16 kHz
(+) | balanced highs - only 2.6% away from median
(+) | highs are linear (4.5% delta to prev. frequency)
Overall 100 - 16.000 Hz
(+) | overall sound is linear (13.6% difference to median)
Compared to same class
» 25% of all tested devices in this class were better, 4% similar, 70% worse
» The best had a delta of 7%, average was 20%, worst was 129%
Compared to all devices tested
» 15% of all tested devices were better, 4% similar, 82% worse
» The best had a delta of 4%, average was 23%, worst was 134%
电源管理--iPad 10采用较小的电池
消耗功率
Apple iPad 10在空闲运行时的耗电量略高于 2021年的iPad,但另一方面,较新的机型在负载下的效率更高。令人惊讶的是它在待机模式时的耗电量。
iPad 10的电池比去年的型号要小。这可能是由于外壳设计的原因,因为 iPad Air有一个类似容量的电池。在我们的测试中,完全给电池充电大约需要2小时45分钟。
| Off / Standby | |
| Idle | |
| Load |
|
Key:
min: | |
| Apple iPad 10 7606 mAh | Apple iPad Air 5 2022 mAh | Apple iPad 2021 8686 mAh | Samsung Galaxy Tab S7 FE 5G 10090 mAh | Xiaomi Pad 5 Pro 8600 mAh | Lenovo Tab P11 Pro Gen 2 8200 mAh | |
|---|---|---|---|---|---|---|
| Power Consumption | -11% | -2% | 14% | 23% | -0% | |
| Idle Minimum * (Watt) | 1.34 | 1.65 -23% | 1.3 3% | 1.06 21% | 1.14 15% | 3 -124% |
| Idle Average * (Watt) | 7.78 | 8.1 -4% | 7.5 4% | 6.25 20% | 4.3 45% | 4.21 46% |
| Idle Maximum * (Watt) | 7.89 | 9.4 -19% | 7.58 4% | 6.3 20% | 4.31 45% | 4.3 46% |
| Load Average * (Watt) | 9.05 | 9.5 -5% | 10.03 -11% | 8.76 3% | 8.09 11% | 6.8 25% |
| Load Maximum * (Watt) | 9.98 | 10.4 -4% | 10.91 -9% | 9.54 4% | 10.32 -3% | 9.5 5% |
* ... smaller is better
Power Consumption: Geekbench (150 cd/m²)
Power Consumption: GFXBench (150 cd/m²)
电池寿命
Apple 平板电脑的电池寿命处于良好水平,尽管它在我们的比较中排在最后。我们的WLAN测试测出了真实的结果,由于显示屏亮度调整到150cd/m²,确保了可比的数值。在将近11个小时的时间里,iPad 10的持续时间比Apple ,但所有的竞争对手都无一例外地拥有更大的电池,其中大多数都达到了更长的电池寿命。在这方面,只有联想Tab P11 Pro是一个例外。
| Apple iPad 10 7606 mAh | Apple iPad Air 5 2022 mAh | Apple iPad 2021 8686 mAh | Samsung Galaxy Tab S7 FE 5G 10090 mAh | Xiaomi Pad 5 Pro 8600 mAh | Lenovo Tab P11 Pro Gen 2 8200 mAh | |
|---|---|---|---|---|---|---|
| Battery runtime | 14% | 28% | 62% | 47% | 5% | |
| Reader / Idle (h) | 28.8 | 38.2 33% | 41.4 44% | 50.2 74% | 16.9 -41% | |
| H.264 (h) | 12.3 | 15 22% | 20.8 69% | 16.8 37% | 12.1 -2% | |
| WiFi v1.3 (h) | 10.8 | 10.8 0% | 13.4 24% | 17 57% | 15.4 43% | 9.4 -13% |
| Load (h) | 3.2 | 4.1 28% | 4.2 31% | 5.7 78% | 4.3 34% | 5.6 75% |
Pros
Cons
结论 - 技术强大,但价格昂贵
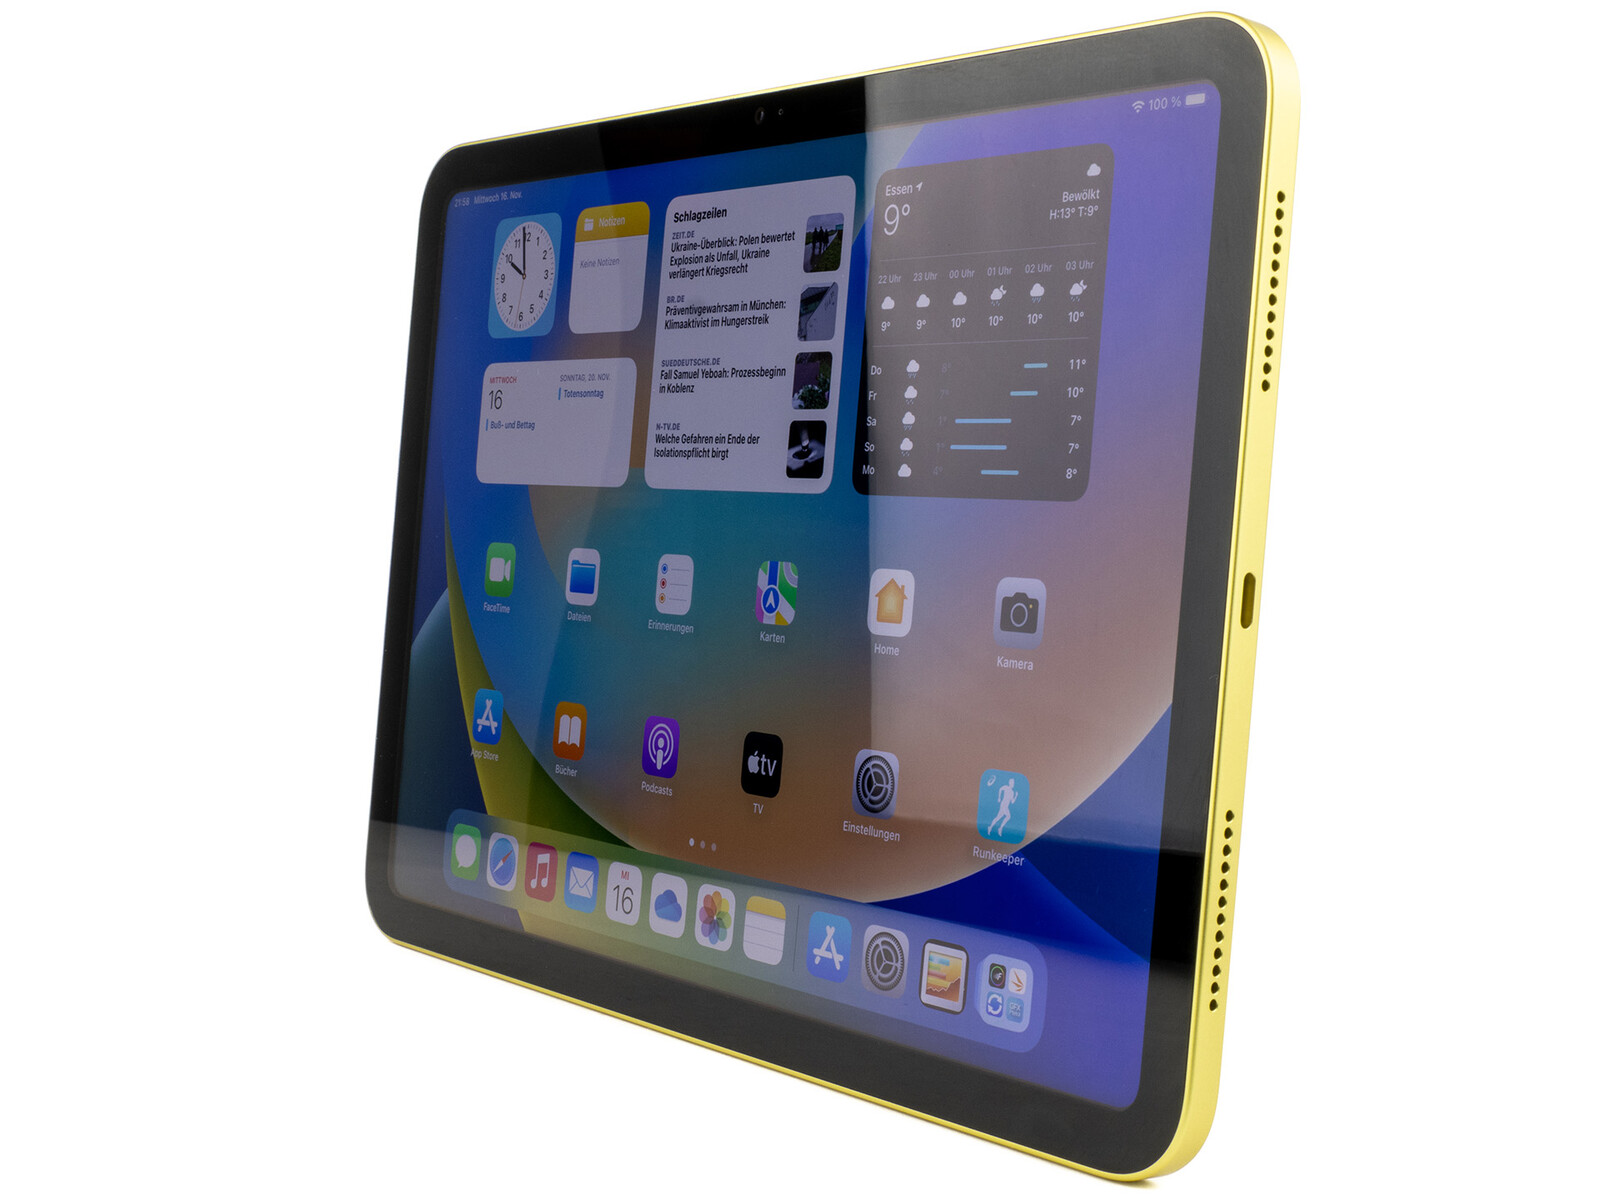
iPad 10的推出本可以给人以欢欣鼓舞的理由,但不幸的是,Apple ,与上一代产品相比,价格大幅上涨,这让人感到沮丧。iPad最大的进步在于设计,它现在类似于 iPad Air.
那些决定购买iPad 10的人将会得到一个快速的平板电脑,拥有精确的显示屏、良好的电池寿命和可选的5G,并且可能会对它非常满意。然而,技术上的进步并不像你从价格增长中所期望的那么大。
2022年的Apple iPad要求高额的价格,但技术是无缝的。
iPad继续使用没有完全贴合的显示屏。虽然这在可维修性方面可能是个优点,但感觉还是有点奇怪,特别是在使用笔时,它似乎悬浮在显示屏上方。 你还必须为笔购买一个额外的适配器,才能将它连接到平板电脑上。虽然显示屏没有闪烁,但亮度与iPad 9的水平相似。 iPad 9而且刷新率只有60赫兹。
那些想拥有经济实惠的iPad,并且不介意旧设计的人还是应该买去年的型号。特别是如果你还需要购买一些Apple ,你可以通过这种方式轻松节省几百欧元,而不会有任何明显的妥协。该机型的电池寿命甚至更好。
其他强大的替代品有 Galaxy Tab S7 FE或 联想Tab P11 Pro,它们不仅更实惠,而且还直接包括相应的输入笔。
Apple iPad 10
- 11/24/2022 v7 (old)
Daniel Schmidt
Price comparison

