Apple iPad 7 (2019) 平板电脑评测:小改变,大作用?
Rating | Date | Model | Weight | Height | Size | Resolution | Price |
|---|---|---|---|---|---|---|---|
| 85.4 % v7 (old) | 01 / 2020 | Apple iPad 7 2019 A10 Fusion, A10 Fusion GPU | 483 g | 7.5 mm | 10.20" | 2160x1620 | |
| 84.6 % v7 (old) | 04 / 2018 | Apple iPad 6 2018 A10 Fusion, A10 Fusion GPU | 469 g | 7.5 mm | 9.70" | 2048x1536 | |
| 87.5 % v7 (old) | 06 / 2019 | Apple iPad Air 3 2019 A12 Bionic, A12 Bionic GPU | 456 g | 6.1 mm | 10.50" | 2224x1668 | |
| 89.8 % v7 (old) | 11 / 2018 | Apple iPad Pro 11 2018 A12X Bionic, A12X Bionic GPU | 468 g | 5.9 mm | 11.00" | 2388x1668 | |
| 87.5 % v6 (old) | 04 / 2018 | Huawei MediaPad M5 10.8 Pro Kirin 960, Mali-G71 MP8 | 498 g | 7.3 mm | 10.80" | 2560x1600 | |
| 84.5 % v7 (old) | 07 / 2019 | Samsung Galaxy Tab S5e SM-T720 SD 670, Adreno 616 | 400 g | 5.5 mm | 10.50" | 2560x1600 |


| |||||||||||||||||||||||||
Brightness Distribution: 87 %
Center on Battery: 499 cd/m²
Contrast: 1018:1 (Black: 0.49 cd/m²)
ΔE ColorChecker Calman: 0.97 | ∀{0.5-29.43 Ø4.71}
ΔE Greyscale Calman: 0.9 | ∀{0.09-98 Ø4.96}
97.8% sRGB (Calman 2D)
Gamma: 2.135
CCT: 6571 K
| Apple iPad 7 2019 IPS, 2160x1620, 10.2" | Apple iPad 6 2018 IPS, 2048x1536, 9.7" | Apple iPad Air 3 2019 IPS, 2224x1668, 10.5" | Apple iPad Pro 11 2018 IPS, 2388x1668, 11" | Huawei MediaPad M5 10.8 Pro IPS, 2560x1600, 10.8" | Samsung Galaxy Tab S5e SM-T720 Super AMOLED, 2560x1600, 10.5" | |
|---|---|---|---|---|---|---|
| Screen | -14% | -44% | 4% | -255% | -57% | |
| Brightness middle (cd/m²) | 499 | 530 6% | 515 3% | 639 28% | 384 -23% | 452 -9% |
| Brightness (cd/m²) | 470 | 513 9% | 483 3% | 591 26% | 360 -23% | 453 -4% |
| Brightness Distribution (%) | 87 | 92 6% | 90 3% | 87 0% | 84 -3% | 90 3% |
| Black Level * (cd/m²) | 0.49 | 0.61 -24% | 0.41 16% | 0.45 8% | 0.8 -63% | |
| Contrast (:1) | 1018 | 869 -15% | 1256 23% | 1420 39% | 480 -53% | |
| Colorchecker dE 2000 * | 0.97 | 1.2 -24% | 1.6 -65% | 0.92 5% | 6.83 -604% | 1.7 -75% |
| Colorchecker dE 2000 max. * | 1.98 | 3.2 -62% | 4.4 -122% | 2.59 -31% | 12.7 -541% | 3.7 -87% |
| Greyscale dE 2000 * | 0.9 | 1 -11% | 2.8 -211% | 1.3 -44% | 7.5 -733% | 2.4 -167% |
| Gamma | 2.135 103% | 2.28 96% | 2.21 100% | 2.22 99% | 2.199 100% | 2.07 106% |
| CCT | 6571 99% | 6588 99% | 6944 94% | 6656 98% | 8544 76% | 6337 103% |
* ... smaller is better
Screen Flickering / PWM (Pulse-Width Modulation)
| Screen flickering / PWM not detected | 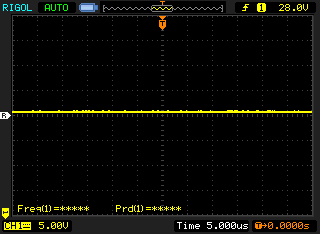 | ||
In comparison: 52 % of all tested devices do not use PWM to dim the display. If PWM was detected, an average of 7757 (minimum: 5 - maximum: 343500) Hz was measured. | |||
Display Response Times
| ↔ Response Time Black to White | ||
|---|---|---|
| 18 ms ... rise ↗ and fall ↘ combined | ↗ 7 ms rise | 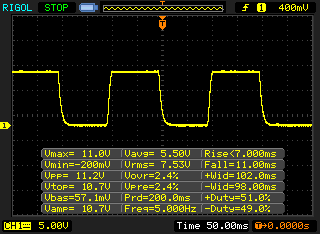 |
| ↘ 11 ms fall | ||
| The screen shows good response rates in our tests, but may be too slow for competitive gamers. In comparison, all tested devices range from 0.1 (minimum) to 240 (maximum) ms. » 40 % of all devices are better. This means that the measured response time is similar to the average of all tested devices (19.8 ms). | ||
| ↔ Response Time 50% Grey to 80% Grey | ||
| 38 ms ... rise ↗ and fall ↘ combined | ↗ 19 ms rise | 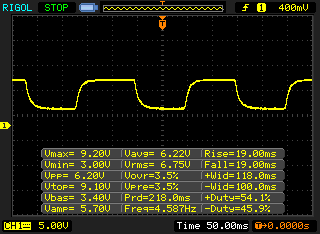 |
| ↘ 19 ms fall | ||
| The screen shows slow response rates in our tests and will be unsatisfactory for gamers. In comparison, all tested devices range from 0.165 (minimum) to 636 (maximum) ms. » 55 % of all devices are better. This means that the measured response time is worse than the average of all tested devices (31 ms). | ||
| Jetstream 2 - 2.0 Total | |
| Average of class Tablet (35.8 - 420, n=55, last 2 years) | |
| Apple iPad Air 3 2019 (Safari Mobile 12) | |
| Apple iPad 7 2019 (Safari 13) | |
| Average Apple A10 Fusion (54.2 - 76.2, n=2) | |
| Samsung Galaxy Tab S5e SM-T720 (Chrome 74.0.3729.136) | |
| JetStream 1.1 - 1.1 Total | |
| Apple iPad Pro 11 2018 (Safari 13) | |
| Apple iPad 7 2019 (Safari 13) | |
| Average Apple A10 Fusion (165.9 - 172.6, n=4) | |
| Apple iPad 6 2018 (Safari Mobile 11.3) | |
| Huawei MediaPad M5 10.8 Pro (Chrome 68.0.3440.91) | |
| Samsung Galaxy Tab S5e SM-T720 (Chrome 74.0.3729.136) | |
| WebXPRT 3 - Overall | |
| Average of class Tablet (168 - 520, n=10, last 2 years) | |
| Apple iPad Pro 11 2018 (Safari 13) | |
| Apple iPad Air 3 2019 (Safari Mobile 12) | |
| Apple iPad 7 2019 (Safari 13) | |
| Average Apple A10 Fusion (79 - 111, n=2) | |
| Apple iPad 6 2018 (Safari Mobile 10) | |
| Huawei MediaPad M5 10.8 Pro (Chrome 68.0.3440.91) | |
| Samsung Galaxy Tab S5e SM-T720 (Chrome 74.0.3729.136) | |
| Speedometer 2.0 - Result 2.0 | |
| Average of class Tablet (6.8 - 790, n=33, last 2 years) | |
| Apple iPad Pro 11 2018 (IOS 12.1.1) | |
| Apple iPad Air 3 2019 (Safari Mobile 12) | |
| Apple iPad 7 2019 (Safari 13) | |
| Average Apple A10 Fusion (65.5 - 66.4, n=2) | |
| Apple iPad 6 2018 (IOS 12.1.1) | |
| Samsung Galaxy Tab S5e SM-T720 (Chrome 74.0.3729.136) | |
| Octane V2 - Total Score | |
| Average of class Tablet (1633 - 138481, n=71, last 2 years) | |
| Apple iPad Pro 11 2018 (Safari 13) | |
| Apple iPad Air 3 2019 (Safari Mobile 12) | |
| Apple iPad 6 2018 (Safari Mobile 11.3) | |
| Apple iPad 7 2019 (Safari 13) | |
| Average Apple A10 Fusion (19783 - 27967, n=5) | |
| Huawei MediaPad M5 10.8 Pro (Chrome 68.0.3440.91) | |
| Samsung Galaxy Tab S5e SM-T720 (Chrome 74.0.3729.136) | |
| Mozilla Kraken 1.1 - Total | |
| Huawei MediaPad M5 10.8 Pro (Chrome 68.0.3440.91) | |
| Samsung Galaxy Tab S5e SM-T720 (Chrome 74.0.3729.136) | |
| Average of class Tablet (243 - 16233, n=65, last 2 years) | |
| Average Apple A10 Fusion (1026 - 1531, n=5) | |
| Apple iPad 7 2019 (Safari 13) | |
| Apple iPad 6 2018 (Safari Mobile 11.3) | |
| Apple iPad Air 3 2019 (Safari Mobile 12) | |
| Apple iPad Pro 11 2018 (Safari 13) | |
* ... smaller is better
#new_benchmarks
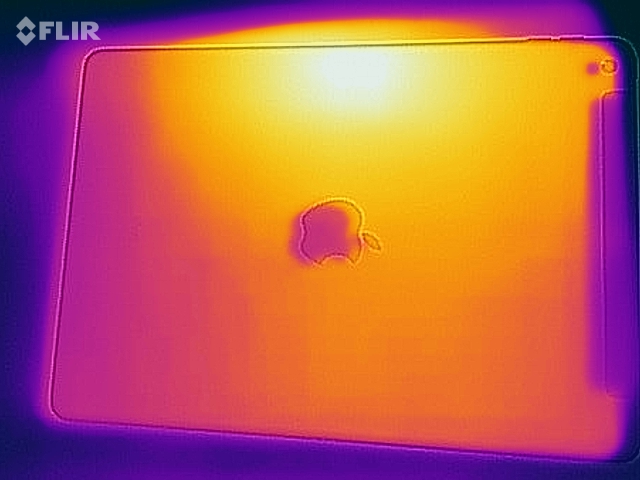
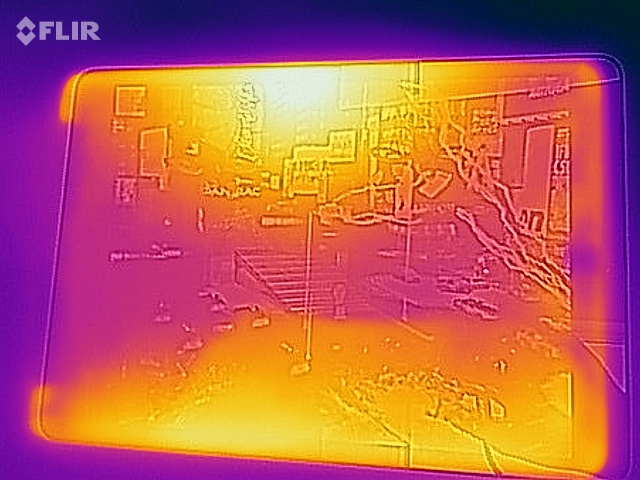
(+) The maximum temperature on the upper side is 36.6 °C / 98 F, compared to the average of 33.7 °C / 93 F, ranging from 20.7 to 53.2 °C for the class Tablet.
(+) The bottom heats up to a maximum of 36.8 °C / 98 F, compared to the average of 33.2 °C / 92 F
(+) In idle usage, the average temperature for the upper side is 29.5 °C / 85 F, compared to the device average of 30 °C / 86 F.
Apple iPad 7 2019 audio analysis
(±) | speaker loudness is average but good (81.6 dB)
Bass 100 - 315 Hz
(-) | nearly no bass - on average 66.3% lower than median
(+) | bass is linear (0% delta to prev. frequency)
Mids 400 - 2000 Hz
(-) | nearly no mids - on average 66.3% lower than median
(+) | mids are linear (0% delta to prev. frequency)
Highs 2 - 16 kHz
(-) | nearly no highs - on average 66.3% lower than median
(+) | highs are linear (0% delta to prev. frequency)
Overall 100 - 16.000 Hz
(-) | overall sound is not linear (121.2% difference to median)
Compared to same class
» 99% of all tested devices in this class were better, 0% similar, 0% worse
» The best had a delta of 7%, average was 20%, worst was 129%
Compared to all devices tested
» 97% of all tested devices were better, 2% similar, 1% worse
» The best had a delta of 4%, average was 23%, worst was 134%
Apple iPad 6 2018 audio analysis
(±) | speaker loudness is average but good (75.7 dB)
Bass 100 - 315 Hz
(±) | reduced bass - on average 11.2% lower than median
(±) | linearity of bass is average (11.9% delta to prev. frequency)
Mids 400 - 2000 Hz
(+) | balanced mids - only 1.3% away from median
(+) | mids are linear (5.9% delta to prev. frequency)
Highs 2 - 16 kHz
(+) | balanced highs - only 3.3% away from median
(±) | linearity of highs is average (11% delta to prev. frequency)
Overall 100 - 16.000 Hz
(+) | overall sound is linear (13.3% difference to median)
Compared to same class
» 24% of all tested devices in this class were better, 4% similar, 71% worse
» The best had a delta of 7%, average was 20%, worst was 129%
Compared to all devices tested
» 14% of all tested devices were better, 3% similar, 83% worse
» The best had a delta of 4%, average was 23%, worst was 134%
| Off / Standby | |
| Idle | |
| Load |
|
Key:
min: | |
| Apple iPad 7 2019 mAh | Apple iPad 6 2018 mAh | Apple iPad Air 3 2019 8134 mAh | Apple iPad Pro 11 2018 7736 mAh | Huawei MediaPad M5 10.8 Pro 7500 mAh | Samsung Galaxy Tab S5e SM-T720 7040 mAh | |
|---|---|---|---|---|---|---|
| Power Consumption | -5% | 15% | 10% | 0% | 43% | |
| Idle Minimum * (Watt) | 2.2 | 2.2 -0% | 2.18 1% | 1.2 45% | 3.3 -50% | 2.07 6% |
| Idle Average * (Watt) | 6.7 | 7.8 -16% | 6.4 4% | 4.1 39% | 4.2 37% | 3.94 41% |
| Idle Maximum * (Watt) | 8.2 | 7.9 4% | 6.43 22% | 7.5 9% | 7 15% | 3.96 52% |
| Load Average * (Watt) | 11.3 | 12.6 -12% | 7.48 34% | 13.6 -20% | 10.4 8% | 4.07 64% |
| Load Maximum * (Watt) | 12.5 | 12.8 -2% | 10.65 15% | 15.2 -22% | 13.8 -10% | 5.73 54% |
* ... smaller is better
| Apple iPad 7 2019 mAh | Apple iPad 6 2018 mAh | Apple iPad Air 3 2019 8134 mAh | Apple iPad Pro 11 2018 7736 mAh | Huawei MediaPad M5 10.8 Pro 7500 mAh | Samsung Galaxy Tab S5e SM-T720 7040 mAh | |
|---|---|---|---|---|---|---|
| Battery runtime | -3% | -0% | 24% | -8% | 8% | |
| Reader / Idle (h) | 24.8 | 25 1% | 34.3 38% | 20.9 -16% | 21.1 -15% | |
| H.264 (h) | 13.4 | 11.4 -15% | 16.4 22% | 10.5 -22% | 14.4 7% | |
| WiFi v1.3 (h) | 11.8 | 11.9 1% | 12.3 4% | 15.3 30% | 11.2 -5% | 10.4 -12% |
| Load (h) | 3.3 | 3.1 -6% | 3.6 9% | 3.5 6% | 3.7 12% | 5 52% |
Pros
Cons
Verdict - A gentle facelift for Apple's budget iPad
iPad 7 2019有趣吗?我们认为是的,但这很大一部分是由于新的iPadOS,而不是源于Apple今年进行的任何重大硬件更改。
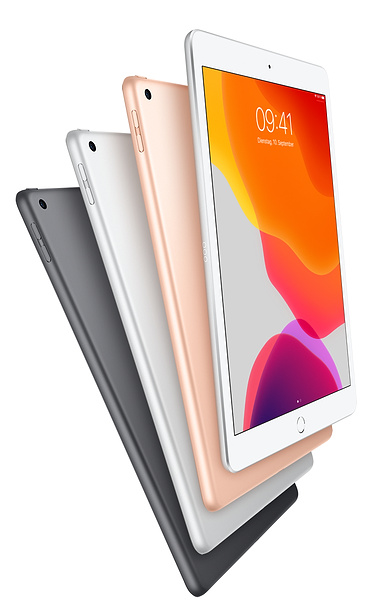
简而言之,新的iPad是支持Apple Pencil和智能键盘的iPad 6的稍大版本。更大,更高分辨率的屏幕改变了视觉效果,与9.7英寸经典iPad显示屏相比,这是一个可喜的变化。但是,多年来市场上一直存在第三方iPad键盘,因此对Smart Keyboard的支持并不一定是用户从iPad 6升级到iPad 7的原因。SmartKeyboard尽管制作精良,但也非常昂贵。
2019年的小新闻:苹果的廉价iPad仍然是一款不错的平板电脑,但您已如果拥有iPad 6,则不值得升级iPad 7。
不过,iPad 7与其前身相比续航时间,性能和扬声器几乎相同。它们还共享同一机身,从而使iPad 7只是对iPad 6的增量升级。前者也很昂贵,起价为2499元。值得注意的是,2499元仅能为您提供32 GB的Wi-Fi版本,而Apple为128 GB Wi-Fi型号收取2999美元。此外,LTE连接的成本将增加1000元,使最昂贵的型号与256 GB Wi-Fi iPad Air差价极少。
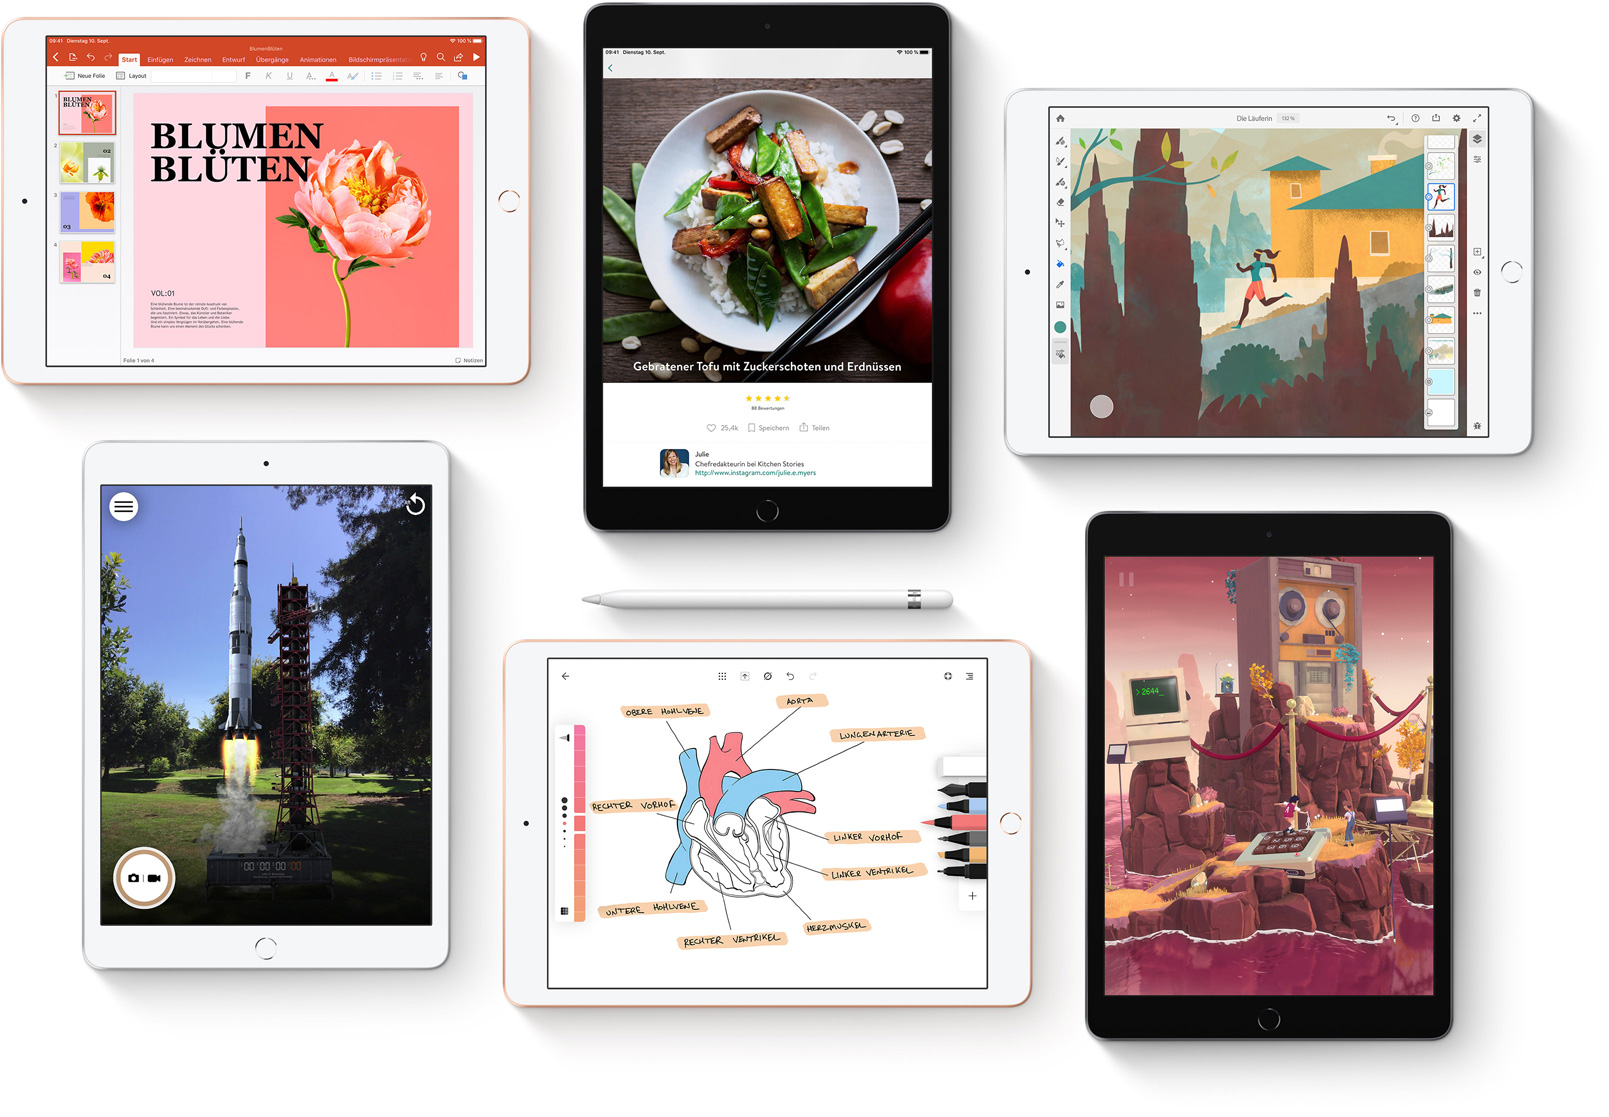
尽管如此,iPad 7是一款出色的家庭和学习用平板电脑,为App Store中的所有应用程序提供了强大的支持。不过,其优质的设计,笔的支持,优化后的操作系统以及还不错的摄像头仍然可能会引起轰动。
Price comparison

