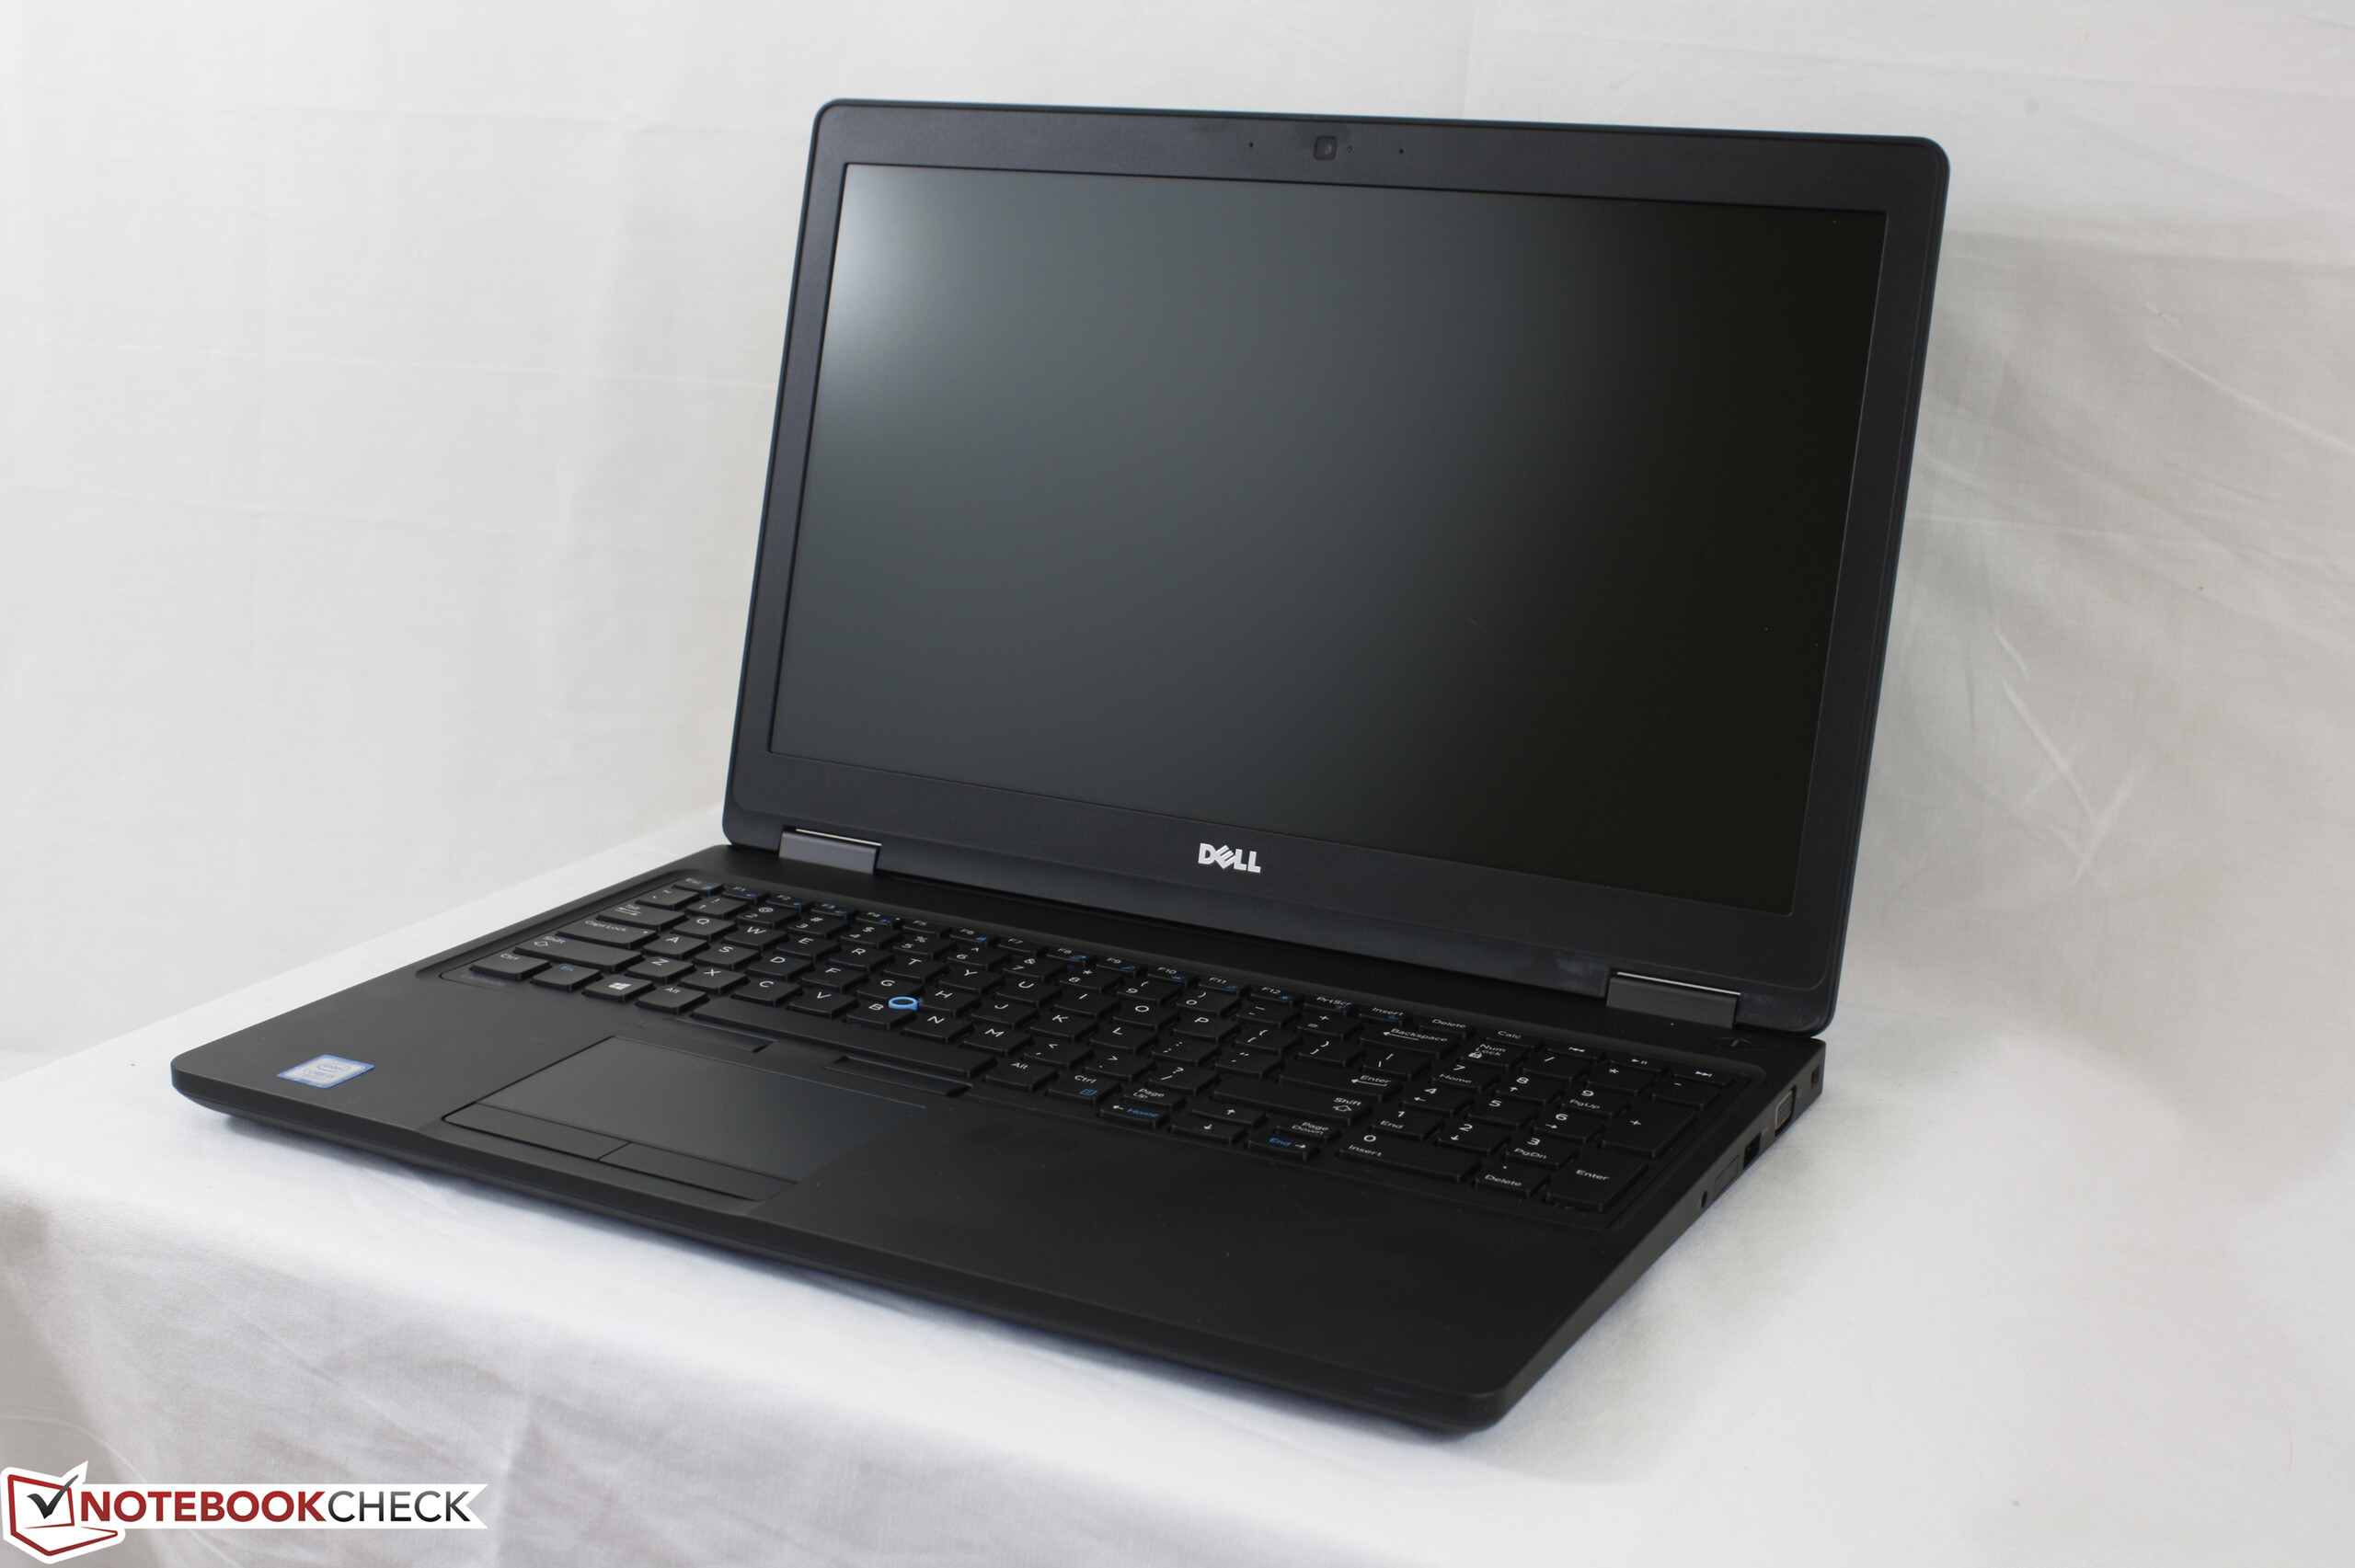
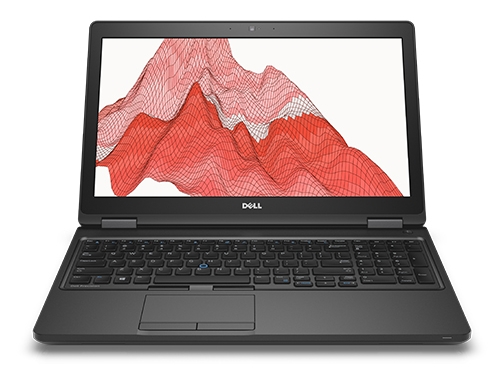
戴尔 Precision 3520 (i7-7820HQ, M620M) 工作站简短评测
| SD Card Reader | |
| average JPG Copy Test (av. of 3 runs) | |
| Dell Precision 3520 | |
| Dell Precision 5520 UHD | |
| Dell Precision 3510 | |
| maximum AS SSD Seq Read Test (1GB) | |
| Dell Precision 5520 UHD | |
| Dell Precision 3510 | |
| Dell Precision 3520 | |
| Networking | |
| iperf3 transmit AX12 | |
| Dell Precision 5520 UHD | |
| Dell Precision 3520 | |
| iperf3 receive AX12 | |
| Dell Precision 3520 | |
| Dell Precision 5520 UHD | |
| |||||||||||||||||||||||||
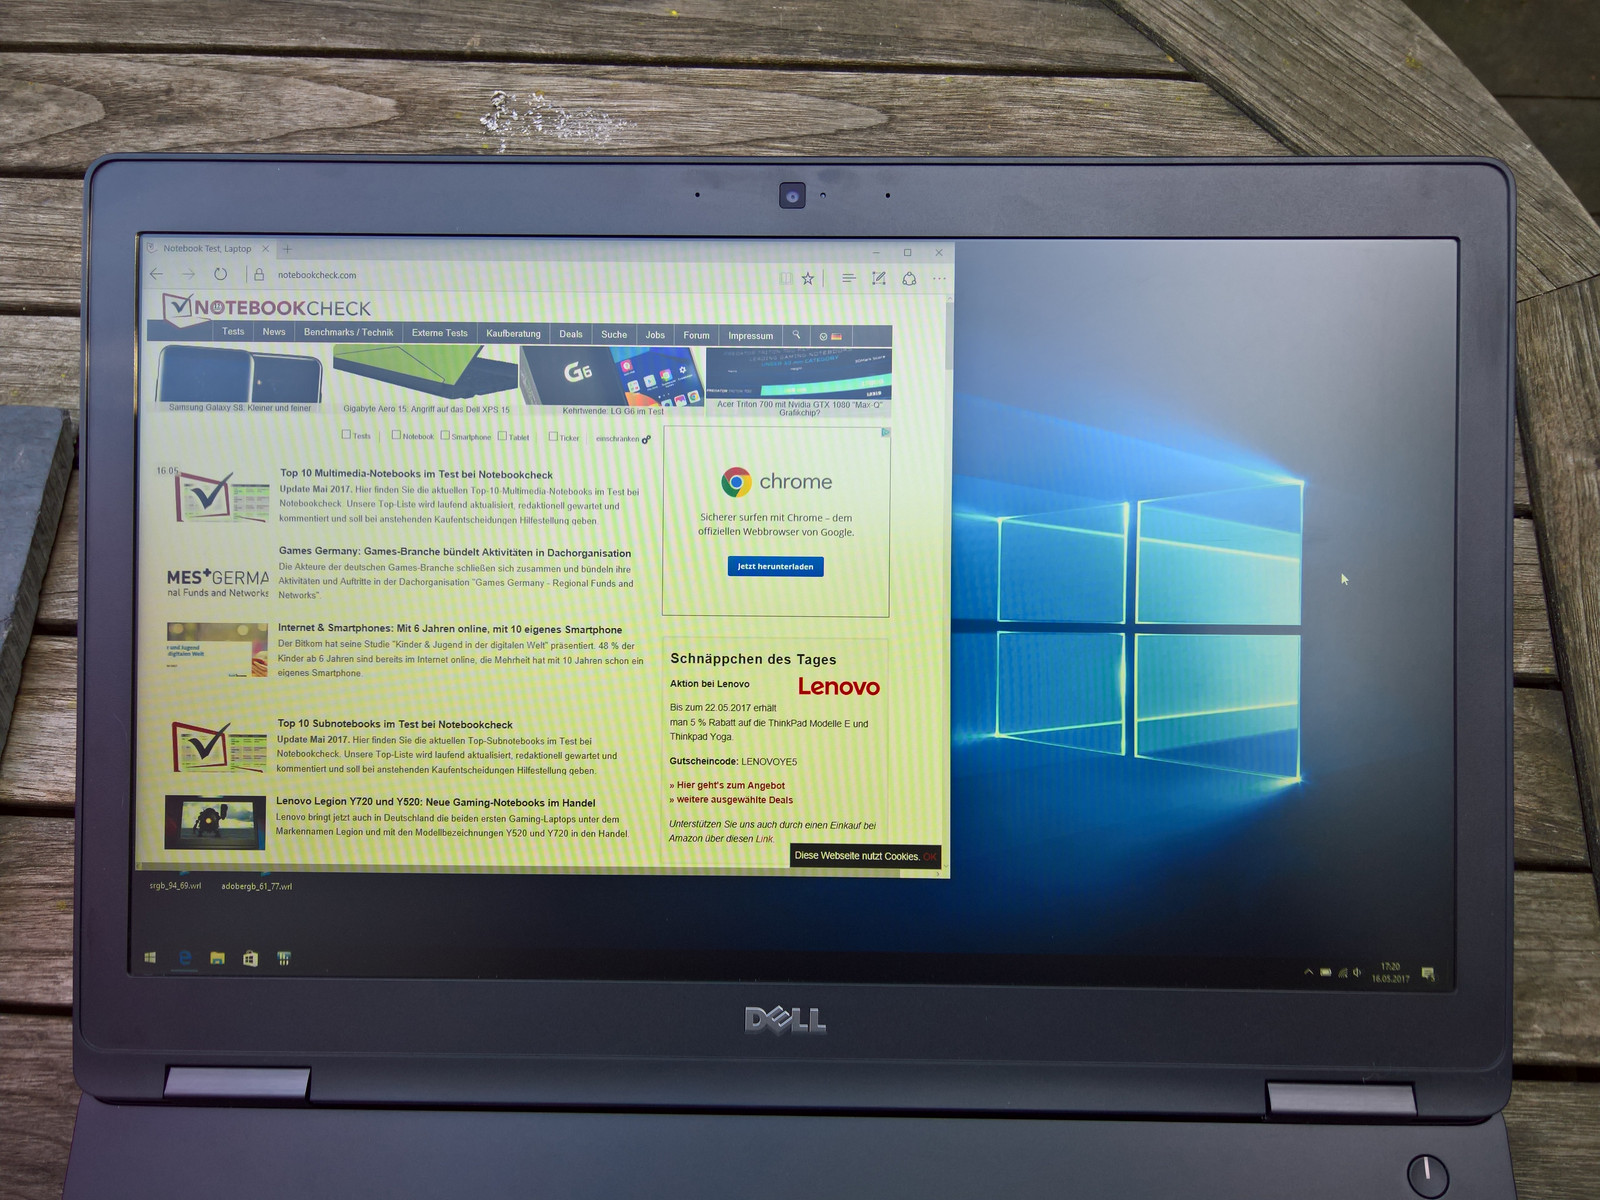
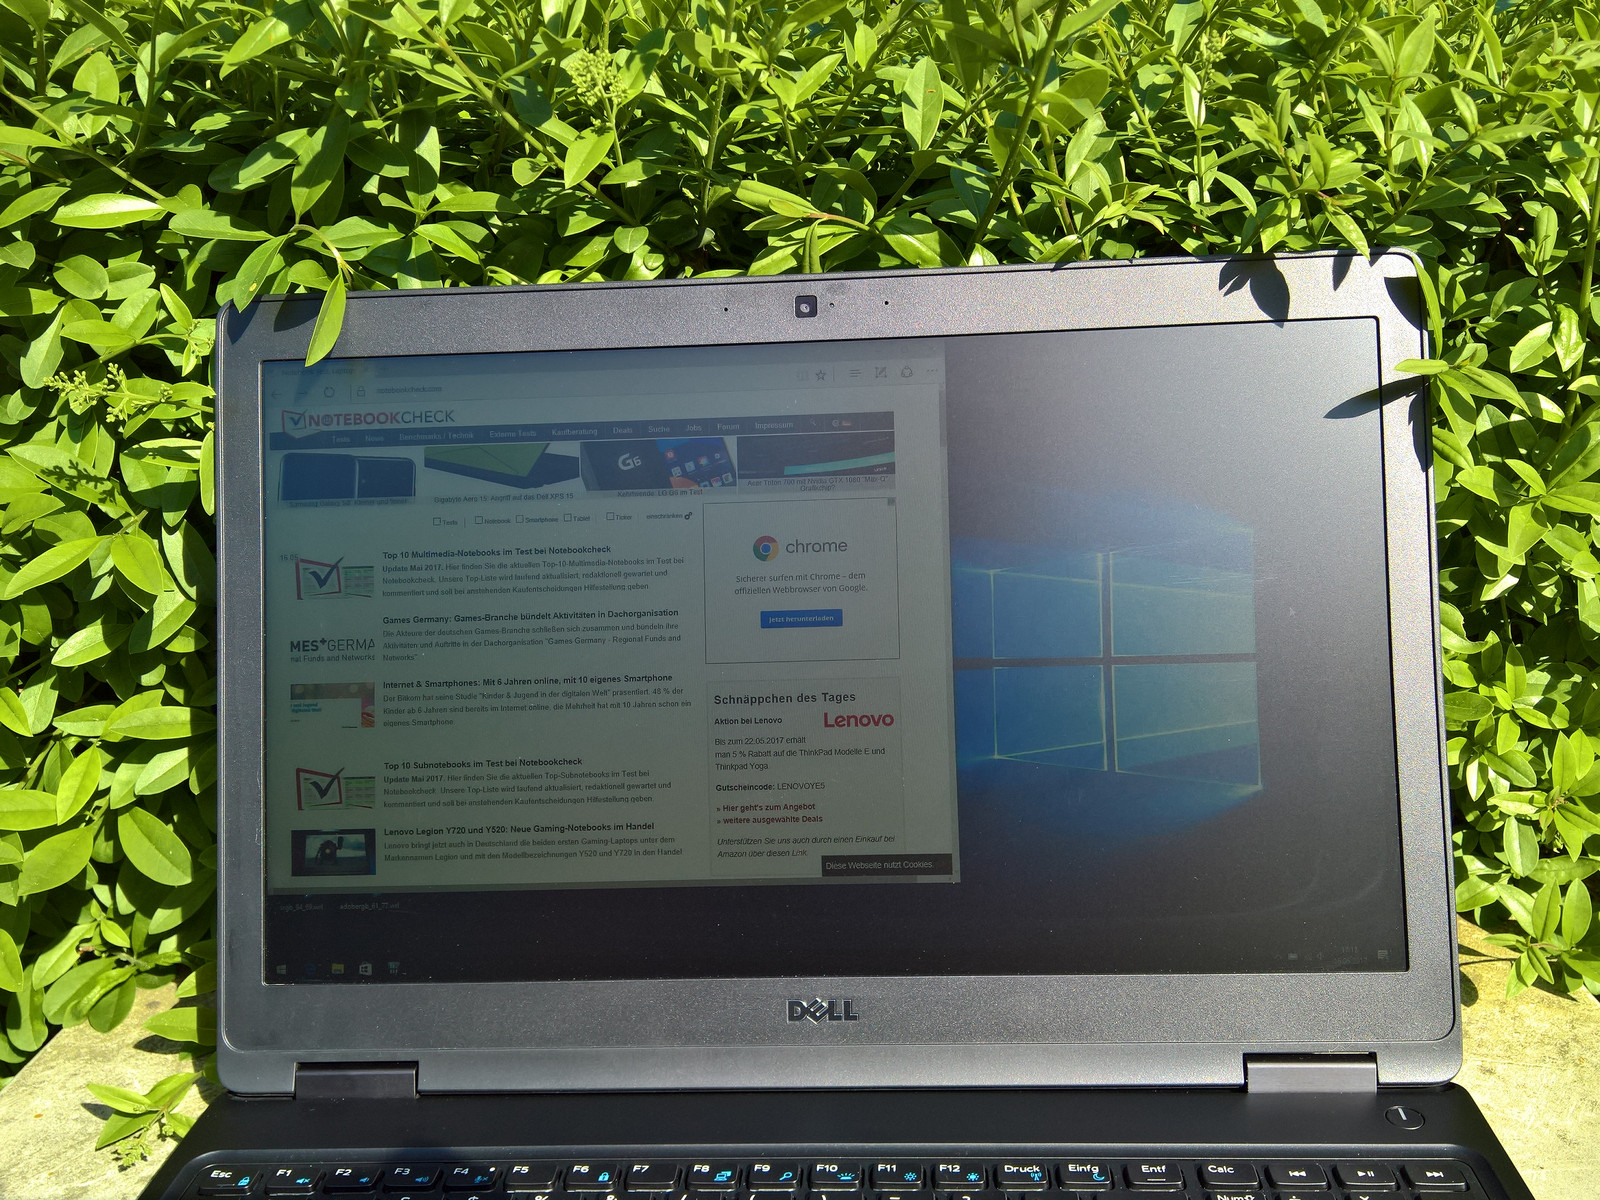
Brightness Distribution: 88 %
Center on Battery: 346 cd/m²
Contrast: 932:1 (Black: 0.37 cd/m²)
ΔE ColorChecker Calman: 5 | ∀{0.5-29.43 Ø4.71}
ΔE Greyscale Calman: 6.2 | ∀{0.09-98 Ø4.96}
94.7% sRGB (Argyll 1.6.3 3D)
61.8% AdobeRGB 1998 (Argyll 1.6.3 3D)
69.3% AdobeRGB 1998 (Argyll 3D)
94.8% sRGB (Argyll 3D)
72.7% Display P3 (Argyll 3D)
Gamma: 2.35
CCT: 6702 K
| Dell Precision 3520 1920x1080, 15.6" | Dell Precision 3510 LGD04AF, K96D2_156WHU, , 1366x768, 15.6" | Dell Precision 5520 UHD SHP1476, , 3840x2160, 15.6" | Lenovo ThinkPad P50 LP156WF6-SPK1, , 1920x1080, 15.6" | HP ZBook 15 G3 Samsung SDC5344, , 1920x1080, 15.6" | Lenovo ThinkPad T570-20HAS01E00 BOE NV156QUM-N44, , 3840x2160, 15.6" | |
|---|---|---|---|---|---|---|
| Display | -38% | -1% | -42% | -2% | -4% | |
| Display P3 Coverage (%) | 72.7 | 41.48 -43% | 67.4 -7% | 39.13 -46% | 66.8 -8% | 70 -4% |
| sRGB Coverage (%) | 94.8 | 62.4 -34% | 98.5 4% | 58.5 -38% | 95.5 1% | 91.1 -4% |
| AdobeRGB 1998 Coverage (%) | 69.3 | 42.86 -38% | 68.9 -1% | 40.45 -42% | 69 0% | 66.7 -4% |
| Response Times | 1% | -22% | 14% | -8% | 35% | |
| Response Time Grey 50% / Grey 80% * (ms) | 48 ? | 56 ? -17% | 59.2 ? -23% | 46 ? 4% | 54 ? -13% | 41.6 ? 13% |
| Response Time Black / White * (ms) | 34.4 ? | 28 ? 19% | 41.6 ? -21% | 26 ? 24% | 35.6 ? -3% | 15.2 ? 56% |
| PWM Frequency (Hz) | 1064 ? | 198 ? | 926 ? | |||
| Screen | -41% | 10% | -6% | -6% | 3% | |
| Brightness middle (cd/m²) | 345 | 199 -42% | 372.4 8% | 263 -24% | 306 -11% | 339 -2% |
| Brightness (cd/m²) | 329 | 201 -39% | 368 12% | 236 -28% | 289 -12% | 314 -5% |
| Brightness Distribution (%) | 88 | 83 -6% | 90 2% | 78 -11% | 85 -3% | 89 1% |
| Black Level * (cd/m²) | 0.37 | 0.4 -8% | 0.48 -30% | 0.34 8% | 0.34 8% | 0.36 3% |
| Contrast (:1) | 932 | 498 -47% | 776 -17% | 774 -17% | 900 -3% | 942 1% |
| Colorchecker dE 2000 * | 5 | 9 -80% | 2.6 48% | 2.35 53% | 5.1 -2% | 4.2 16% |
| Colorchecker dE 2000 max. * | 8 | 13.3 -66% | 5.6 30% | 9.9 -24% | 7.8 2% | |
| Greyscale dE 2000 * | 6.2 | 9.6 -55% | 3.7 40% | 3.33 46% | 7.4 -19% | 5.1 18% |
| Gamma | 2.35 94% | 2.41 91% | 2.14 103% | 2.38 92% | 2.37 93% | 2.16 102% |
| CCT | 6702 97% | 10695 61% | 7096 92% | 6917 94% | 7263 89% | 6569 99% |
| Color Space (Percent of AdobeRGB 1998) (%) | 61.8 | 39.6 -36% | 63 2% | 37 -40% | 63 2% | 59.4 -4% |
| Color Space (Percent of sRGB) (%) | 94.7 | 62.4 -34% | 99 5% | 58 -39% | 95 0% | 91 -4% |
| Total Average (Program / Settings) | -26% /
-35% | -4% /
3% | -11% /
-11% | -5% /
-6% | 11% /
6% |
* ... smaller is better
Screen Flickering / PWM (Pulse-Width Modulation)
| Screen flickering / PWM detected | 1064 Hz | ≤ 90 % brightness setting | 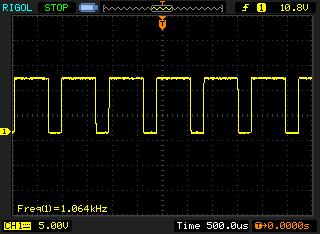 |
The display backlight flickers at 1064 Hz (worst case, e.g., utilizing PWM) Flickering detected at a brightness setting of 90 % and below. There should be no flickering or PWM above this brightness setting. The frequency of 1064 Hz is quite high, so most users sensitive to PWM should not notice any flickering. In comparison: 52 % of all tested devices do not use PWM to dim the display. If PWM was detected, an average of 7754 (minimum: 5 - maximum: 343500) Hz was measured. | |||
Display Response Times
| ↔ Response Time Black to White | ||
|---|---|---|
| 34.4 ms ... rise ↗ and fall ↘ combined | ↗ 17.2 ms rise | 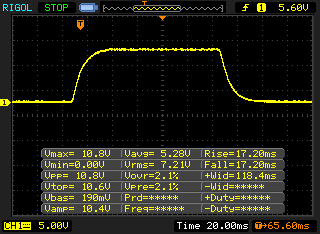 |
| ↘ 17.2 ms fall | ||
| The screen shows slow response rates in our tests and will be unsatisfactory for gamers. In comparison, all tested devices range from 0.1 (minimum) to 240 (maximum) ms. » 92 % of all devices are better. This means that the measured response time is worse than the average of all tested devices (19.8 ms). | ||
| ↔ Response Time 50% Grey to 80% Grey | ||
| 48 ms ... rise ↗ and fall ↘ combined | ↗ 24.4 ms rise | 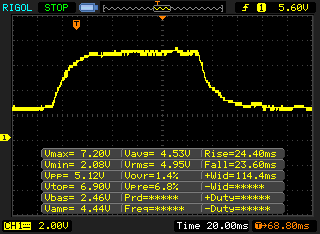 |
| ↘ 23.6 ms fall | ||
| The screen shows slow response rates in our tests and will be unsatisfactory for gamers. In comparison, all tested devices range from 0.165 (minimum) to 636 (maximum) ms. » 82 % of all devices are better. This means that the measured response time is worse than the average of all tested devices (31 ms). | ||
| Cinebench R15 | |
| CPU Single 64Bit | |
| Lenovo ThinkPad P51 20HH0016GE | |
| Dell Precision 5520 UHD | |
| Dell Precision 3520 | |
| HP ZBook 15 G3 | |
| Dell Precision 3510 | |
| Lenovo ThinkPad P50 | |
| CPU Multi 64Bit | |
| Lenovo ThinkPad P51 20HH0016GE | |
| Dell Precision 3520 | |
| HP ZBook 15 G3 | |
| Dell Precision 5520 UHD | |
| Dell Precision 3510 | |
| Lenovo ThinkPad P50 | |
| PCMark 8 | |
| Home Score Accelerated v2 | |
| Dell Precision 3510 | |
| Lenovo ThinkPad P50 | |
| Dell Precision 3520 | |
| HP ZBook 15 G3 | |
| Dell Precision 5520 UHD | |
| Work Score Accelerated v2 | |
| Dell Precision 3510 | |
| HP ZBook 15 G3 | |
| Dell Precision 3520 | |
| Lenovo ThinkPad P50 | |
| Dell Precision 5520 UHD | |
| PCMark 8 Home Score Accelerated v2 | 4183 points | |
| PCMark 8 Work Score Accelerated v2 | 5194 points | |
Help | ||
| Dell Precision 3520 Toshiba XG4 NVMe (THNSN5512GPUK) | Dell Precision 5520 UHD Samsung SM961 MZVKW512HMJP m.2 PCI-e | HP ZBook 15 G3 Samsung SM951 MZVPV512HDGL m.2 PCI-e | Lenovo ThinkPad T570-20HAS01E00 Samsung PM961 NVMe MZVLW512HMJP | Lenovo ThinkPad P51 20HH0016GE Samsung PM961 NVMe MZVLW512HMJP | |
|---|---|---|---|---|---|
| CrystalDiskMark 3.0 | 87% | 86% | 43% | 79% | |
| Read Seq (MB/s) | 1096 | 2253 106% | 1502 37% | 1210 10% | 1705 56% |
| Write Seq (MB/s) | 476.3 | 1662 249% | 1538 223% | 1134 138% | 1541 224% |
| Read 512 (MB/s) | 829 | 459.1 -45% | 1164 40% | 789 -5% | 1038 25% |
| Write 512 (MB/s) | 456.1 | 1611 253% | 1432 214% | 903 98% | 1157 154% |
| Read 4k (MB/s) | 35.2 | 56.1 59% | 59.1 68% | 58.4 66% | 61.3 74% |
| Write 4k (MB/s) | 128 | 169.4 32% | 207.3 62% | 144.1 13% | 176 38% |
| Read 4k QD32 (MB/s) | 552 | 633 15% | 798 45% | 559 1% | 664 20% |
| Write 4k QD32 (MB/s) | 396.1 | 506 28% | 393.8 -1% | 474.4 20% | 560 41% |

| LuxMark v2.0 64Bit | |
| Room GPUs-only | |
| Dell Precision 5520 UHD | |
| HP ZBook 15 G3 | |
| Dell Precision 3520 | |
| Lenovo ThinkPad P50 | |
| Lenovo ThinkPad P70-20ER000BMS | |
| Dell Precision 3510 | |
| Sala GPUs-only | |
| Dell Precision 5520 UHD | |
| HP ZBook 15 G3 | |
| Dell Precision 3520 | |
| Lenovo ThinkPad P50 | |
| Lenovo ThinkPad P70-20ER000BMS | |
| Dell Precision 3510 | |
| SiSoft Sandra 2016 | |
| Image Processing | |
| HP ZBook 15 G3 | |
| Lenovo ThinkPad P50 | |
| Dell Precision 3520 | |
| GP Cryptography (Higher Security AES256+SHA2-512) | |
| Lenovo ThinkPad P50 | |
| HP ZBook 15 G3 | |
| Dell Precision 3520 | |
| GP Financial Analysis (FP High/Double Precision) | |
| HP ZBook 15 G3 | |
| Lenovo ThinkPad P50 | |
| Dell Precision 3520 | |
| SPECviewperf 11 | |
| 1920x1080 Siemens NX | |
| Lenovo ThinkPad P50 | |
| HP ZBook 15 G3 | |
| Dell Precision 3520 | |
| Lenovo ThinkPad P70-20ER000BMS | |
| Dell Precision 3510 | |
| 1920x1080 Tcvis | |
| HP ZBook 15 G3 | |
| Lenovo ThinkPad P50 | |
| Dell Precision 3520 | |
| Lenovo ThinkPad P70-20ER000BMS | |
| Dell Precision 3510 | |
| 1920x1080 SolidWorks | |
| Dell Precision 3520 | |
| HP ZBook 15 G3 | |
| Lenovo ThinkPad P70-20ER000BMS | |
| Lenovo ThinkPad P50 | |
| Dell Precision 3510 | |
| 1920x1080 Pro/ENGINEER | |
| HP ZBook 15 G3 | |
| Dell Precision 3520 | |
| Lenovo ThinkPad P50 | |
| Lenovo ThinkPad P70-20ER000BMS | |
| Dell Precision 3510 | |
| 1920x1080 Maya | |
| HP ZBook 15 G3 | |
| Lenovo ThinkPad P50 | |
| Dell Precision 3520 | |
| Lenovo ThinkPad P70-20ER000BMS | |
| Dell Precision 3510 | |
| 1920x1080 Lightwave | |
| Dell Precision 3520 | |
| Lenovo ThinkPad P70-20ER000BMS | |
| HP ZBook 15 G3 | |
| Lenovo ThinkPad P50 | |
| Dell Precision 3510 | |
| 1920x1080 Ensight | |
| HP ZBook 15 G3 | |
| Lenovo ThinkPad P50 | |
| Dell Precision 3520 | |
| Lenovo ThinkPad P70-20ER000BMS | |
| Dell Precision 3510 | |
| 1920x1080 Catia | |
| Lenovo ThinkPad P50 | |
| HP ZBook 15 G3 | |
| Dell Precision 3520 | |
| Lenovo ThinkPad P70-20ER000BMS | |
| Dell Precision 3510 | |
| Unigine Heaven 2.1 - 1280x1024 high, Tesselation (normal), DirectX11 AA:off AF:1x | |
| Lenovo ThinkPad P50 | |
| HP ZBook 15 G3 | |
| Dell Precision 3520 | |
| Dell Precision 3510 | |
| Unigine Valley 1.0 | |
| 1920x1080 Extreme HD DirectX AA:x8 | |
| Lenovo ThinkPad P50 | |
| HP ZBook 15 G3 | |
| Dell Precision 3520 | |
| 1920x1080 Extreme HD Preset OpenGL AA:x8 | |
| HP ZBook 15 G3 | |
| Dell Precision 3520 | |
| Lenovo ThinkPad P50 | |
| 3DMark 11 - 1280x720 Performance GPU | |
| Lenovo ThinkPad P50 | |
| Dell Precision 5520 UHD | |
| HP ZBook 15 G3 | |
| Dell Precision 3520 | |
| Lenovo ThinkPad P70-20ER000BMS | |
| 3DMark | |
| 1280x720 Cloud Gate Standard Graphics | |
| Lenovo ThinkPad P50 | |
| HP ZBook 15 G3 | |
| Dell Precision 5520 UHD | |
| Dell Precision 3520 | |
| Lenovo ThinkPad P70-20ER000BMS | |
| Dell Precision 3510 | |
| 1920x1080 Fire Strike Graphics | |
| Dell Precision 5520 UHD | |
| Lenovo ThinkPad P50 | |
| HP ZBook 15 G3 | |
| Dell Precision 3520 | |
| Lenovo ThinkPad P70-20ER000BMS | |
| Dell Precision 3510 | |
| 1280x720 Ice Storm Standard Graphics | |
| Dell Precision 3520 | |
| HP ZBook 15 G3 | |
| Lenovo ThinkPad P50 | |
| Lenovo ThinkPad P70-20ER000BMS | |
| Dell Precision 5520 UHD | |
| Unigine Heaven 4.0 | |
| Extreme Preset OpenGL | |
| Lenovo ThinkPad P70-20ER000BMS | |
| Dell Precision 3520 | |
| Extreme Preset DX11 | |
| Lenovo ThinkPad P70-20ER000BMS | |
| Dell Precision 3520 | |
| 3DMark 06 Standard Score | 24751 points | |
| 3DMark Vantage P Result | 17237 points | |
| 3DMark 11 Performance | 4200 points | |
| 3DMark Ice Storm Standard Score | 103599 points | |
| 3DMark Cloud Gate Standard Score | 15759 points | |
| 3DMark Fire Strike Score | 3059 points | |
Help | ||
| BioShock Infinite - 1366x768 High Preset | |
| Dell Precision 5520 UHD | |
| HP ZBook 15 G3 | |
| Lenovo ThinkPad P50 | |
| Dell Precision 3520 | |
| Lenovo ThinkPad P70-20ER000BMS | |
| Lenovo ThinkPad T570-20HAS01E00 | |
| Rise of the Tomb Raider - 1920x1080 High Preset AA:FX AF:4x | |
| HP ZBook 15 G3 | |
| Dell Precision 3520 | |
| Lenovo ThinkPad P70-20ER000BMS | |
| Star Wars Battlefront - 1920x1080 Ultra Preset AA:FX | |
| Lenovo ThinkPad P50 | |
| Dell Precision 3520 | |
| Lenovo ThinkPad P70-20ER000BMS | |
| low | med. | high | ultra | |
|---|---|---|---|---|
| BioShock Infinite (2013) | 176.4 | 105.6 | 92.3 | 35.6 |
| GRID 2 (2013) | 192.8 | 147.4 | 126 | 39.1 |
| Company of Heroes 2 (2013) | 51.7 | 44.4 | 27.1 | 11.7 |
| Total War: Rome II (2013) | 190.5 | 139.6 | 114.4 | 17.8 |
| Dirt Rally (2015) | 249 | 118.5 | 62 | 28.2 |
| The Witcher 3 (2015) | 53.9 | 32.83 | 18.62 | 10 |
| Star Wars Battlefront (2015) | 110.6 | 64.3 | 28.92 | 24.37 |
| Rise of the Tomb Raider (2016) | 62.2 | 36.6 | 20.4 | |
| Doom (2016) | 60.4 | 46.3 | 25.2 | 19.5 |
| Warhammer 40.000: Dawn of War III (2017) | 70.3 | 18.7 |
Noise level
| Idle |
| 29.6 / 29.6 / 31.2 dB(A) |
| Load |
| 43 / 46.9 dB(A) |
 | ||
30 dB silent 40 dB(A) audible 50 dB(A) loud |
||
min: | ||
(-) The maximum temperature on the upper side is 45.8 °C / 114 F, compared to the average of 38.2 °C / 101 F, ranging from 22.2 to 69.8 °C for the class Workstation.
(-) The bottom heats up to a maximum of 57.1 °C / 135 F, compared to the average of 41.1 °C / 106 F
(+) In idle usage, the average temperature for the upper side is 23.7 °C / 75 F, compared to the device average of 32 °C / 90 F.
(±) Playing The Witcher 3, the average temperature for the upper side is 32 °C / 90 F, compared to the device average of 32 °C / 90 F.
(+) The palmrests and touchpad are reaching skin temperature as a maximum (34.1 °C / 93.4 F) and are therefore not hot.
(-) The average temperature of the palmrest area of similar devices was 27.8 °C / 82 F (-6.3 °C / -11.4 F).
Dell Precision 3520 audio analysis
(+) | speakers can play relatively loud (85.6 dB)
Bass 100 - 315 Hz
(-) | nearly no bass - on average 16.2% lower than median
(±) | linearity of bass is average (7% delta to prev. frequency)
Mids 400 - 2000 Hz
(±) | higher mids - on average 5.2% higher than median
(+) | mids are linear (3.9% delta to prev. frequency)
Highs 2 - 16 kHz
(+) | balanced highs - only 3.7% away from median
(+) | highs are linear (3.5% delta to prev. frequency)
Overall 100 - 16.000 Hz
(±) | linearity of overall sound is average (15.2% difference to median)
Compared to same class
» 33% of all tested devices in this class were better, 10% similar, 57% worse
» The best had a delta of 7%, average was 17%, worst was 35%
Compared to all devices tested
» 22% of all tested devices were better, 4% similar, 74% worse
» The best had a delta of 4%, average was 23%, worst was 134%
Apple MacBook 12 (Early 2016) 1.1 GHz audio analysis
(+) | speakers can play relatively loud (83.6 dB)
Bass 100 - 315 Hz
(±) | reduced bass - on average 11.3% lower than median
(±) | linearity of bass is average (14.2% delta to prev. frequency)
Mids 400 - 2000 Hz
(+) | balanced mids - only 2.4% away from median
(+) | mids are linear (5.5% delta to prev. frequency)
Highs 2 - 16 kHz
(+) | balanced highs - only 2% away from median
(+) | highs are linear (4.5% delta to prev. frequency)
Overall 100 - 16.000 Hz
(+) | overall sound is linear (10.2% difference to median)
Compared to same class
» 7% of all tested devices in this class were better, 2% similar, 90% worse
» The best had a delta of 5%, average was 18%, worst was 53%
Compared to all devices tested
» 5% of all tested devices were better, 1% similar, 94% worse
» The best had a delta of 4%, average was 23%, worst was 134%
| Off / Standby | |
| Idle | |
| Load |
|
Key:
min: | |
| Dell Precision 3520 i7-7820HQ, Quadro M620, Toshiba XG4 NVMe (THNSN5512GPUK), IPS LED, 1920x1080, 15.6" | Dell Precision 3510 6700HQ, FirePro W5130M, Samsung SM951 MZVPV256HDGL m.2 PCI-e, TN LED, 1366x768, 15.6" | Dell Precision 5520 UHD E3-1505M v6, Quadro M1200, Samsung SM961 MZVKW512HMJP m.2 PCI-e, IPS, 3840x2160, 15.6" | Lenovo ThinkPad P50 6820HQ, Quadro M2000M, Samsung SSD PM871 MZNLN256HCHP, IPS, 1920x1080, 15.6" | HP ZBook 15 G3 E3-1505M v5, Quadro M2000M, Samsung SM951 MZVPV512HDGL m.2 PCI-e, UWVA-IPS, 1920x1080, 15.6" | |
|---|---|---|---|---|---|
| Power Consumption | 28% | -32% | 10% | -6% | |
| Idle Minimum * (Watt) | 5.8 | 4.2 28% | 8.9 -53% | 5.6 3% | 5.7 2% |
| Idle Average * (Watt) | 10.7 | 6.5 39% | 13.6 -27% | 8.6 20% | 12.2 -14% |
| Idle Maximum * (Watt) | 13.3 | 7.1 47% | 14.1 -6% | 9.3 30% | 12.6 5% |
| Load Average * (Watt) | 78.2 | 74.6 5% | 100.3 -28% | 89.5 -14% | 83.1 -6% |
| Witcher 3 ultra * (Watt) | 58.8 | 100.2 -70% | |||
| Load Maximum * (Watt) | 116 | 92.2 21% | 126.3 -9% | 105 9% | 138.2 -19% |
* ... smaller is better
| Dell Precision 3520 i7-7820HQ, Quadro M620, 68 Wh | Dell Precision 3510 6700HQ, FirePro W5130M, 84 Wh | Dell Precision 5520 UHD E3-1505M v6, Quadro M1200, 97 Wh | HP ZBook 15 G3 E3-1505M v5, Quadro M2000M, 90 Wh | Lenovo ThinkPad T570-20HAS01E00 i7-7500U, GeForce 940MX, 56 Wh | Lenovo ThinkPad P50 6820HQ, Quadro M2000M, 90 Wh | |
|---|---|---|---|---|---|---|
| Battery runtime | 30% | -32% | -1% | 24% | 13% | |
| Reader / Idle (h) | 16.6 | 19.5 17% | 12.1 -27% | 13.7 -17% | 13.3 -20% | 14.3 -14% |
| H.264 (h) | 8.1 | 10.1 25% | 7.5 -7% | 8.1 0% | 8.9 10% | |
| WiFi v1.3 (h) | 7.6 | 9.9 30% | 4.2 -45% | 6.4 -16% | 6.9 -9% | 8.3 9% |
| Load (h) | 1.3 | 1.9 46% | 1 -23% | 1.8 38% | 2.9 123% | 1.9 46% |
Pros
Cons
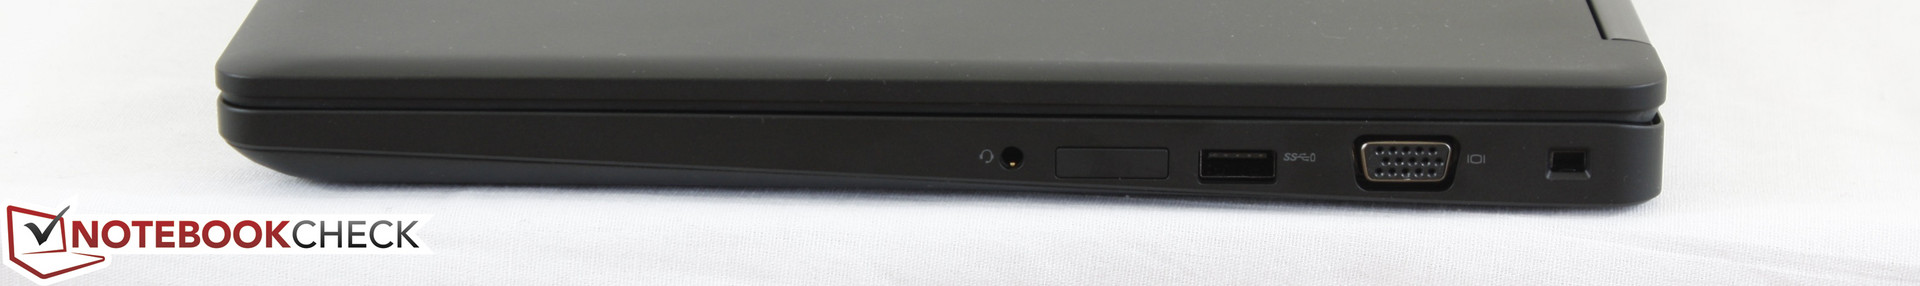
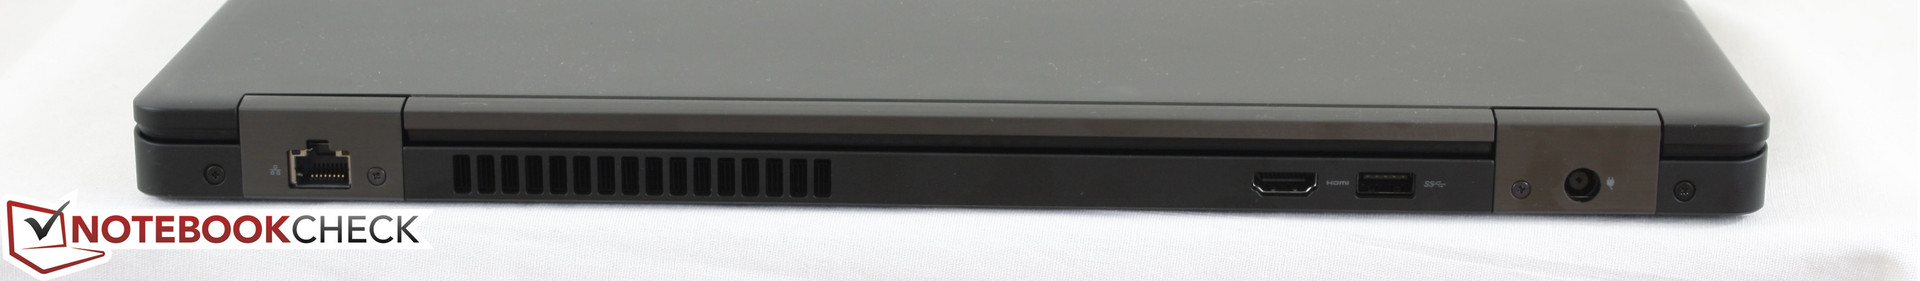
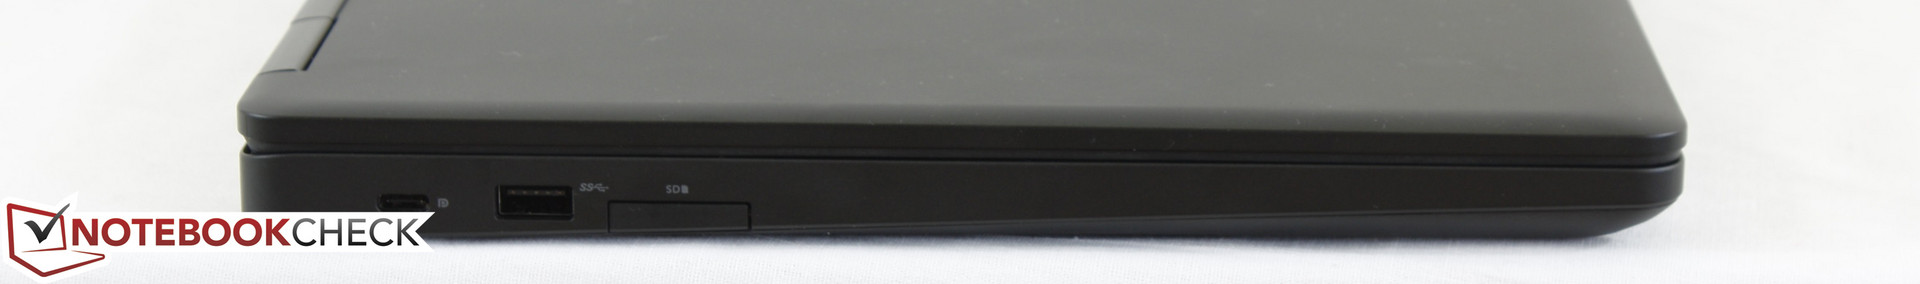
Precision 3520有不少加分点。首先,它的屏幕色彩艳丽且明亮,十分适合工作所需。而它的电池续航作为工作站设备也十分优秀,可选的92瓦时电池将可以带来更加出色的表现。物理接口的数量也足够需要。机身和输入设备也可以达到商务设备的标准,不过也不算完美。
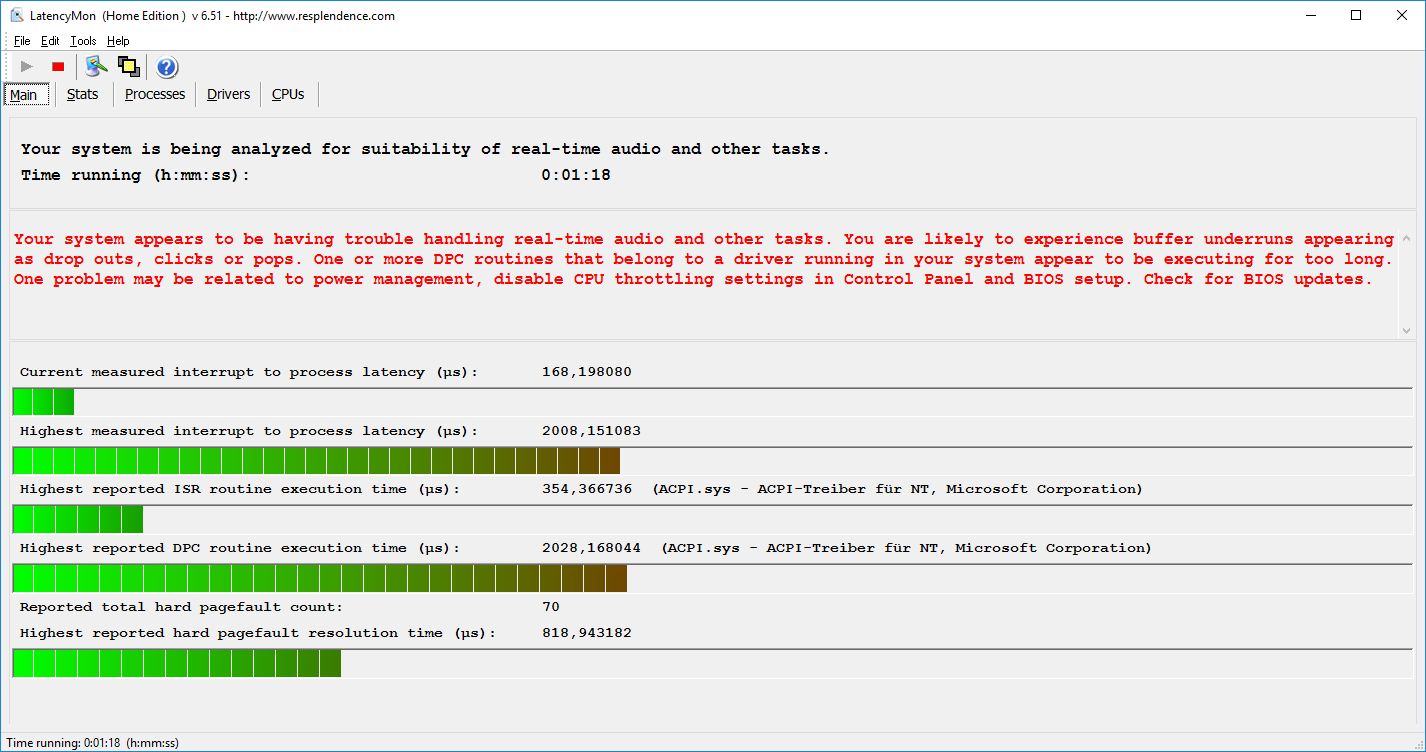
遗憾的是这台Precision在对于工作站来说最重要的方面表现欠佳:性能和噪音。对处理器的35瓦功耗限制可能已经会让一些用户感到不解,戴尔可能需要考虑设计一个更有效的散热系统,不过这对于一台实惠型工作站来说也不现实。我们怀疑如果搭配一颗性能较低的处理器会不会是更好的选择。在我们的压力测试中,这台设备的性能起伏较大,它的固件可能需要进一步调整更新。遗憾的是,对于风扇控制程序来说可能改善空间较小,即使是在低负载的情况下它也会持续运转。在基准测试后,用了很长时间风扇才渐渐开始减速。另外,3520还会发出电流声。
Precision 3520是一台性能不错的工作站设备,不过它还有不小的改进空间。
整体上,我们认为Precision 3520有不小的潜力。这台笔记本电脑性能十分优秀,同时具备优秀的性价比。但是,工作站设备依然十分昂贵。戴尔需要重新考虑他的设计,改善散热风扇系统和性能表现。如果它可以在这些方面得到改善,3520将会成为一台值得推荐的设备。
注:本文是基于完整评测的缩减版本,阅读完整的英文评测,请点击这里。
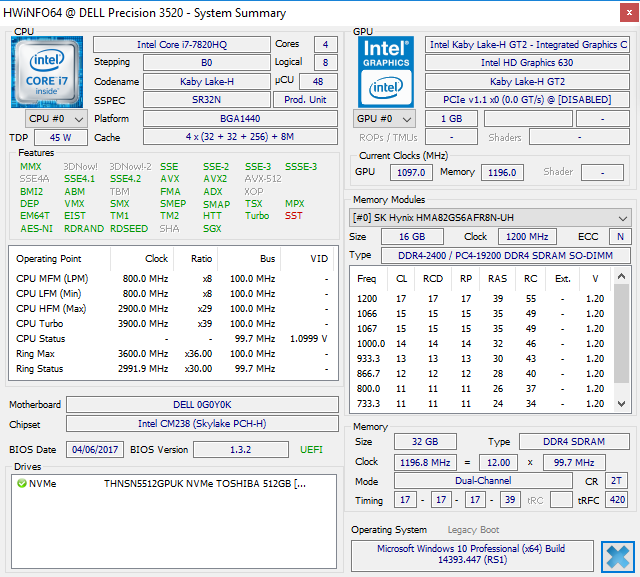
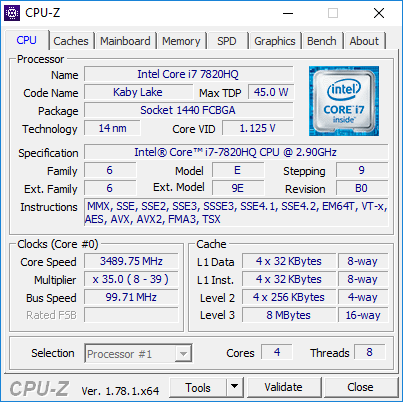
Dell Precision 3520
- 05/25/2017 v6 (old)
Benjamin Herzig
Price comparison
