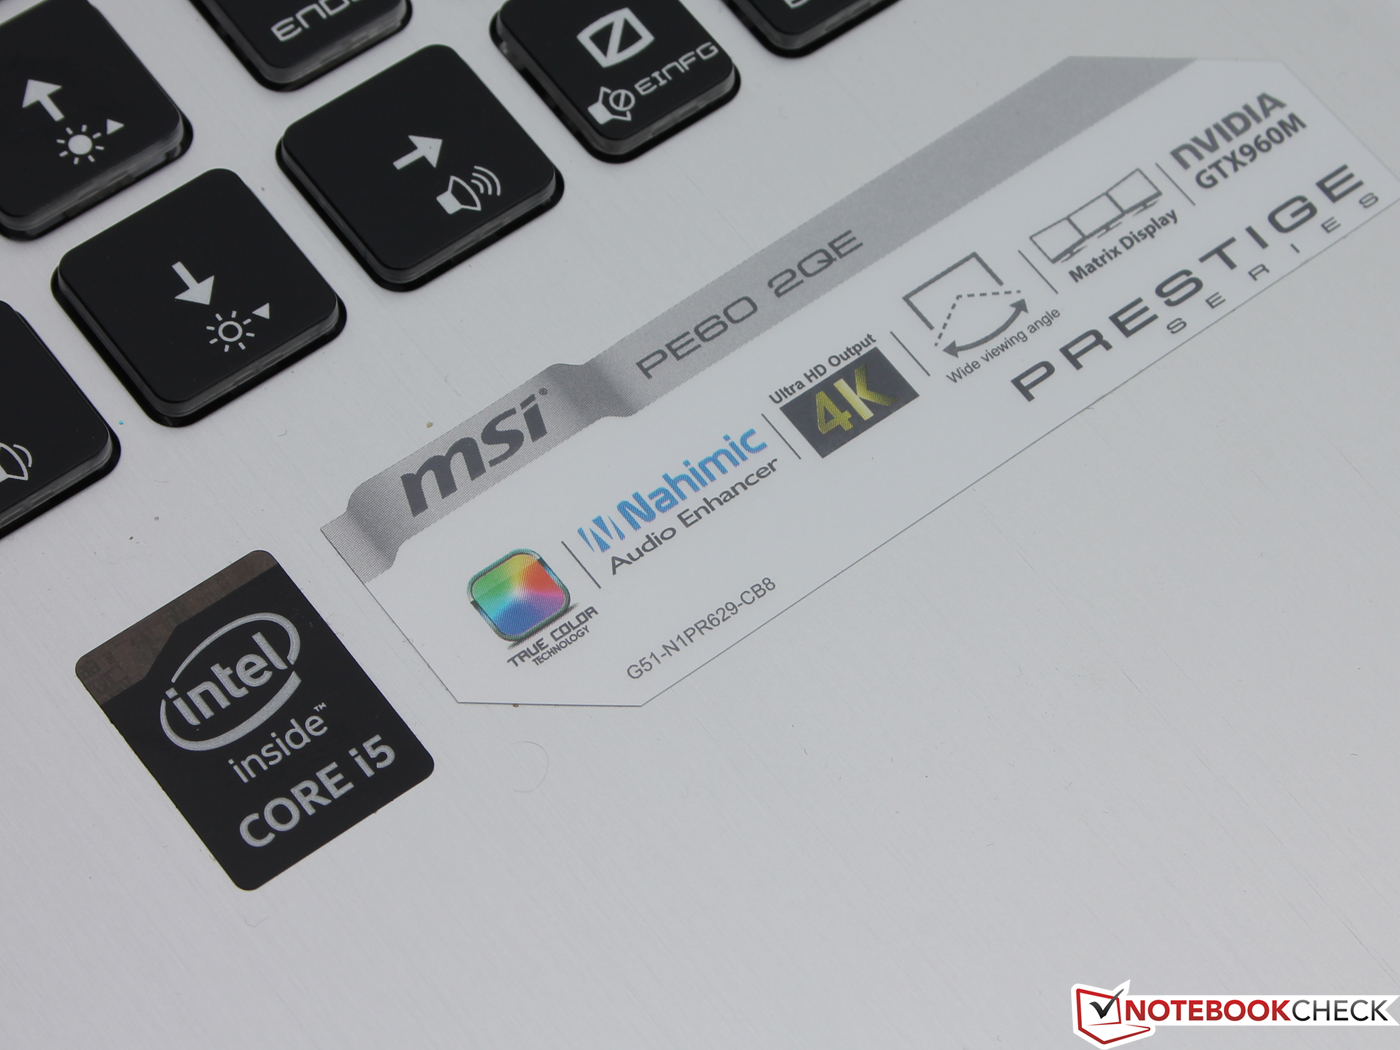
微星 PE60 2QE Prestige 笔记本电脑简短评测


| |||||||||||||||||||||||||
Brightness Distribution: 90 %
Center on Battery: 251 cd/m²
Contrast: 857:1 (Black: 0.35 cd/m²)
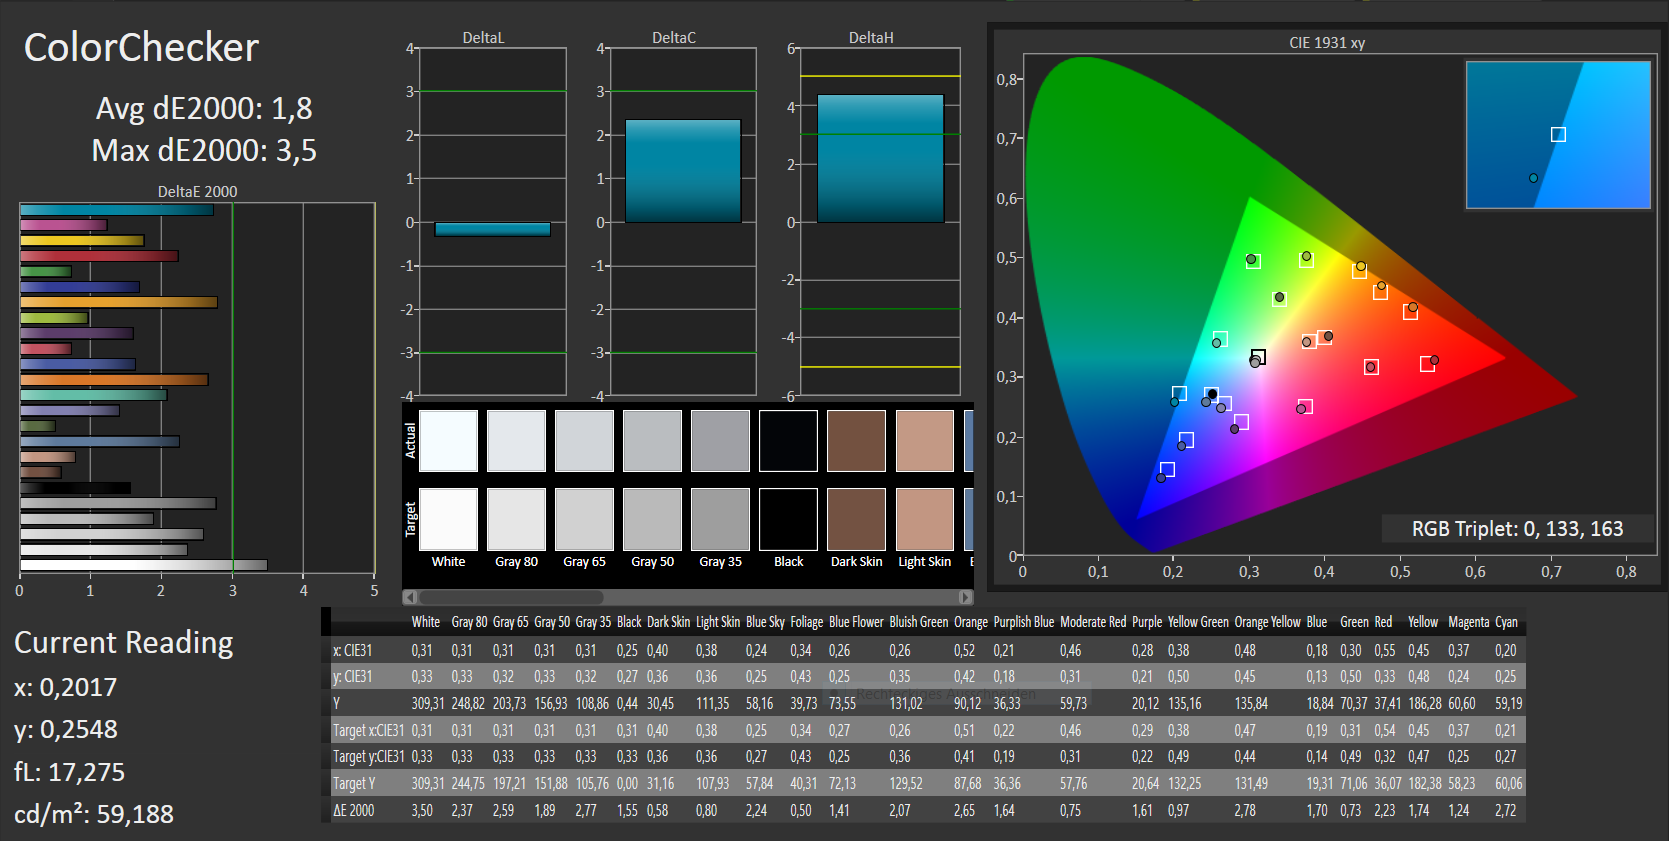
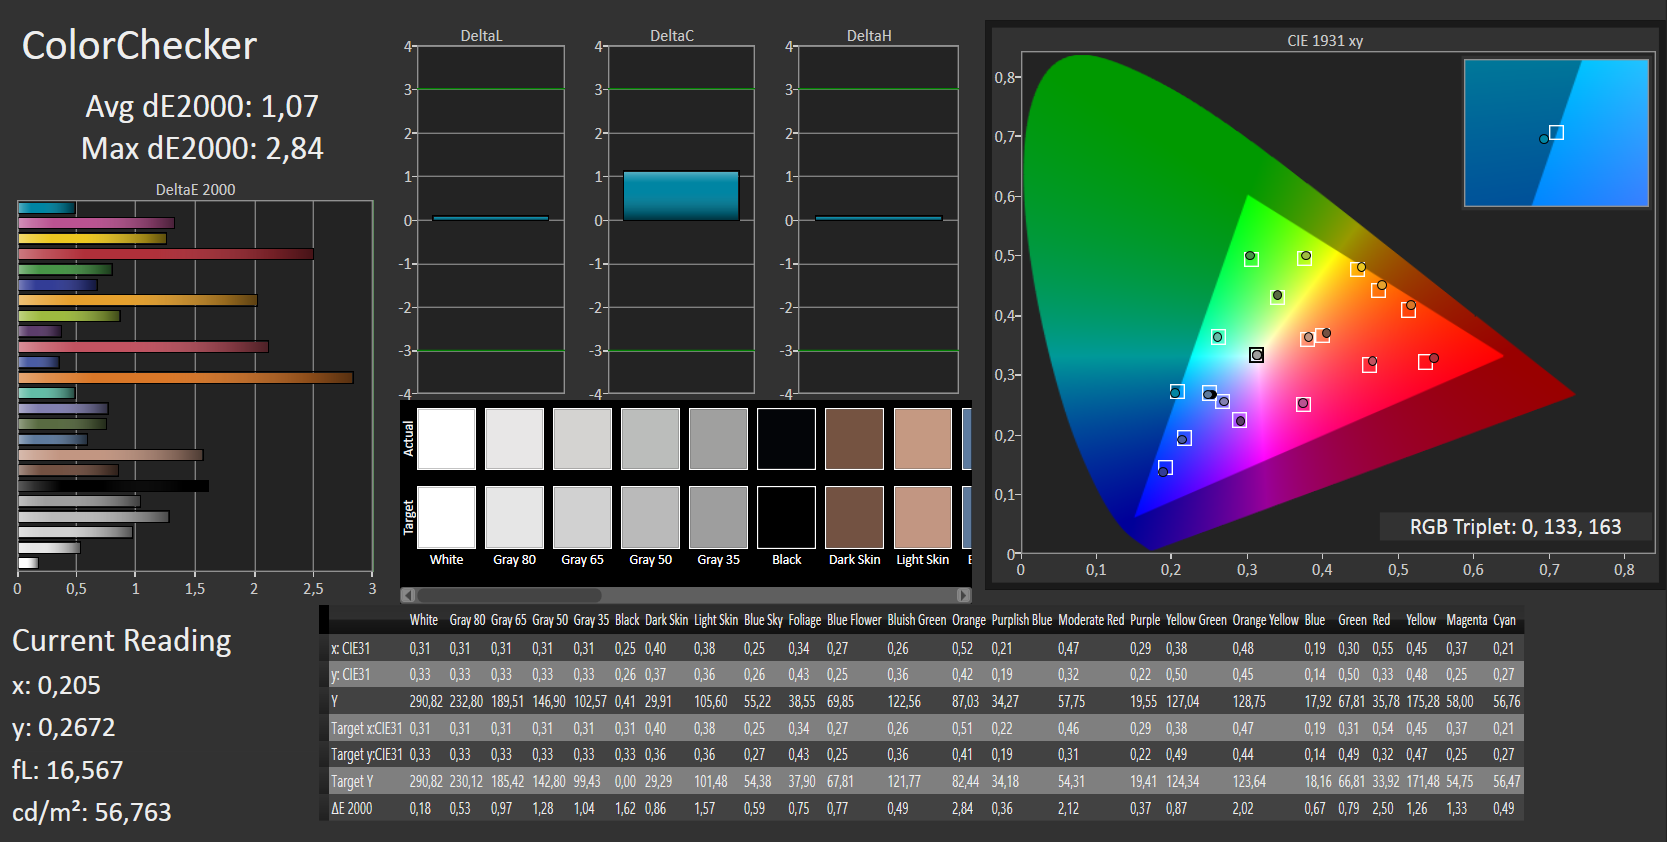
ΔE ColorChecker Calman: 1.8 | ∀{0.5-29.43 Ø4.73}
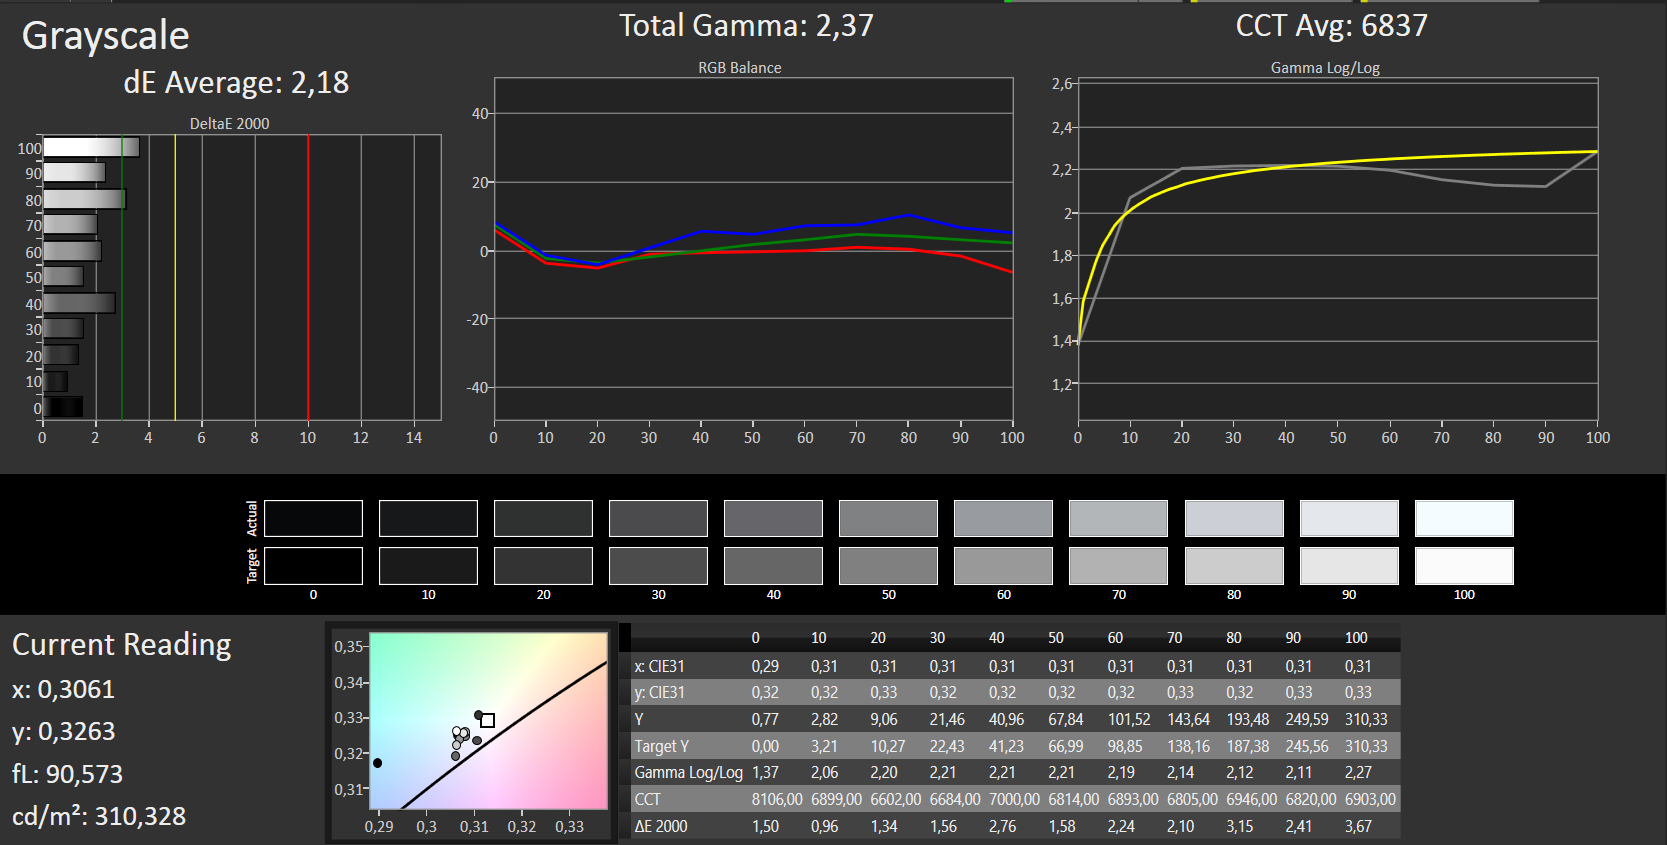
ΔE Greyscale Calman: 2.18 | ∀{0.09-98 Ø4.97}
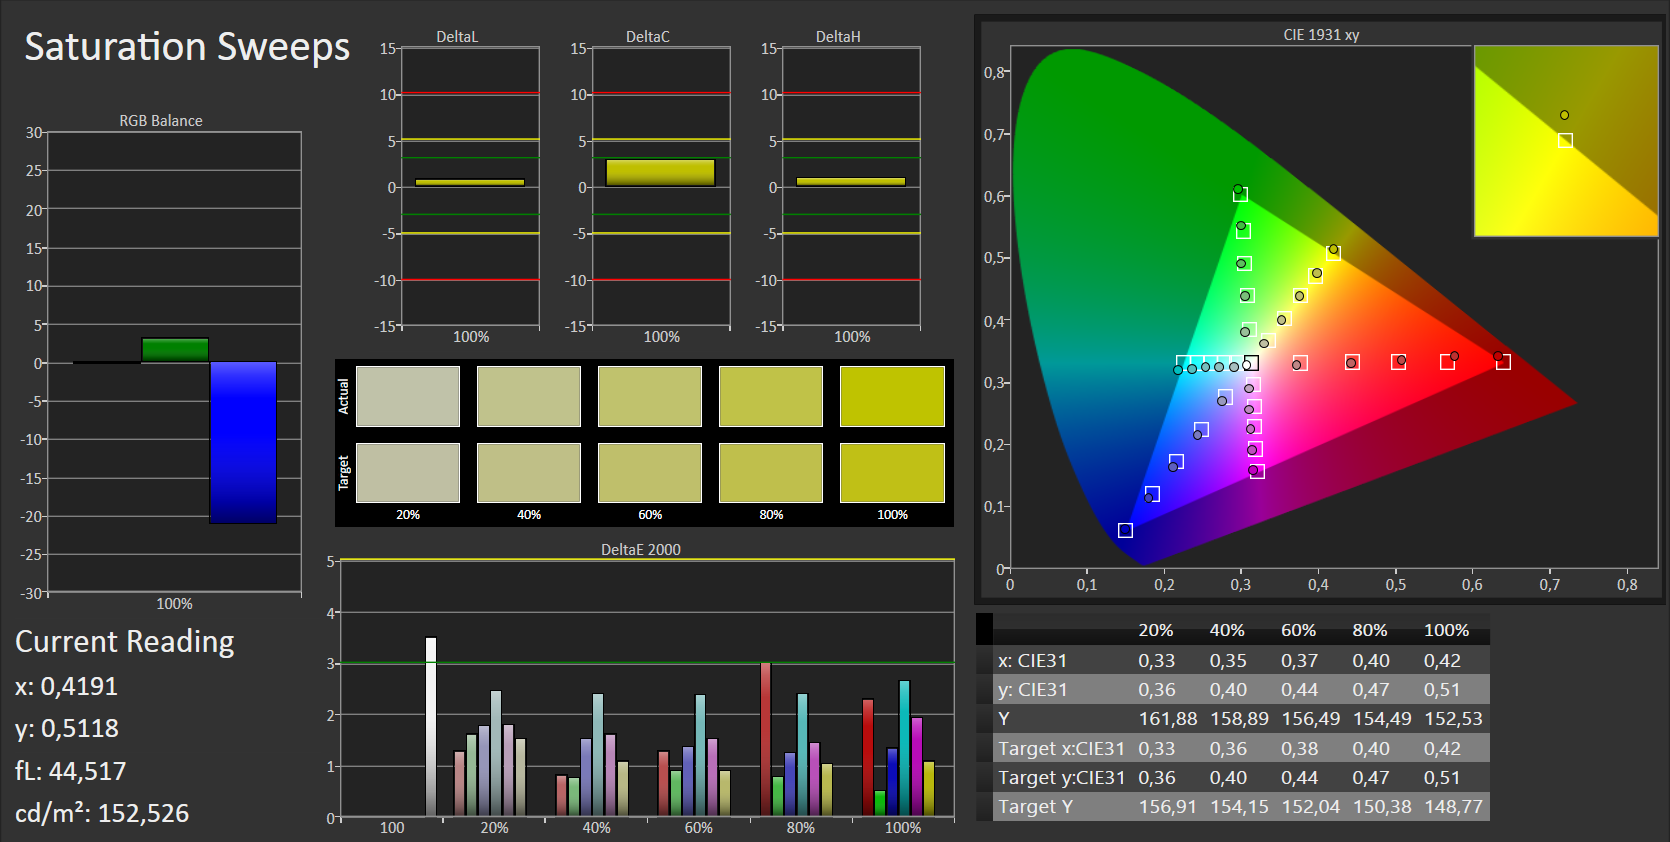
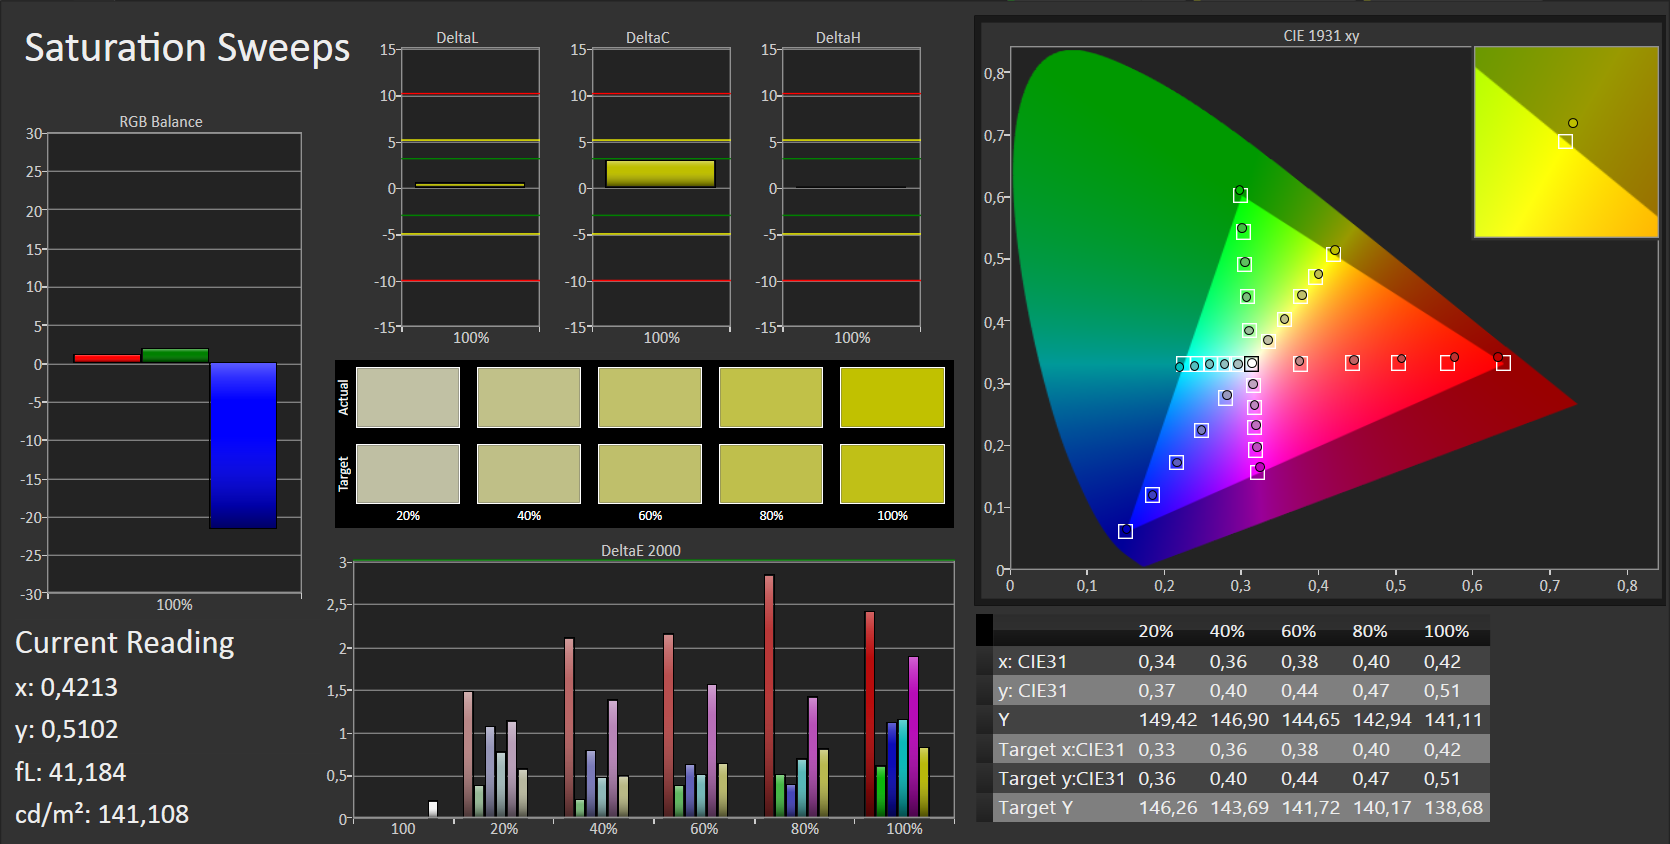
97% sRGB (Argyll 1.6.3 3D)
64% AdobeRGB 1998 (Argyll 1.6.3 3D)
69.8% AdobeRGB 1998 (Argyll 3D)
97% sRGB (Argyll 3D)
67.6% Display P3 (Argyll 3D)
Gamma: 2.37
CCT: 6837 K
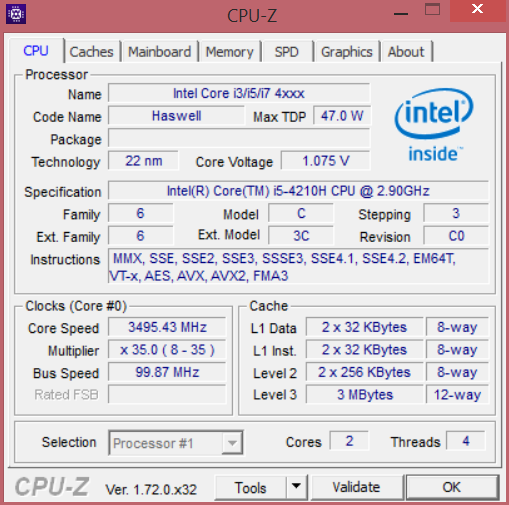
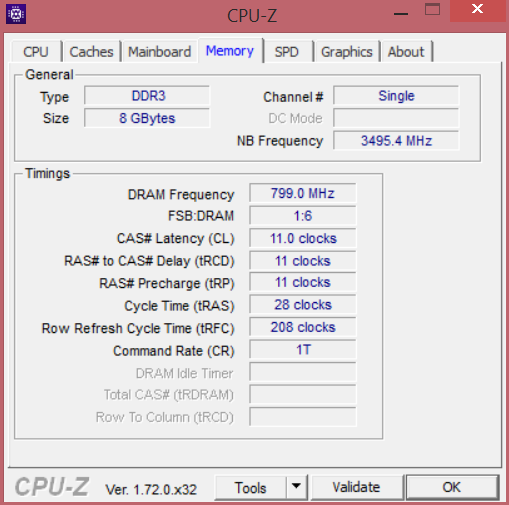
| MSI PE60-2QEi581 GeForce GTX 960M, 4210H, HGST Travelstar 7K1000 HTS721010A9E630 | Acer Aspire VN7-591G-727P GeForce GTX 960M, 4720HQ, Toshiba HG6 THNSNJ256G8NU | Asus N551JK-CN166H GeForce GTX 850M, 4200H, HGST Travelstar 5K1000 HTS541010A9E680 | Asus UX501JW-DS71T GeForce GTX 960M, 4720HQ, Samsung SSD SM951 512 GB MZHPV512HDGL | Toshiba Satellite P50t-B-10T Radeon R9 M265X, 4710HQ, Toshiba MQ01ABD100 | Dell XPS 15 (9530-0538) GeForce GT 750M, 4712HQ, Lite-On LMT-512L9M | |
|---|---|---|---|---|---|---|
| Display | -13% | -0% | -25% | -5% | -3% | |
| Display P3 Coverage (%) | 67.6 | 64.9 -4% | 67.3 0% | 50.2 -26% | 64.1 -5% | 64.9 -4% |
| sRGB Coverage (%) | 97 | 66.9 -31% | 96.7 0% | 75 -23% | 92.3 -5% | 96.1 -1% |
| AdobeRGB 1998 Coverage (%) | 69.8 | 66.9 -4% | 69.4 -1% | 51.8 -26% | 65.5 -6% | 66.9 -4% |
| Screen | -30% | -61% | -68% | 10% | -2% | |
| Brightness middle (cd/m²) | 300 | 322 7% | 323 8% | 278.1 -7% | 255 -15% | 349 16% |
| Brightness (cd/m²) | 282 | 325 15% | 312 11% | 281 0% | 248 -12% | 365 29% |
| Brightness Distribution (%) | 90 | 90 0% | 83 -8% | 89 -1% | 88 -2% | 87 -3% |
| Black Level * (cd/m²) | 0.35 | 0.37 -6% | 0.38 -9% | 0.293 16% | 0.18 49% | 0.282 19% |
| Contrast (:1) | 857 | 870 2% | 850 -1% | 949 11% | 1417 65% | 1238 44% |
| Colorchecker dE 2000 * | 1.8 | 3.77 -109% | 7.4 -311% | 8.78 -388% | 2 -11% | 2.65 -47% |
| Greyscale dE 2000 * | 2.18 | 5.36 -146% | 6.24 -186% | 6.29 -189% | 1.61 26% | 3.77 -73% |
| Gamma | 2.37 93% | 2.39 92% | 2.98 74% | 2.25 98% | 2.37 93% | 2.41 91% |
| CCT | 6837 95% | 7163 91% | 8098 80% | 6197 105% | 6462 101% | 6786 96% |
| Color Space (Percent of AdobeRGB 1998) (%) | 64 | 61 -5% | 69 8% | 48.31 -25% | 60 -6% | 61.02 -5% |
| Color Space (Percent of sRGB) (%) | 97 | 72.54 -25% | 92.1 -5% | 96.1 -1% | ||
| Total Average (Program / Settings) | -22% /
-26% | -31% /
-44% | -47% /
-57% | 3% /
6% | -3% /
-3% |
* ... smaller is better
| Cinebench R11.5 | |
| CPU Single 64Bit (sort by value) | |
| MSI PE60-2QEi581 | |
| Acer Aspire VN7-591G-727P | |
| Asus N551JK-CN166H | |
| Asus UX501JW-DS71T | |
| Toshiba Satellite P50t-B-10T | |
| Dell XPS 15 (9530-0538) | |
| CPU Multi 64Bit (sort by value) | |
| MSI PE60-2QEi581 | |
| Acer Aspire VN7-591G-727P | |
| Asus N551JK-CN166H | |
| Asus UX501JW-DS71T | |
| Toshiba Satellite P50t-B-10T | |
| Dell XPS 15 (9530-0538) | |
| Cinebench R15 | |
| CPU Single 64Bit (sort by value) | |
| MSI PE60-2QEi581 | |
| Acer Aspire VN7-591G-727P | |
| Asus N551JK-CN166H | |
| Asus UX501JW-DS71T | |
| Toshiba Satellite P50t-B-10T | |
| Dell XPS 15 (9530-0538) | |
| CPU Multi 64Bit (sort by value) | |
| MSI PE60-2QEi581 | |
| Acer Aspire VN7-591G-727P | |
| Asus N551JK-CN166H | |
| Asus UX501JW-DS71T | |
| Toshiba Satellite P50t-B-10T | |
| Dell XPS 15 (9530-0538) | |
| MSI PE60-2QEi581 GeForce GTX 960M, 4210H, HGST Travelstar 7K1000 HTS721010A9E630 | Acer Aspire VN7-591G-727P GeForce GTX 960M, 4720HQ, Toshiba HG6 THNSNJ256G8NU | Asus N551JK-CN166H GeForce GTX 850M, 4200H, HGST Travelstar 5K1000 HTS541010A9E680 | Asus UX501JW-DS71T GeForce GTX 960M, 4720HQ, Samsung SSD SM951 512 GB MZHPV512HDGL | Toshiba Satellite P50t-B-10T Radeon R9 M265X, 4710HQ, Toshiba MQ01ABD100 | Dell XPS 15 (9530-0538) GeForce GT 750M, 4712HQ, Lite-On LMT-512L9M | |
|---|---|---|---|---|---|---|
| PCMark 7 | 83% | 29% | 86% | 25% | 47% | |
| Score (Points) | 3275 | 5804 77% | 4131 26% | 6087 86% | 5010 53% | 5549 69% |
| Productivity (Points) | 2014 | 5144 155% | 3494 73% | 2035 1% | 2782 38% | |
| Creativity (Points) | 6313 | 10418 65% | 7266 15% | 7924 26% | 10028 59% | |
| Computation (Points) | 14944 | 19805 33% | 15092 1% | 17704 18% | 17929 20% | |
| PCMark 8 | -9% | -4% | -4% | 9% | ||
| Work Score Accelerated v2 (Points) | 4169 | 3601 -14% | 3881 -7% | 3944 -5% | ||
| Home Score Accelerated v2 (Points) | 3114 | 3019 -3% | 3113 0% | 3064 -2% | 3386 9% | |
| Total Average (Program / Settings) | 37% /
52% | 13% /
18% | 41% /
26% | 17% /
21% | 47% /
47% |
| PCMark 7 Score | 3275 points | |
| PCMark 8 Home Score Accelerated v2 | 3114 points | |
| PCMark 8 Work Score Accelerated v2 | 4169 points | |
Help | ||
| MSI PE60-2QEi581 GeForce GTX 960M, 4210H, HGST Travelstar 7K1000 HTS721010A9E630 | Acer Aspire VN7-591G-727P GeForce GTX 960M, 4720HQ, Toshiba HG6 THNSNJ256G8NU | Asus N551JK-CN166H GeForce GTX 850M, 4200H, HGST Travelstar 5K1000 HTS541010A9E680 | Asus UX501JW-DS71T GeForce GTX 960M, 4720HQ, Samsung SSD SM951 512 GB MZHPV512HDGL | Toshiba Satellite P50t-B-10T Radeon R9 M265X, 4710HQ, Toshiba MQ01ABD100 | Dell XPS 15 (9530-0538) GeForce GT 750M, 4712HQ, Lite-On LMT-512L9M | |
|---|---|---|---|---|---|---|
| CrystalDiskMark 3.0 | 1948% | -35% | 4343% | 2811% | ||
| Read 4k (MB/s) | 0.63 | 18.74 2875% | 0.326 -48% | 43.38 6786% | 32.41 5044% | |
| Write 4k (MB/s) | 1.2 | 54.2 4417% | 0.768 -36% | 107 8817% | 70.2 5750% | |
| Read Seq (MB/s) | 140.4 | 521 271% | 102.3 -27% | 1362 870% | 485.2 246% | |
| Write Seq (MB/s) | 140.1 | 460.2 228% | 102.3 -27% | 1400 899% | 425.4 204% |

| 3DMark 11 | |
| 1280x720 Performance (sort by value) | |
| MSI PE60-2QEi581 | |
| Acer Aspire VN7-591G-727P | |
| Asus N551JK-CN166H | |
| Asus UX501JW-DS71T | |
| Dell XPS 15 (9530-0538) | |
| 1280x720 Performance GPU (sort by value) | |
| MSI PE60-2QEi581 | |
| Acer Aspire VN7-591G-727P | |
| Asus N551JK-CN166H | |
| Asus UX501JW-DS71T | |
| Dell XPS 15 (9530-0538) | |
| 1280x720 Performance Physics (sort by value) | |
| MSI PE60-2QEi581 | |
| Acer Aspire VN7-591G-727P | |
| Asus N551JK-CN166H | |
| Asus UX501JW-DS71T | |
| Dell XPS 15 (9530-0538) | |
| 1280x720 Performance Combined (sort by value) | |
| MSI PE60-2QEi581 | |
| Acer Aspire VN7-591G-727P | |
| Asus N551JK-CN166H | |
| Asus UX501JW-DS71T | |
| Dell XPS 15 (9530-0538) | |
| 3DMark 11 Performance | 4999 points | |
| 3DMark Ice Storm Standard Score | 51289 points | |
| 3DMark Cloud Gate Standard Score | 10596 points | |
| 3DMark Fire Strike Score | 3778 points | |
Help | ||
| Alien: Isolation | |
| 1366x768 Medium, On (AA & SSAO Off), Shadow Map 1024 AF:4x (sort by value) | |
| MSI PE60-2QEi581 | |
| 1920x1080 High, On, Shadow Map 1536, Standard SSAO AA:FX AF:8x (sort by value) | |
| MSI PE60-2QEi581 | |
| 1920x1080 Ultra, On, Shadow Map 2048, HDAO AA:2x SM AF:16x (sort by value) | |
| MSI PE60-2QEi581 | |
| F1 2014 | |
| 1366x768 Medium Preset (sort by value) | |
| MSI PE60-2QEi581 | |
| Acer Aspire VN7-591G-727P | |
| 1920x1080 High Preset (sort by value) | |
| MSI PE60-2QEi581 | |
| Acer Aspire VN7-591G-727P | |
| 1920x1080 Ultra Preset AA:4x MS (sort by value) | |
| MSI PE60-2QEi581 | |
| Acer Aspire VN7-591G-727P | |
| Evolve | |
| 1366x768 Medium Graphics Quality (sort by value) | |
| MSI PE60-2QEi581 | |
| Acer Aspire VN7-591G-727P | |
| 1920x1080 High Graphics Quality AA:FX (sort by value) | |
| MSI PE60-2QEi581 | |
| Acer Aspire VN7-591G-727P | |
| 1920x1080 Very High Graphics Quality AA:1TX SM (sort by value) | |
| MSI PE60-2QEi581 | |
| Acer Aspire VN7-591G-727P | |
| low | med. | high | ultra | |
|---|---|---|---|---|
| Alien: Isolation (2014) | 109 | 62 | 46.5 | |
| F1 2014 (2014) | 83 | 72 | 62 | |
| Evolve (2015) | 65.6 | 35.5 | 31.1 |
| MSI PE60-2QEi581 GeForce GTX 960M, 4210H, HGST Travelstar 7K1000 HTS721010A9E630 | Acer Aspire VN7-591G-727P GeForce GTX 960M, 4720HQ, Toshiba HG6 THNSNJ256G8NU | Asus N551JK-CN166H GeForce GTX 850M, 4200H, HGST Travelstar 5K1000 HTS541010A9E680 | Asus UX501JW-DS71T GeForce GTX 960M, 4720HQ, Samsung SSD SM951 512 GB MZHPV512HDGL | Toshiba Satellite P50t-B-10T Radeon R9 M265X, 4710HQ, Toshiba MQ01ABD100 | Dell XPS 15 (9530-0538) GeForce GT 750M, 4712HQ, Lite-On LMT-512L9M | |
|---|---|---|---|---|---|---|
| Noise | 5% | 3% | 5% | 1% | 4% | |
| Idle Minimum * (dB) | 32.8 | 30 9% | 32.1 2% | 31.2 5% | 32.4 1% | 29.6 10% |
| Idle Average * (dB) | 32.8 | 32.2 2% | 32.9 -0% | 31.3 5% | 33.4 -2% | 31.6 4% |
| Idle Maximum * (dB) | 35.4 | 35 1% | 33.7 5% | 33.4 6% | 33.4 6% | 31.6 11% |
| Load Average * (dB) | 42.3 | 41.7 1% | 42 1% | 38.6 9% | 44.5 -5% | 45.4 -7% |
| Load Maximum * (dB) | 47.4 | 42.6 10% | 44.8 5% | 46.5 2% | 44.4 6% | 45.4 4% |
* ... smaller is better
Noise level
| Idle |
| 32.8 / 32.8 / 35.4 dB(A) |
| HDD |
| 33.6 dB(A) |
| DVD |
| 37.7 / dB(A) |
| Load |
| 42.3 / 47.4 dB(A) |
 | ||
30 dB silent 40 dB(A) audible 50 dB(A) loud |
||
min: | ||
| MSI PE60-2QEi581 GeForce GTX 960M, 4210H, HGST Travelstar 7K1000 HTS721010A9E630 | Acer Aspire VN7-591G-727P GeForce GTX 960M, 4720HQ, Toshiba HG6 THNSNJ256G8NU | Asus N551JK-CN166H GeForce GTX 850M, 4200H, HGST Travelstar 5K1000 HTS541010A9E680 | Asus UX501JW-DS71T GeForce GTX 960M, 4720HQ, Samsung SSD SM951 512 GB MZHPV512HDGL | Toshiba Satellite P50t-B-10T Radeon R9 M265X, 4710HQ, Toshiba MQ01ABD100 | Dell XPS 15 (9530-0538) GeForce GT 750M, 4712HQ, Lite-On LMT-512L9M | |
|---|---|---|---|---|---|---|
| Heat | -21% | 17% | -1% | 5% | -27% | |
| Maximum Upper Side * (°C) | 45.5 | 53 -16% | 39.4 13% | 42.2 7% | 43.5 4% | 51.8 -14% |
| Maximum Bottom * (°C) | 37.5 | 53.2 -42% | 37.6 -0% | 48.6 -30% | 46 -23% | 64.6 -72% |
| Idle Upper Side * (°C) | 35.8 | 38.6 -8% | 28.7 20% | 33.2 7% | 28 22% | 38.4 -7% |
| Idle Bottom * (°C) | 38.7 | 45.9 -19% | 26.1 33% | 34.4 11% | 32.8 15% | 44.4 -15% |
* ... smaller is better
(-) The maximum temperature on the upper side is 45.5 °C / 114 F, compared to the average of 36.8 °C / 98 F, ranging from 21 to 71 °C for the class Multimedia.
(+) The bottom heats up to a maximum of 37.5 °C / 100 F, compared to the average of 39.1 °C / 102 F
(±) In idle usage, the average temperature for the upper side is 32.2 °C / 90 F, compared to the device average of 31.3 °C / 88 F.
(±) The palmrests and touchpad can get very hot to the touch with a maximum of 38.8 °C / 101.8 F.
(-) The average temperature of the palmrest area of similar devices was 28.7 °C / 83.7 F (-10.1 °C / -18.1 F).
| MSI PE60-2QEi581 GeForce GTX 960M, 4210H, HGST Travelstar 7K1000 HTS721010A9E630 | Acer Aspire VN7-591G-727P GeForce GTX 960M, 4720HQ, Toshiba HG6 THNSNJ256G8NU | Asus N551JK-CN166H GeForce GTX 850M, 4200H, HGST Travelstar 5K1000 HTS541010A9E680 | Toshiba Satellite P50t-B-10T Radeon R9 M265X, 4710HQ, Toshiba MQ01ABD100 | Dell XPS 15 (9530-0538) GeForce GT 750M, 4712HQ, Lite-On LMT-512L9M | |
|---|---|---|---|---|---|
| Power Consumption | 10% | 39% | 28% | 22% | |
| Idle Minimum * (Watt) | 21.8 | 16.2 26% | 8.6 61% | 12.8 41% | 14.6 33% |
| Idle Average * (Watt) | 26.1 | 20.2 23% | 12 54% | 18.8 28% | 19.6 25% |
| Idle Maximum * (Watt) | 26.6 | 22.8 14% | 13 51% | 19 29% | 19.8 26% |
| Load Average * (Watt) | 88.5 | 96.4 -9% | 72.2 18% | 66.7 25% | 92 -4% |
| Load Maximum * (Watt) | 119.7 | 126.9 -6% | 104 13% | 99.1 17% | 85.8 28% |
* ... smaller is better
| Off / Standby | |
| Idle | |
| Load |
|
Key:
min: | |
| Battery runtime | |
| WiFi v1.3 (sort by value) | |
| MSI PE60-2QEi581 | |
| Acer Aspire VN7-591G-727P | |
| Asus UX501JW-DS71T | |
| Dell XPS 15 (9530-0538) | |
| WiFi (sort by value) | |
| Asus N551JK-CN166H | |
| Toshiba Satellite P50t-B-10T | |
Pros
Cons
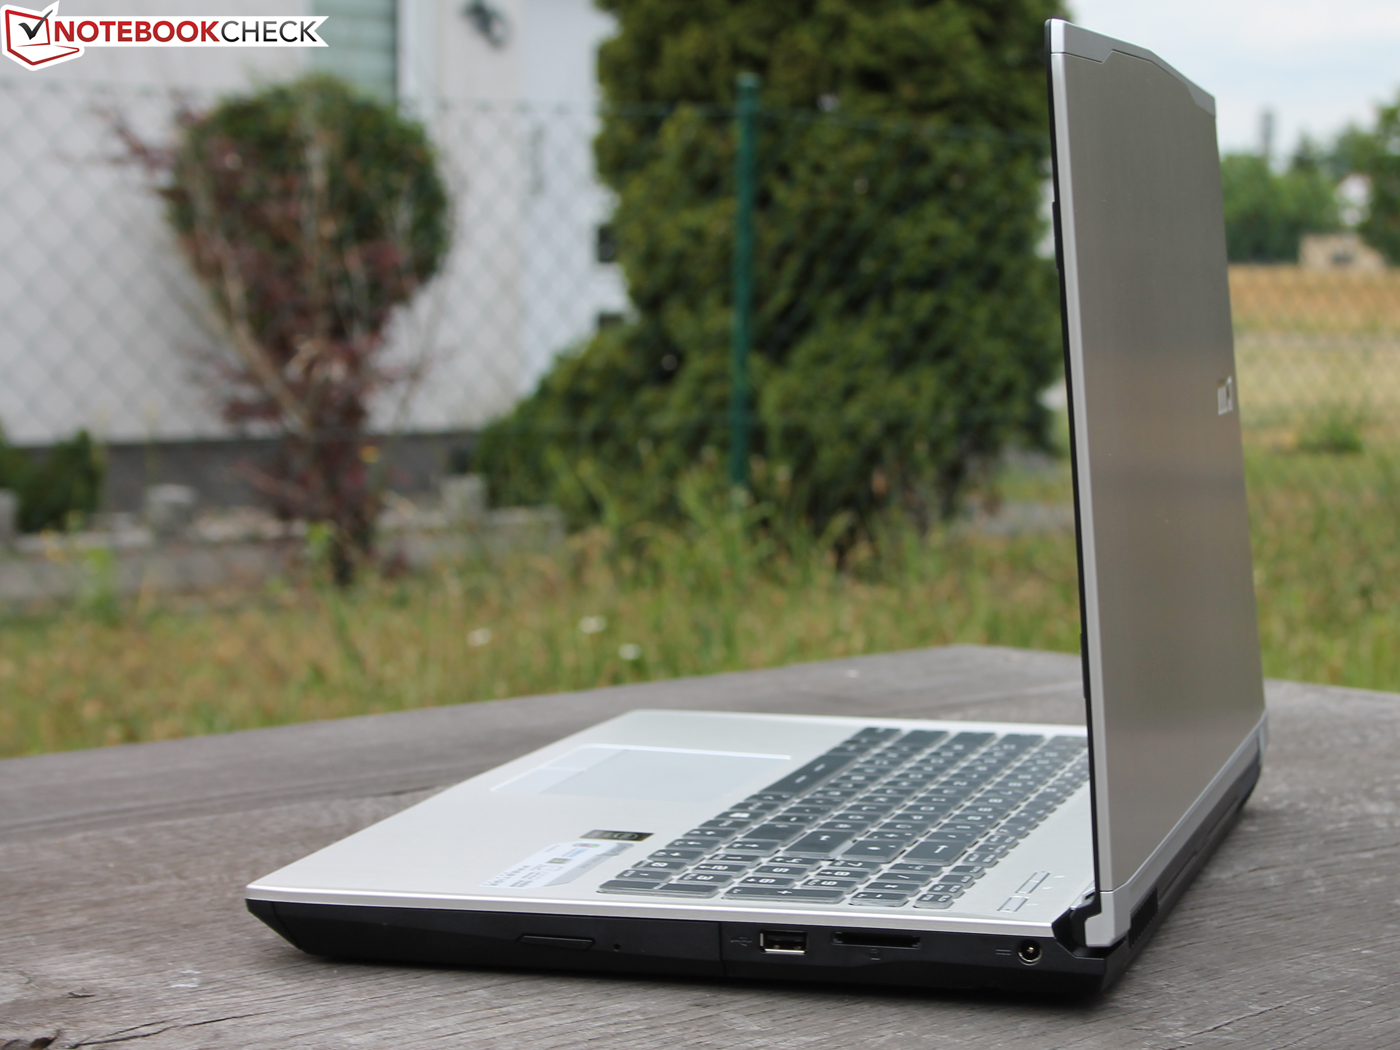
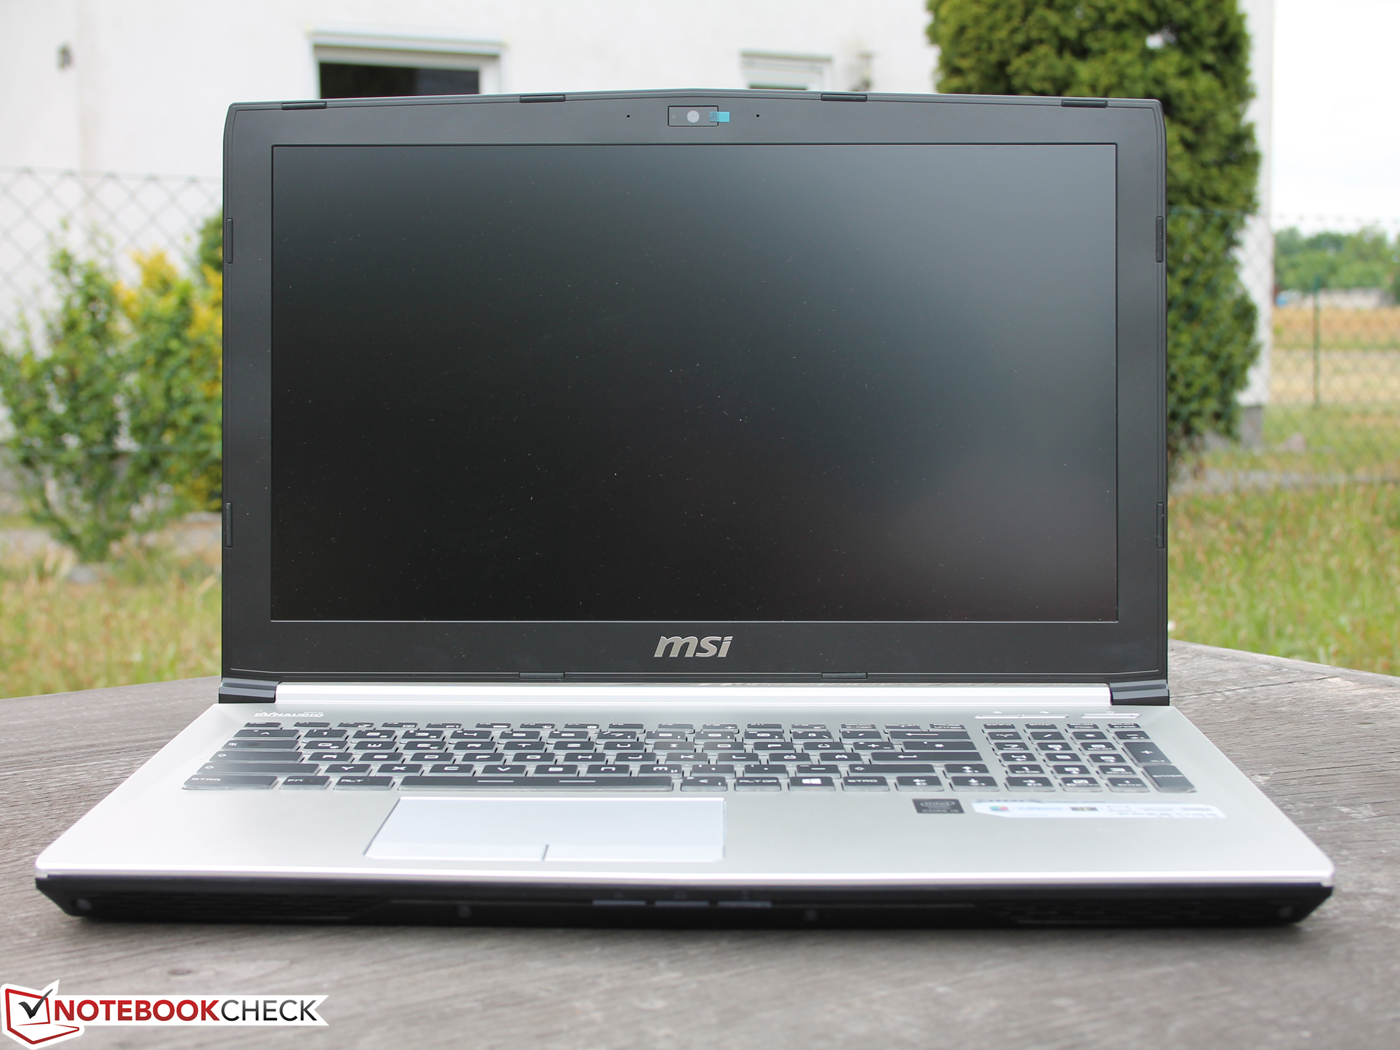
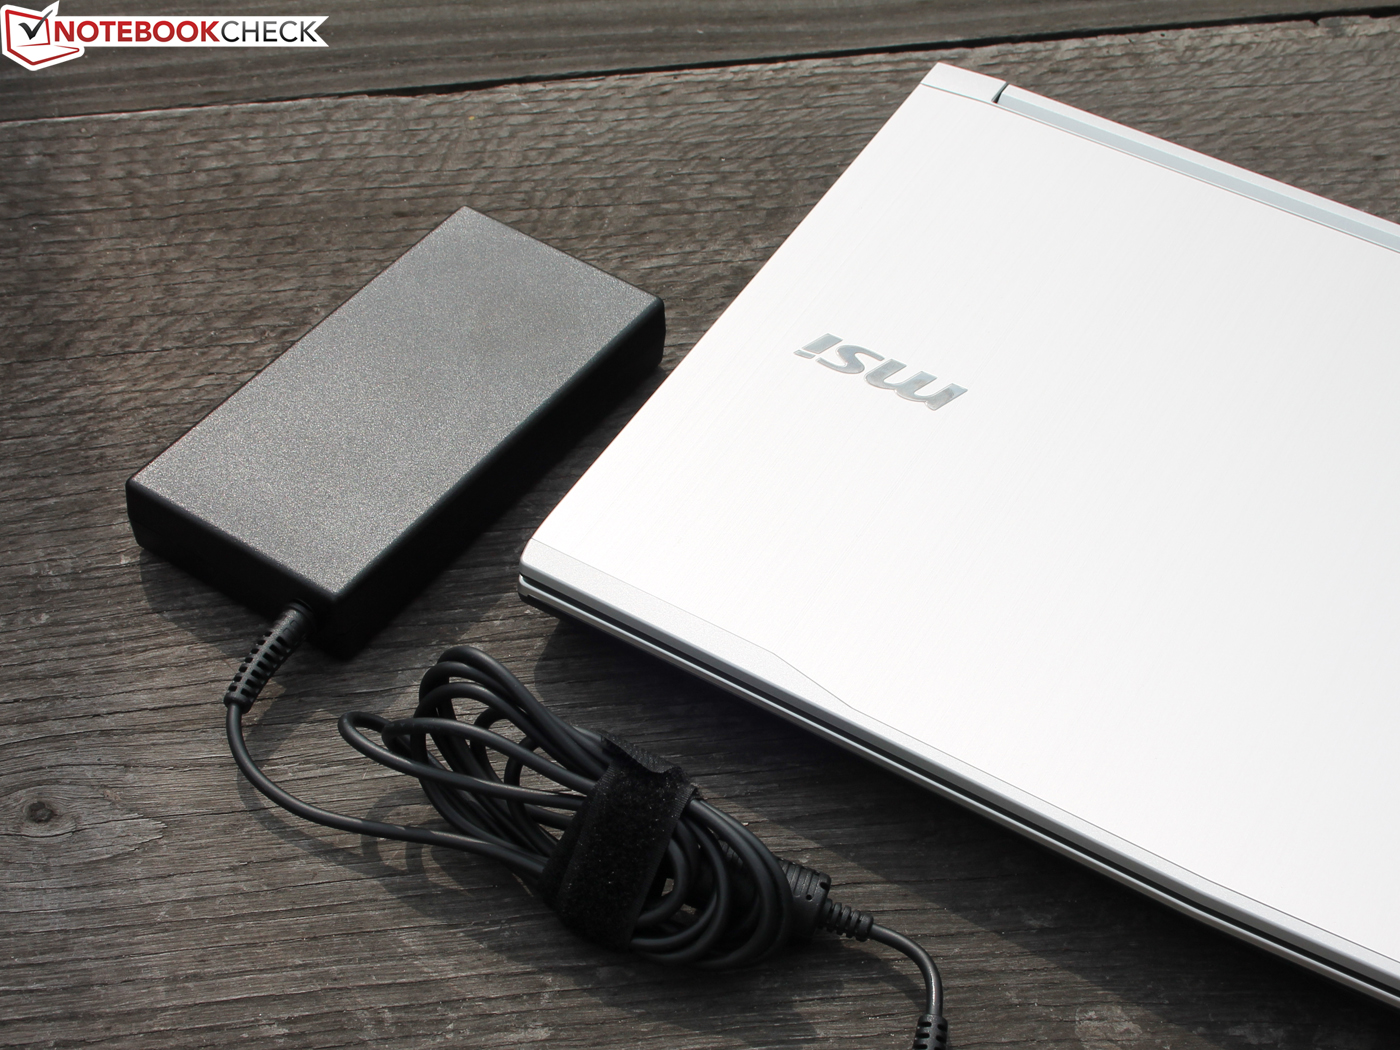
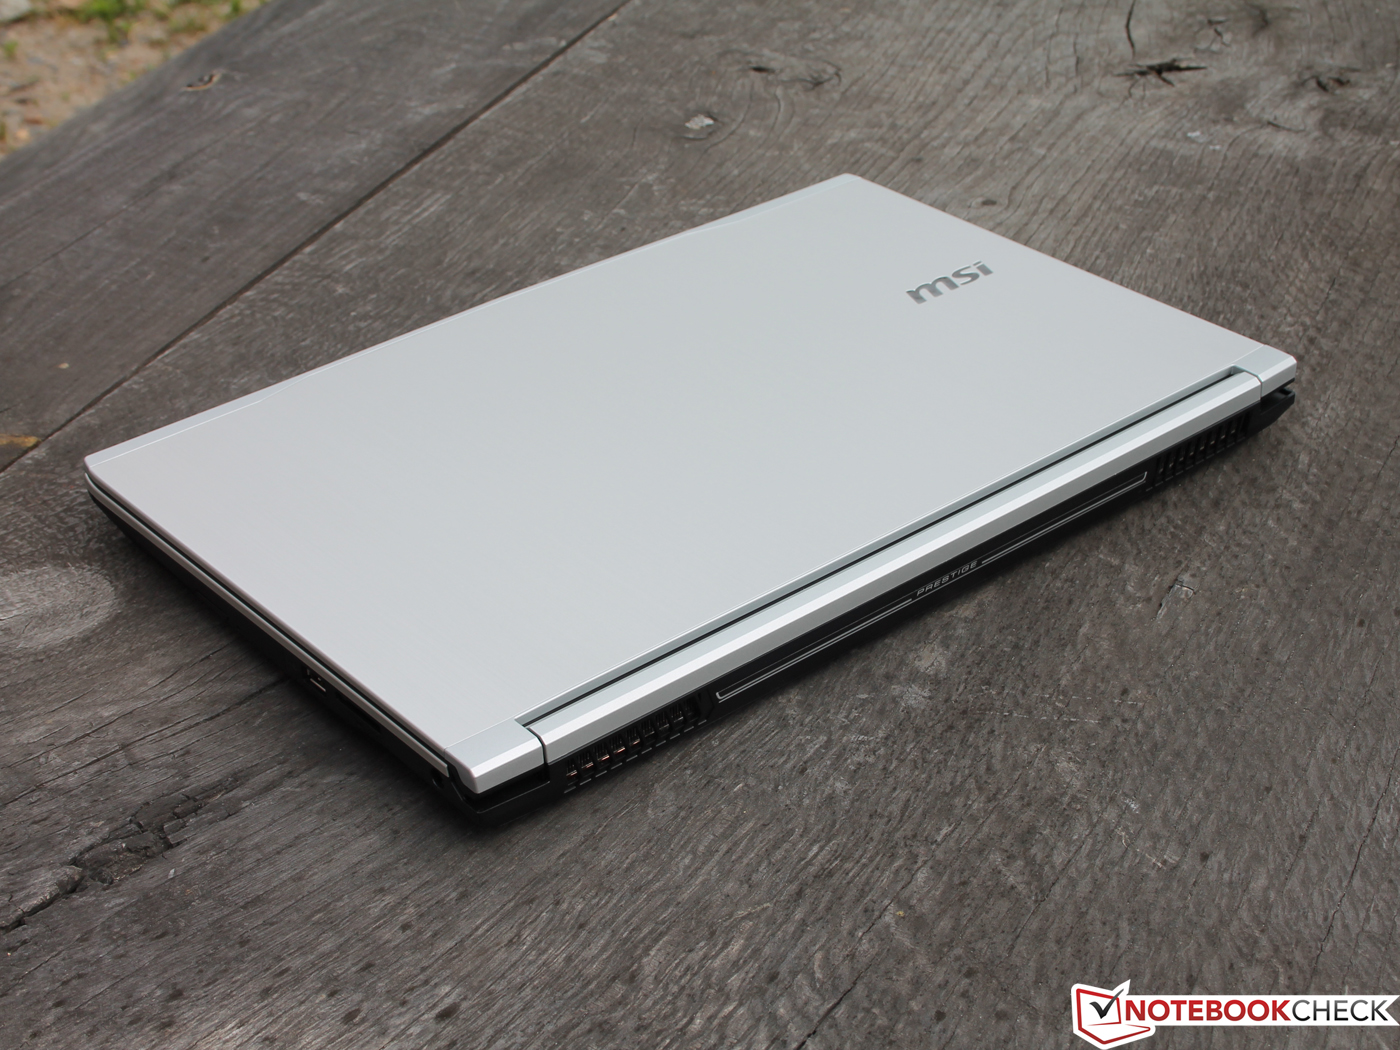
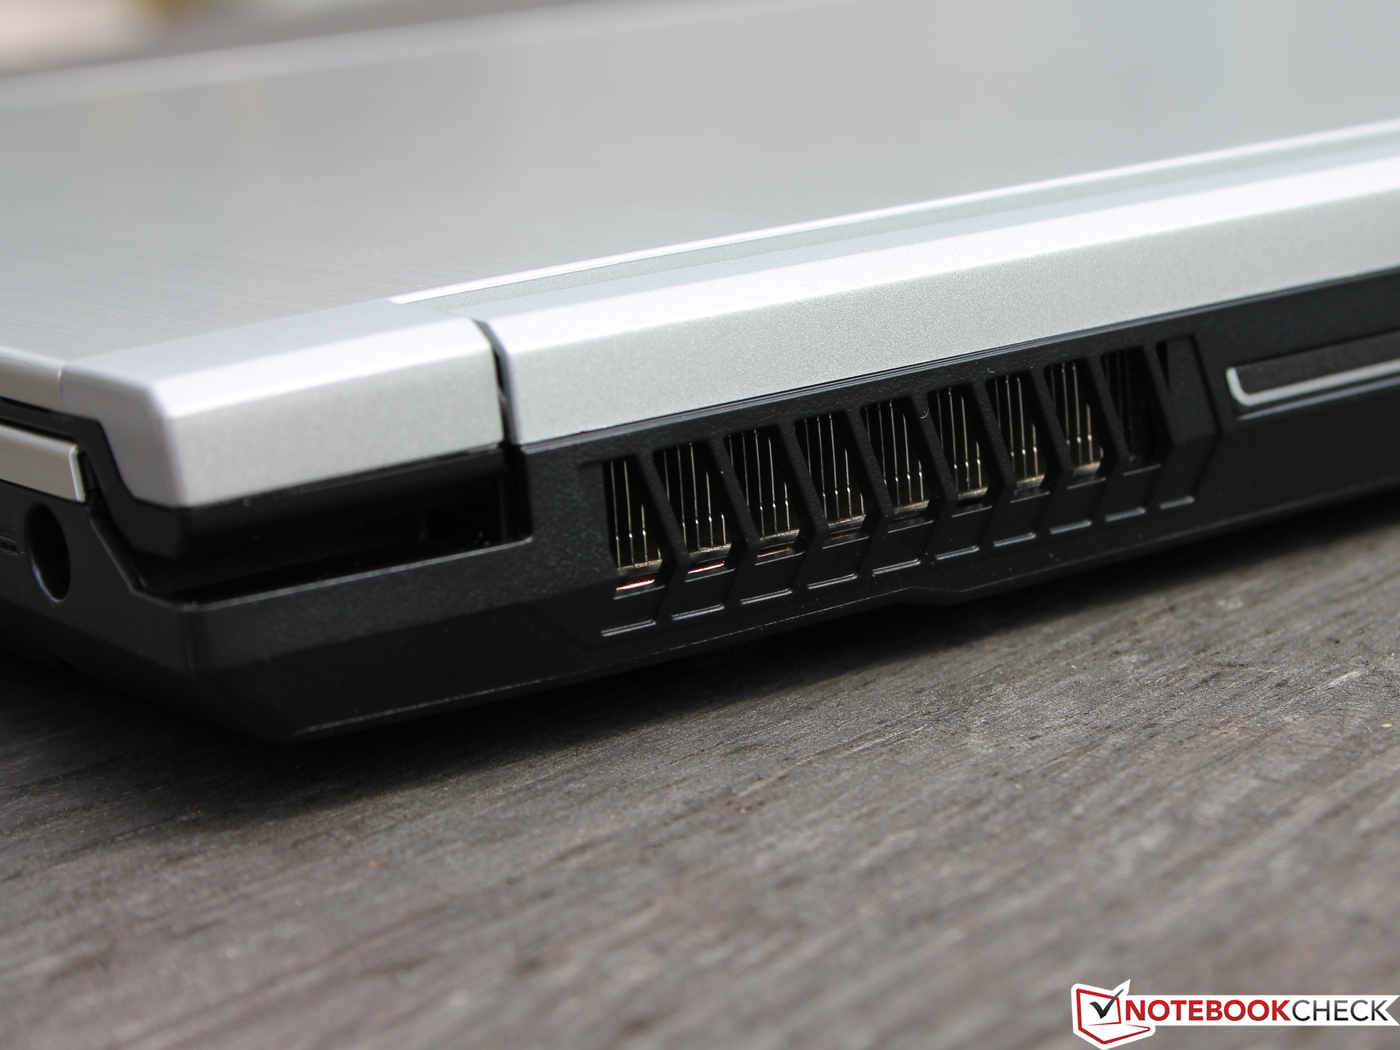
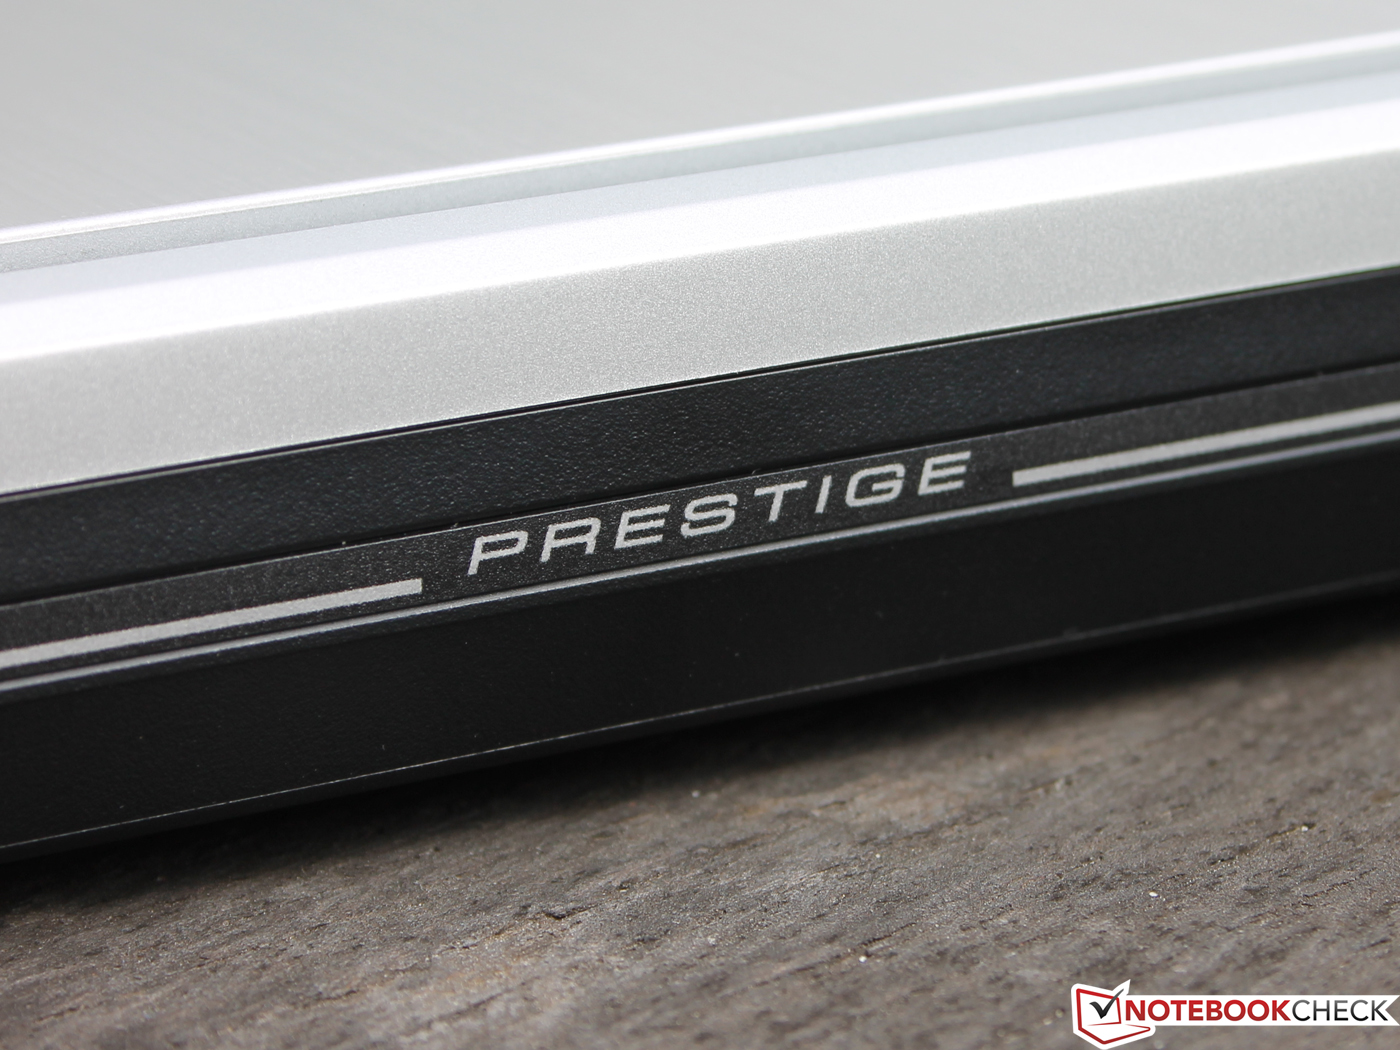
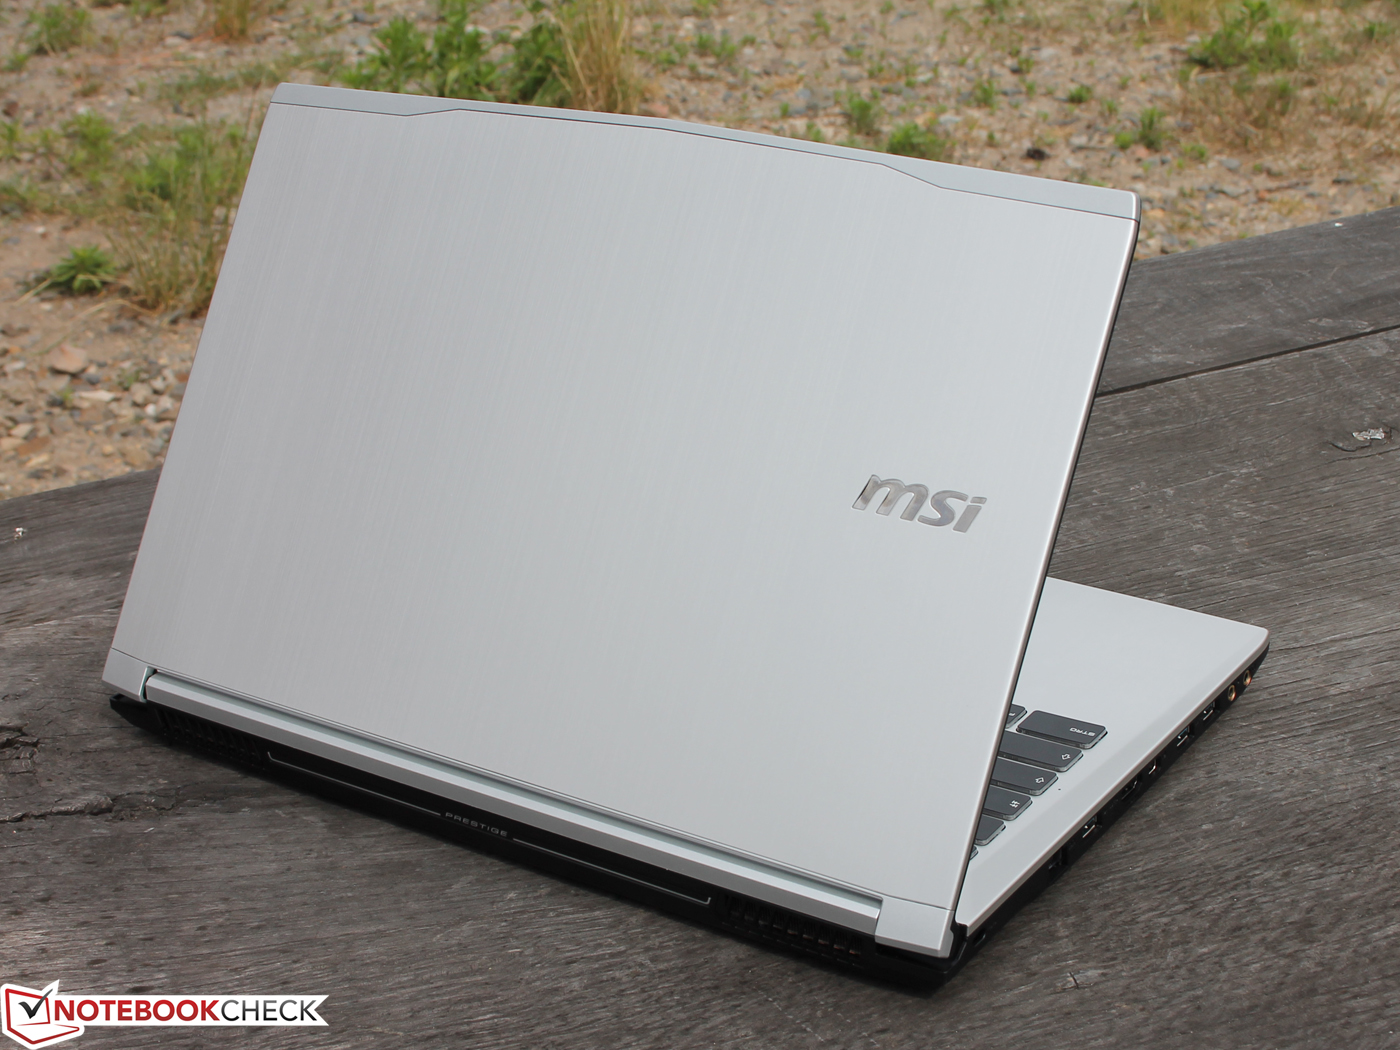
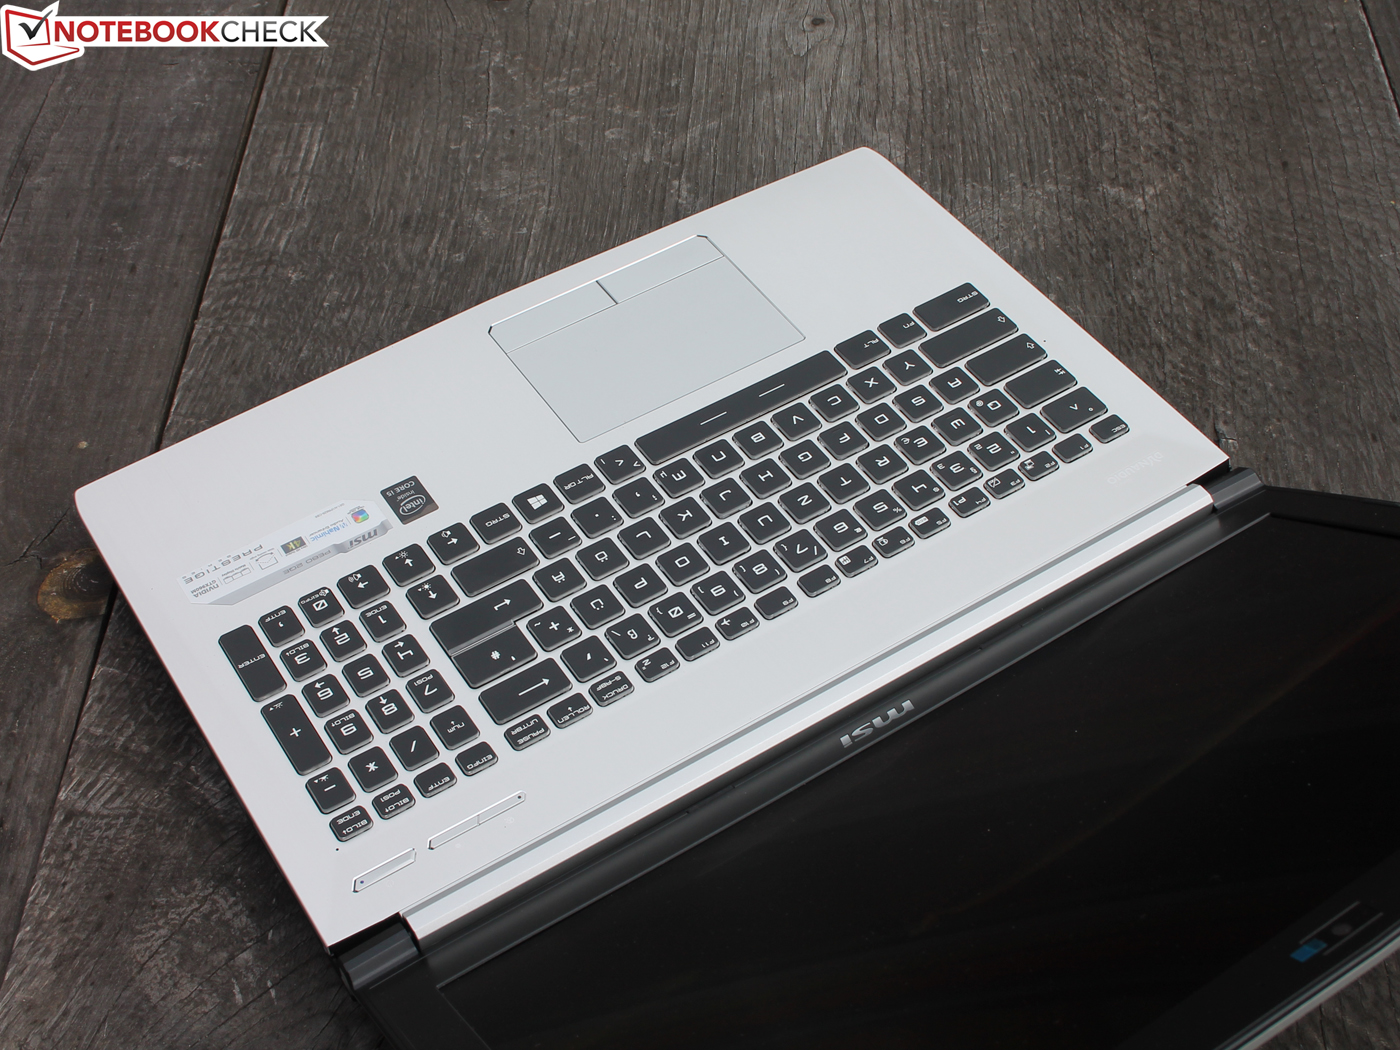
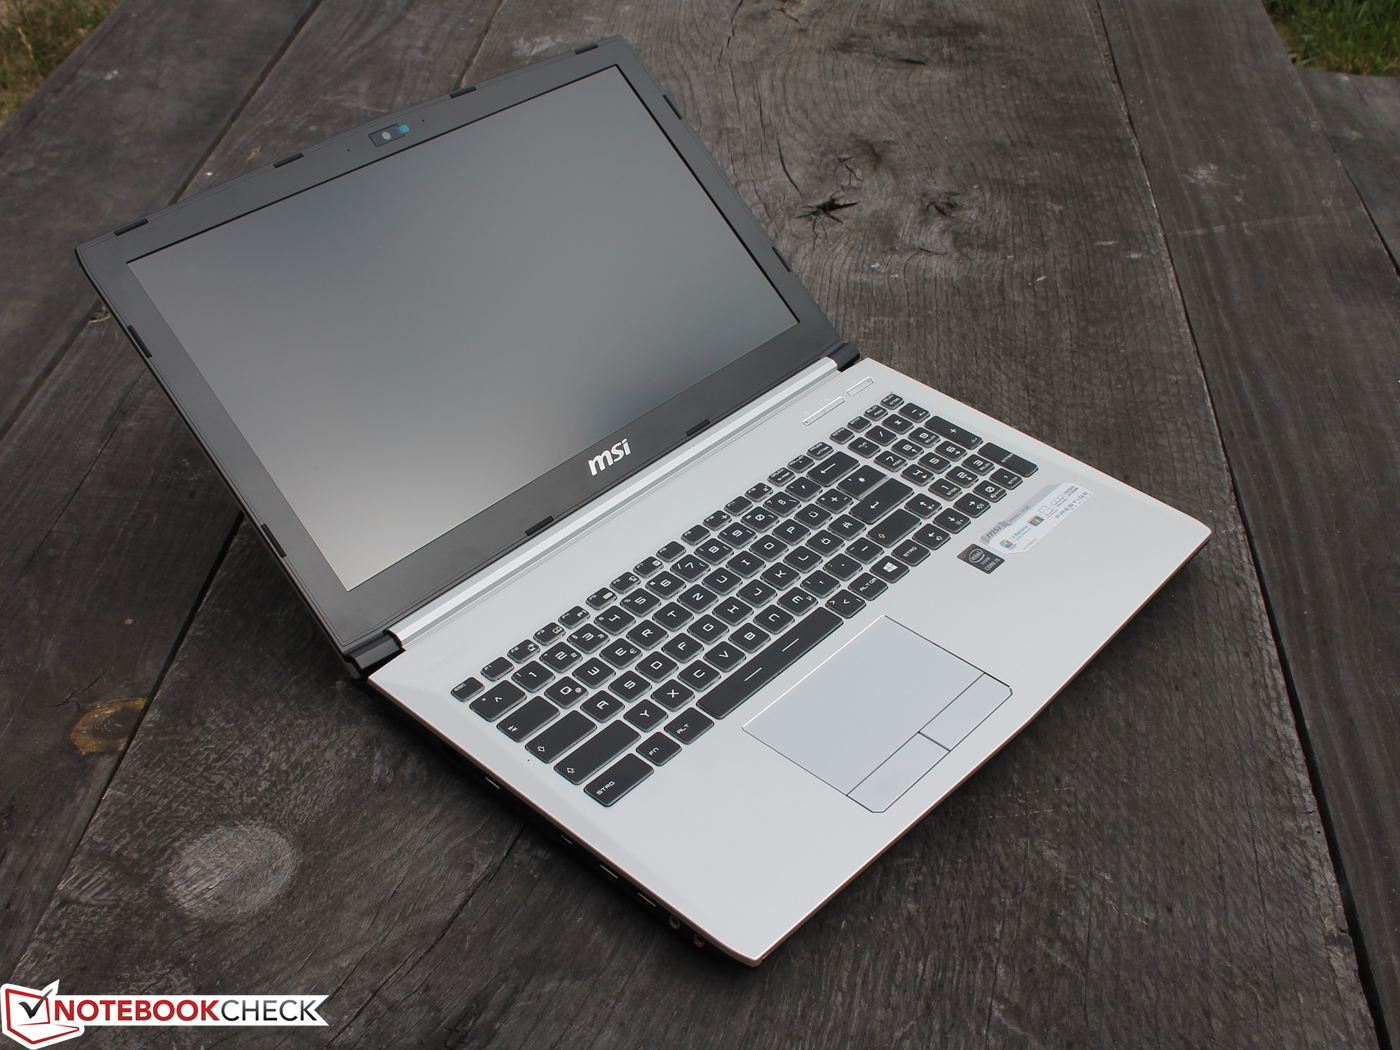
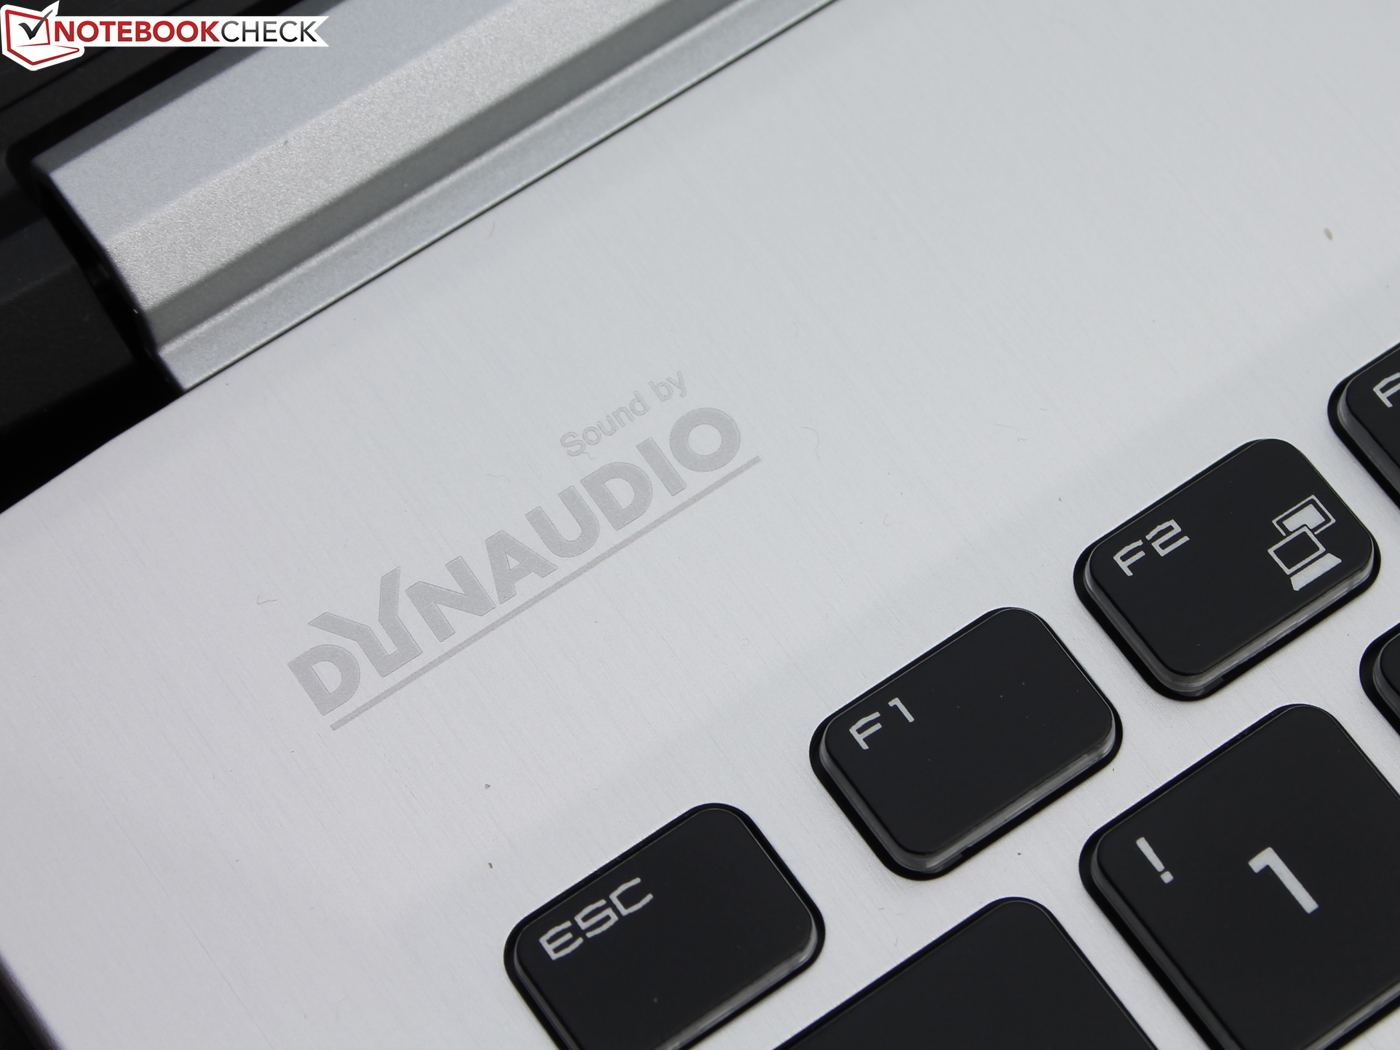
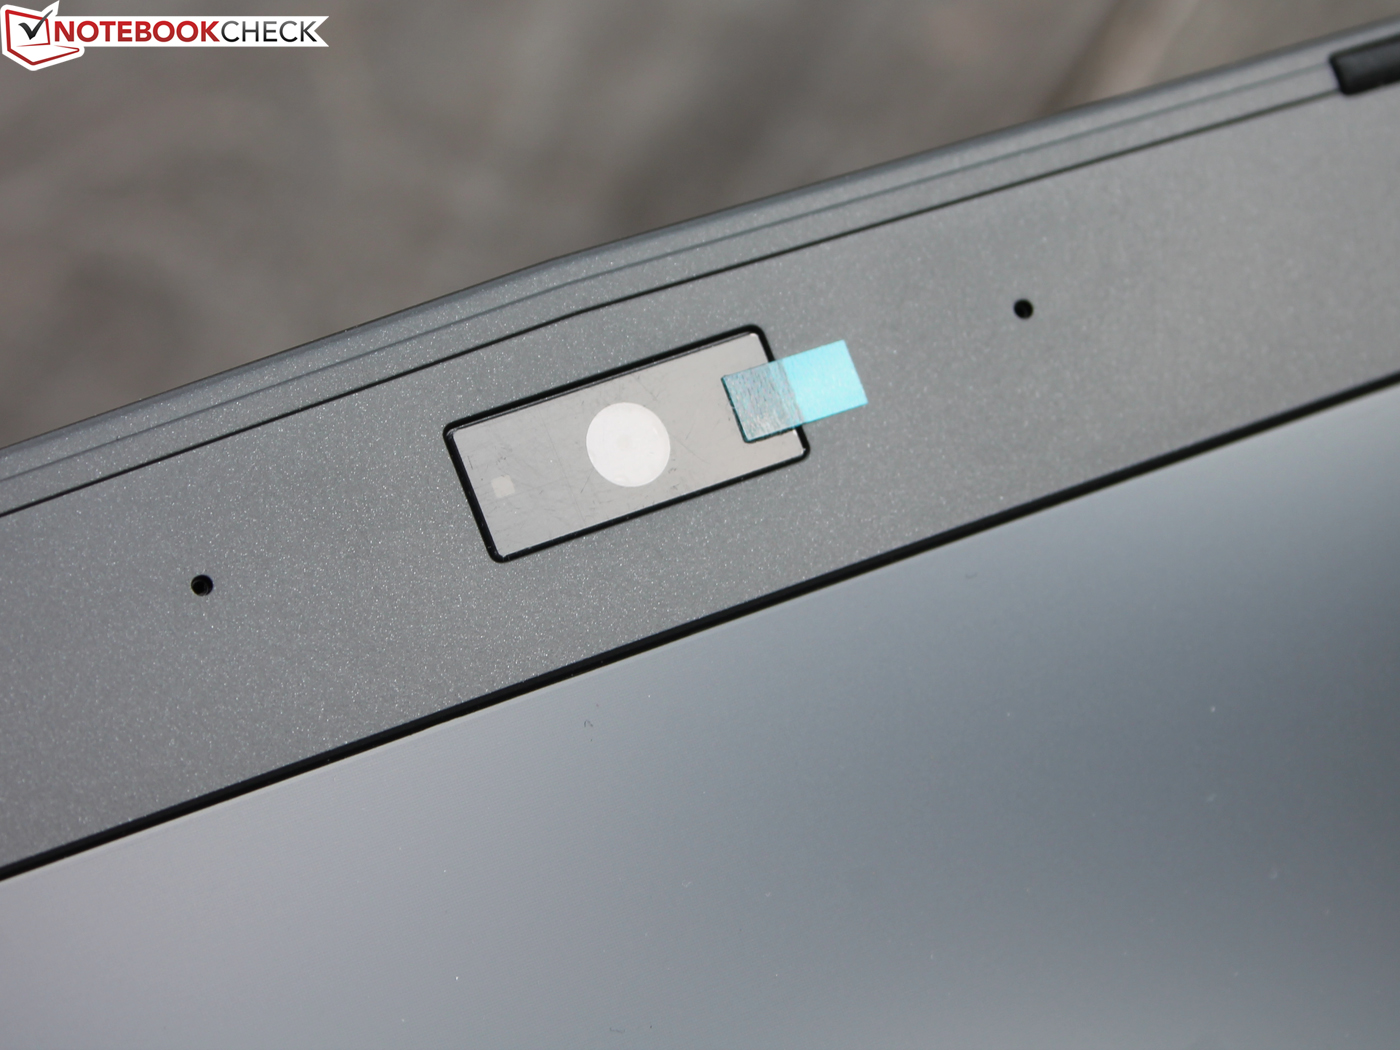
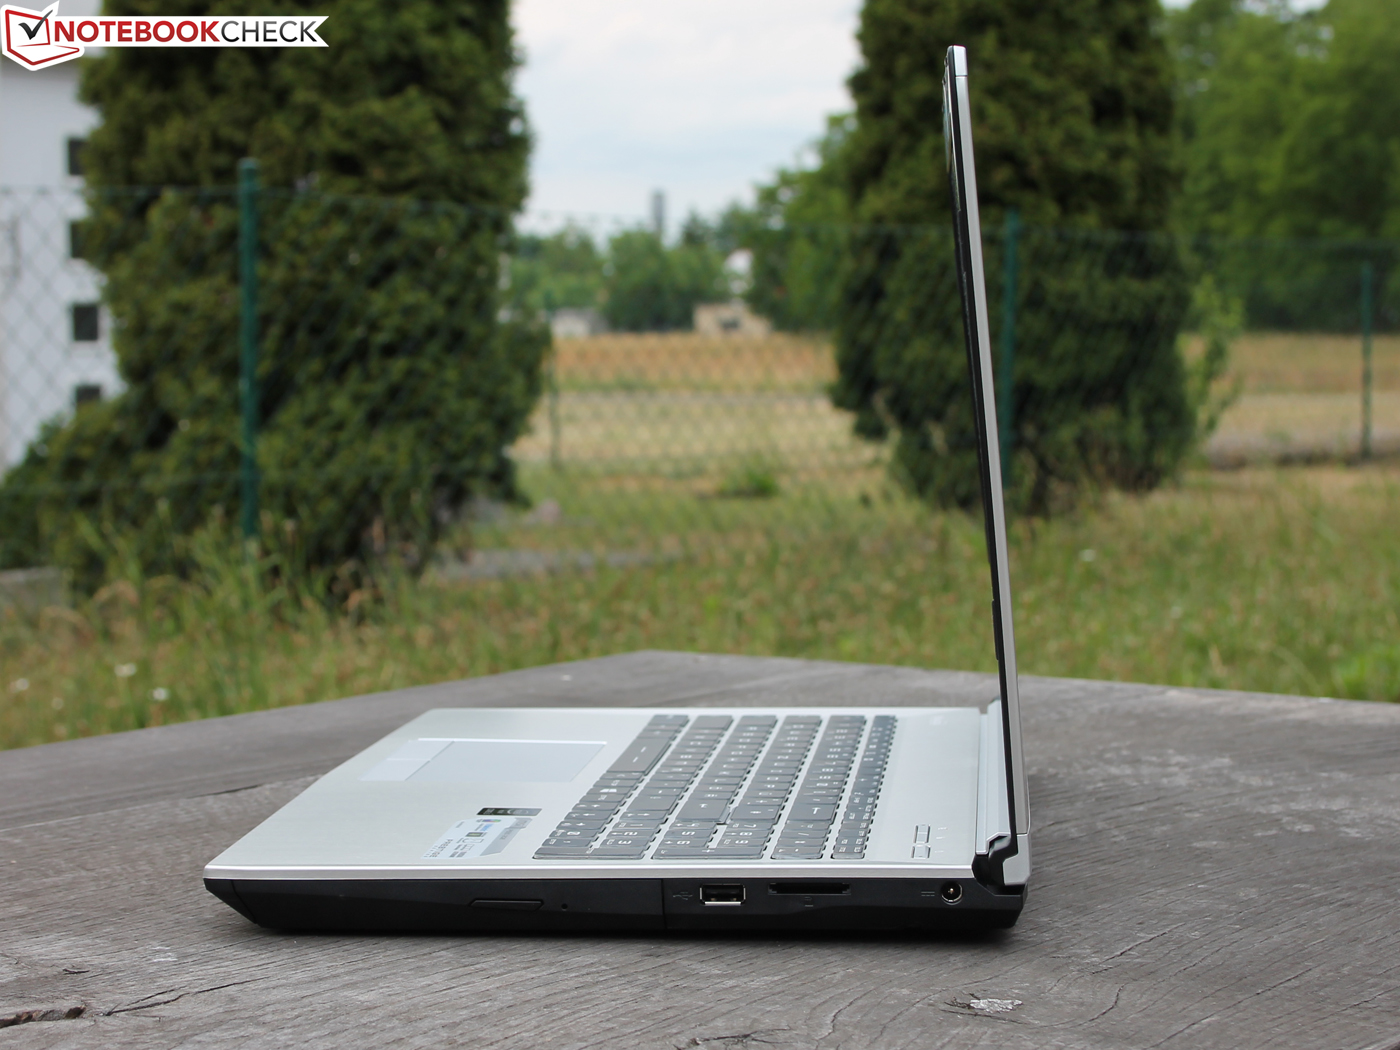
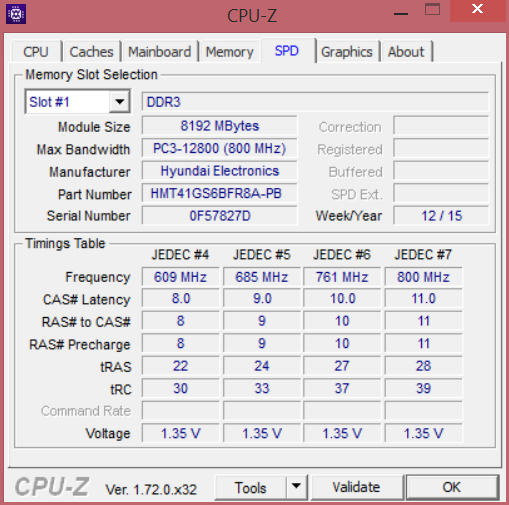
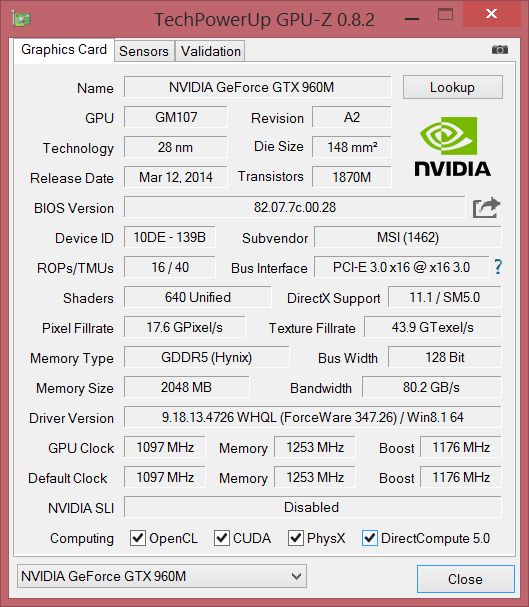
微星付出了很大努力争取通过Prestige系列抢占高端笔记本电脑市场份额。它最大优势之一是来自三星的PLS屏幕,它提供了对sRGB色域的覆盖,一流的可视角度范围和磨砂表面。它可以在高设定下流畅运行最新游戏,同时7200转的硬盘也保证了让人惊喜的强劲系统性能。双风扇构成的散热系统让它在可以接受的噪音水平下保持不错的机身温度水平。不过,它的待机功耗相比同类产品较高。另一方面,四声道扬声器与低音炮组成的音响系统完全可以满足名副其实的多媒体笔记本的定义(Nahimic Audio)。同时丰富的接口也值得一提(DisplayPort,两个镀金音频接口),不过较差的摄像头效果就难以让人满意了。PE60在轻薄的同时也提供了不错的可维护性,例如,M.2接口可以用于加装固态硬盘。
相对较为简单的塑料机身和不足3小时的较短电池续航时间是它的最大问题。ZenBookUX501和戴尔XPS 15在这方面都更具优势。目前由于GeForce GT 750M显卡过老无法与之竞争。ZenBook Pro UX501 1600欧元的起售价相对更贵。因此,Acer Aspire VN7-591G 黑色版(1600欧元,4K屏幕版;采用全高清屏幕和GTX 860M的机型售价较低),华硕N551JK(其售价990欧元,GTX 850M),和东芝Satellite P50t-B-10T(1400欧元,4K屏幕,Radeon R9 M265X)可能都是对用户更有吸引力的竞争对手。
注:本文是基于完整评测的缩减版本,阅读完整的英文评测,请点击这里。
MSI PE60-2QEi581
- 03/25/2016 v5 (old)
Sebastian Jentsch