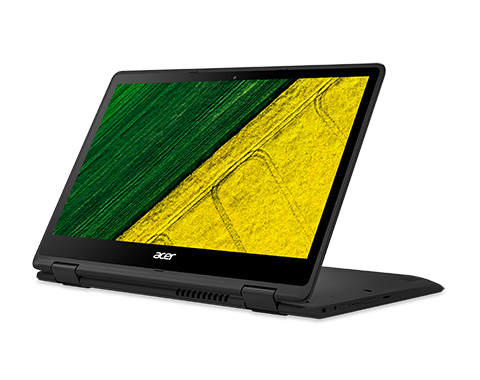
宏碁 Spin 5 SP513-51 变形本简短评测
| Networking | |
| iperf3 transmit AX12 | |
| HP Omen 17-w100ng | |
| Acer Spin 5 SP513-51 | |
| Dell Inspiron 15 5000 5567-1753 | |
| iperf3 receive AX12 | |
| HP Omen 17-w100ng | |
| Dell Inspiron 15 5000 5567-1753 | |
| Acer Spin 5 SP513-51 | |
| |||||||||||||||||||||||||
Brightness Distribution: 87 %
Center on Battery: 245 cd/m²
Contrast: 1167:1 (Black: 0.21 cd/m²)
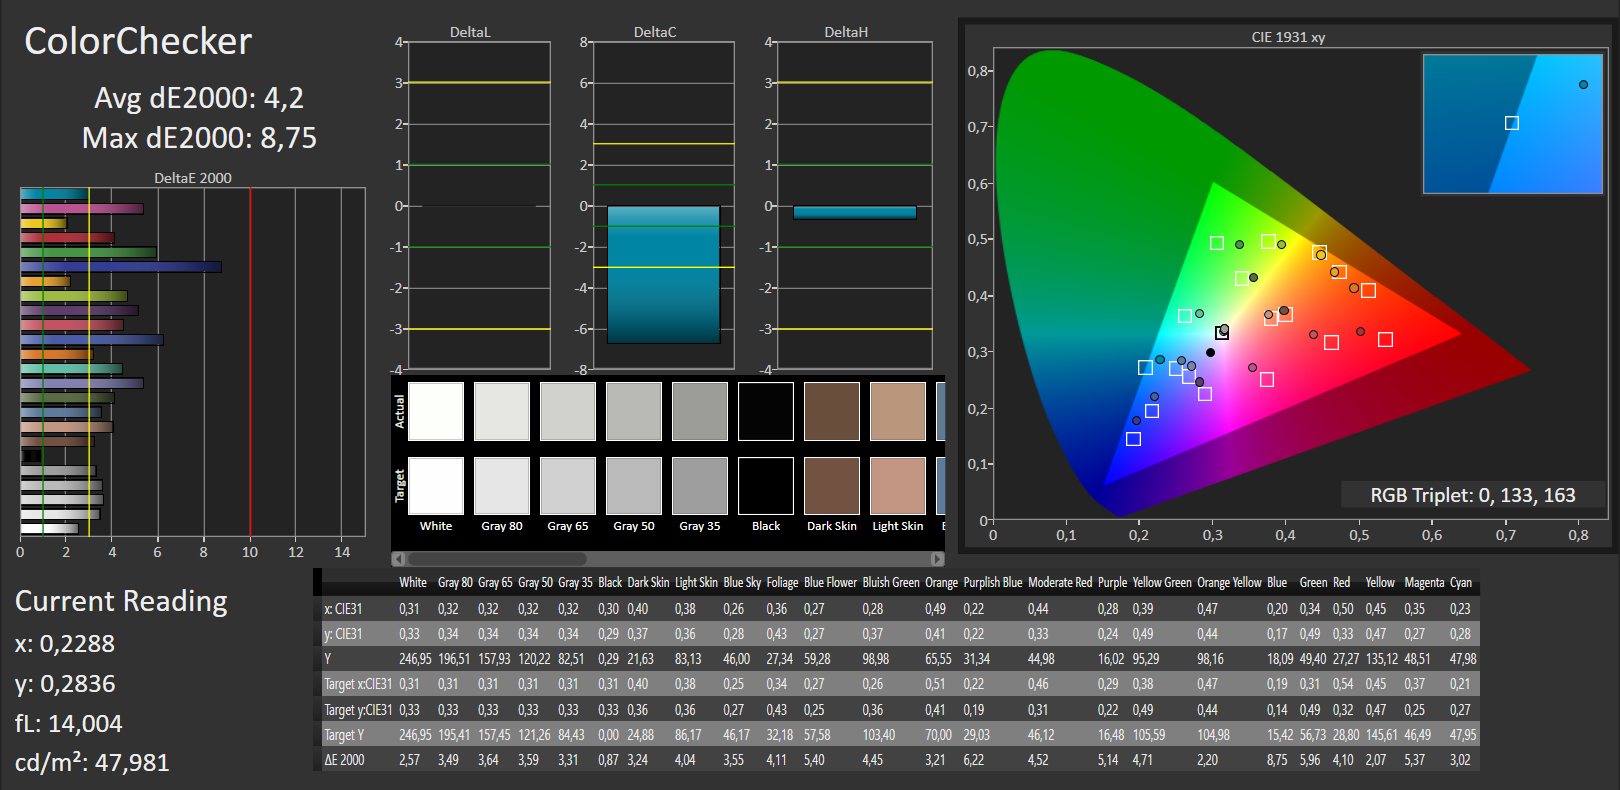
ΔE ColorChecker Calman: 4.2 | ∀{0.5-29.43 Ø4.71}
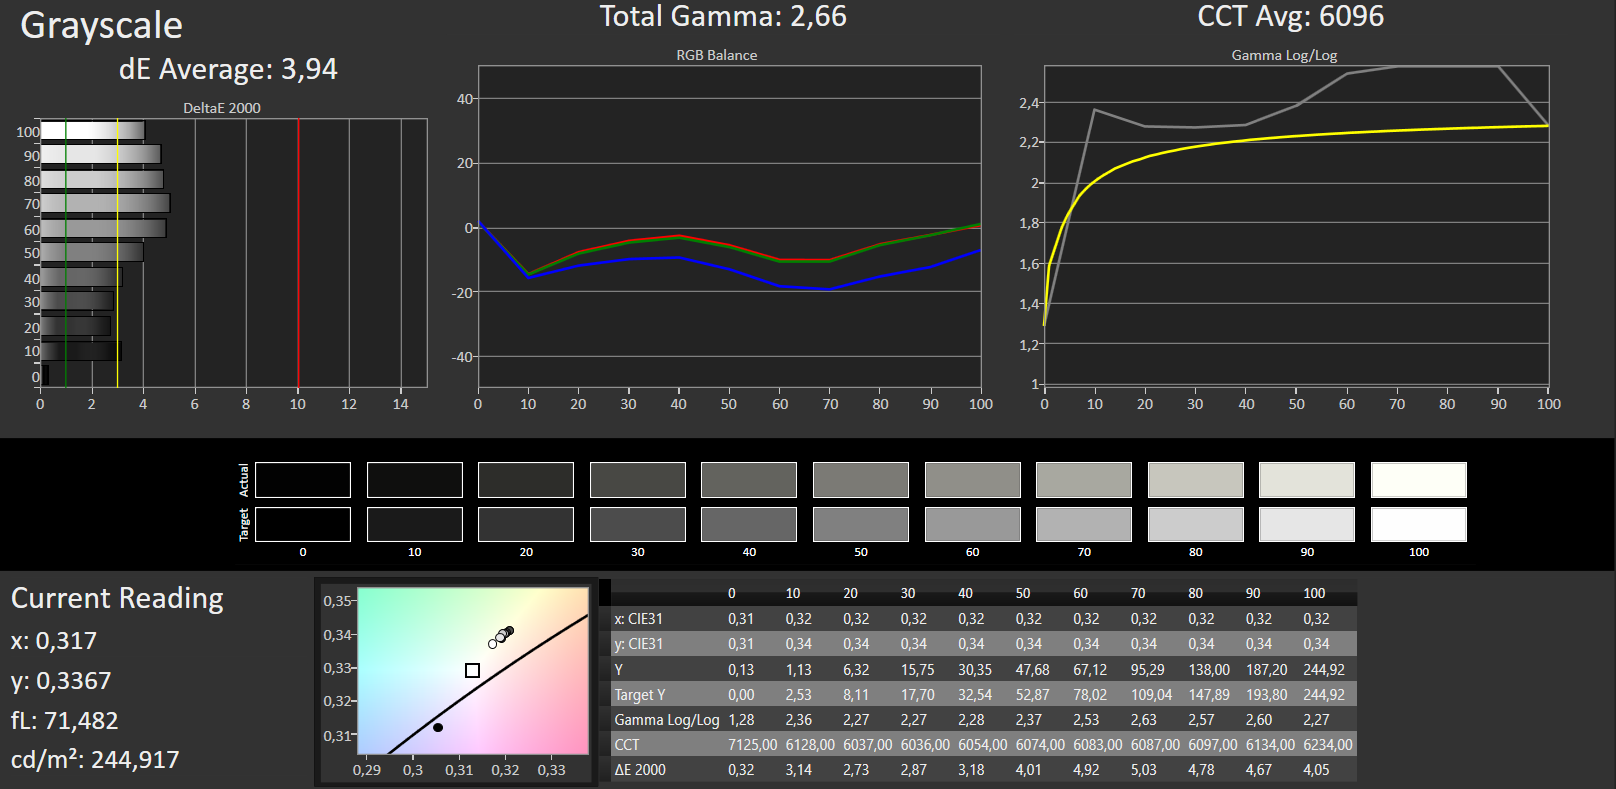
ΔE Greyscale Calman: 3.94 | ∀{0.09-98 Ø4.96}
59% sRGB (Argyll 1.6.3 3D)
38% AdobeRGB 1998 (Argyll 1.6.3 3D)
41.32% AdobeRGB 1998 (Argyll 3D)
59.5% sRGB (Argyll 3D)
39.99% Display P3 (Argyll 3D)
Gamma: 2.66
CCT: 6096 K
| Acer Spin 5 SP513-51 B133HAB01.0, , 1920x1080, 13.3" | Dell Inspiron 13 7359-4839 Samsung SDC864D / 133HL [Dell P/N: PVFF5], , 1920x1080, 13.3" | Lenovo Yoga 510-14IKB BOE0637 / BOE DT NV140FHM-N41, , 1920x1080, 14" | HP Pavilion x360 13-u102ng LG Philips, , 1920x1080, 13.3" | Acer Spin 7 SP714-51-M09D AUO B140HAN03.2 / AUO323D, , 1920x1080, 14" | HP Spectre x360 13-w023dx Chi Mei CMN1367, , 1920x1080, 13.3" | |
|---|---|---|---|---|---|---|
| Display | 1% | 5% | -1% | 52% | 58% | |
| Display P3 Coverage (%) | 39.99 | 40.31 1% | 41.78 4% | 39.43 -1% | 61.5 54% | 65.4 64% |
| sRGB Coverage (%) | 59.5 | 60.5 2% | 62.9 6% | 59.1 -1% | 89.1 50% | 90.4 52% |
| AdobeRGB 1998 Coverage (%) | 41.32 | 41.65 1% | 43.17 4% | 40.76 -1% | 62.9 52% | 65.8 59% |
| Response Times | 13% | -20% | 20% | 7% | 19% | |
| Response Time Grey 50% / Grey 80% * (ms) | 56 ? | 38 ? 32% | 53 ? 5% | 38 ? 32% | 51 ? 9% | 33.2 ? 41% |
| Response Time Black / White * (ms) | 27 ? | 29 ? -7% | 39 ? -44% | 25 ? 7% | 26 ? 4% | 28 ? -4% |
| PWM Frequency (Hz) | 350 ? | |||||
| Screen | -31% | -13% | -15% | -39% | -7% | |
| Brightness middle (cd/m²) | 245 | 253 3% | 243 -1% | 277 13% | 344 40% | 334.6 37% |
| Brightness (cd/m²) | 233 | 232 0% | 248 6% | 263 13% | 292 25% | 319 37% |
| Brightness Distribution (%) | 87 | 83 -5% | 91 5% | 88 1% | 72 -17% | 90 3% |
| Black Level * (cd/m²) | 0.21 | 0.28 -33% | 0.32 -52% | 0.31 -48% | 0.26 -24% | 0.336 -60% |
| Contrast (:1) | 1167 | 904 -23% | 759 -35% | 894 -23% | 1323 13% | 996 -15% |
| Colorchecker dE 2000 * | 4.2 | 6.36 -51% | 5.44 -30% | 5.57 -33% | 12.65 -201% | 6.21 -48% |
| Colorchecker dE 2000 max. * | 8.75 | 12.72 -45% | 9.73 -11% | 13.6 -55% | 17.8 -103% | 12 -37% |
| Greyscale dE 2000 * | 3.94 | 10.26 -160% | 4.74 -20% | 4.56 -16% | 12.95 -229% | 7.71 -96% |
| Gamma | 2.66 83% | 2.28 96% | 2.38 92% | 2.28 96% | 1.33 165% | 2.36 93% |
| CCT | 6096 107% | 6500 100% | 7799 83% | 6648 98% | 6441 101% | 6458 101% |
| Color Space (Percent of AdobeRGB 1998) (%) | 38 | 38 0% | 39.6 4% | 38 0% | 58 53% | 58.6 54% |
| Color Space (Percent of sRGB) (%) | 59 | 60 2% | 62.5 6% | 59 0% | 89 51% | 90 53% |
| Total Average (Program / Settings) | -6% /
-19% | -9% /
-10% | 1% /
-7% | 7% /
-15% | 23% /
9% |
* ... smaller is better
Display Response Times
| ↔ Response Time Black to White | ||
|---|---|---|
| 27 ms ... rise ↗ and fall ↘ combined | ↗ 8 ms rise | 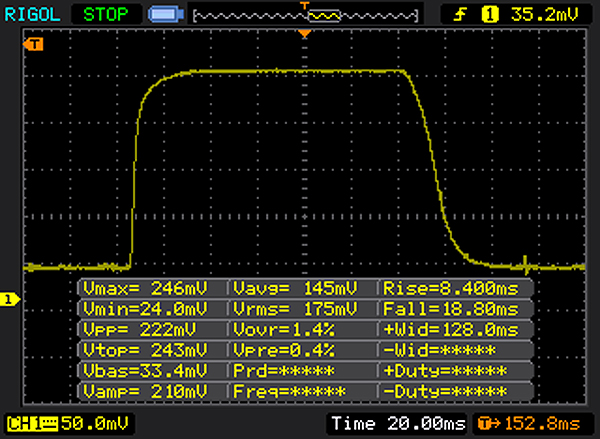 |
| ↘ 19 ms fall | ||
| The screen shows relatively slow response rates in our tests and may be too slow for gamers. In comparison, all tested devices range from 0.1 (minimum) to 240 (maximum) ms. » 67 % of all devices are better. This means that the measured response time is worse than the average of all tested devices (19.8 ms). | ||
| ↔ Response Time 50% Grey to 80% Grey | ||
| 56 ms ... rise ↗ and fall ↘ combined | ↗ 18 ms rise | 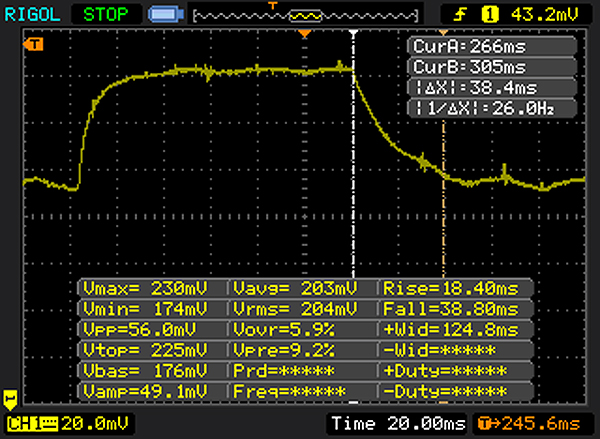 |
| ↘ 38 ms fall | ||
| The screen shows slow response rates in our tests and will be unsatisfactory for gamers. In comparison, all tested devices range from 0.165 (minimum) to 636 (maximum) ms. » 93 % of all devices are better. This means that the measured response time is worse than the average of all tested devices (31 ms). | ||
Screen Flickering / PWM (Pulse-Width Modulation)
| Screen flickering / PWM not detected | ||
In comparison: 52 % of all tested devices do not use PWM to dim the display. If PWM was detected, an average of 7754 (minimum: 5 - maximum: 343500) Hz was measured. | ||
| PCMark 8 Home Score Accelerated v2 | 3224 points | |
| PCMark 8 Work Score Accelerated v2 | 4121 points | |
Help | ||
| Acer Spin 5 SP513-51 Hynix HFS128G39TND | Acer Spin 7 SP714-51-M09D Kingston RBUSNS4180S3256GG | Dell Inspiron 13 7359-4839 Liteonit LCH-256V2S | HP Spectre x360 13-w023dx Samsung PM951 NVMe MZVLV512 | Lenovo Yoga 910-13IKB-80VF004CGE Samsung PM951 NVMe MZVLV512 | |
|---|---|---|---|---|---|
| AS SSD | 62% | 43% | 218% | 168% | |
| Seq Read (MB/s) | 503 | 433.2 -14% | 506 1% | 1455 189% | 1389 176% |
| Seq Write (MB/s) | 115.7 | 361.5 212% | 270.3 134% | 548 374% | 560 384% |
| 4K Read (MB/s) | 24.45 | 41.2 69% | 24.79 1% | 37.75 54% | 39.92 63% |
| 4K Write (MB/s) | 57.2 | 66.6 16% | 72.7 27% | 129.7 127% | 132.9 132% |
| 4K-64 Read (MB/s) | 333.8 | 345.6 4% | 290.8 -13% | 1420 325% | 671 101% |
| 4K-64 Write (MB/s) | 91.3 | 270.7 196% | 206.1 126% | 501 449% | 422.2 362% |
| Access Time Read * (ms) | 0.098 | 0.099 -1% | 0.082 16% | 0.042 57% | 0.034 65% |
| Access Time Write * (ms) | 0.269 | 0.169 37% | 0.051 81% | 0.03 89% | 0.028 90% |
| Score Total (Points) | 766 | 1036 35% | 856 12% | 3064 300% | 1865 143% |
* ... smaller is better

| 3DMark 11 - 1280x720 Performance GPU | |
| Lenovo Yoga 510-14IKB | |
| Lenovo Yoga 910-13IKB-80VF004CGE | |
| HP Pavilion x360 13-u102ng | |
| Dell Inspiron 13 7359-4839 | |
| Acer Spin 5 SP513-51 | |
| Acer Spin 7 SP714-51-M09D | |
| 3DMark | |
| 1280x720 Cloud Gate Standard Graphics | |
| Lenovo Yoga 910-13IKB-80VF004CGE | |
| HP Pavilion x360 13-u102ng | |
| Acer Spin 5 SP513-51 | |
| Dell Inspiron 13 7359-4839 | |
| Acer Spin 7 SP714-51-M09D | |
| Lenovo Yoga 510-14IKB | |
| 1920x1080 Fire Strike Graphics | |
| Lenovo Yoga 910-13IKB-80VF004CGE | |
| Lenovo Yoga 510-14IKB | |
| HP Pavilion x360 13-u102ng | |
| Acer Spin 5 SP513-51 | |
| 3DMark 11 Performance | 1321 points | |
| 3DMark Cloud Gate Standard Score | 4819 points | |
| 3DMark Fire Strike Score | 709 points | |
Help | ||
| low | med. | high | ultra | |
|---|---|---|---|---|
| BioShock Infinite (2013) | 42.77 | 24.3 | 20.21 | 6.33 |
| Rise of the Tomb Raider (2016) | 16.8 | |||
| Civilization 6 (2016) | 27.9 | 10 |
Noise level
| Idle |
| 30.5 / 30.5 / 30.6 dB(A) |
| Load |
| 31 / 36.8 dB(A) |
 | ||
30 dB silent 40 dB(A) audible 50 dB(A) loud |
||
min: | ||
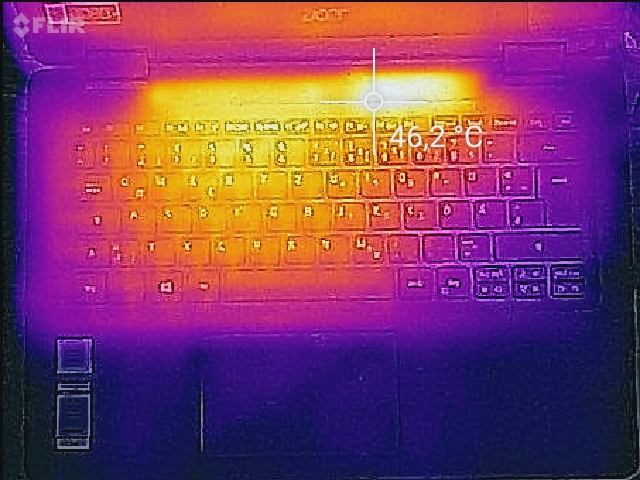
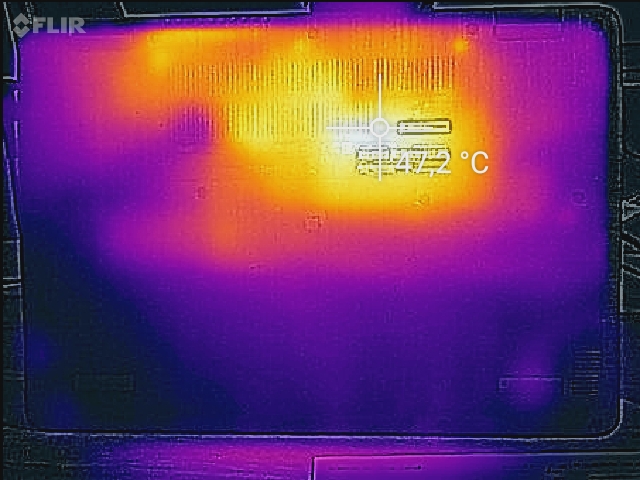
(+) The maximum temperature on the upper side is 38.3 °C / 101 F, compared to the average of 35.4 °C / 96 F, ranging from 19.6 to 60 °C for the class Convertible.
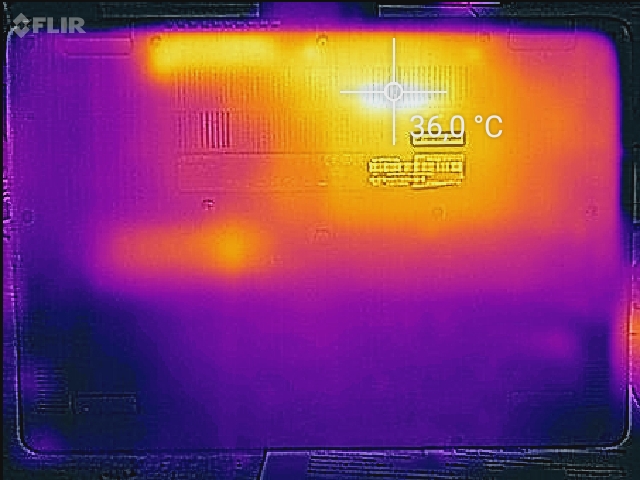
(±) The bottom heats up to a maximum of 42.5 °C / 109 F, compared to the average of 36.9 °C / 98 F
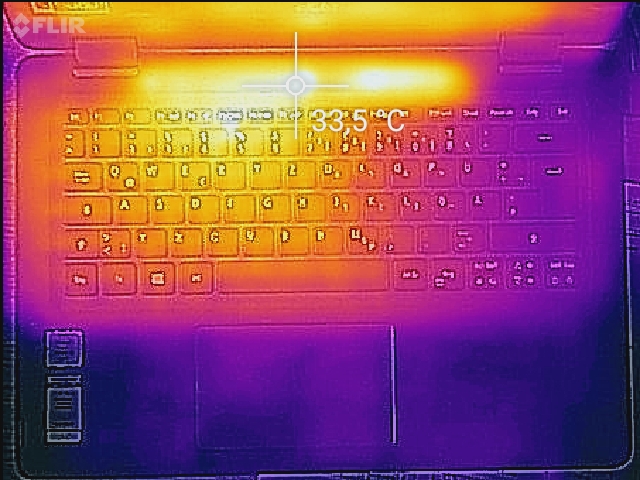
(+) In idle usage, the average temperature for the upper side is 25.1 °C / 77 F, compared to the device average of 30.3 °C / 87 F.
(+) The palmrests and touchpad are cooler than skin temperature with a maximum of 24 °C / 75.2 F and are therefore cool to the touch.
(+) The average temperature of the palmrest area of similar devices was 28 °C / 82.4 F (+4 °C / 7.2 F).
Acer Spin 5 SP513-51 audio analysis
(-) | not very loud speakers (71 dB)
Bass 100 - 315 Hz
(-) | nearly no bass - on average 23.4% lower than median
(±) | linearity of bass is average (10.3% delta to prev. frequency)
Mids 400 - 2000 Hz
(+) | balanced mids - only 4.1% away from median
(±) | linearity of mids is average (11.9% delta to prev. frequency)
Highs 2 - 16 kHz
(+) | balanced highs - only 4.1% away from median
(+) | highs are linear (5.4% delta to prev. frequency)
Overall 100 - 16.000 Hz
(±) | linearity of overall sound is average (22.7% difference to median)
Compared to same class
» 68% of all tested devices in this class were better, 5% similar, 27% worse
» The best had a delta of 6%, average was 20%, worst was 57%
Compared to all devices tested
» 67% of all tested devices were better, 6% similar, 27% worse
» The best had a delta of 4%, average was 23%, worst was 134%
Apple MacBook 12 (Early 2016) 1.1 GHz audio analysis
(+) | speakers can play relatively loud (83.6 dB)
Bass 100 - 315 Hz
(±) | reduced bass - on average 11.3% lower than median
(±) | linearity of bass is average (14.2% delta to prev. frequency)
Mids 400 - 2000 Hz
(+) | balanced mids - only 2.4% away from median
(+) | mids are linear (5.5% delta to prev. frequency)
Highs 2 - 16 kHz
(+) | balanced highs - only 2% away from median
(+) | highs are linear (4.5% delta to prev. frequency)
Overall 100 - 16.000 Hz
(+) | overall sound is linear (10.2% difference to median)
Compared to same class
» 7% of all tested devices in this class were better, 2% similar, 90% worse
» The best had a delta of 5%, average was 18%, worst was 53%
Compared to all devices tested
» 5% of all tested devices were better, 1% similar, 94% worse
» The best had a delta of 4%, average was 23%, worst was 134%
| Off / Standby | |
| Idle | |
| Load |
|
Key:
min: | |
| Acer Spin 5 SP513-51 6100U, HD Graphics 520, Hynix HFS128G39TND, IPS LED, 1920x1080, 13.3" | Acer Spin 7 SP714-51-M09D i5-7Y54, HD Graphics 615, Kingston RBUSNS4180S3256GG, IPS, 1920x1080, 14" | Dell Inspiron 13 7359-4839 6500U, HD Graphics 520, Liteonit LCH-256V2S, IPS, 1920x1080, 13.3" | Lenovo Yoga 510-14IKB i5-7200U, Radeon R5 M430, Samsung MZYTY256HDHP, IPS, 1920x1080, 14" | HP Pavilion x360 13-u102ng i5-7200U, HD Graphics 620, HGST Travelstar 5K1000 HTS541010A7E630, IPS, 1920x1080, 13.3" | |
|---|---|---|---|---|---|
| Power Consumption | -1% | -4% | -34% | -15% | |
| Idle Minimum * (Watt) | 4.1 | 4.3 -5% | 4 2% | 3.9 5% | 4.7 -15% |
| Idle Average * (Watt) | 6.8 | 7.4 -9% | 4.8 29% | 7.1 -4% | 7.2 -6% |
| Idle Maximum * (Watt) | 7.9 | 8 -1% | 7.6 4% | 7.7 3% | 7.9 -0% |
| Load Average * (Watt) | 20.4 | 22.1 -8% | 30 -47% | 33.4 -64% | 30 -47% |
| Load Maximum * (Watt) | 26.8 | 21.7 19% | 29.3 -9% | 55.9 -109% | 29 -8% |
* ... smaller is better
| Acer Spin 5 SP513-51 6100U, HD Graphics 520, 45 Wh | Acer Spin 7 SP714-51-M09D i5-7Y54, HD Graphics 615, 42 Wh | Dell Inspiron 13 7359-4839 6500U, HD Graphics 520, 44 Wh | Lenovo Yoga 510-14IKB i5-7200U, Radeon R5 M430, 35 Wh | HP Pavilion x360 13-u102ng i5-7200U, HD Graphics 620, 41 Wh | Lenovo Yoga 910-13IKB-80VF004CGE i7-7500U, HD Graphics 620, 78 Wh | |
|---|---|---|---|---|---|---|
| Battery runtime | 2% | 2% | -15% | -31% | 38% | |
| Reader / Idle (h) | 12.5 | 12.5 0% | 14.8 18% | 12 -4% | 9.3 -26% | 17.8 42% |
| WiFi v1.3 (h) | 7.7 | 6.5 -16% | 8.1 5% | 6.2 -19% | 5.4 -30% | 10.7 39% |
| Load (h) | 2.2 | 2.7 23% | 1.8 -18% | 1.7 -23% | 1.4 -36% | 2.9 32% |
| H.264 (h) | 5.3 |
Pros
Cons
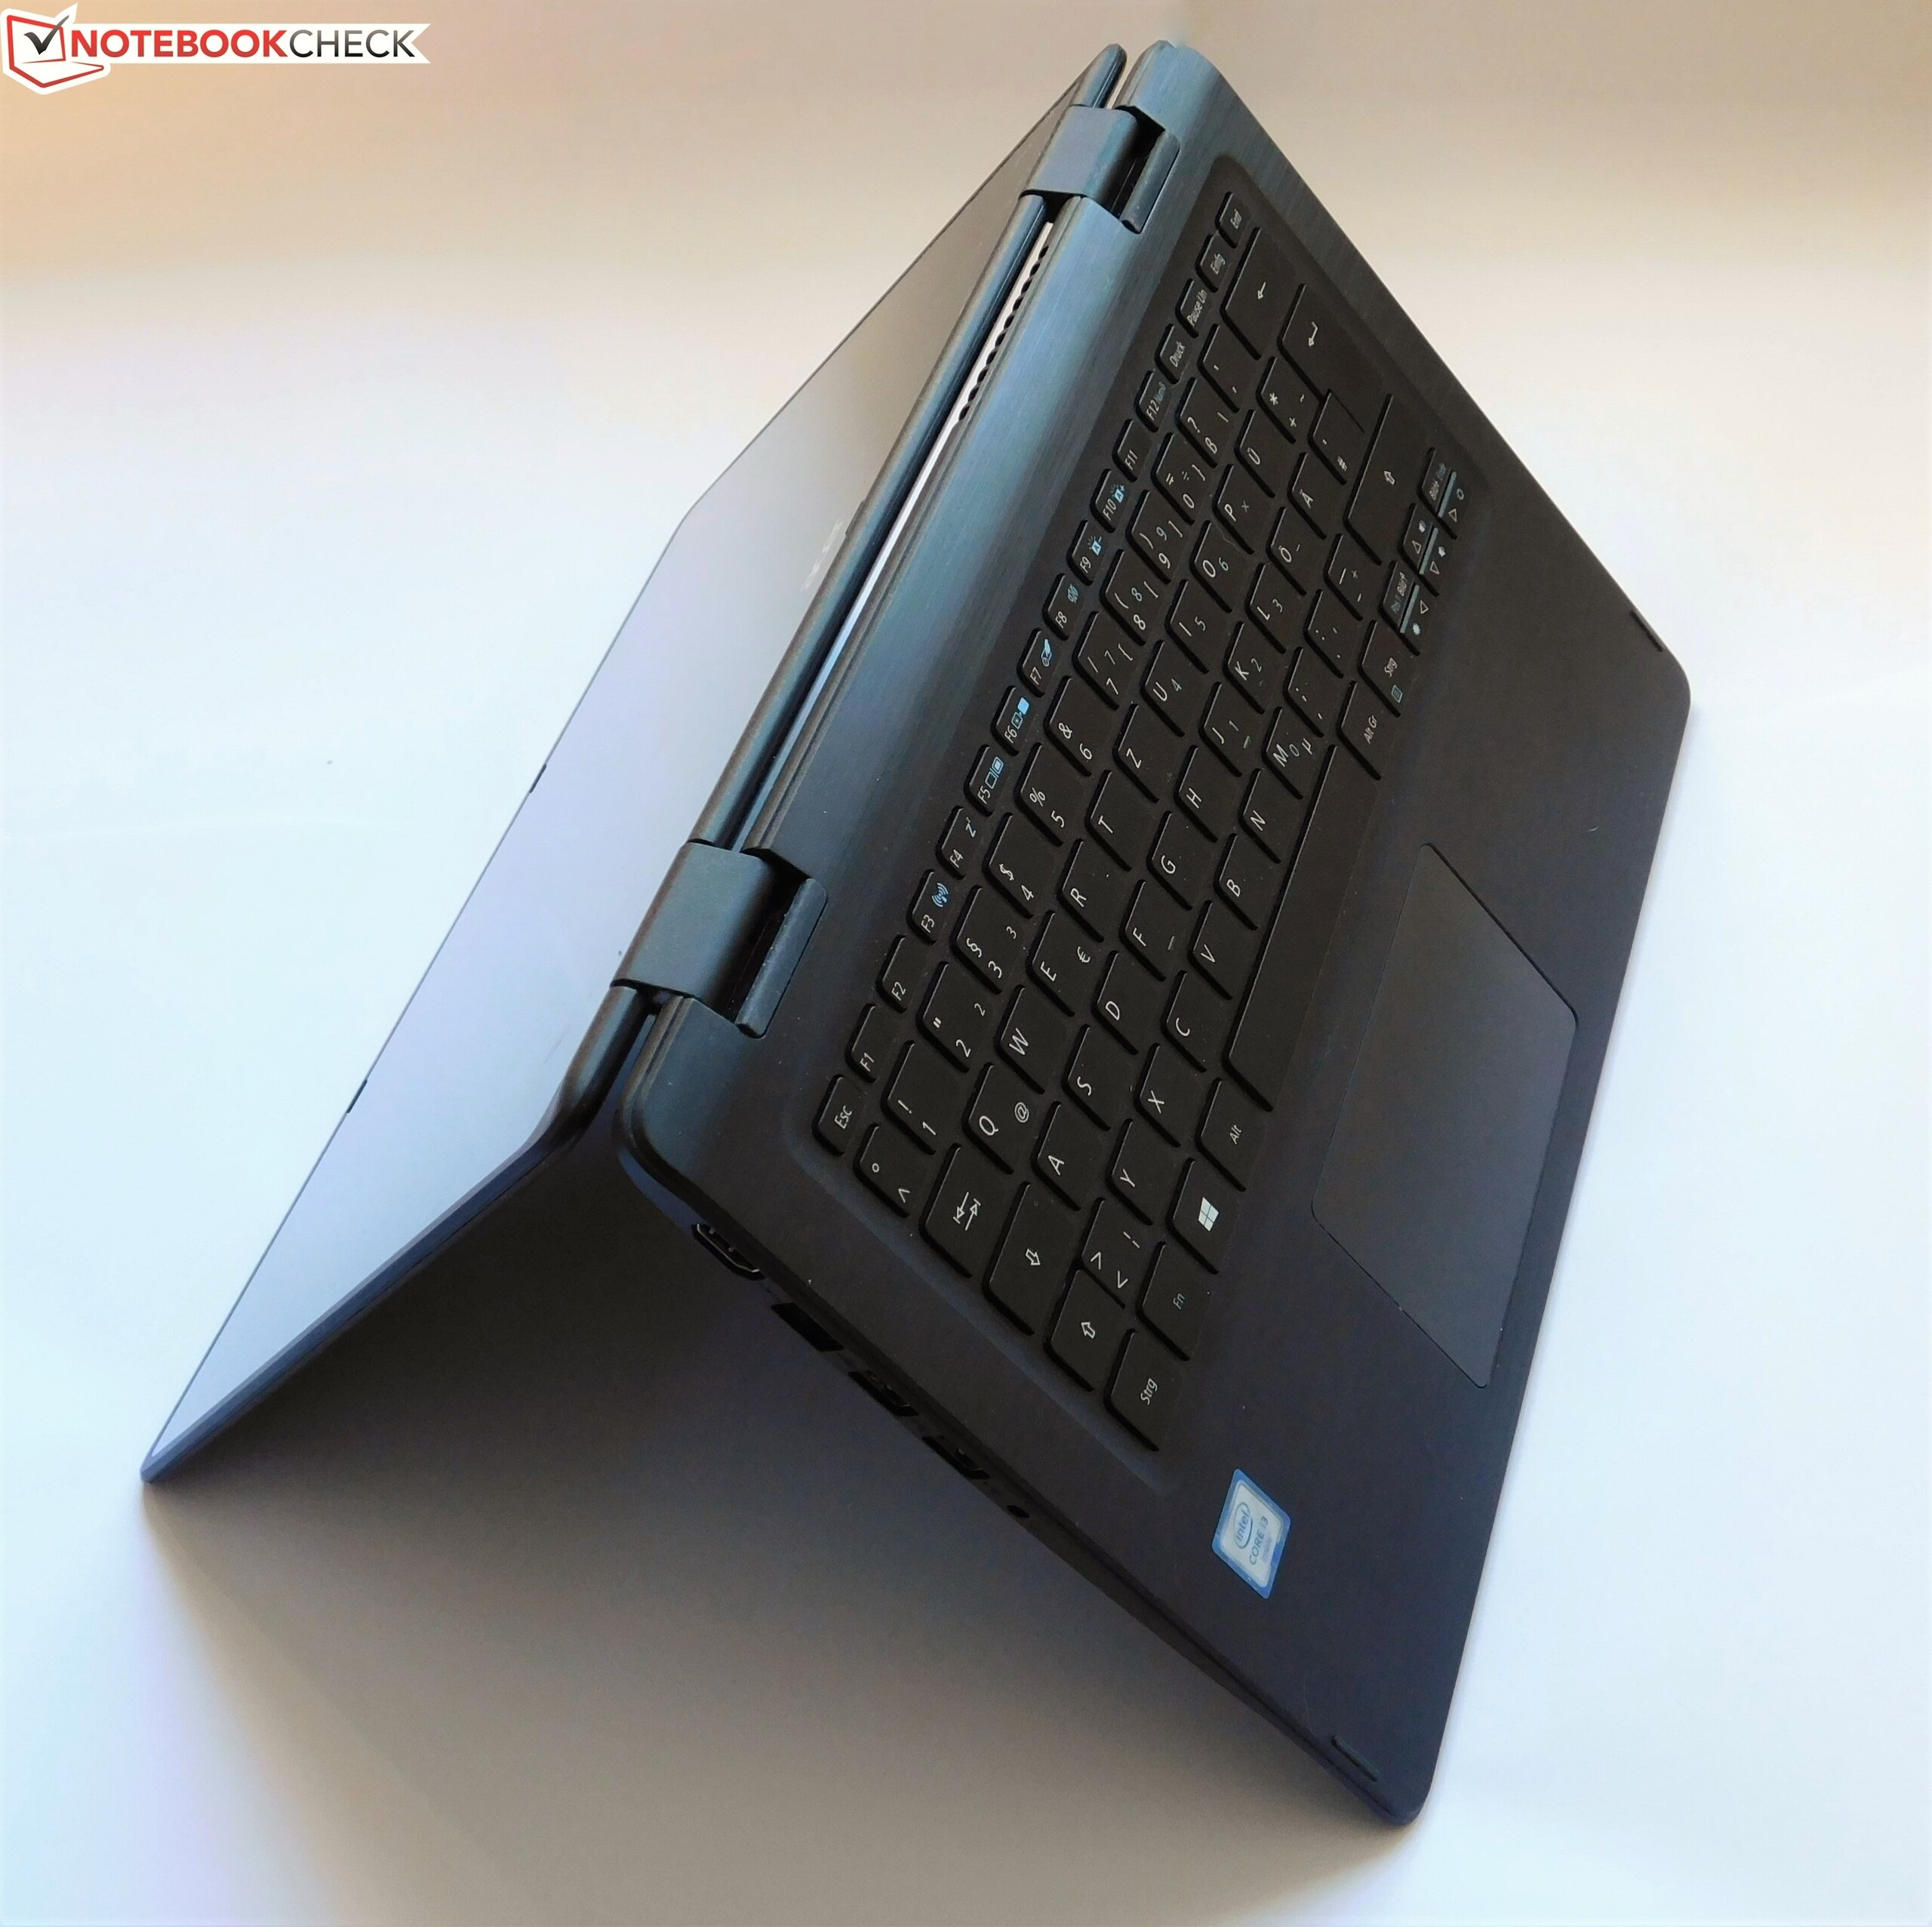
宏碁Spin 5相当成功。该测试机风扇安静,冷却能力良好而且触摸板精准。机身外壳,屏幕和电池续航时间都是平均水准,不存在明显缺陷。
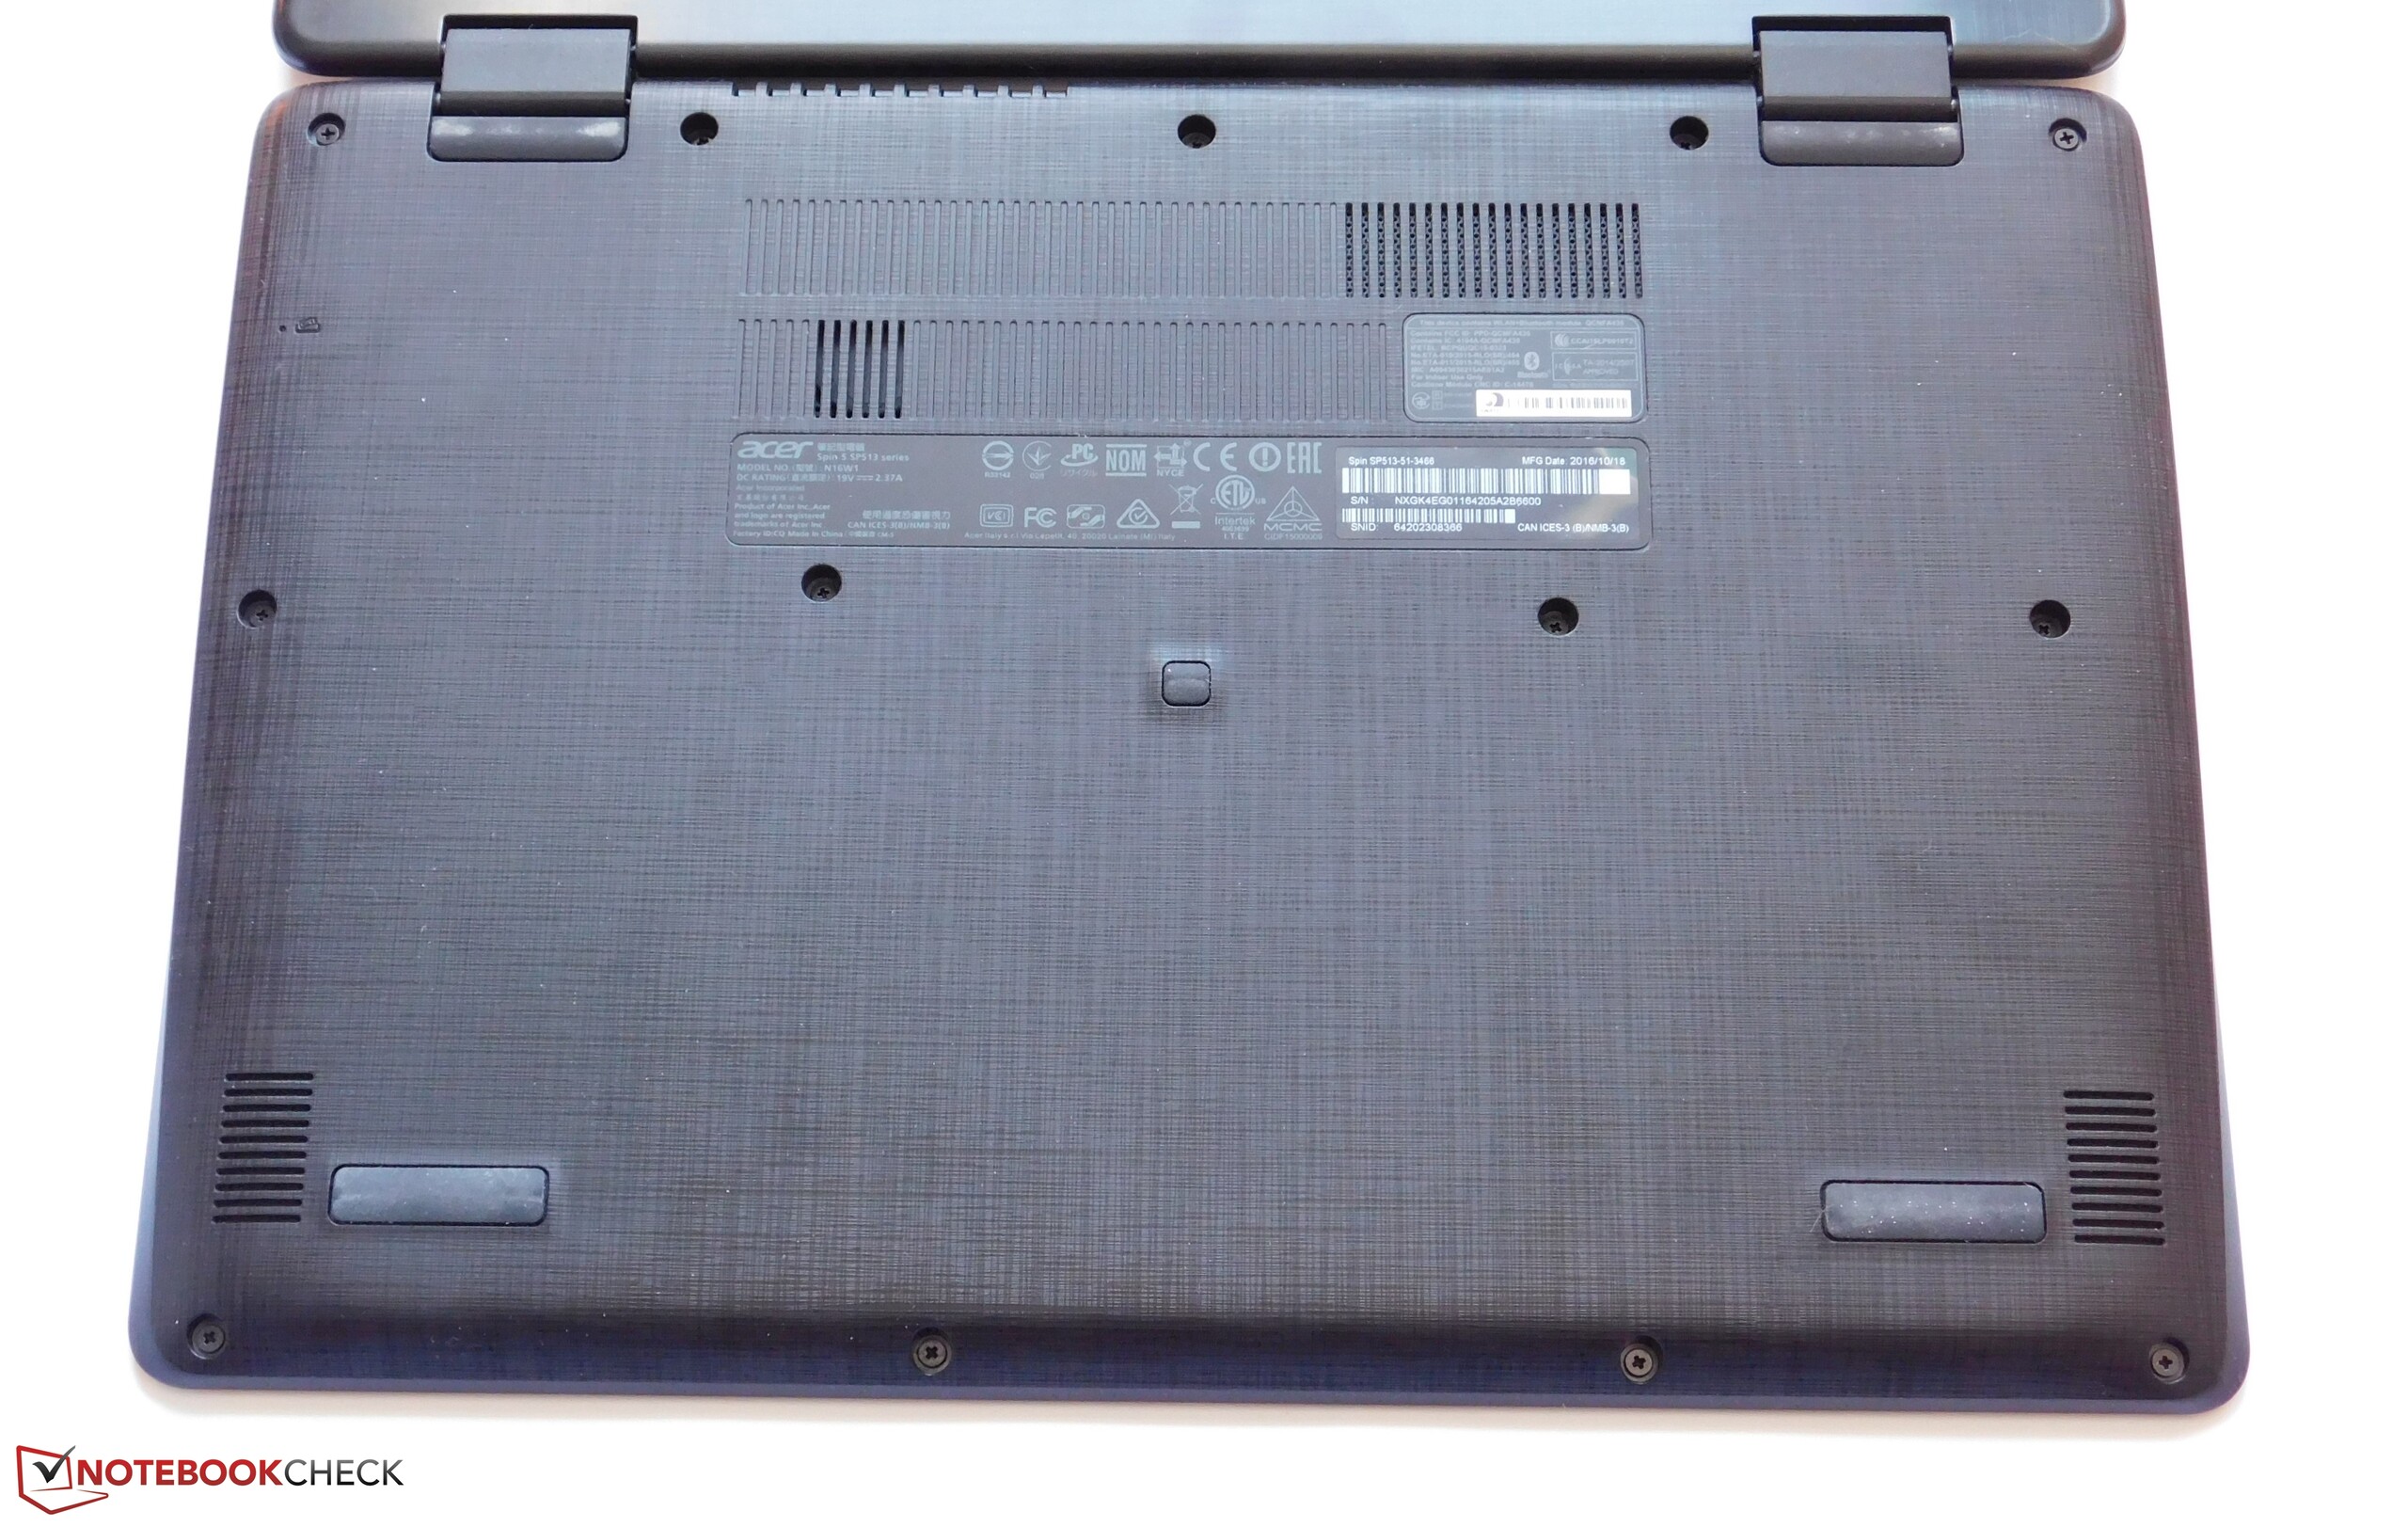
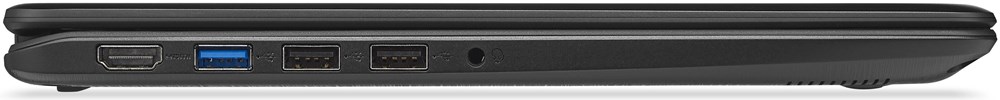
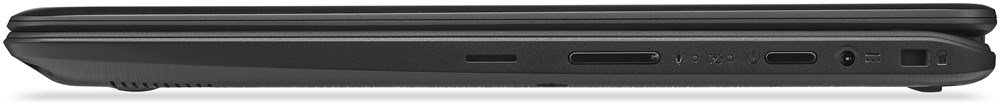
键盘理应受到批评,因为它的输入的体验令人不满。拥挤的按键布局,可能导致输入错误。而它的接口:USB Type-C和SD卡读卡器缺失(只有microSD读卡器)。电池的漫长的充电时间也有点烦人。
我们推荐购买宏碁Spin 5。它有很多优点; 当然,键盘差了些。它最大的优点是风扇安静和机身低温。
总之,宏碁Spin 5仍值得推荐。它价格便宜,用于上网冲浪和办公。这些方面是它的强项。酷睿i3不是特别强大,但是笔记本的低温和安静却是回报。
然而,它的竞争对手拥有更好的性价比: 联想 Yoga 510-14IKB搭载了Core i3-7100U, 128 GB固态硬盘和4 GB内存,价格便宜了50欧元(~52美元)。惠普Pavilion x360 13 和宏碁Spin 5一样贵, 而它搭载了Core i5-7200U和8 GB内存, 但他是1 TB机械硬盘而不是128 GB固态硬盘, 所以你必须在性能和容量之间做出选择。当然,机械硬盘会有一定的噪声。
注:本文是基于完整评测的缩减版本,阅读完整的英文评测,请点击这里。
Acer Spin 5 SP513-51
- 01/23/2017 v6 (old)
Benjamin Herzig
Price comparison
