宏碁 TravelMate P4 笔记本电脑评测:轻描淡写只为老板

几年来,宏碁的 TravelMate 系列一直在与戴尔 Latitudes 的粉丝俱乐部、联想 ThinkPads 的良好声誉以及惠普 ProBooks 的商务光环作斗争。要想在主流商务笔记本电脑领域占据一席之地并非易事,最好的办法就是向企业大宗销售。
多年来,我们一直陪伴着 TravelMates 一起奋斗。他们做得并不差,随着 TravelMate P6 TMP614P我们甚至有一款候选产品在实验室中达到了 88%,相当于 "非常好"。但 P4 型号的情况却并非如此,之前的 TravelMate P4 达到了 86%。结果是,我们的推荐总是倾向于性价比更高的 ThinkPad,并继续在前十名中占据主导地位。
现在的情况是否也会如此,或者宏碁能否凭借 2024 TravelMate P4 稳住阵脚?这款 14 英寸笔记本电脑的价格在 900 到 1000 欧元(约合 979-1,087 美元)之间,属于中端产品,因此它必须与 ProBooks、配置简单的 Latitudes 和联想的 E 系列 ThinkPads 竞争。虽然设备不是最好的,但它采用了 猛禽湖酷睿 i5、512 GB 和 8 GB 内存,但应该能吸引一些注重价格的买家。此外,宏碁还彻底改造了输入设备和连接位置,与 TravelMate P4 TMP414-51-59MR的前身。不过,这就足够了吗?
潜在的竞争对手比较
Rating | Date | Model | Weight | Height | Size | Resolution | Price |
|---|---|---|---|---|---|---|---|
| 85.9 % v7 (old) | 01 / 2024 | Acer TravelMate P4 TMP414-53-58XQ i5-1335U, Iris Xe G7 80EUs | 1.5 kg | 22 mm | 14.00" | 1920x1200 | |
| 90.3 % v7 (old) | 07 / 2023 | Dell Latitude 7440 i5-1345U, Iris Xe G7 80EUs | 1.2 kg | 17.95 mm | 14.00" | 2560x1600 | |
| 88.3 % v7 (old) | 08 / 2023 | Lenovo ThinkPad E14 G5-21JSS05C00 R7 7730U, Vega 8 | 1.4 kg | 18 mm | 14.00" | 2240x1400 | |
| 86 % v7 (old) | 10 / 2023 | Lenovo ThinkPad E14 G5 i7-1355U i7-1355U, Iris Xe G7 96EUs | 1.5 kg | 17.99 mm | 14.00" | 1920x1200 | |
| 85.3 % v7 (old) | 03 / 2023 | HP ProBook 440 G9-5Y3Z3EA i7-1255U, Iris Xe G7 96EUs | 1.4 kg | 20.4 mm | 14.00" | 1920x1080 | |
| 84.6 % v7 (old) | 10 / 2023 | HP ProBook 445 G10 R5 7530U, Vega 7 | 1.3 kg | 20 mm | 14.00" | 1920x1080 | |
| 82.1 % v7 (old) | 06 / 2023 | Fujitsu LifeBook E5412A E542AMHAAMDE R5 PRO 5675U, Vega 7 | 1.4 kg | 19.9 mm | 14.00" | 1920x1080 |
案例
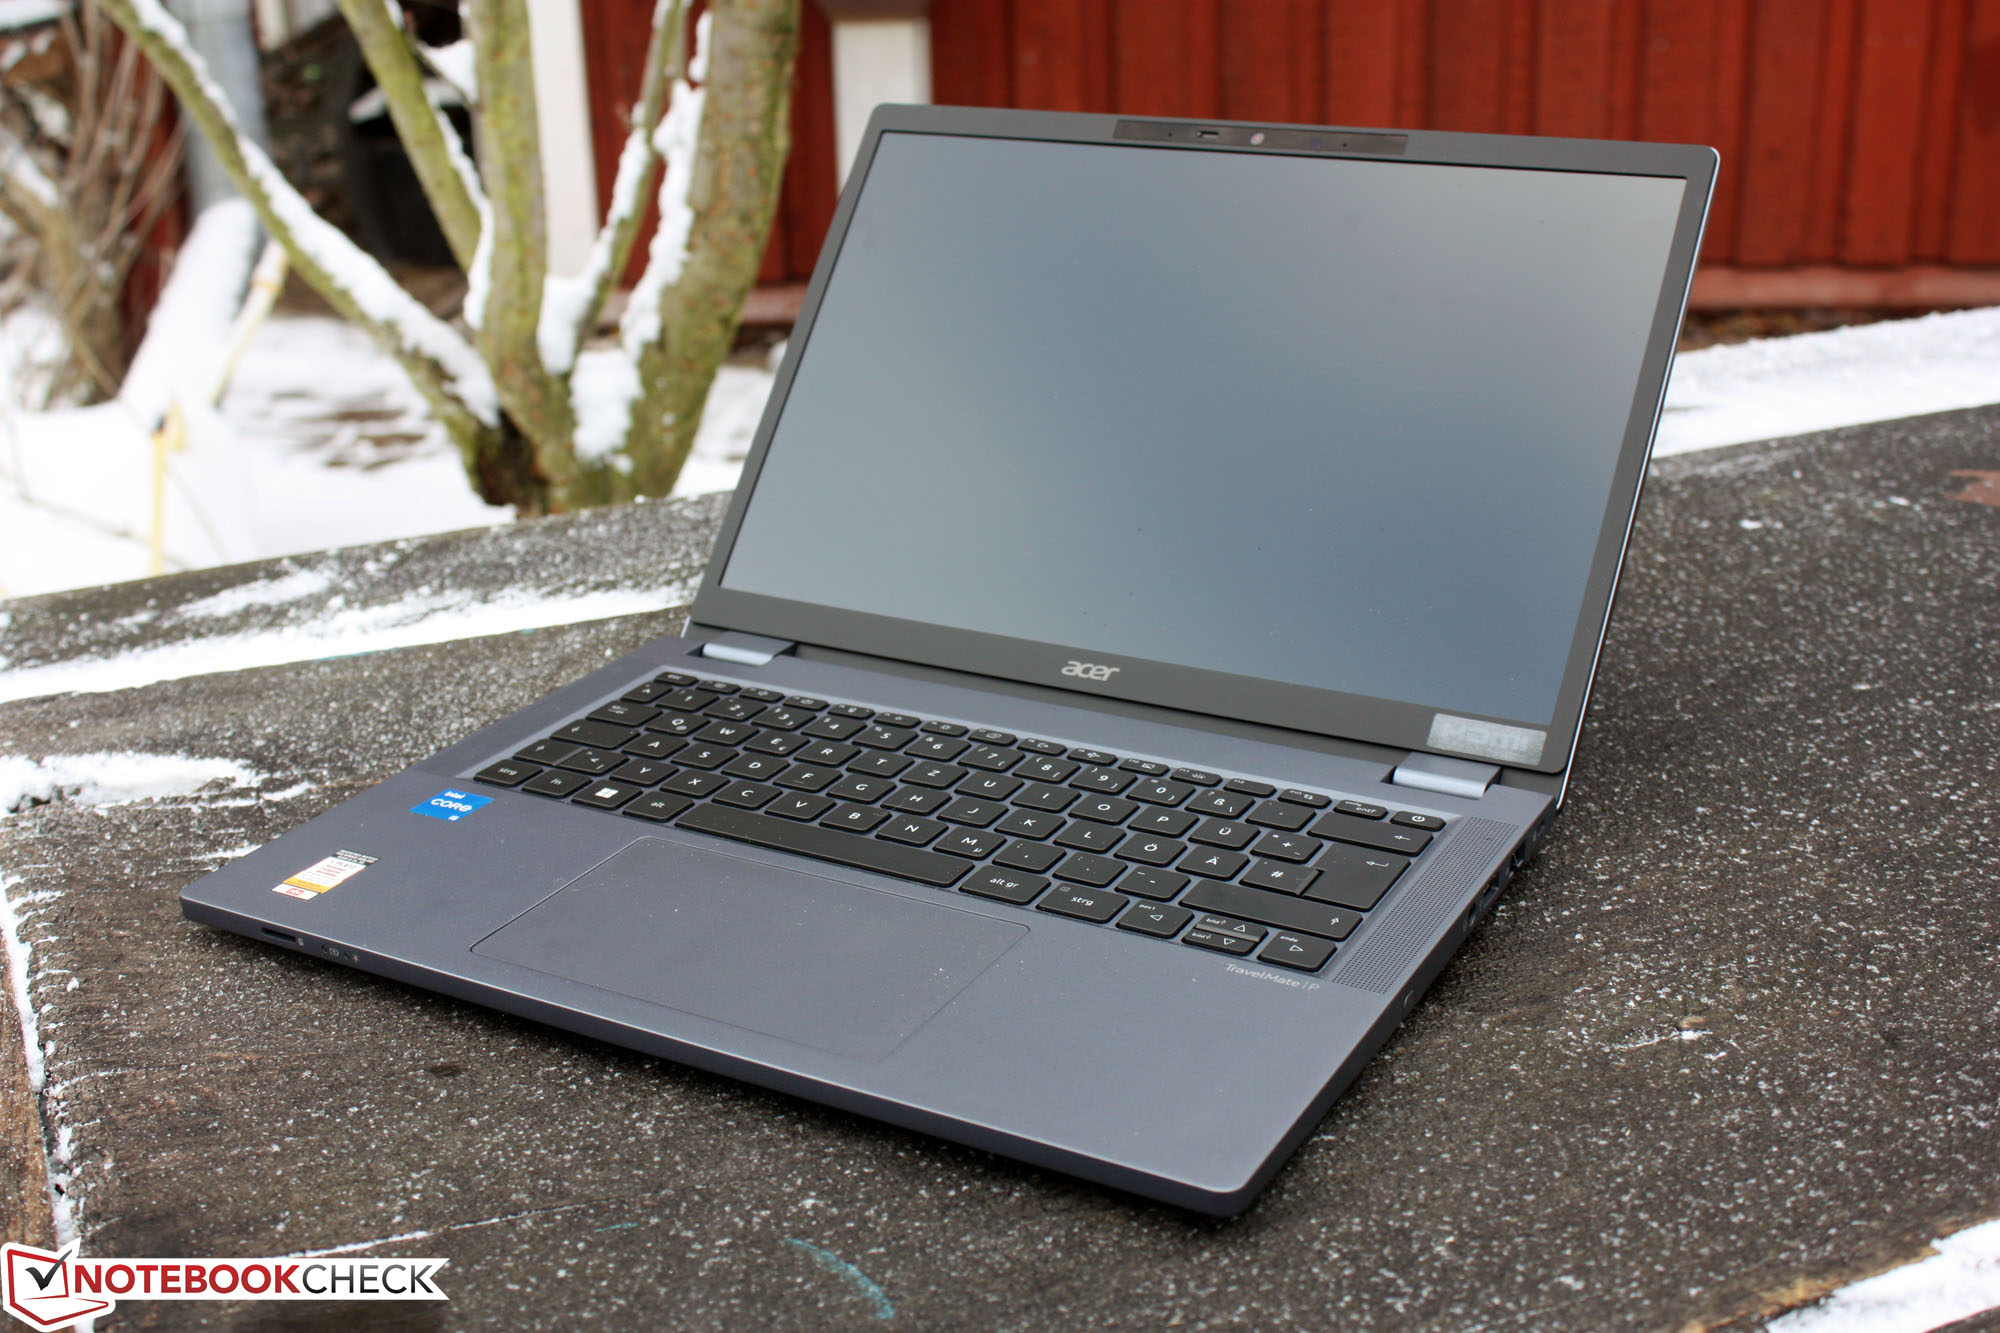
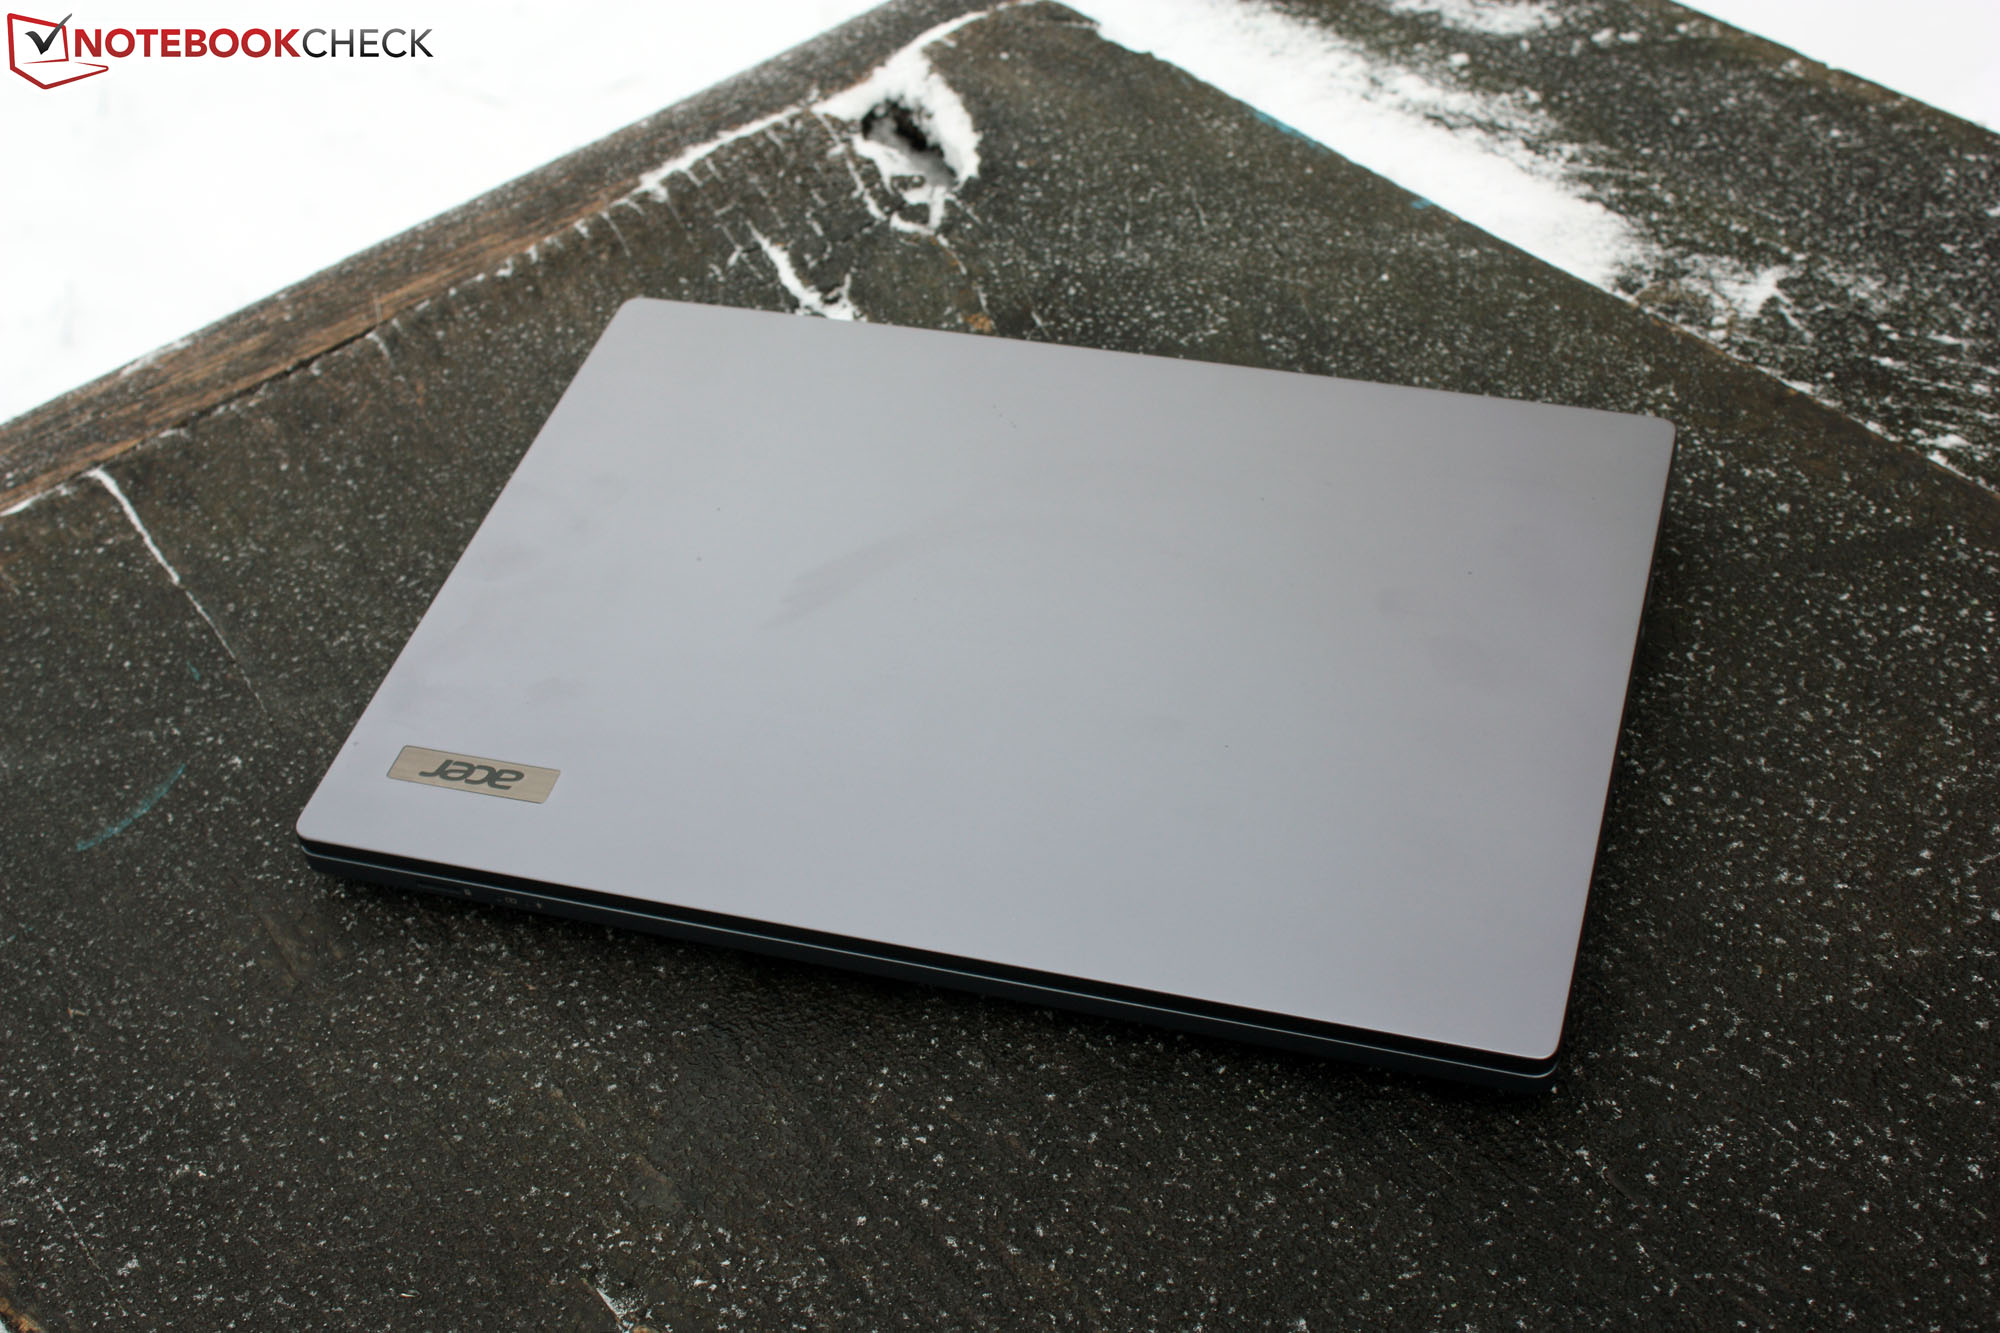
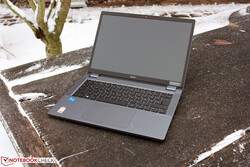
简洁的鼠标灰色外壳可以说是不显眼的化身。带着 TravelMate 出差的人肯定不会注意到它。不过这也没什么,因为作为一款办公用笔记本电脑,它需要的不仅仅是装饰性的镀铬条。14 英寸的外壳棱角分明,坚固耐用,但并不出色。掌托和键盘区域即使施加一定的压力也不会有任何松动。16:10 的显示屏设计使得掌托很深,也为大手提供了足够的舒适空间。铰链将显示屏紧紧固定在原位,因此在携带笔记本电脑时不会移动。显示屏盖子可完全打开至 180 度。
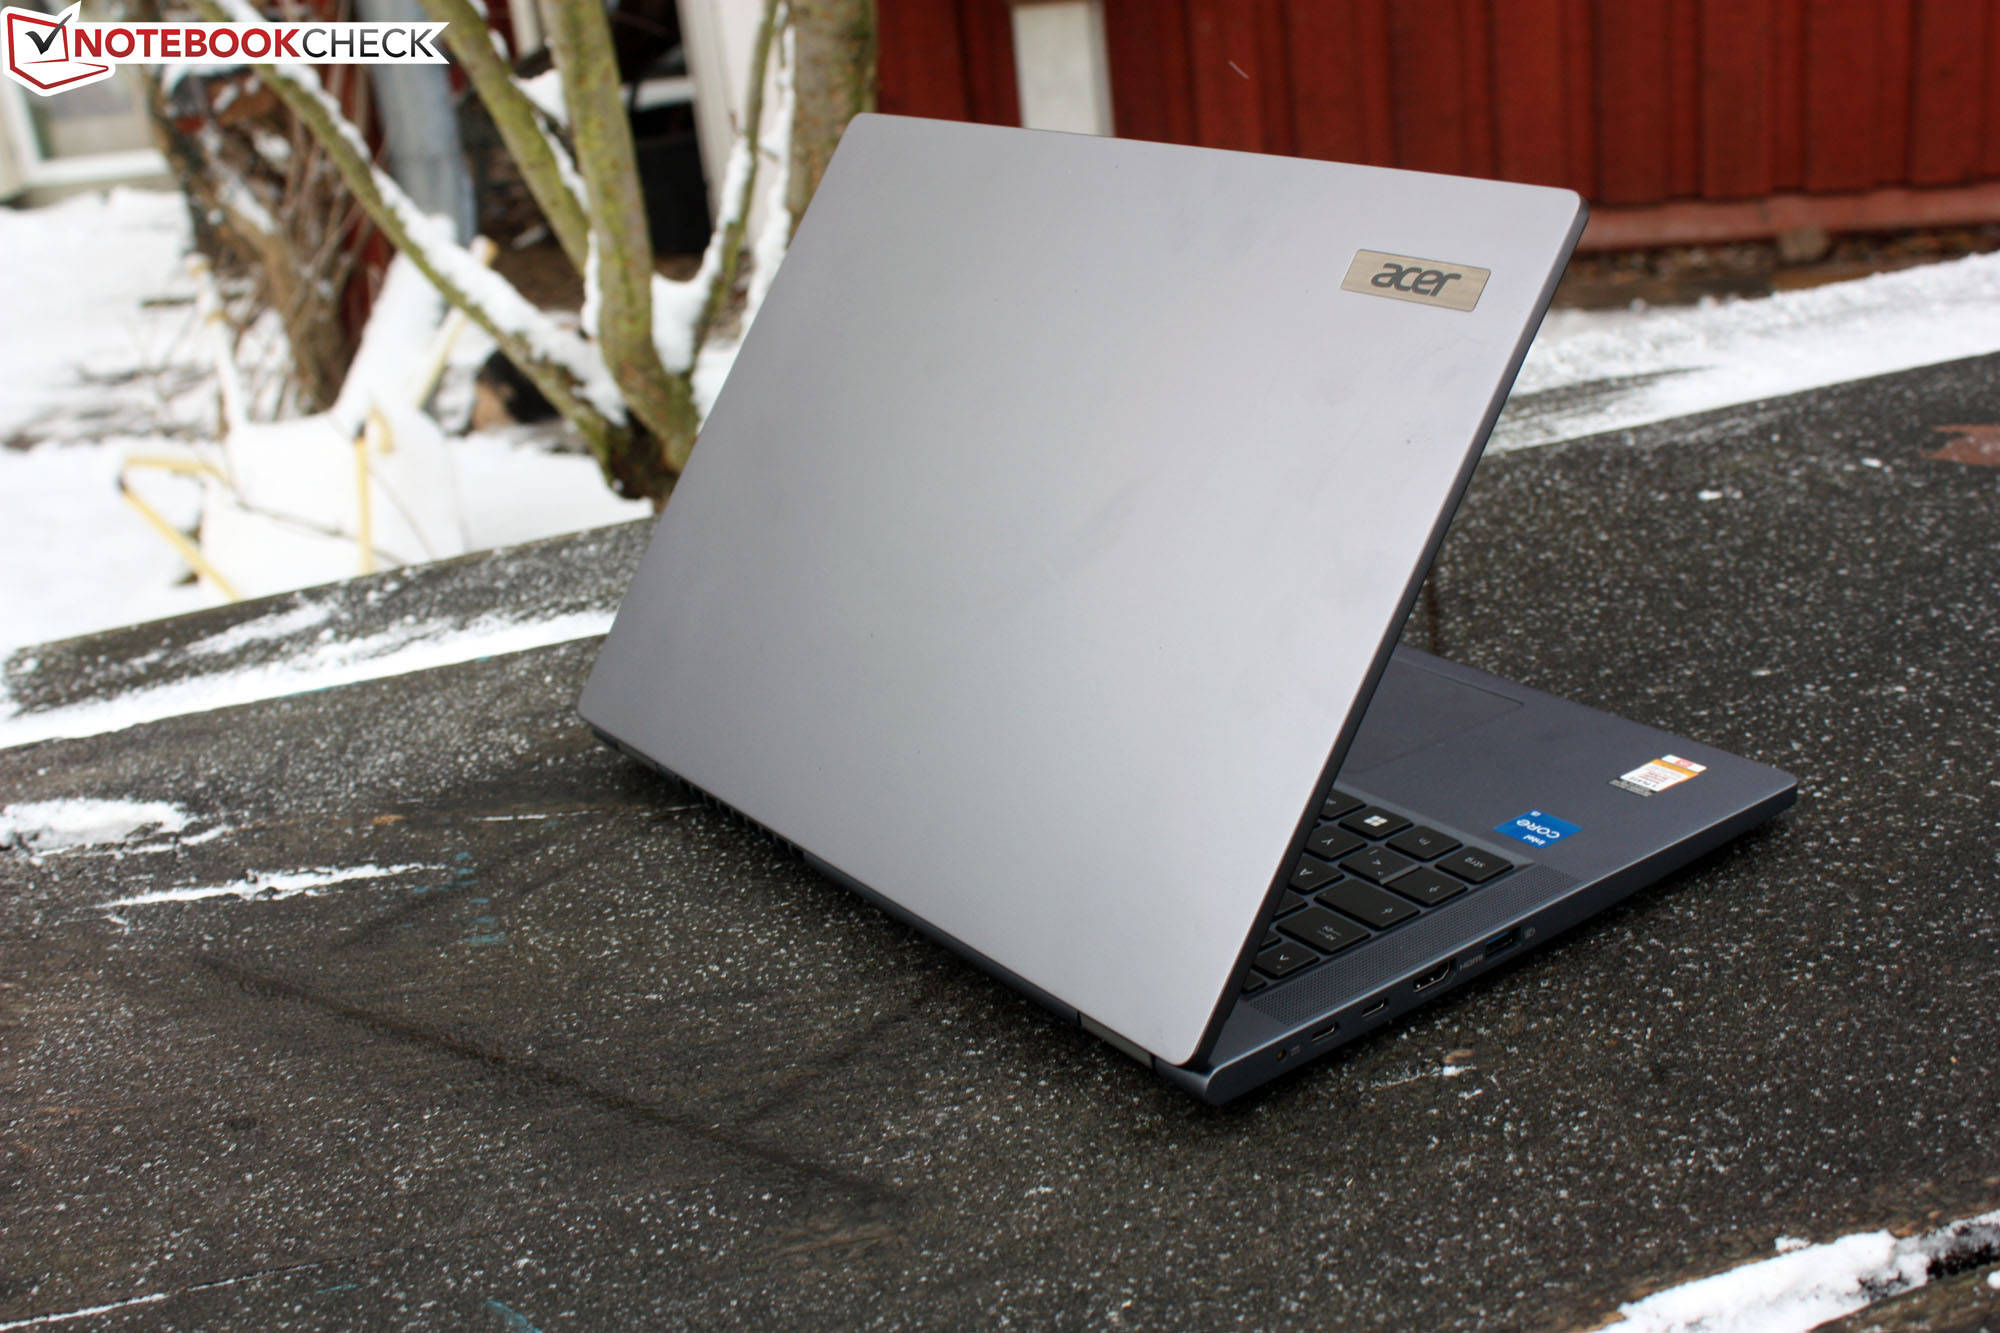
14 英寸笔记本电脑比 DIN A4 纸宽 1 厘米、深 1 厘米,宽度为 31.9 厘米(12.6 英寸)。两款 ThinkPad 都略显紧凑,在显示屏对角线相同的情况下,显示屏边框更小,从而在宽度和深度方面都节省了几毫米。尽管中端办公笔记本电脑并不追求尽可能的纤薄,但它们的厚度也不尽相同:宏碁测试机的背面厚度为 22 毫米(约 0.87 英寸),正面厚度为 19 毫米(约 0.75 英寸),比 ThinkPad、ProBook、LifeBook 和Latitude 厚。这些数值总是在没有脚垫的情况下指定的,加上脚垫的高度,TravelMate 的背面厚度甚至达到了 27 毫米(约 1.06 英寸),正面厚度达到了 21 毫米(约 0.83 英寸)。
设备
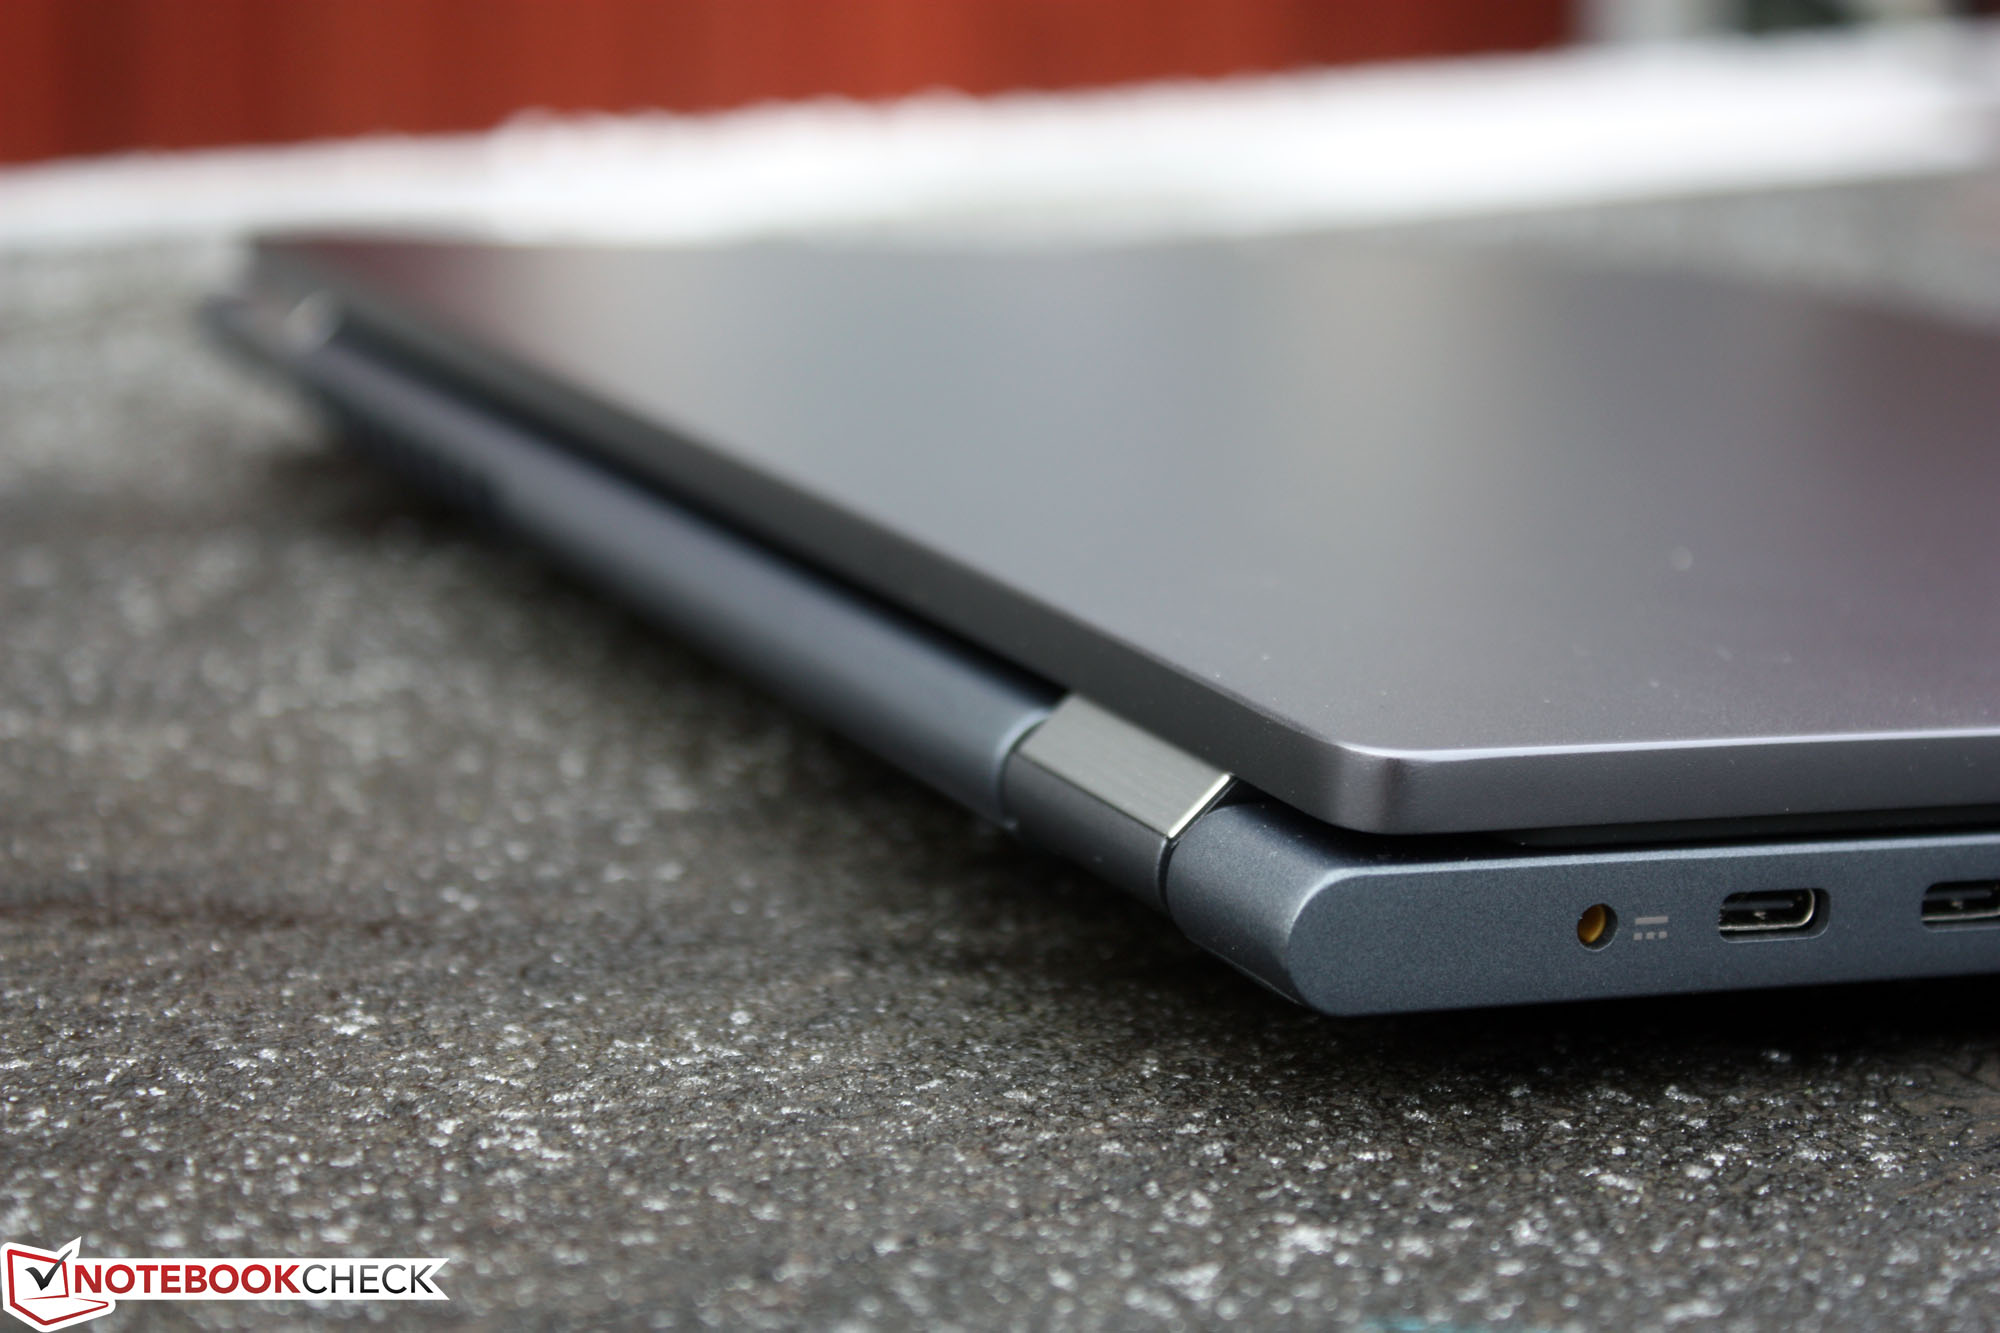
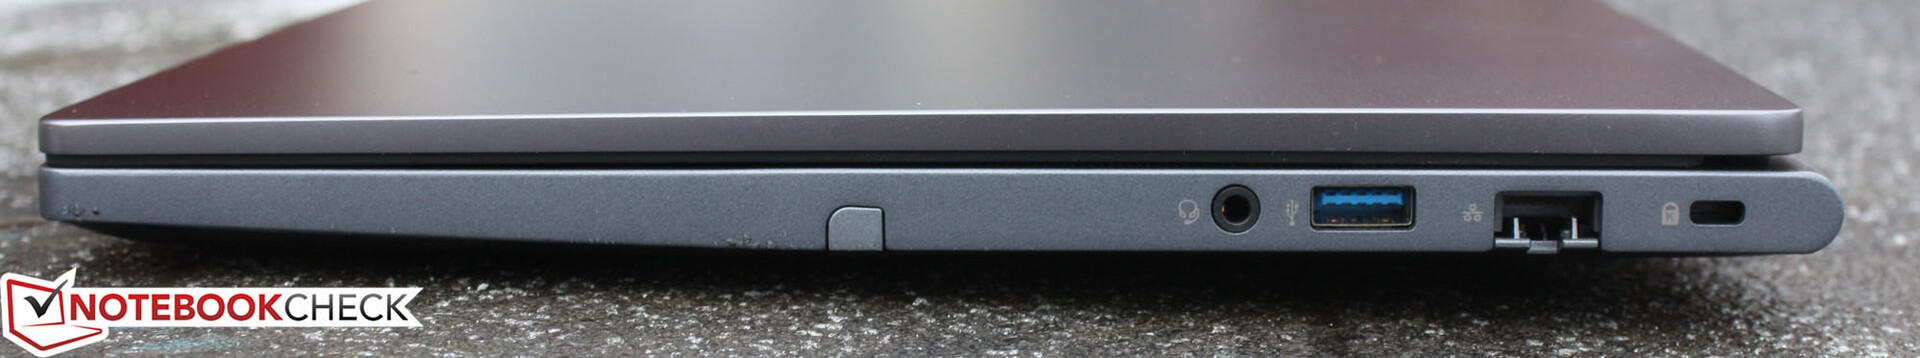
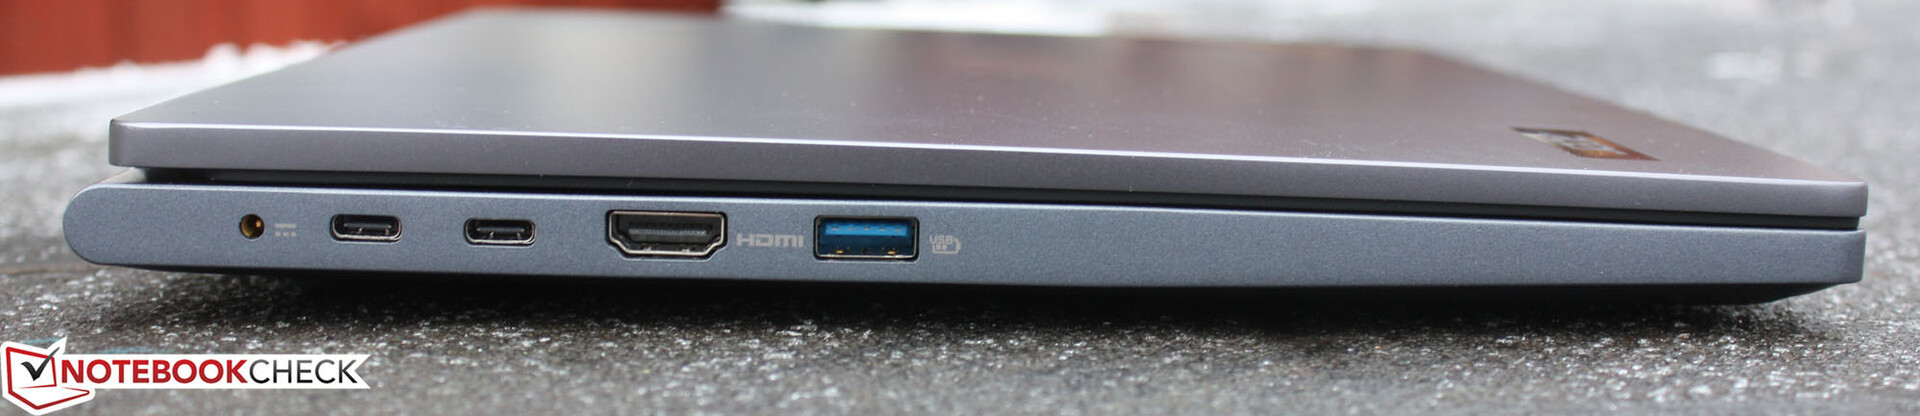
宏碁以 USB Type-C 端口的形式提供两个 Thunderbolt 连接,还包括 50 Mbit 的 USB 3.2。这样,您既可以使用经济实惠的 Type-C 底座,也可以使用功能强大的 Thunderbolt 底座。Thunderbolt 端口支持 Power Delivery,还能输出 DisplayPort 信号。加上 HDMI 端口,该笔记本电脑最多可提供三个视频输出端口。读卡器被放置在笔记本电脑的前部,这是非常罕见的。
SD 读卡器
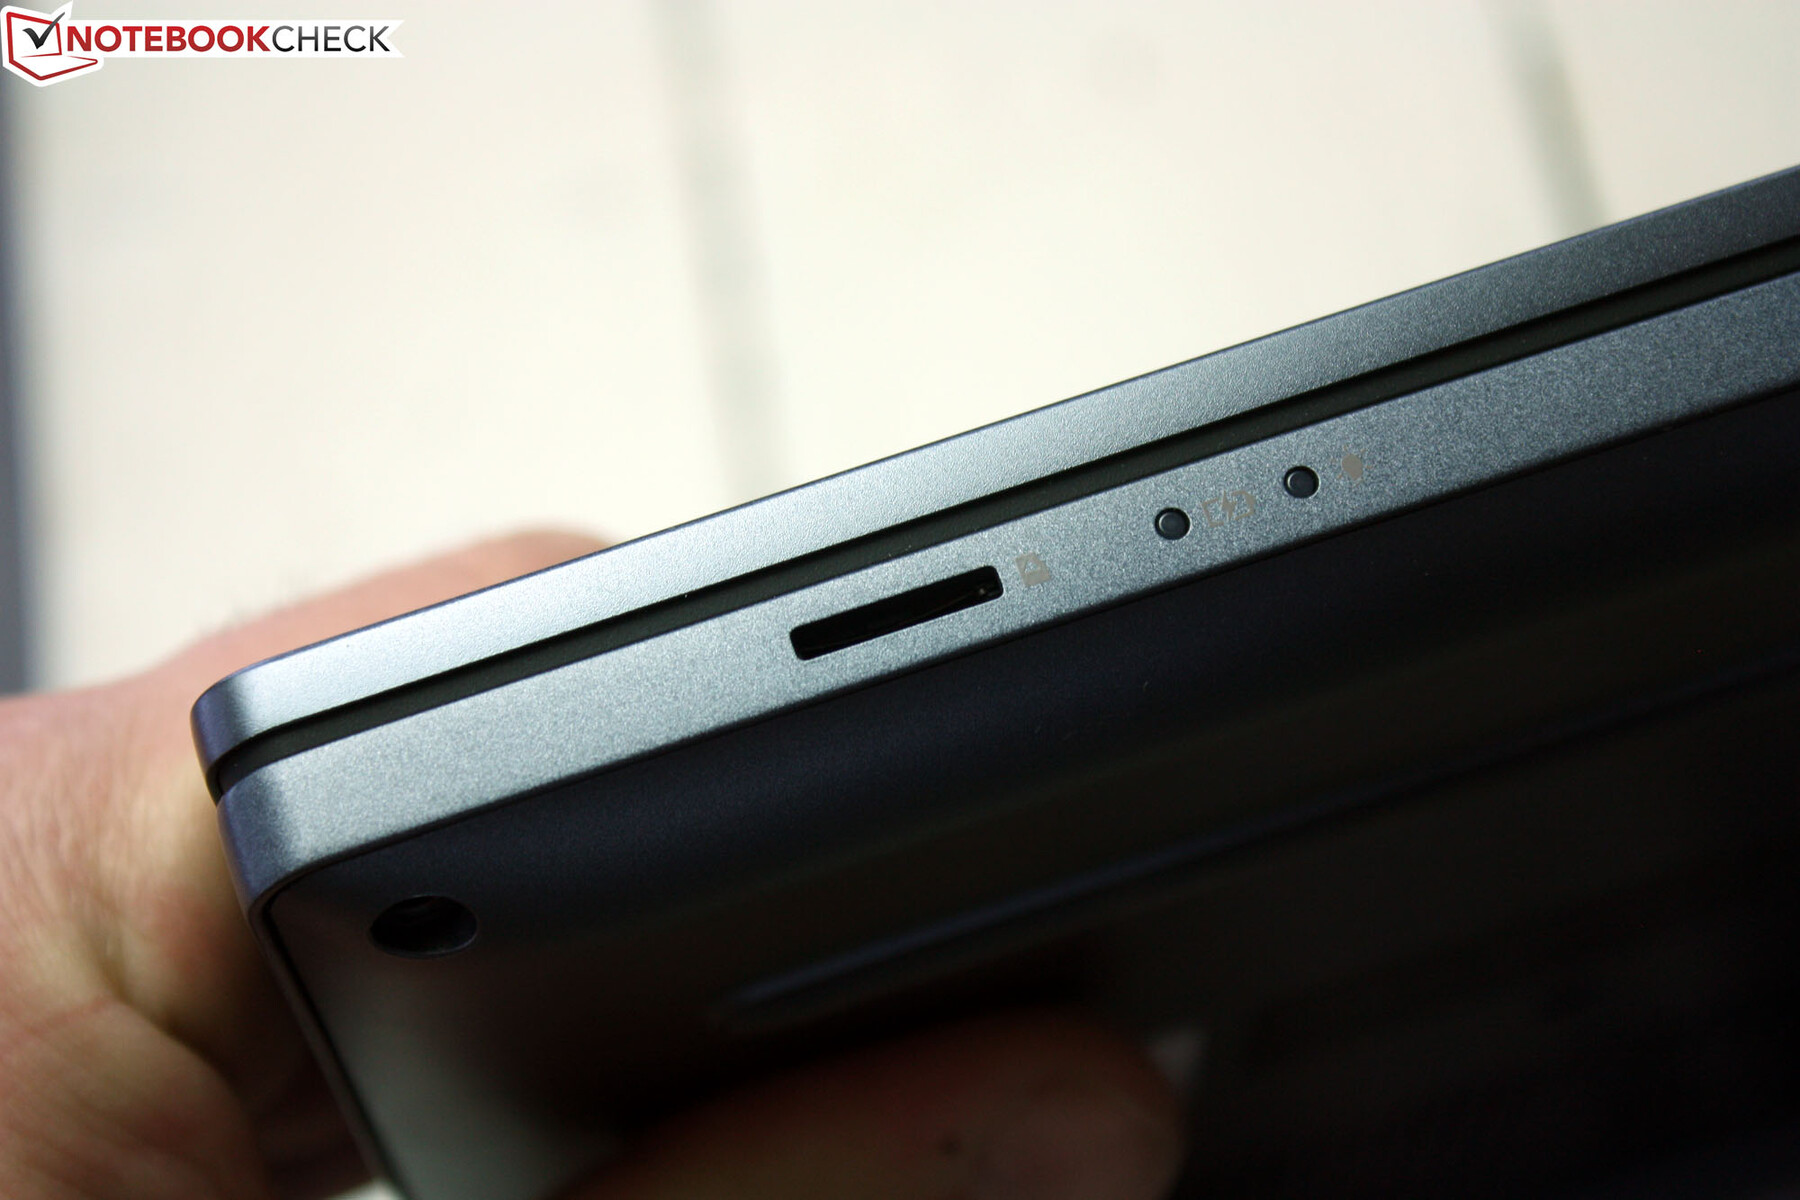
我们使用 AV-PRO 128-GB V60 microSD 参考卡对读卡器进行了测试。其不良结果是我们测量结果中最低的。
| SD Card Reader | |
| average JPG Copy Test (av. of 3 runs) | |
| Apple MacBook Pro 16 2023 M3 Max (Angelbird AV Pro V60) | |
| Lenovo ThinkPad P1 G6 21FV001KUS (Toshiba Exceria Pro SDXC 64 GB UHS-II) | |
| Lenovo ThinkBook 16 G6 ABP (Angelbird AV Pro V60) | |
| Average of class Subnotebook (23.7 - 188, n=9, last 2 years) | |
| Fujitsu LifeBook E5412A E542AMHAAMDE (AV Pro V60) | |
| Lenovo ThinkPad P16 G2 21FA000FGE | |
| Acer TravelMate P4 TMP414-53-58XQ (AV Pro SD microSD 128 GB V60) | |
| maximum AS SSD Seq Read Test (1GB) | |
| Apple MacBook Pro 16 2023 M3 Max (Angelbird AV Pro V60) | |
| Average of class Subnotebook (24.9 - 195, n=8, last 2 years) | |
| Lenovo ThinkPad P1 G6 21FV001KUS (Toshiba Exceria Pro SDXC 64 GB UHS-II) | |
| Fujitsu LifeBook E5412A E542AMHAAMDE (AV Pro V60) | |
| Lenovo ThinkBook 16 G6 ABP (Angelbird AV Pro V60) | |
| Lenovo ThinkPad P16 G2 21FA000FGE | |
| Acer TravelMate P4 TMP414-53-58XQ (AV Pro SD microSD 128 GB V60) | |
交流
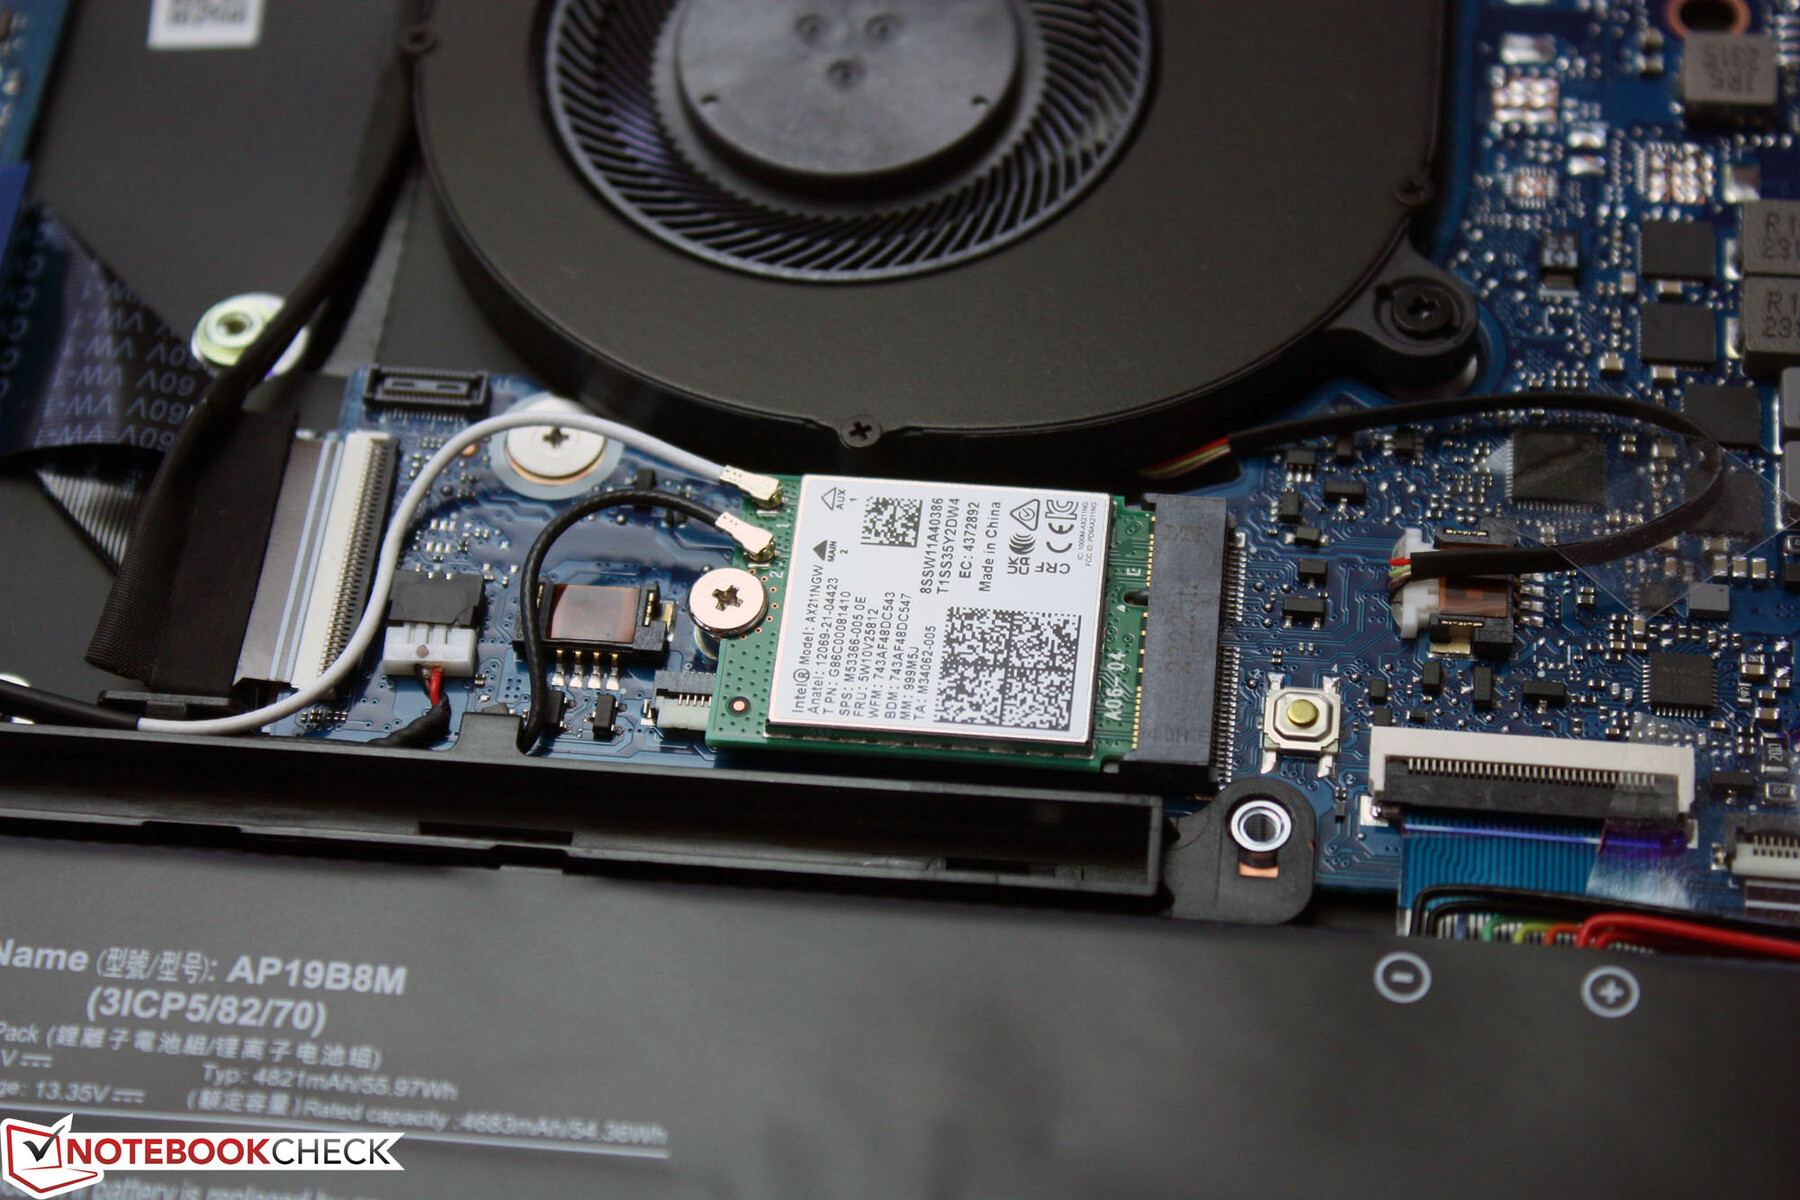
通信模块是主板上的 M.2-2230 卡。英特尔 Wi-Fi 6 AX211 还支持蓝牙 5.3。据制造商称,该芯片在有数十台路由器和数百台连接设备的密集 WLAN 环境中应特别强大,例如,它可以减少延迟。蓝牙 5.3 支持低能耗音频信号。TravelMate 以优异的成绩通过了我们的测试(关闭周围的 Wi-Fi 噪音)。按照商务笔记本电脑的要求,TravelMate 还配备了有线以太网连接。Realtek 千兆网卡有一个典型的折叠式端口。
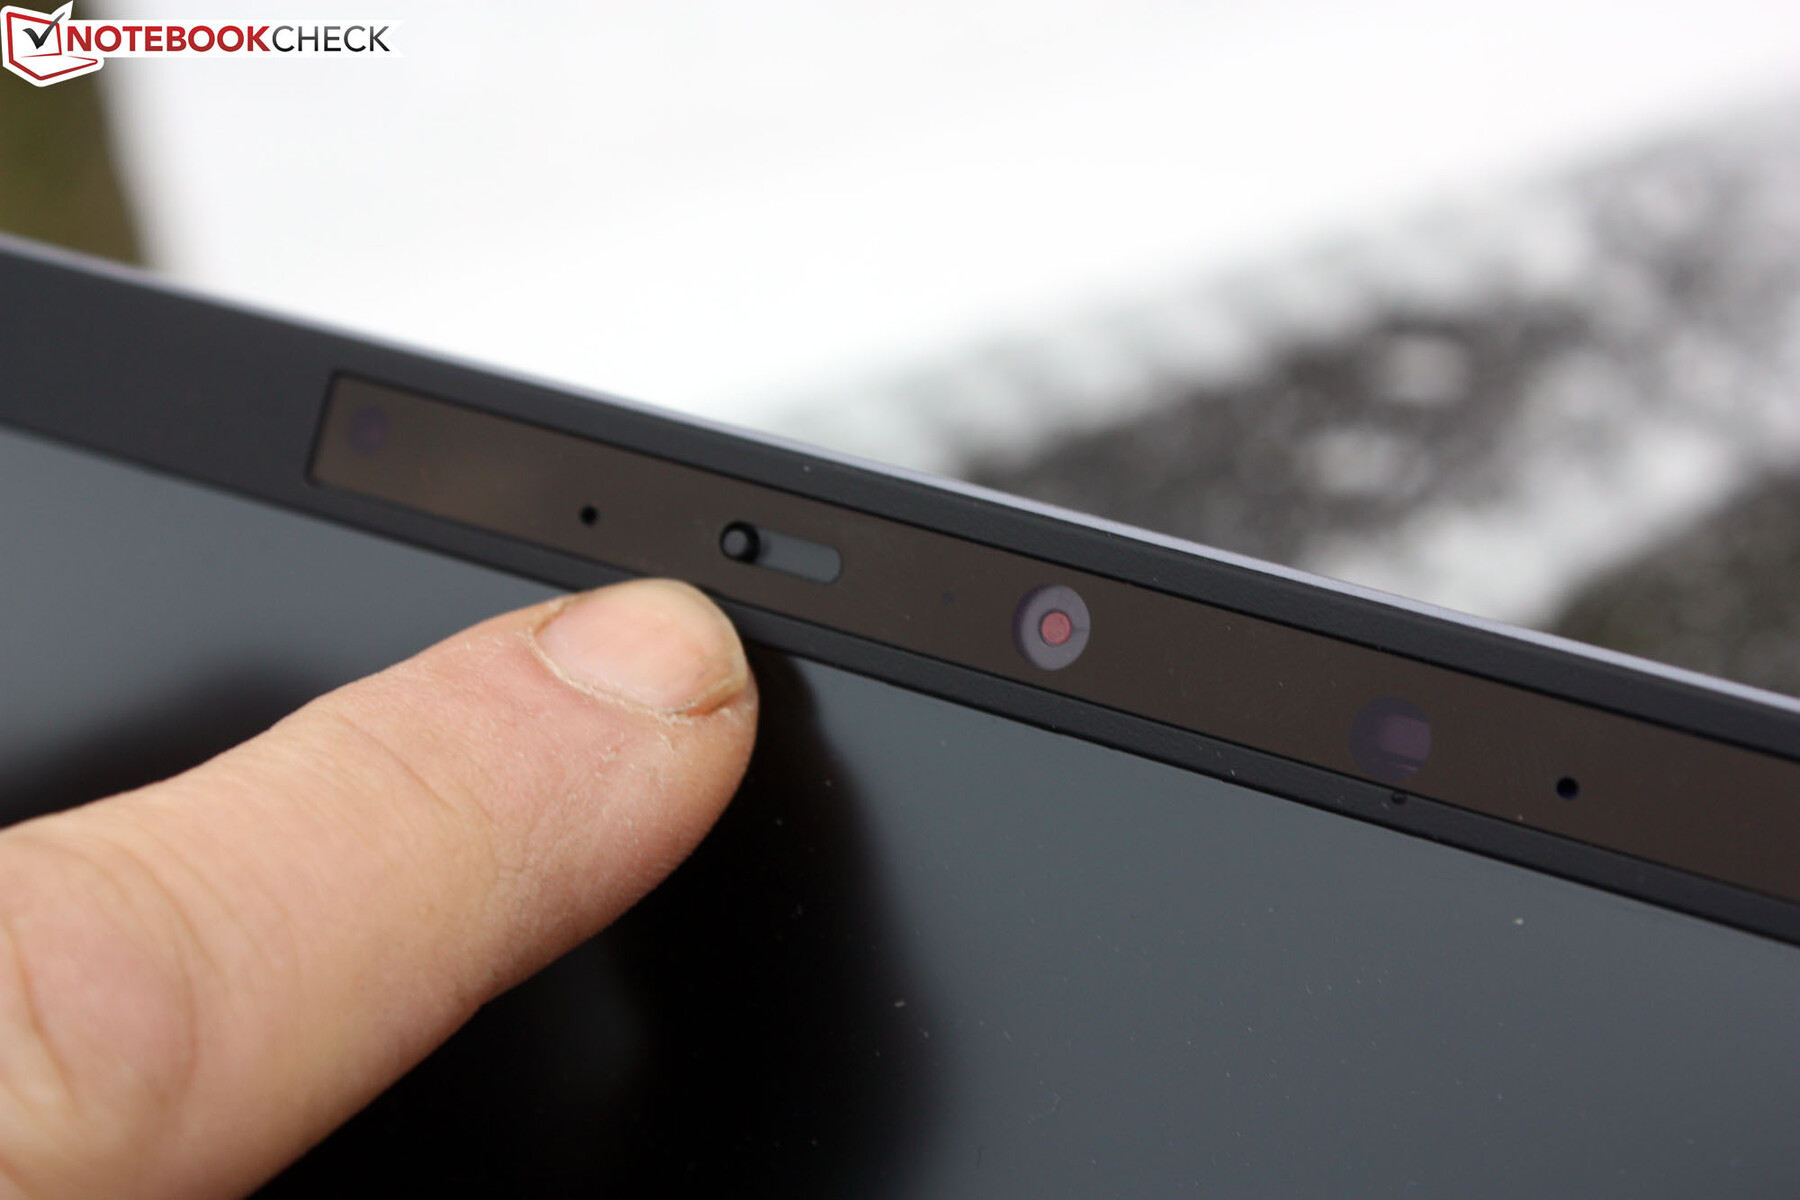
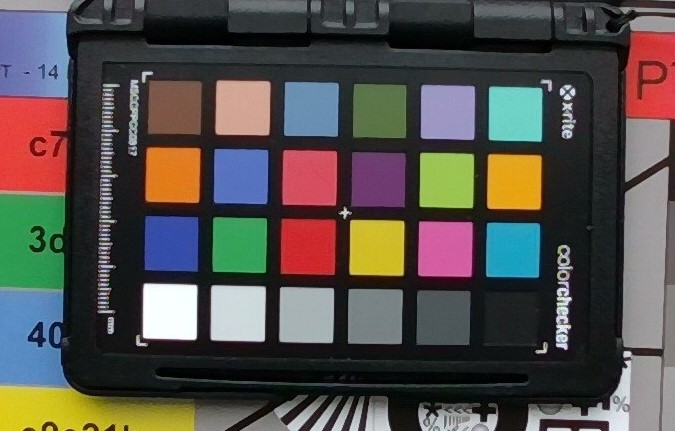
网络摄像头
细心的用户可以用手动快门锁定 720p 摄像机。该相机可提供可接受的色彩,但只能在日光或良好的照明条件下使用。


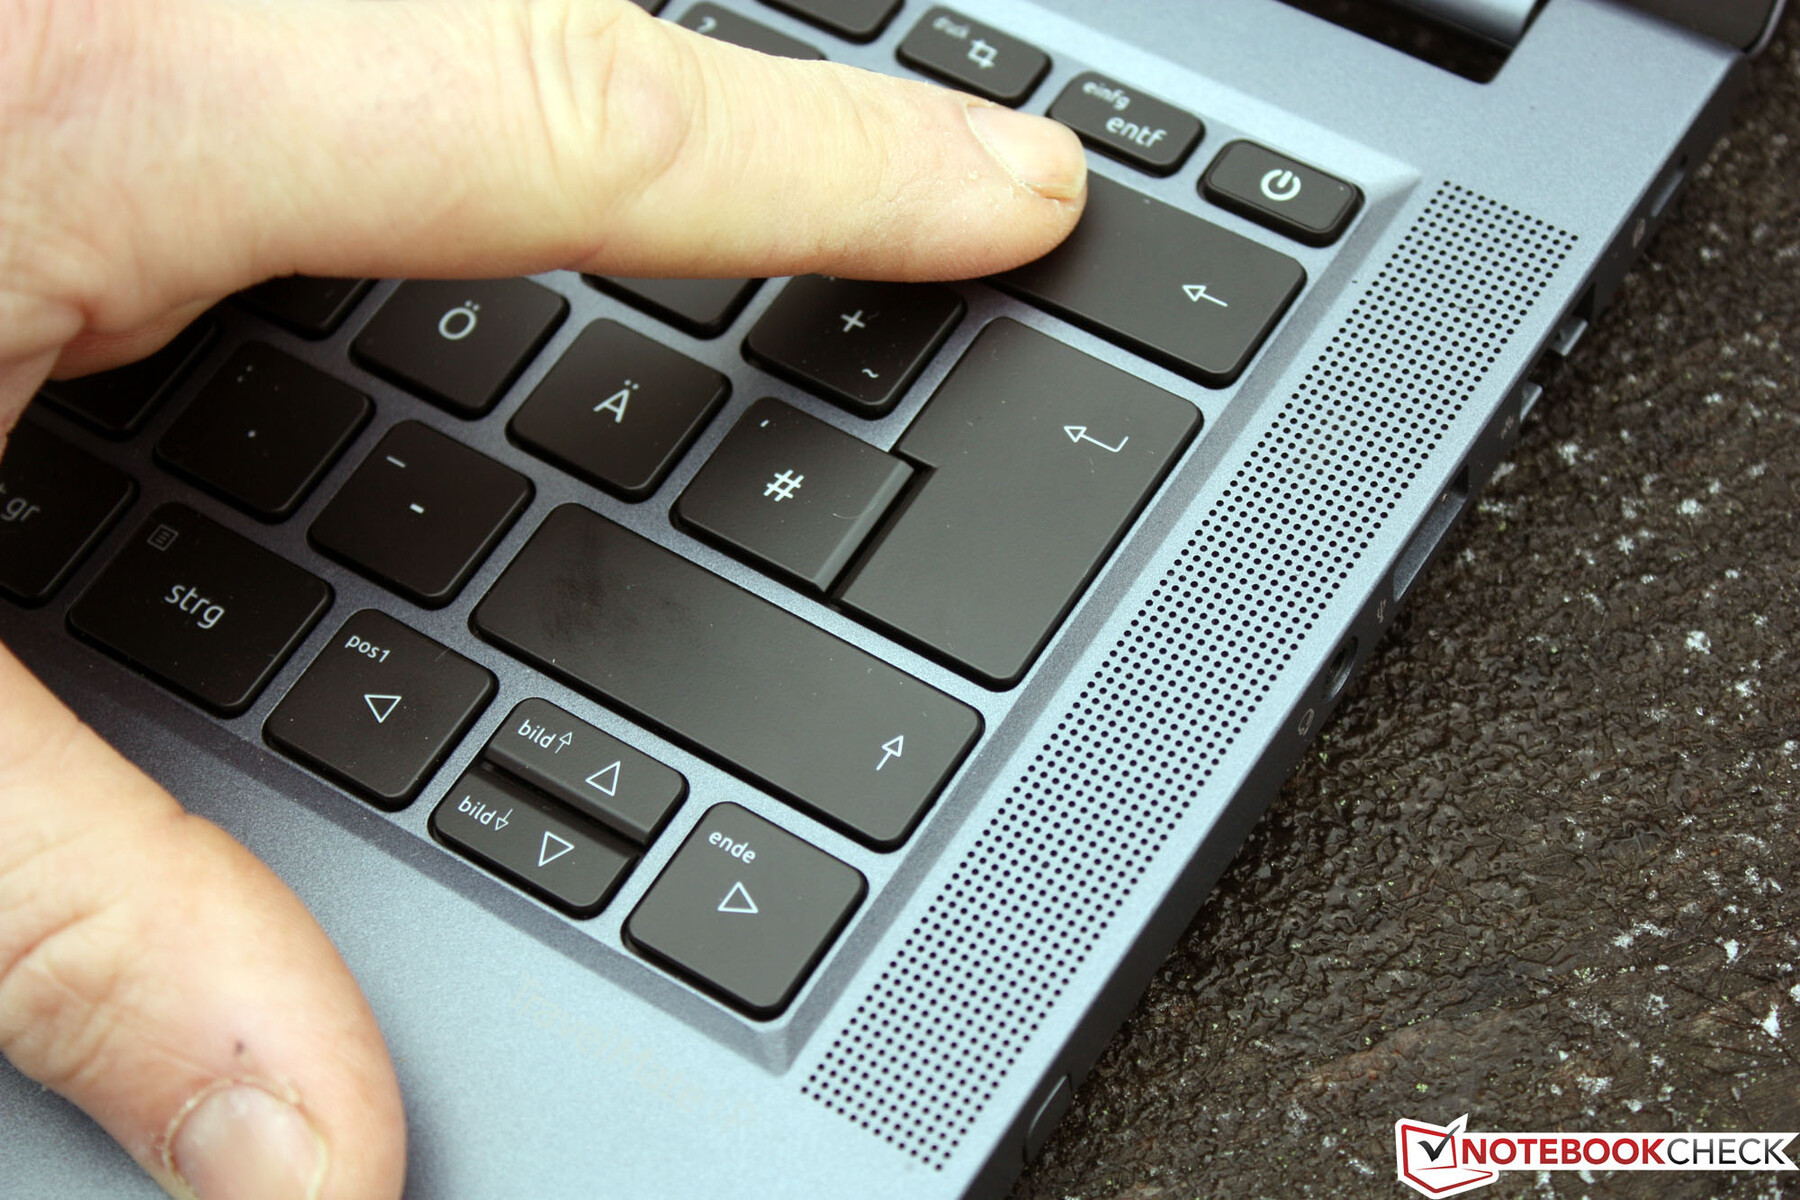
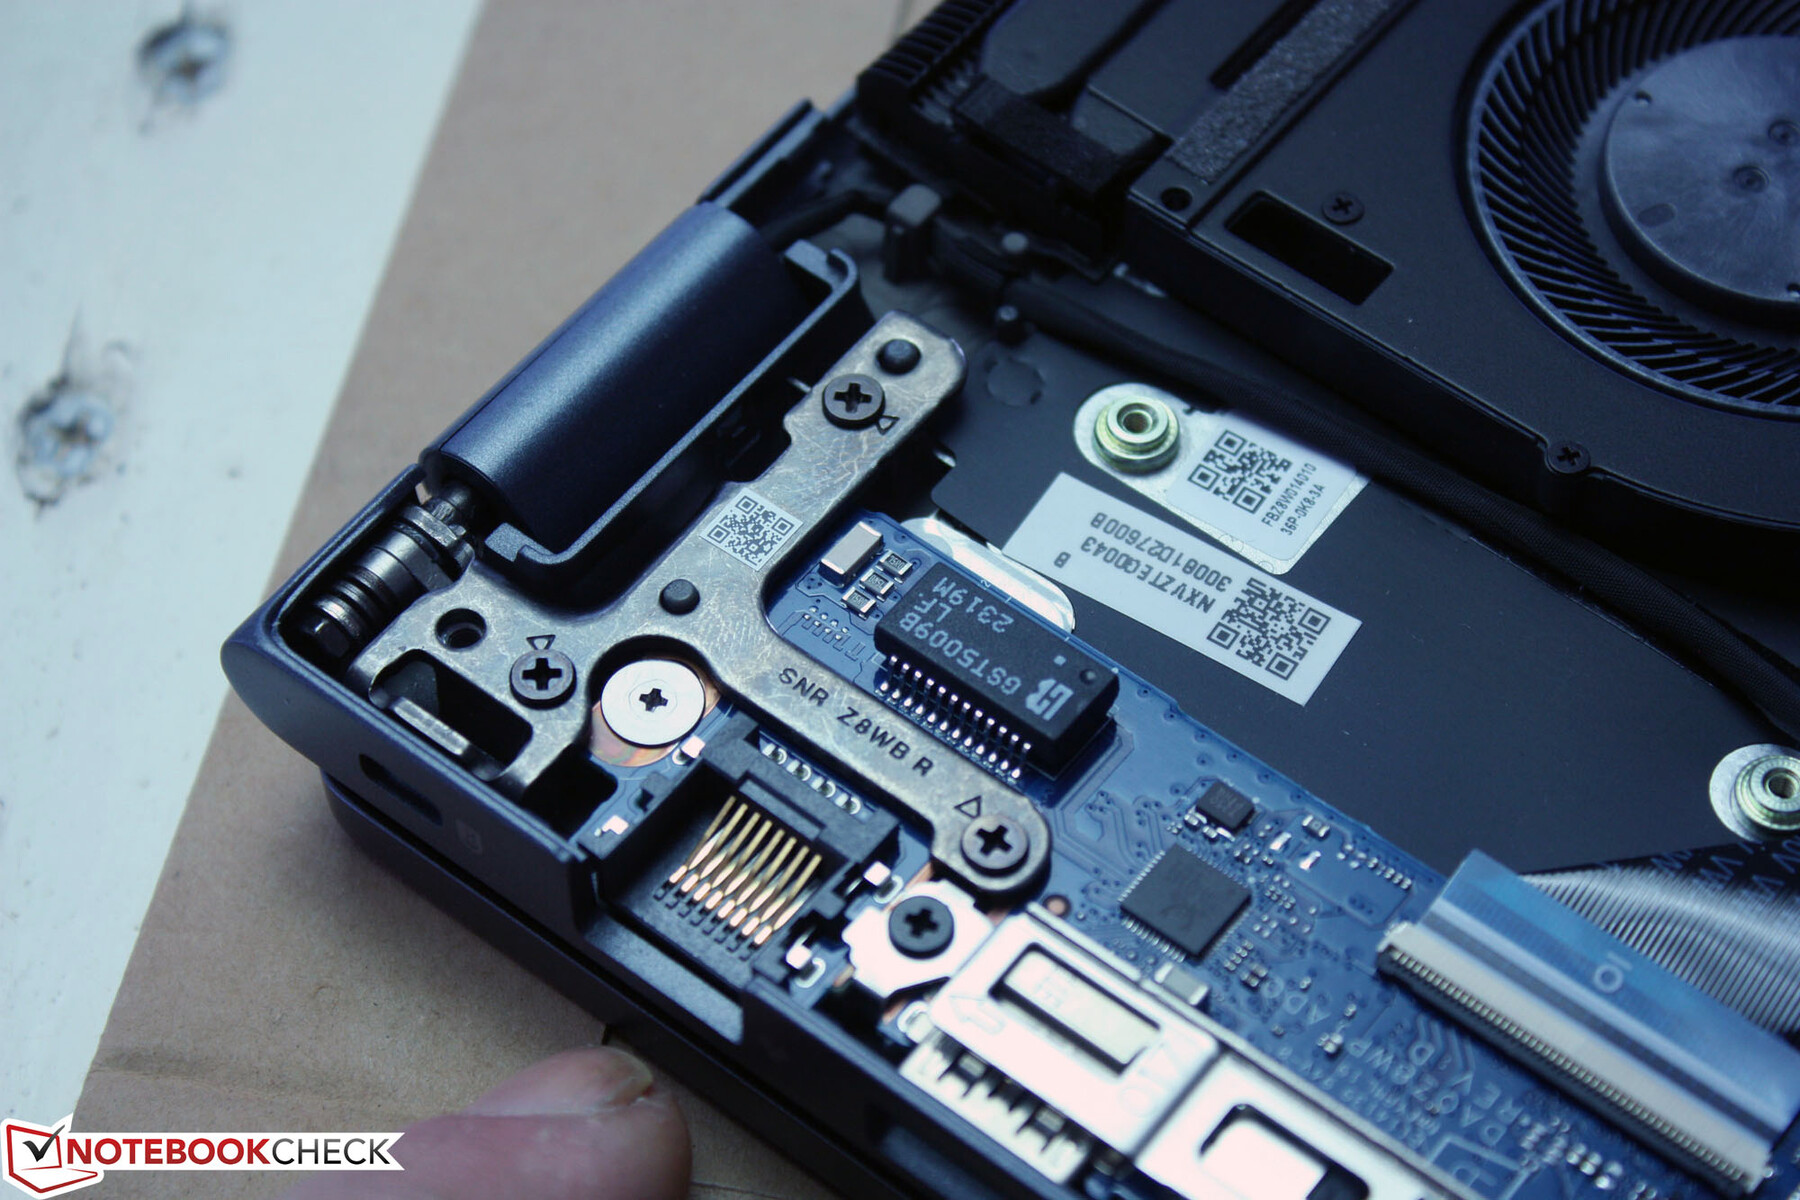
安全
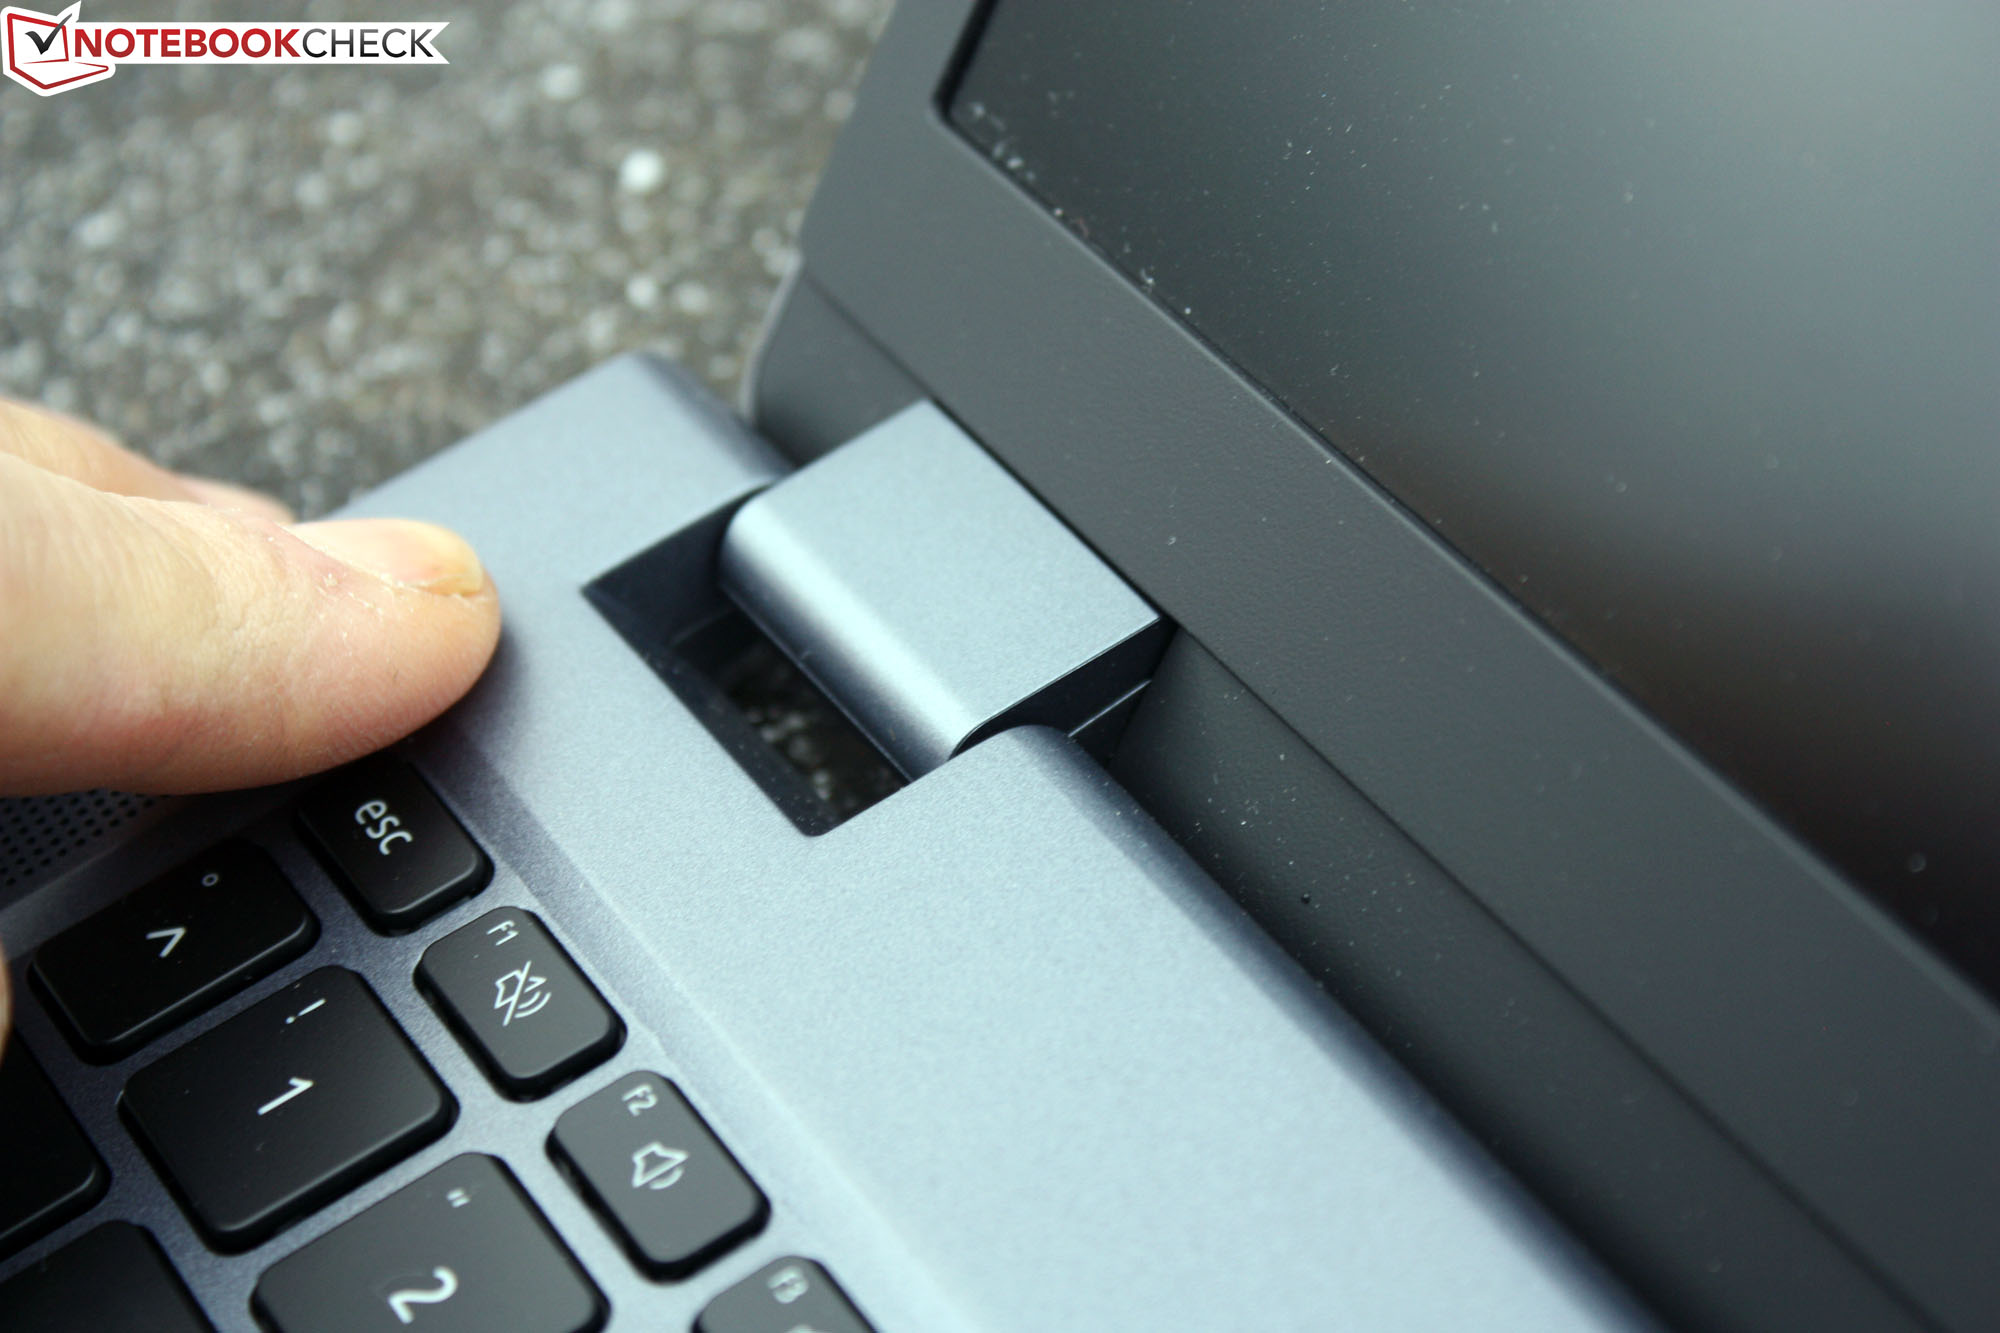
指纹识别器与电源键融为一体,与 Kensington Lock(肯辛顿锁)近在咫尺。
配件
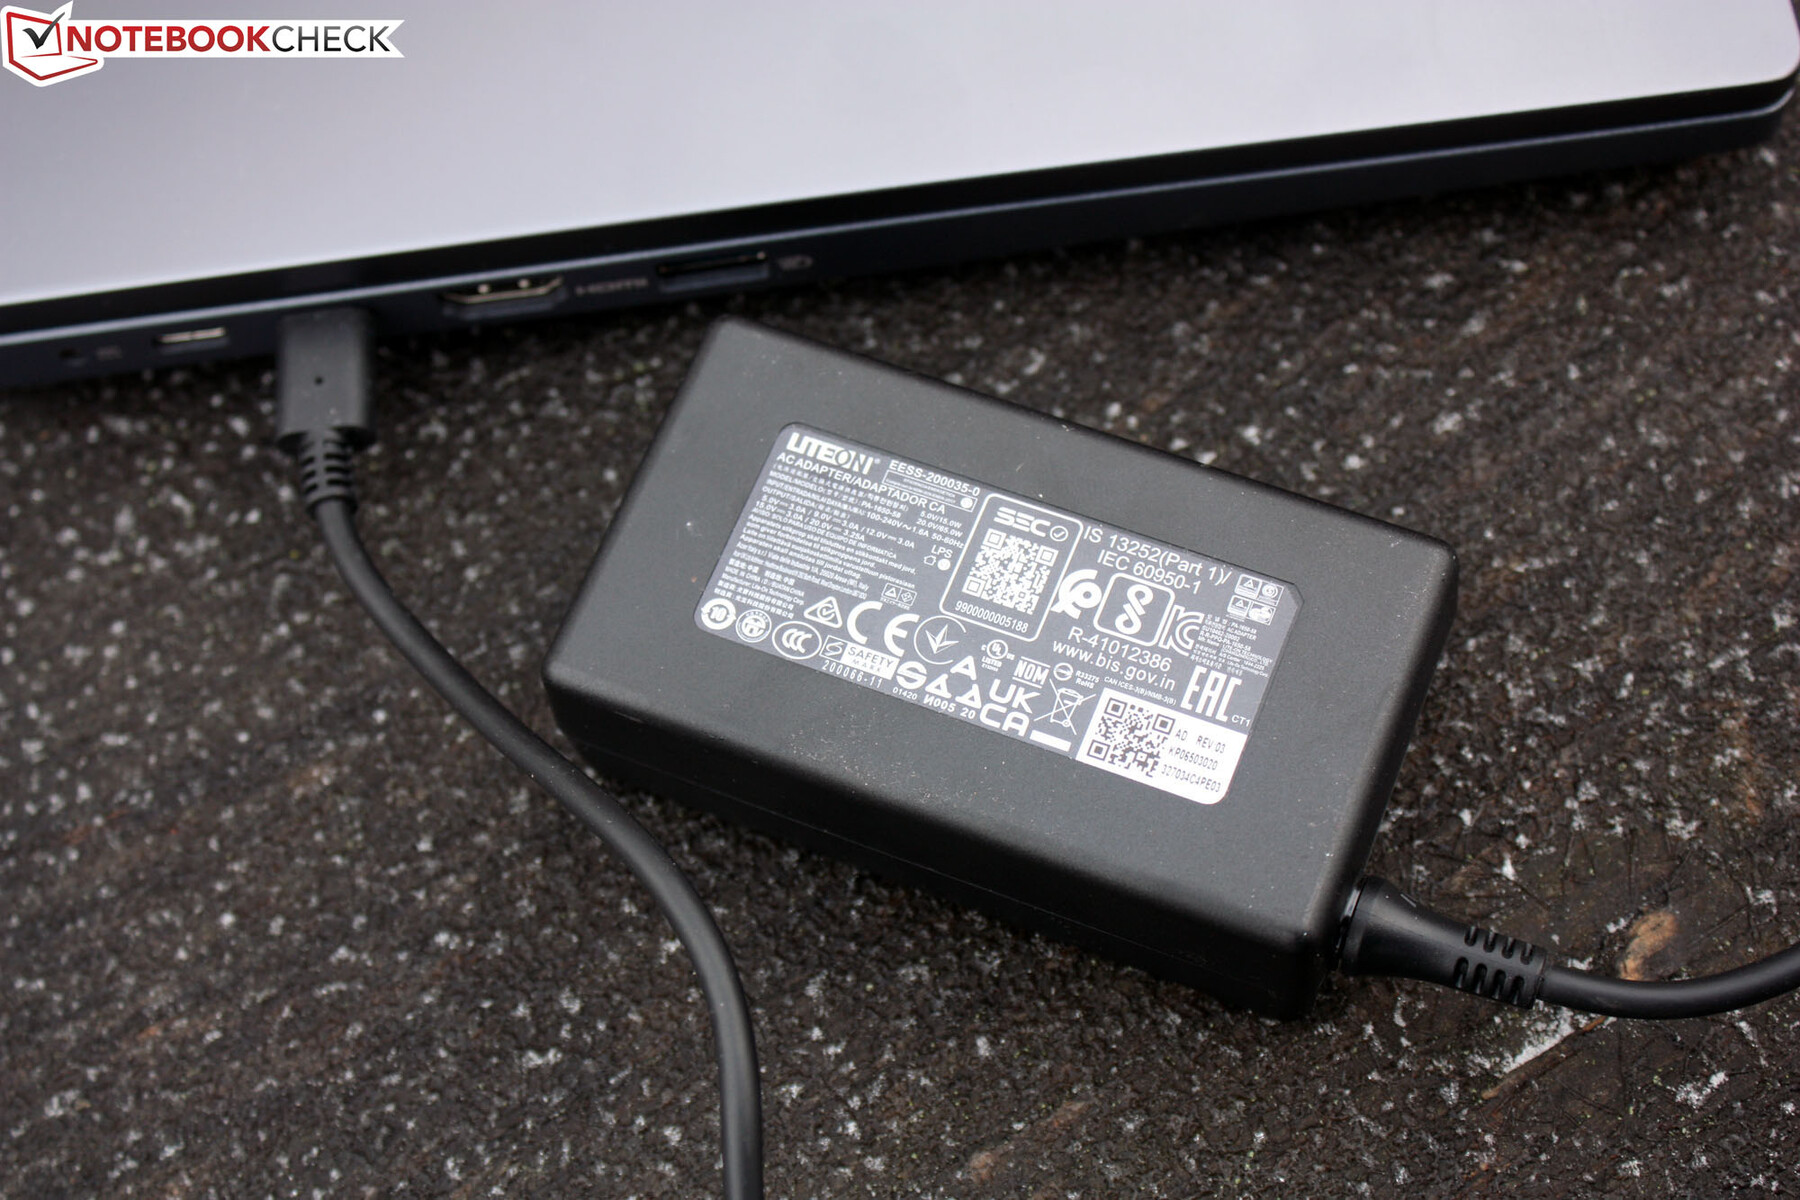
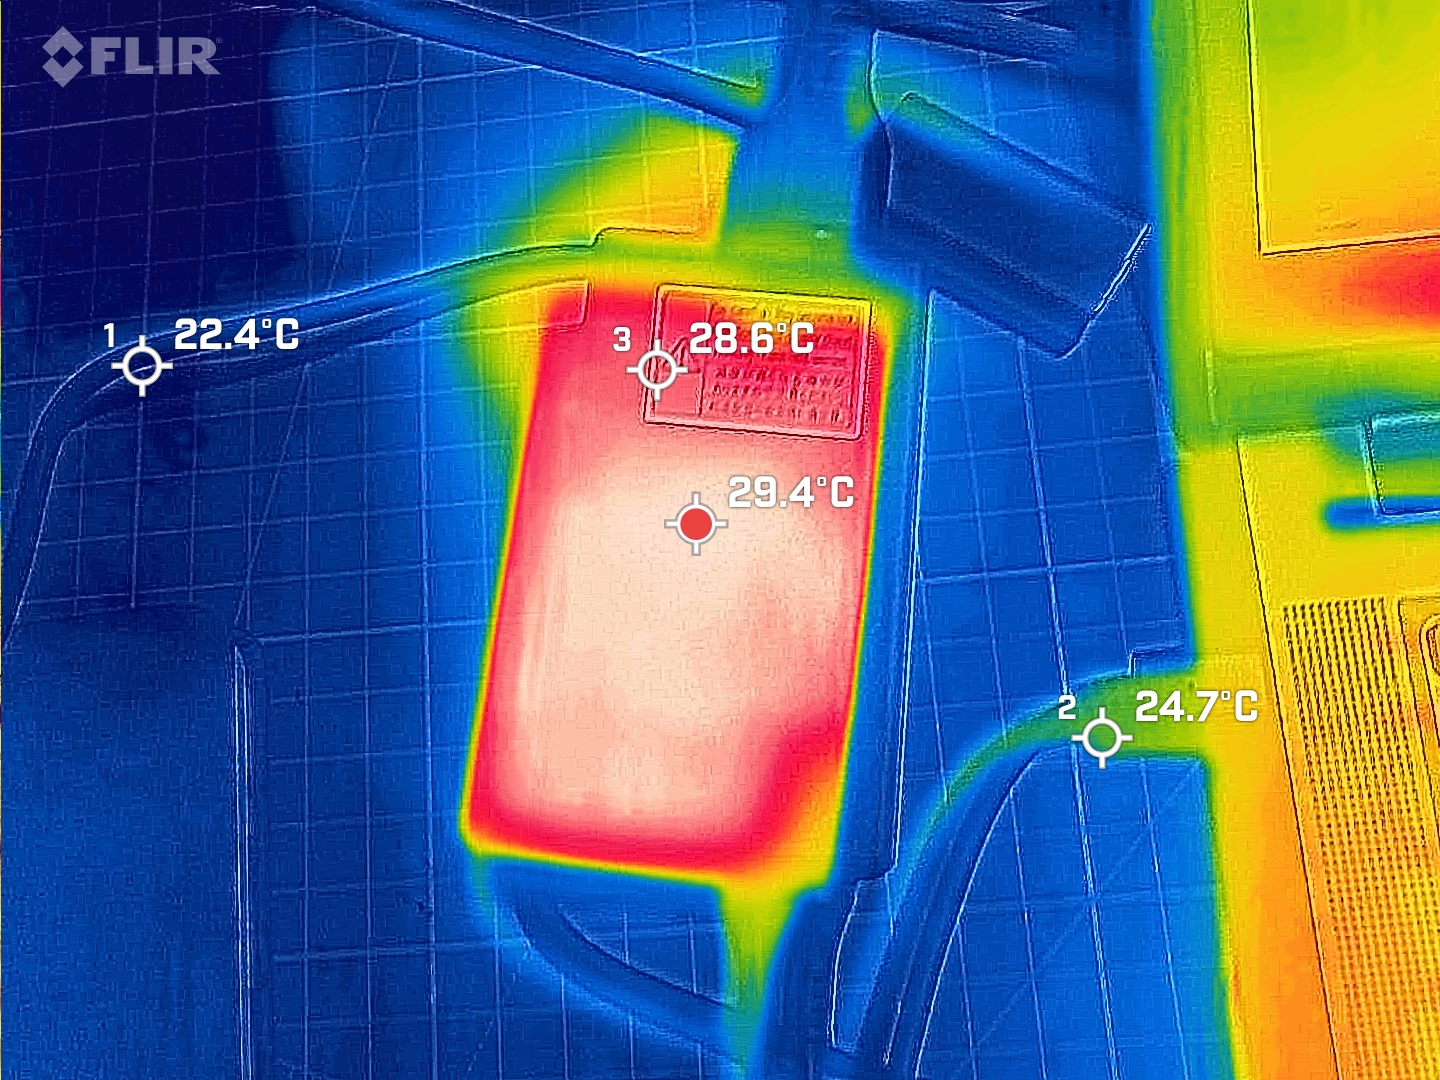
TravelMate 可以使用带有迷你电源插头的宏碁专有充电器进行充电和操作。但随附的 65 瓦 USB-C 充电器肯定是更好的选择,它还可用于其他设备。虽然您也可以使用较弱的 USB-C 充电器为宏碁充电,但充电过程需要更长的时间,而且在负载情况下(PL1 短时间消耗 55 瓦!),还会从电池中耗电。
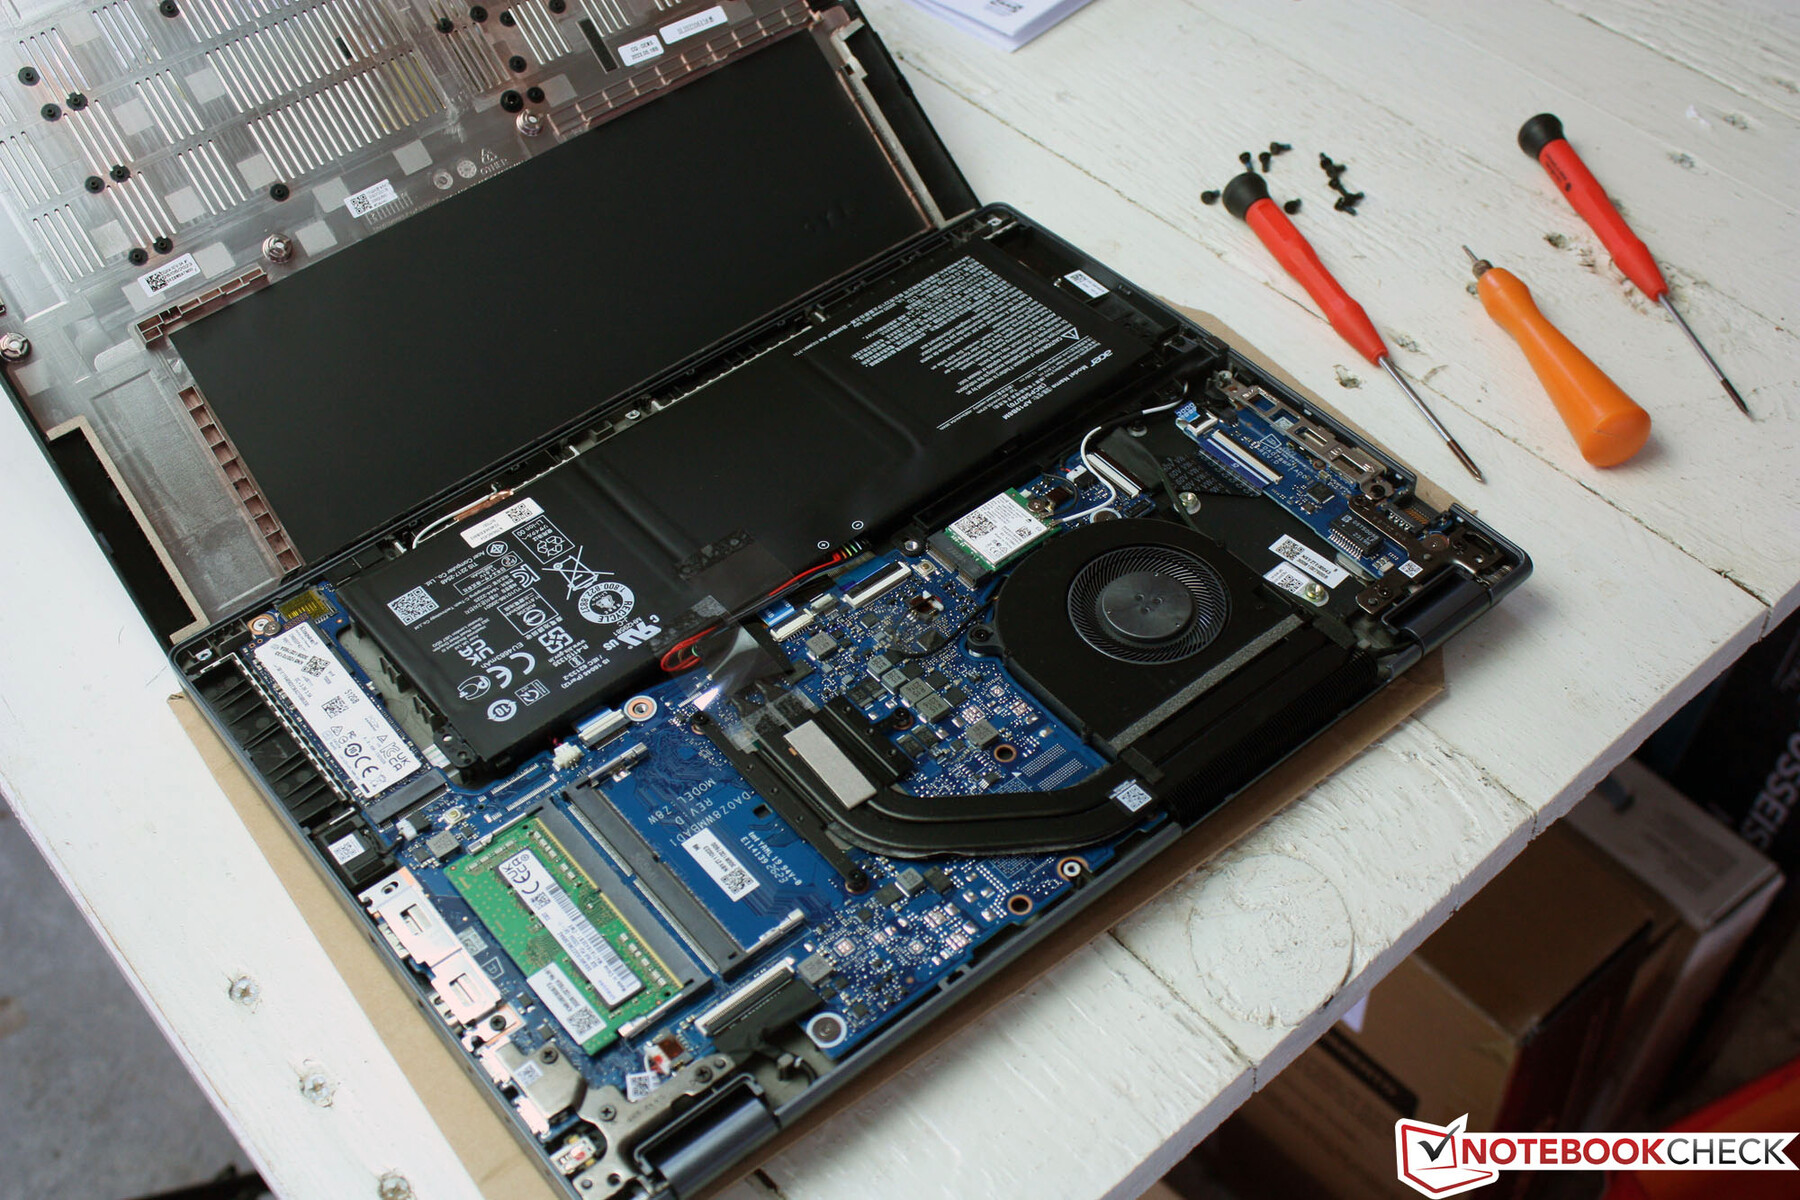
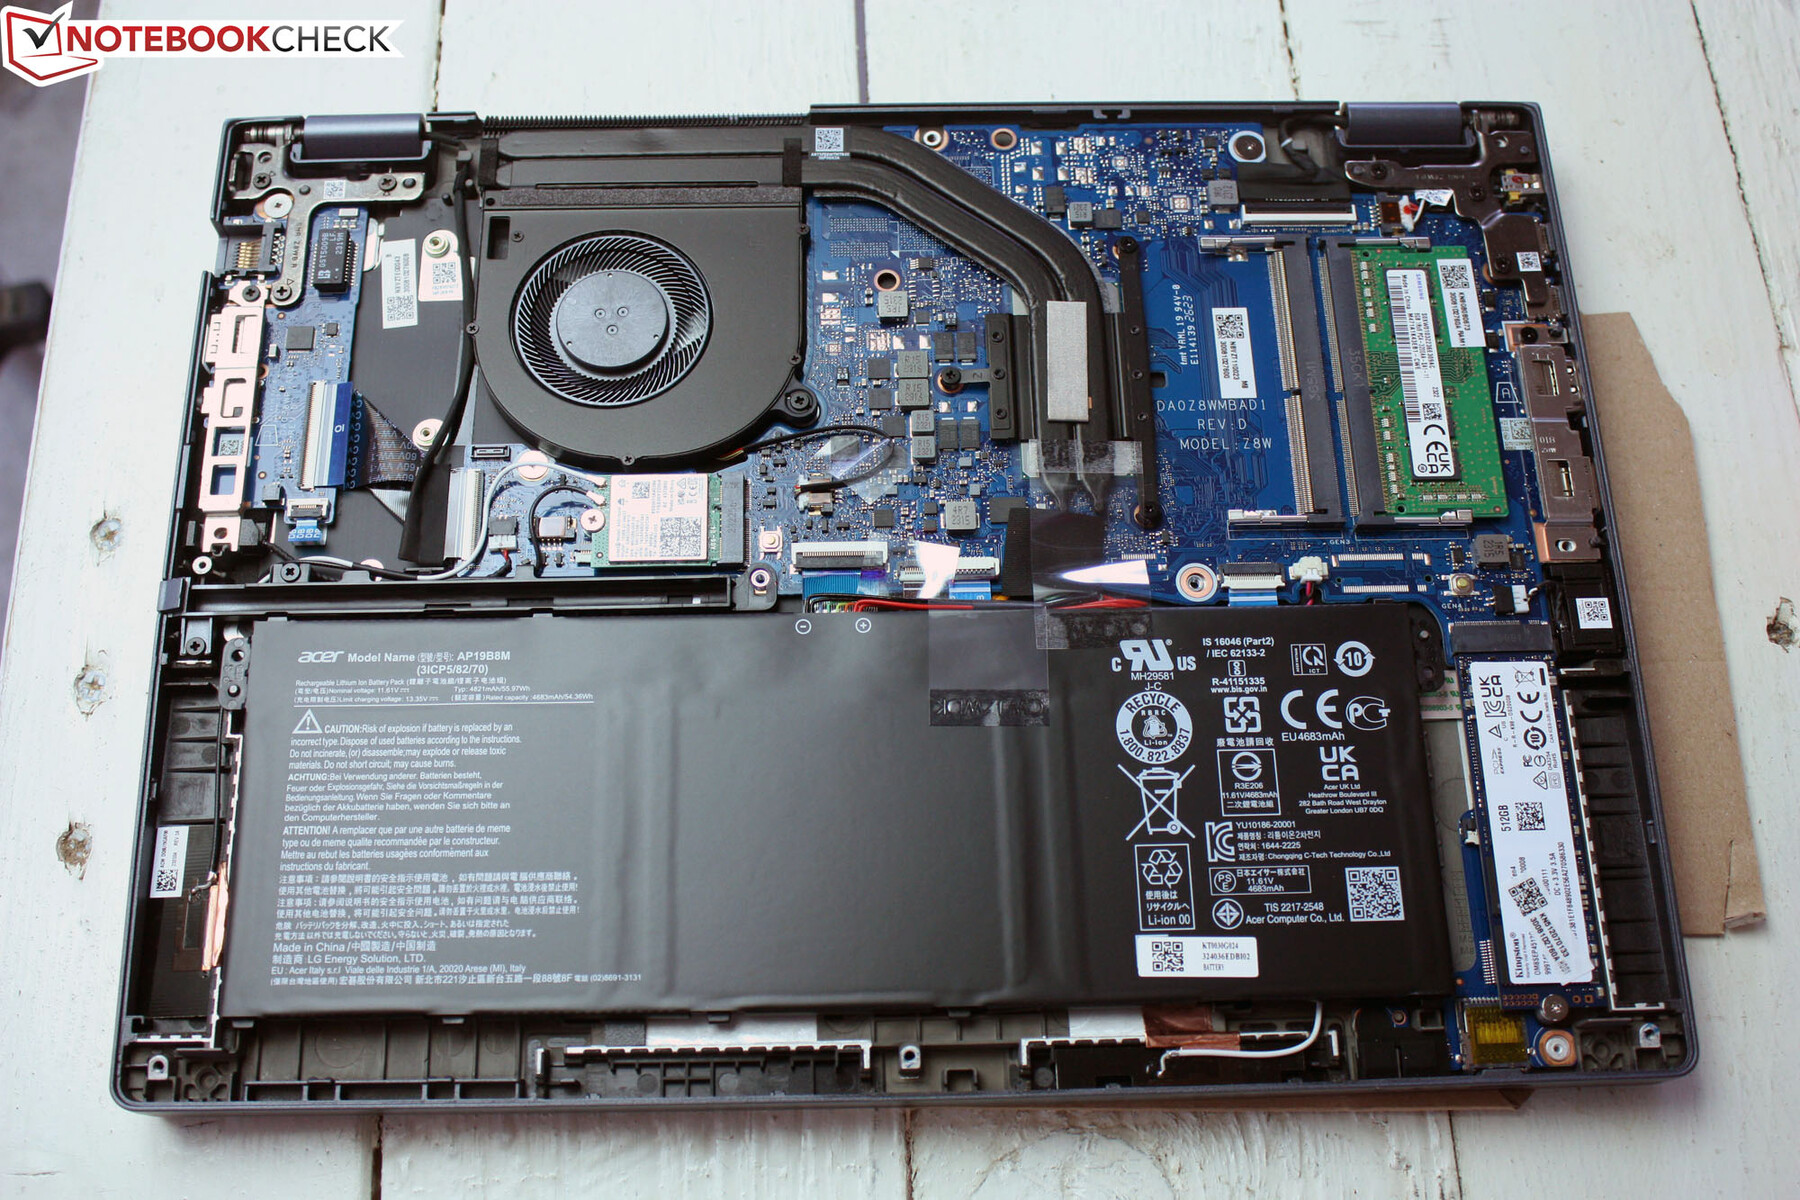
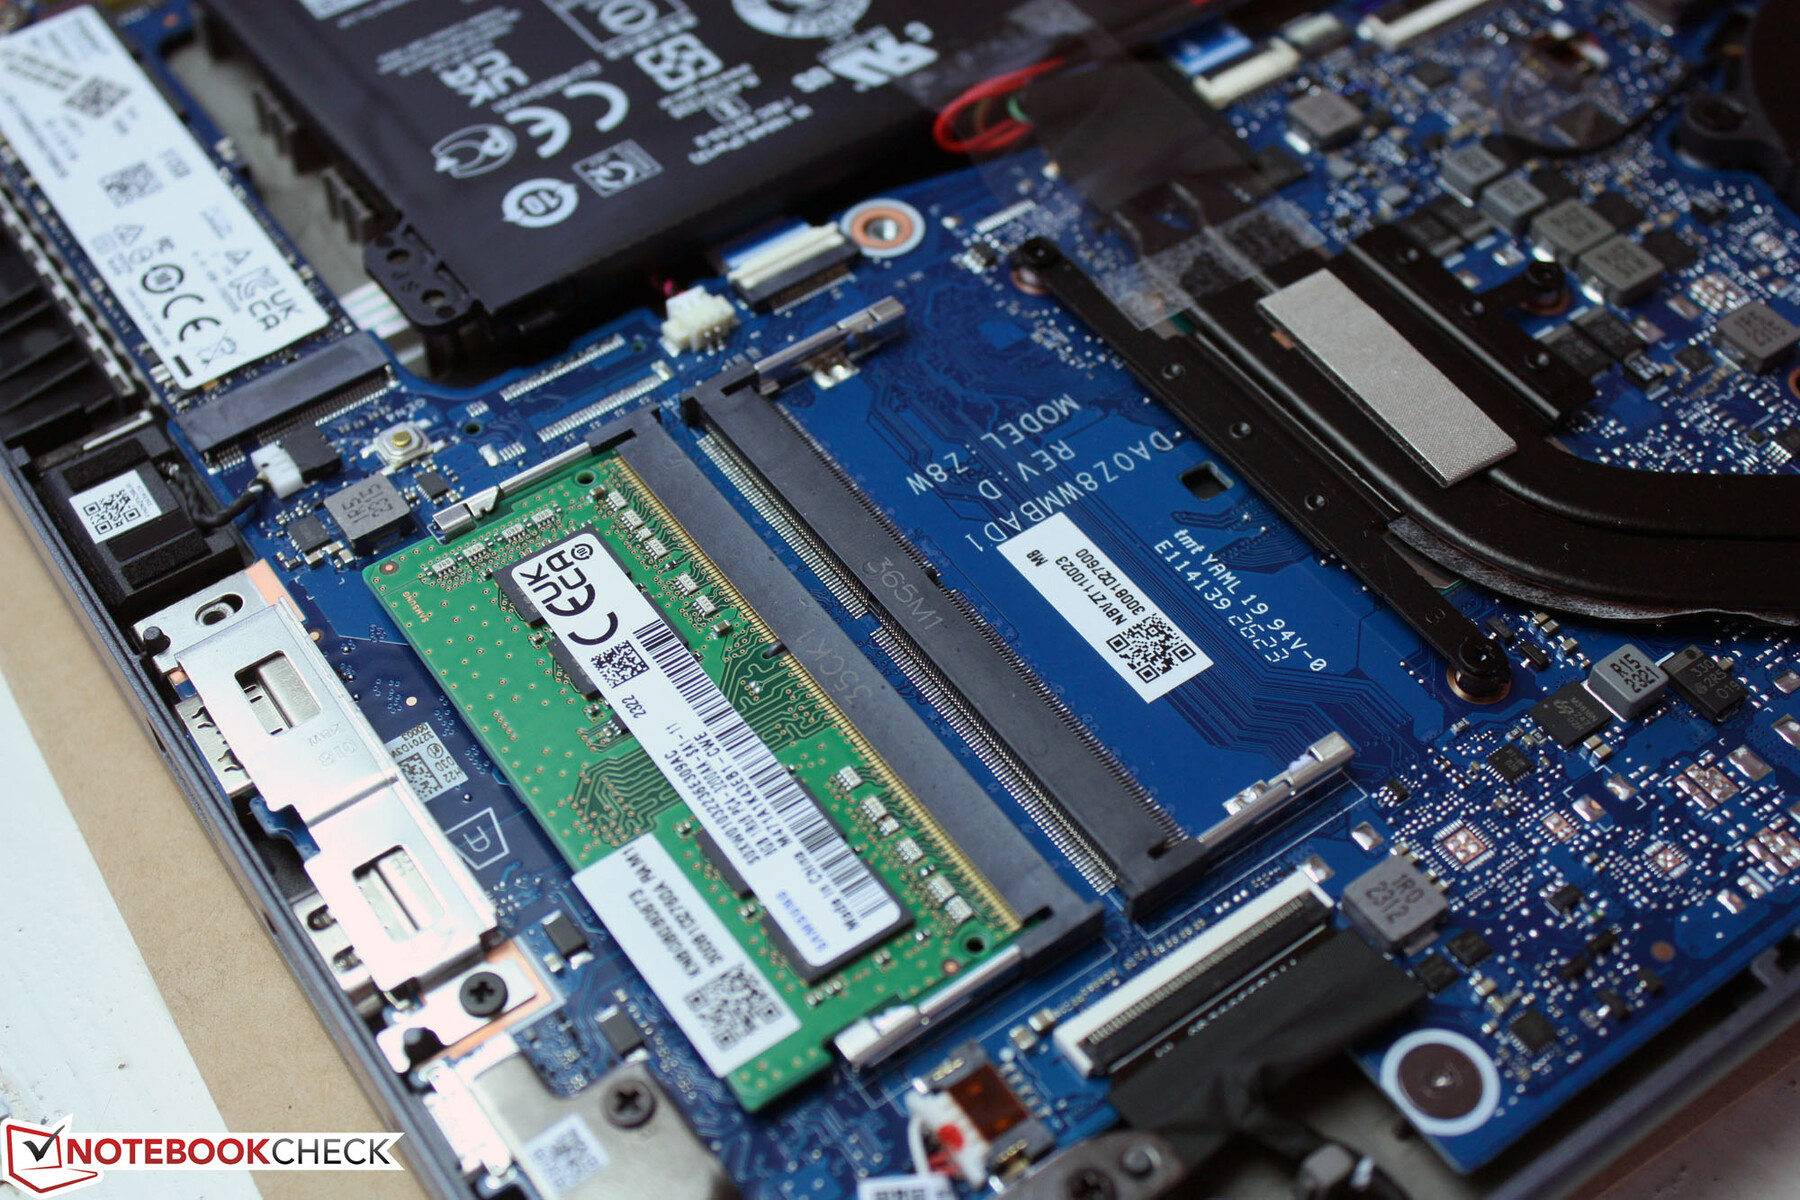
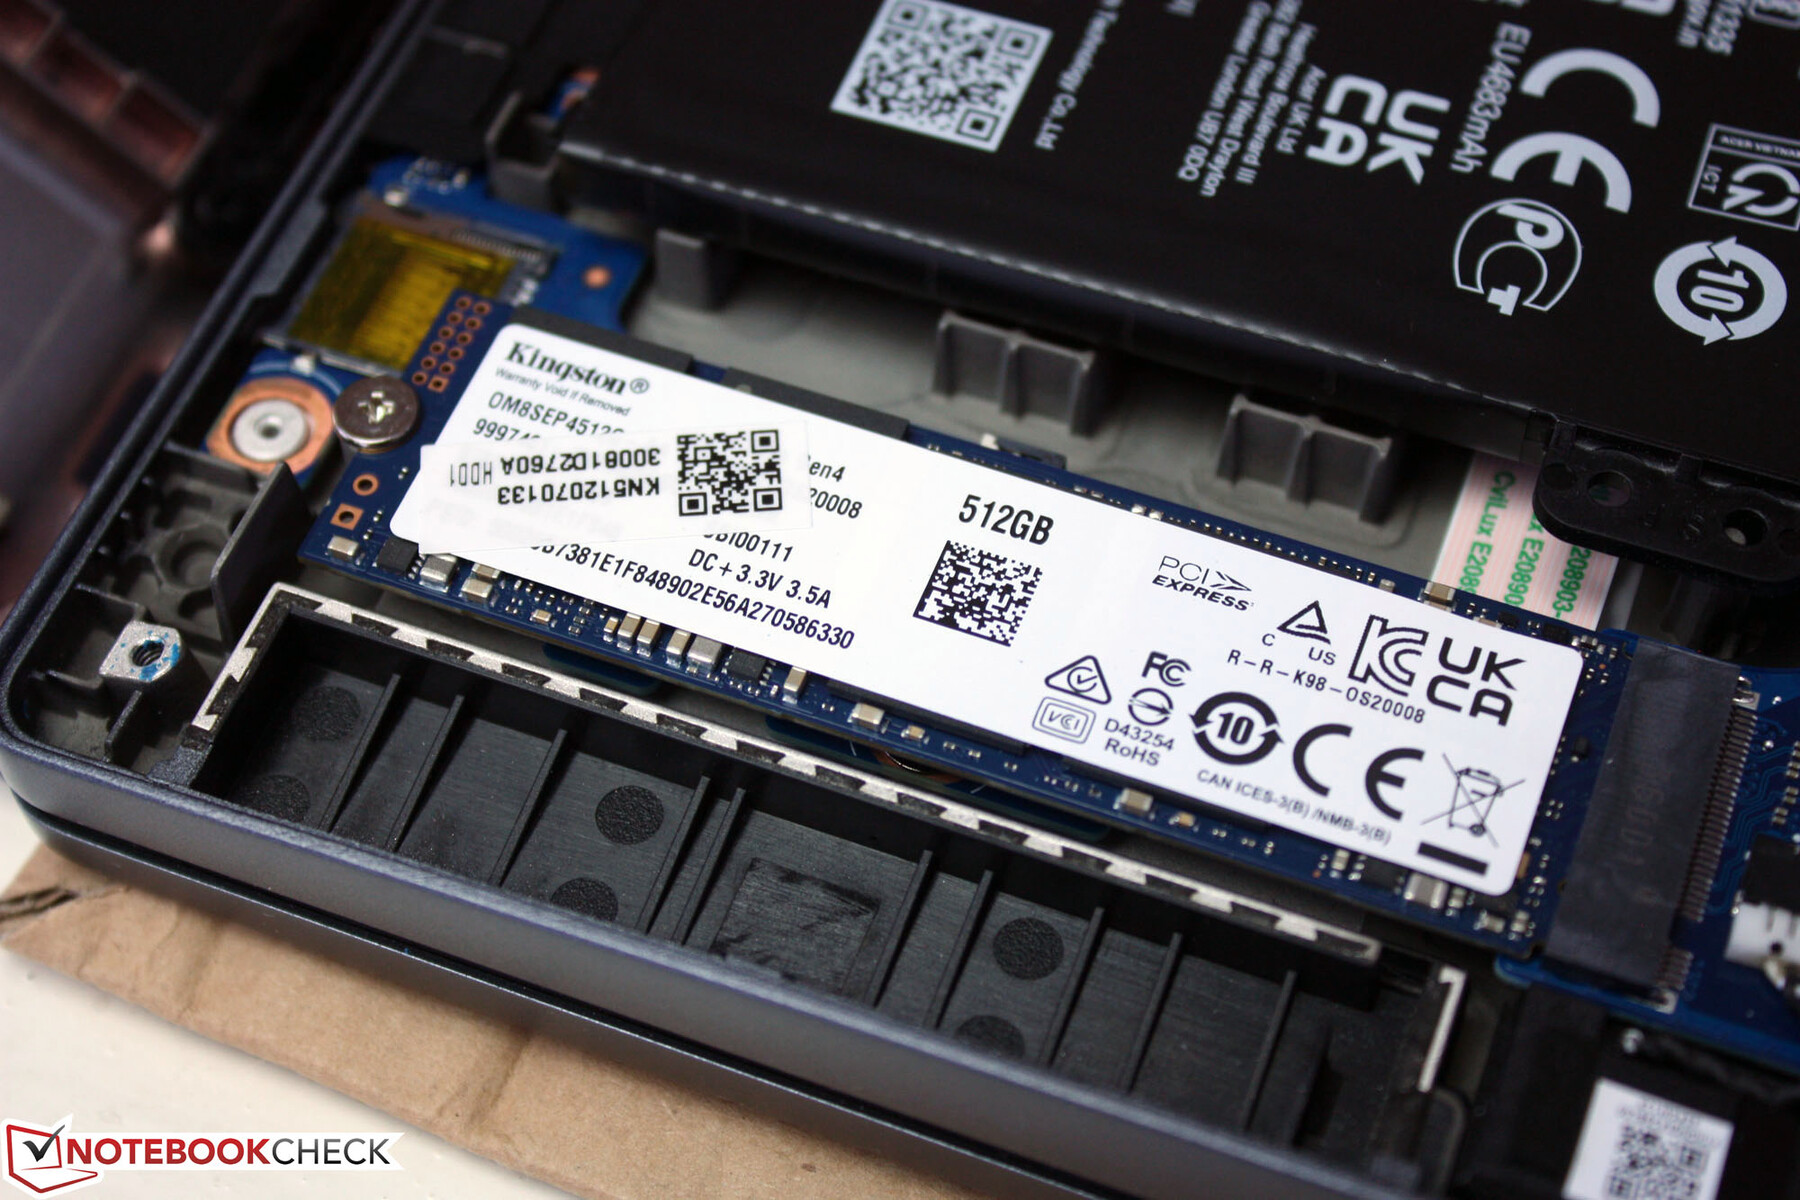
维护
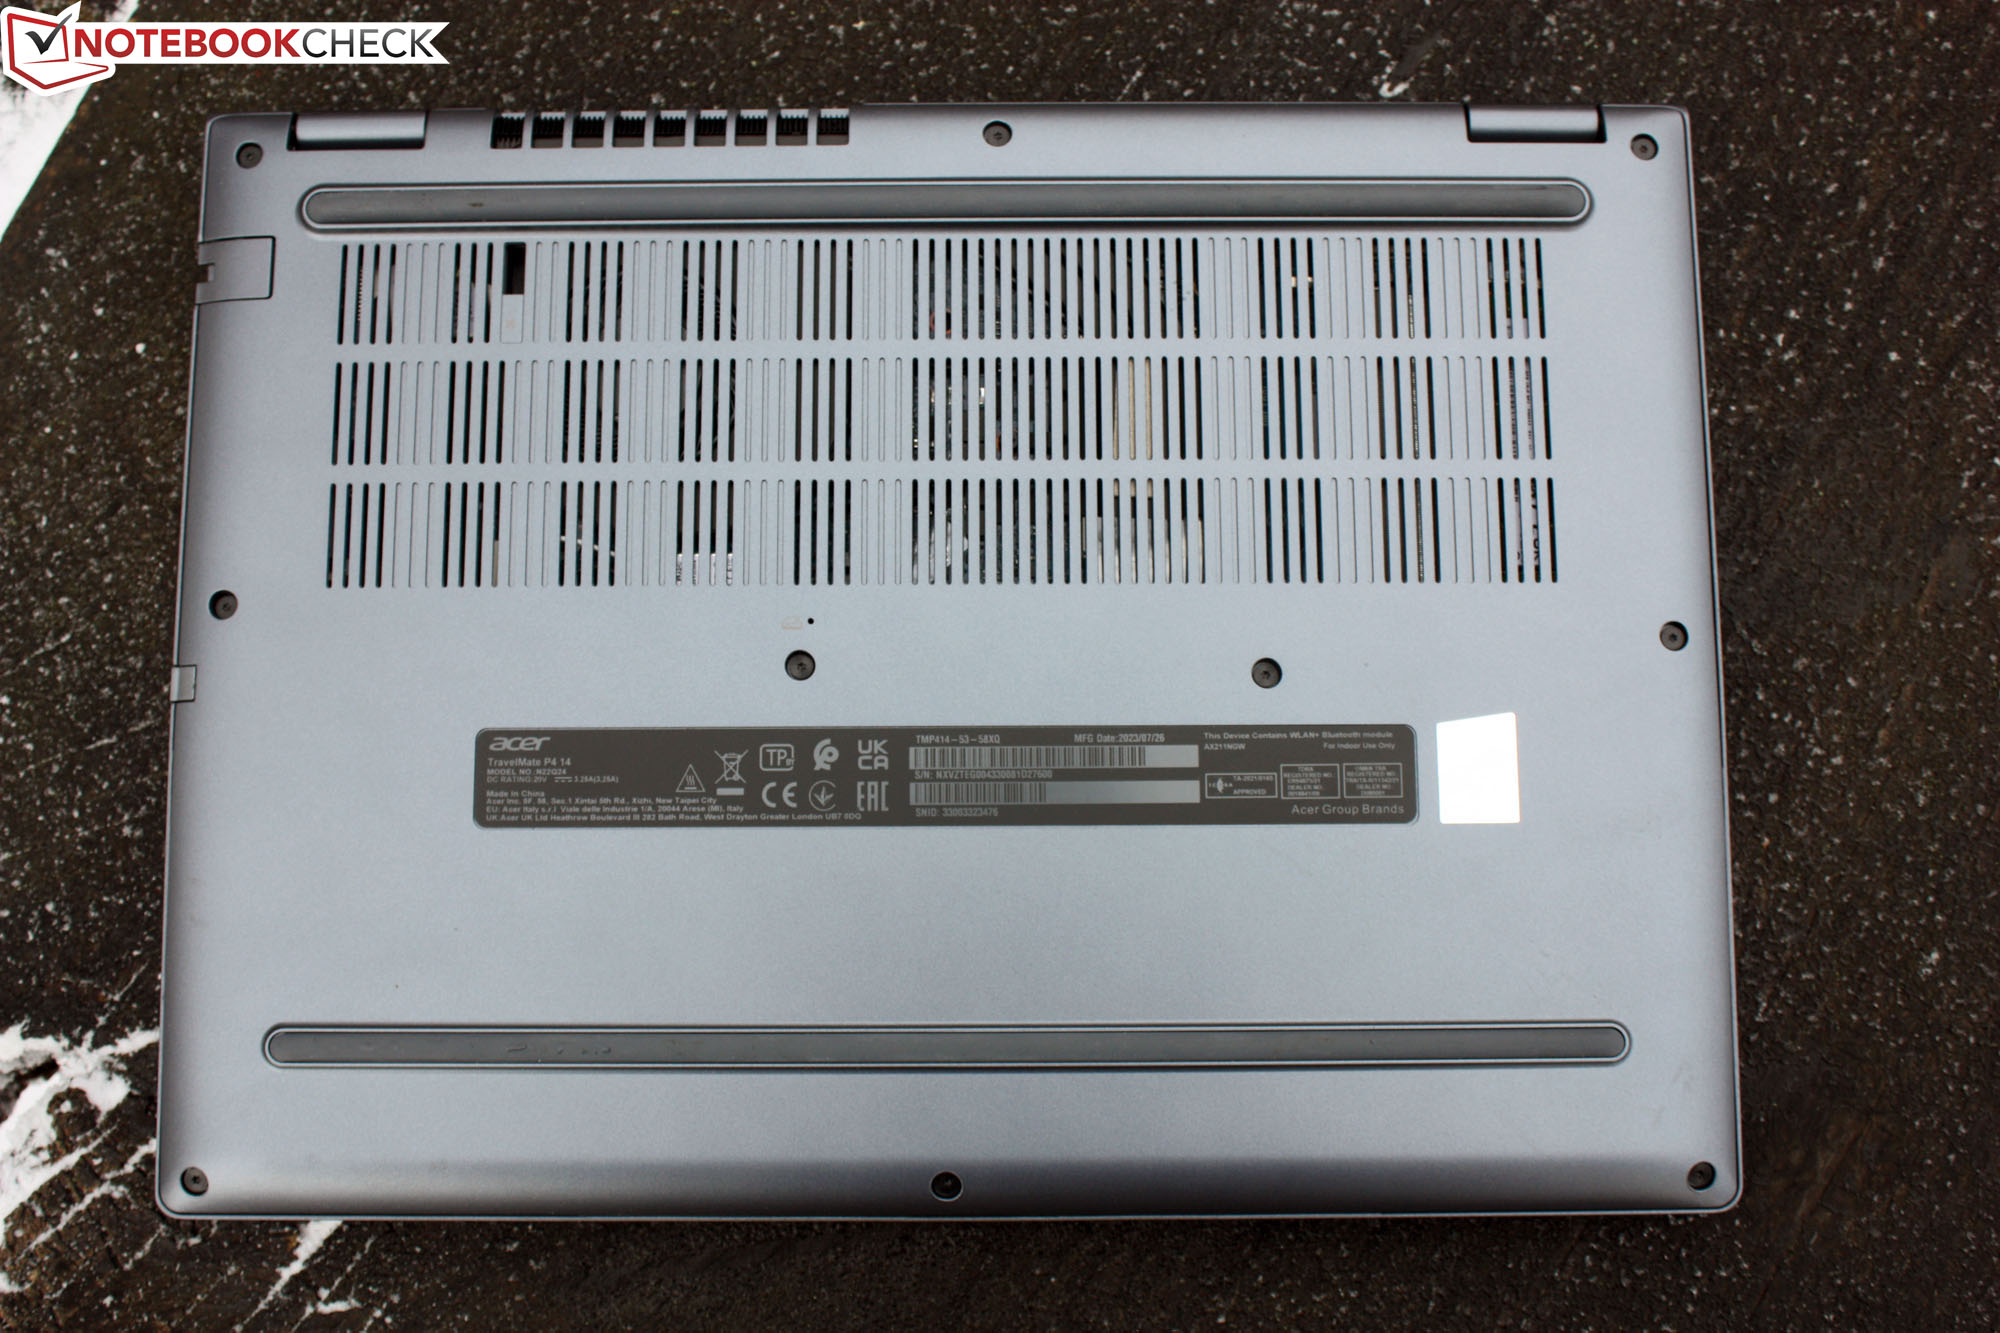
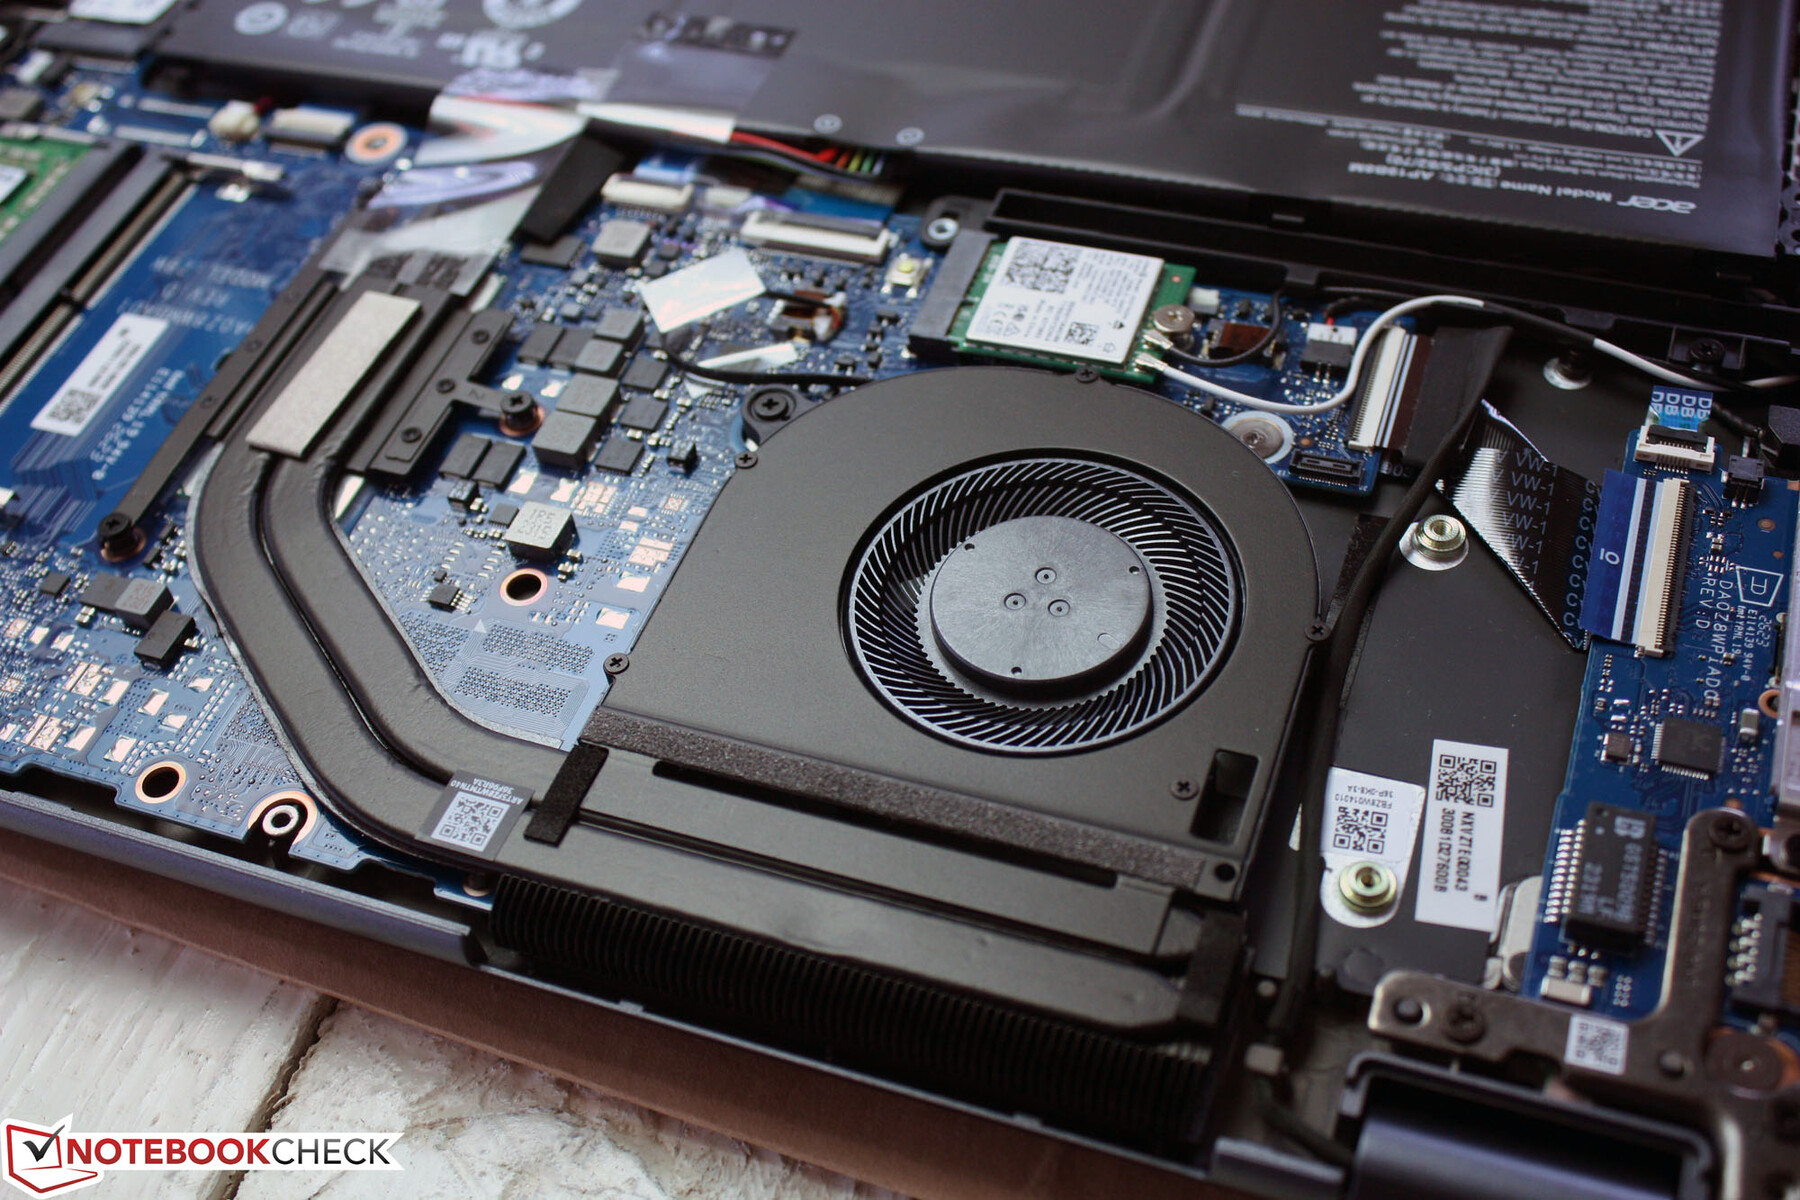
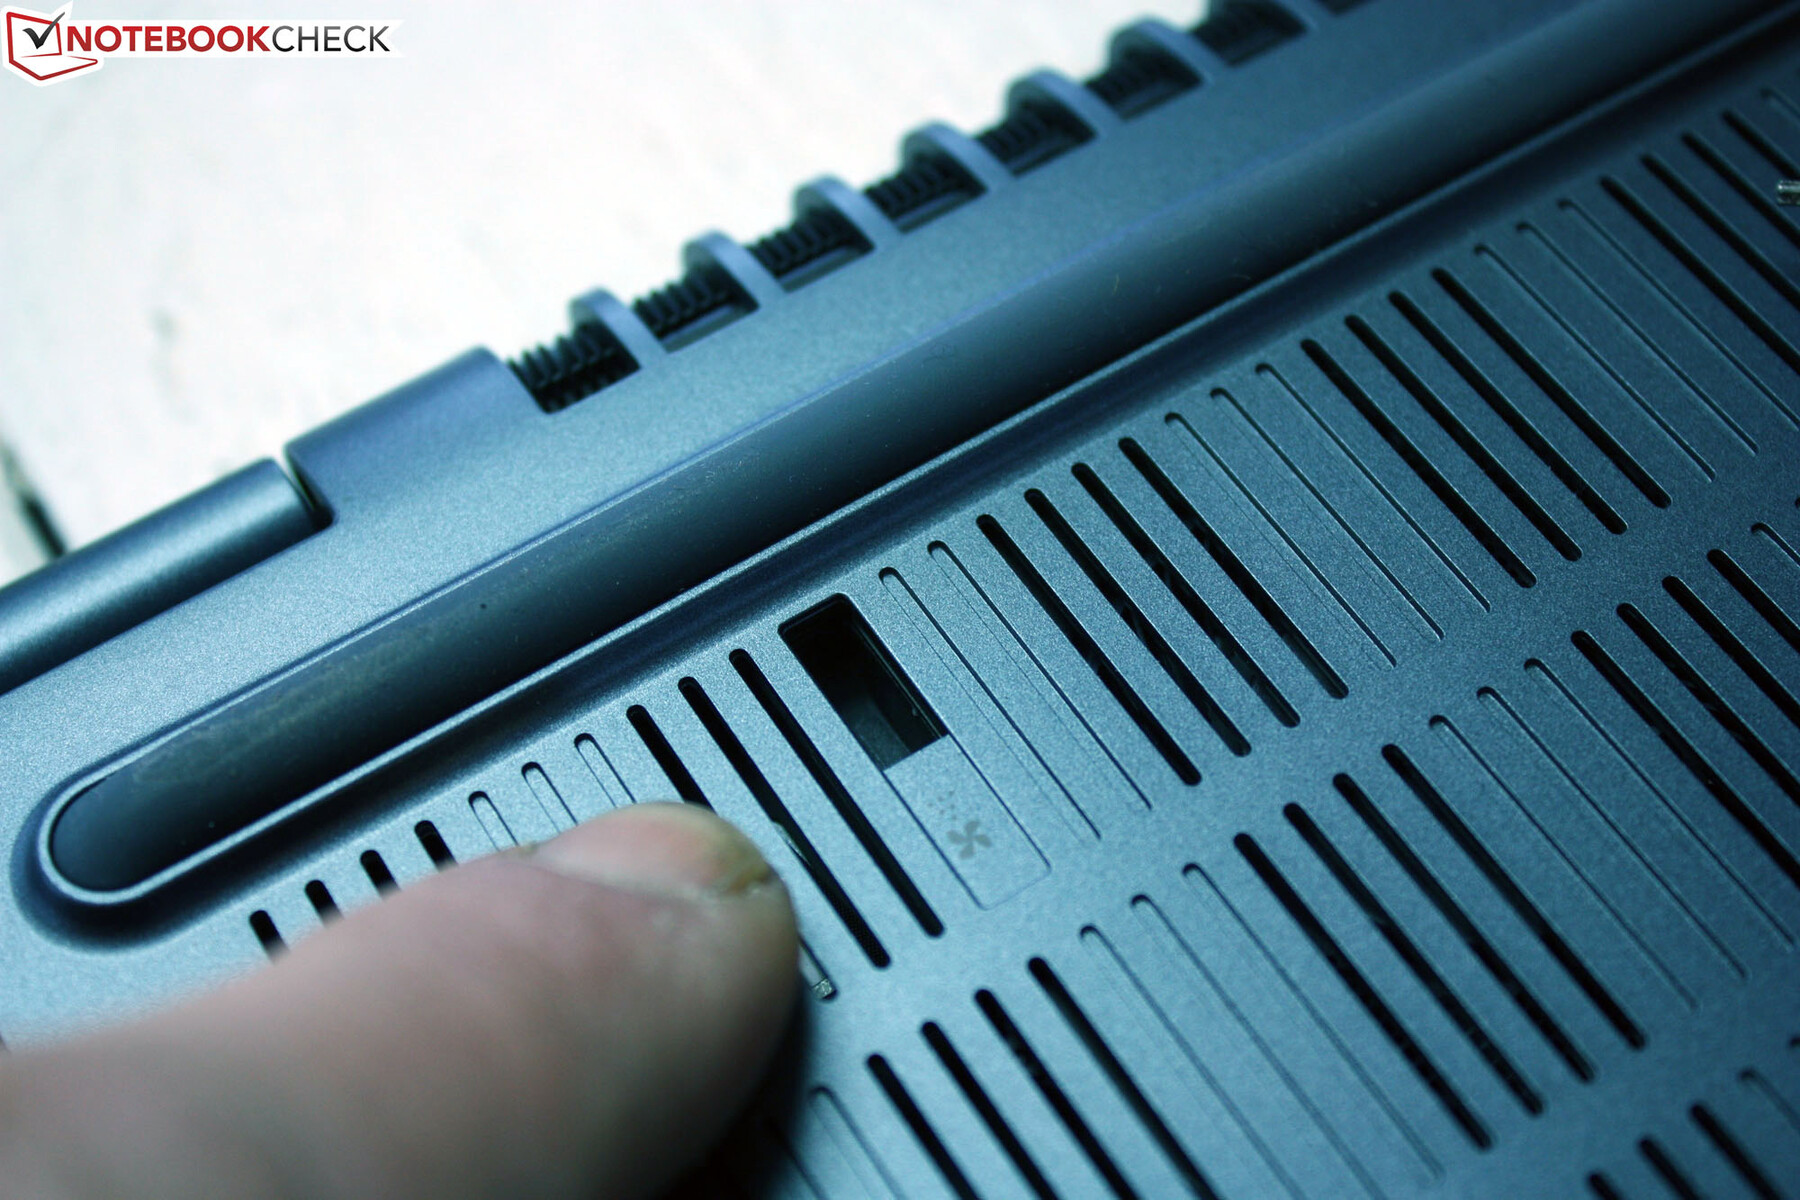
TravelMate 在维护和升级方面表现出色。如果热管的冷却肋脏了,有一个开口可以吹入加压空气。使用一把小的一字螺丝刀就可以快速轻松地卸下底盖。卸下螺丝后,无需使用任何其他工具即可掀开底盖。然后就可以进入两个内存插槽,其中一个插槽容量为 8GB。电池用螺丝拧紧,固态硬盘作为 M.2-2280 模块放在一个插槽中。没有第二个 M.2 固态硬盘插槽。
保修
宏碁在德国为 TravelMates 提供 3 年保修。其他国家的保修期可能有所不同。
输入设备
我们在 TravelMate P4 上撰写了这篇评测,无需熟悉键盘,就能高效地使用输入设备。与前代产品相比,宏碁大幅扩大了 ClickPad 的面积。
键盘
宏碁使用的是chiclet 橡胶圆顶键盘,可分两步进行照明。现在,它提供了良好的键间距离。清晰的按压点与紧凑的键程相结合,营造出愉悦的键入体验,而且键盘没有任何松动。虽然键入时并非完全无声,但已接近无声。按键表面有哑光处理,方便手指滑动。F 和 J 键一如既往地为触控打字者而设。这些按键不包括不再存在的数字键区的二级分配。尽管上/下键的尺寸较小,但仍很容易使用。一个值得肯定的地方是,Fn 为方向键分配了 Home、End、PgUp 和 PgDn。
虽然有些人可能不喜欢键盘右上方的开关按钮,但制造商还是努力防止意外触发:该按钮有一个特殊的边框,几乎没有笔触,因此必须用力按才能触发。
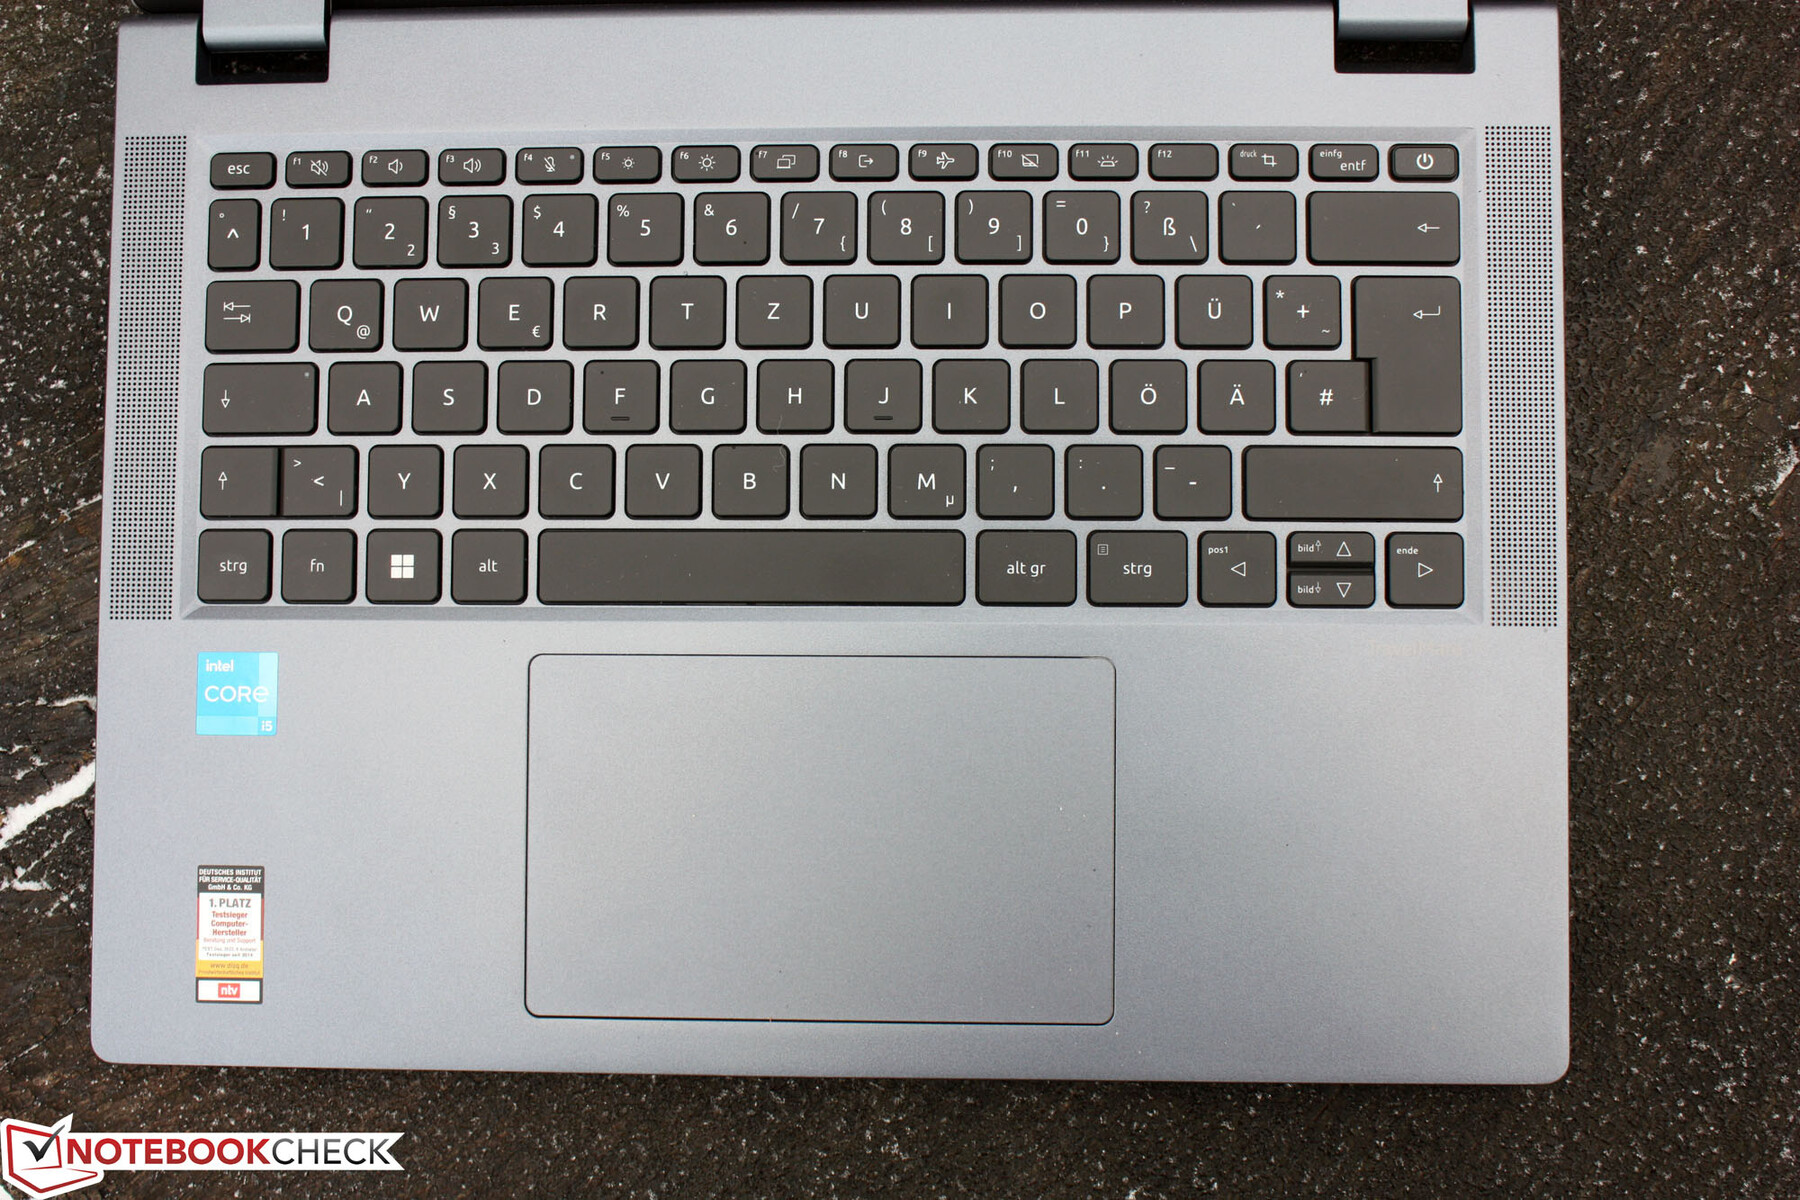
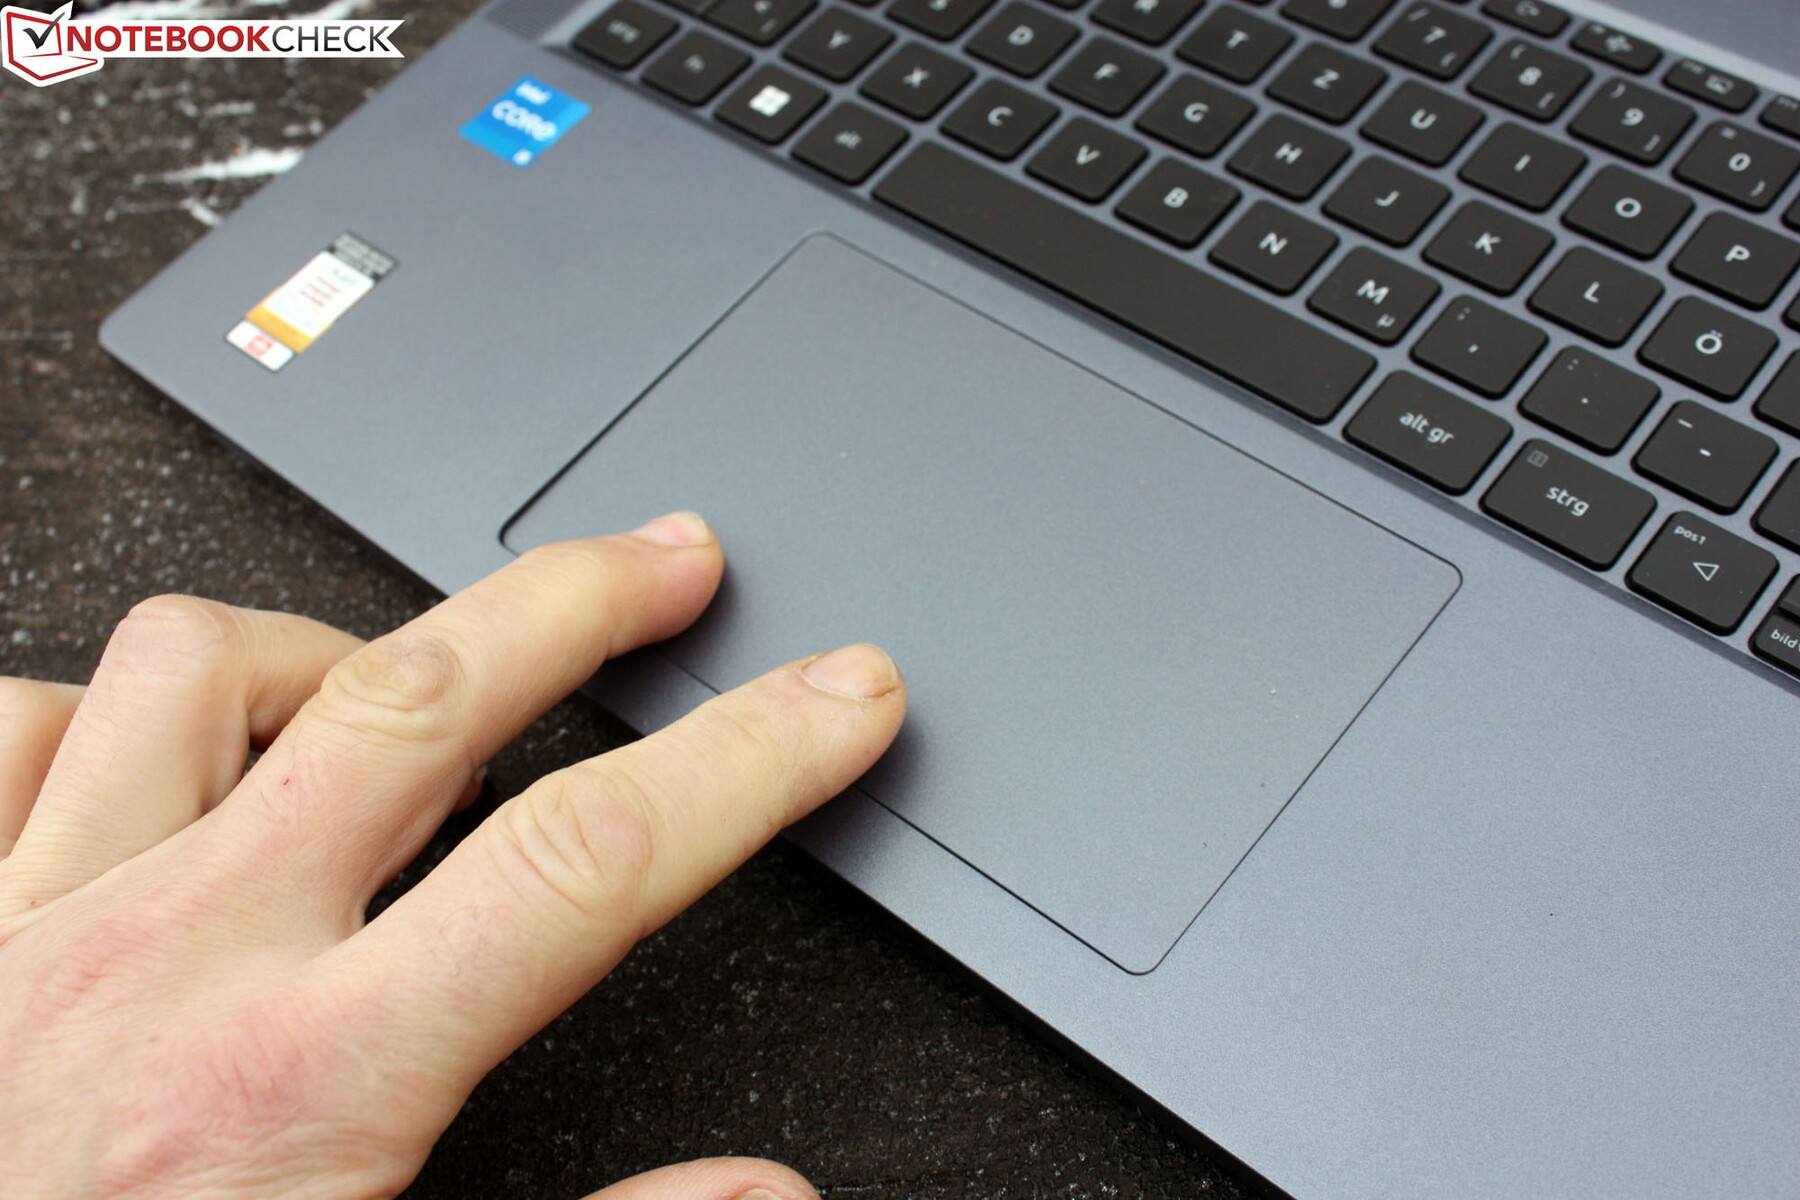
触摸板
ClickPad 对角线长 14.5 厘米(约 5.7 英寸),正好位于屏幕中央。我们从未感觉到在打字时必须关闭它,尽管你仍然可以使用 Fn 键来关闭它。键程很短,我们实际上只能按压下半部分区域,因为按压上半部分会耗费过多的力量。咔哒咔哒的声音并不刺耳,因为它既安静又沉闷。由于行程较短,按压点感觉不够清晰。支持所有多点触控手势。触控板表面比周围的掌托更光滑,手指只需触摸就能找到方向。
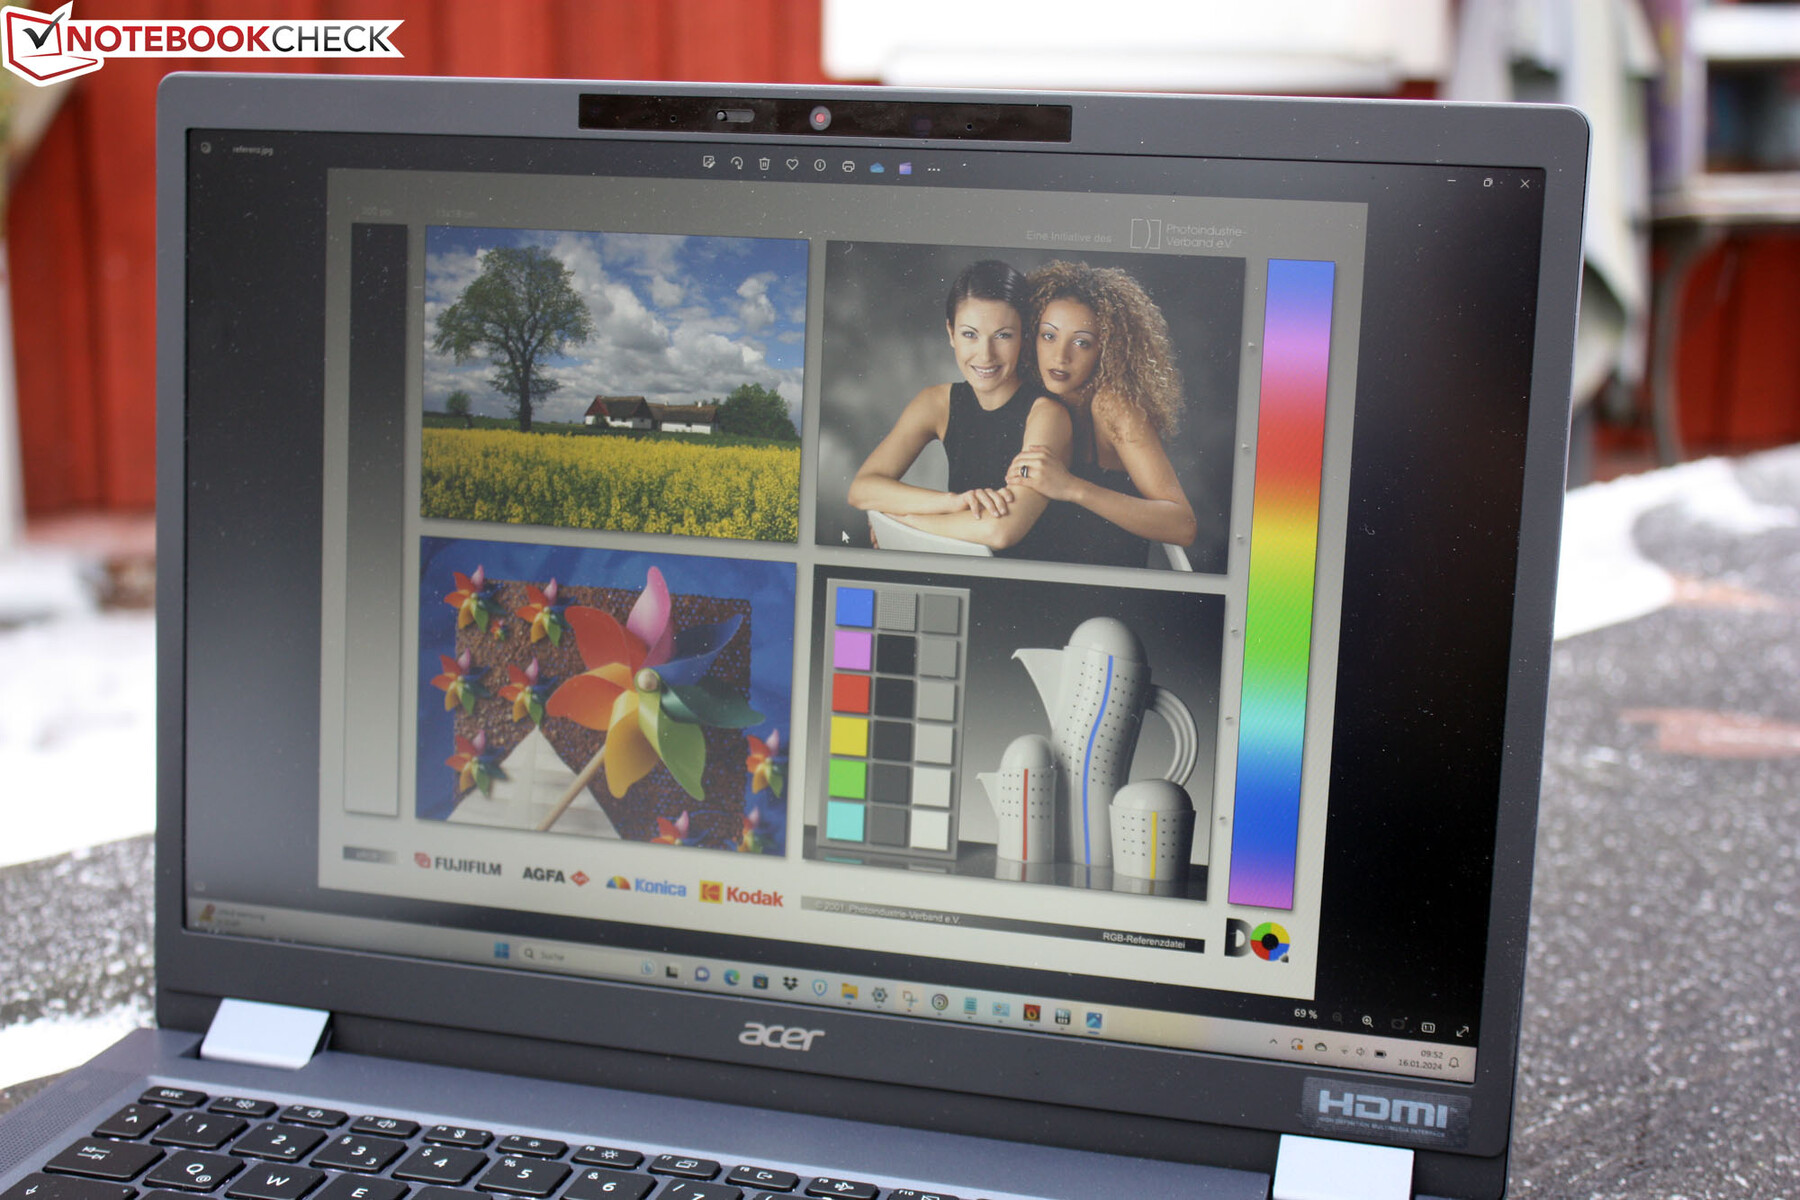
显示屏
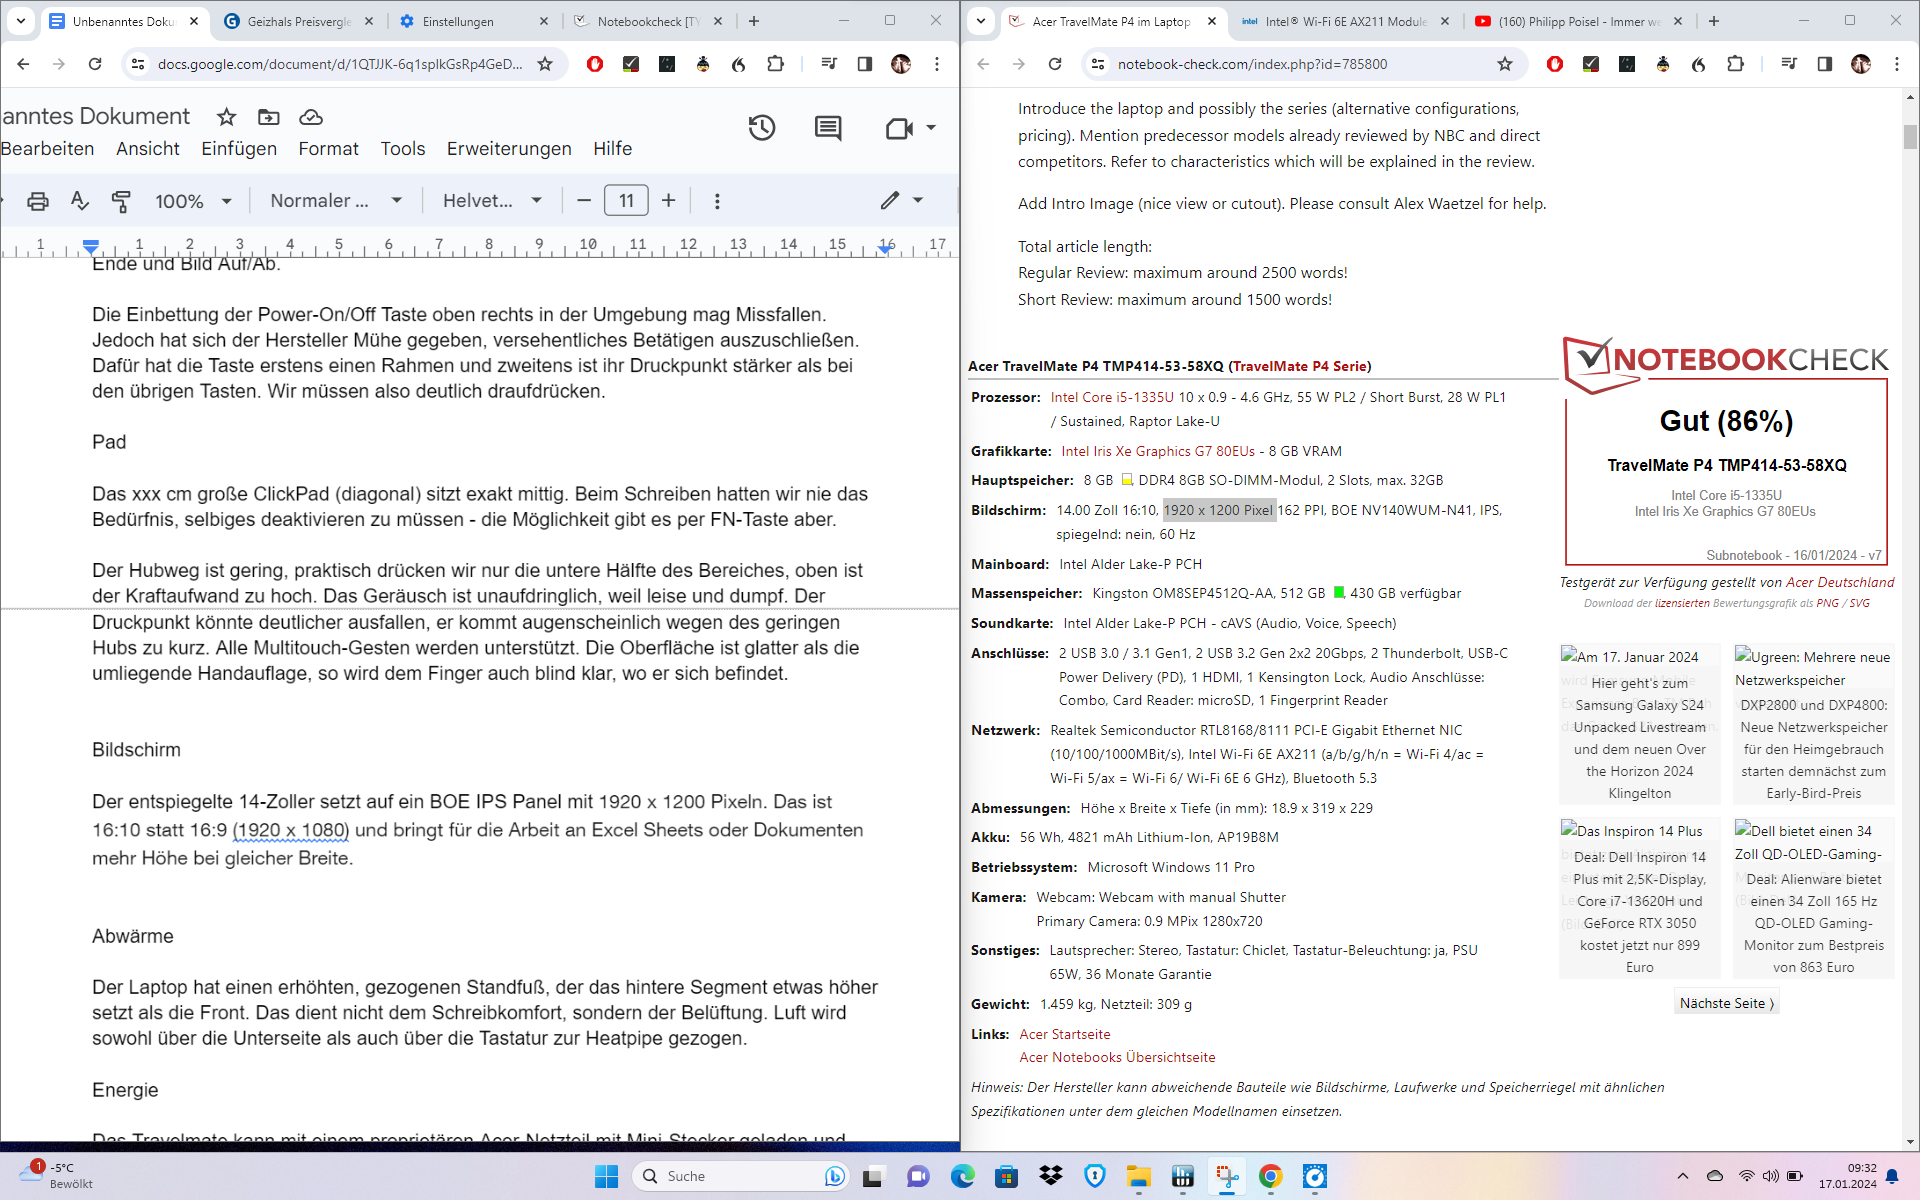
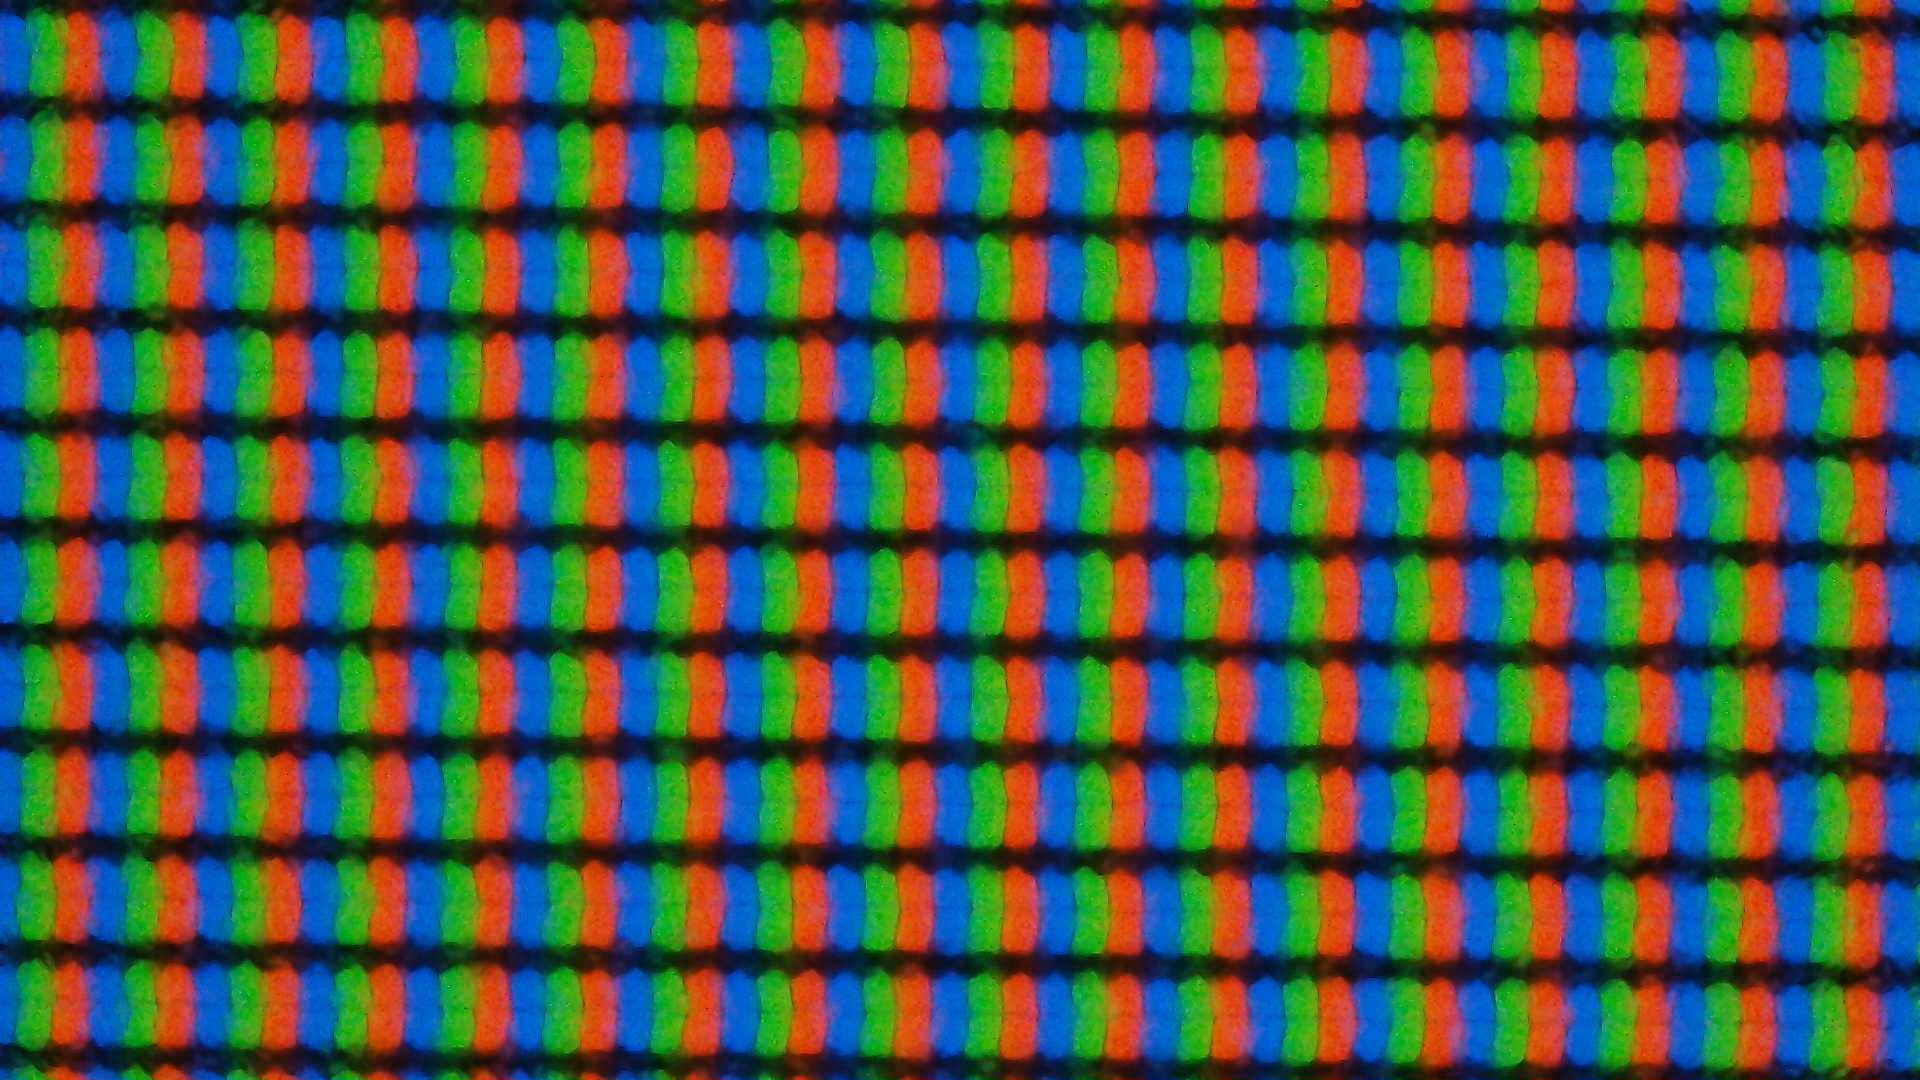
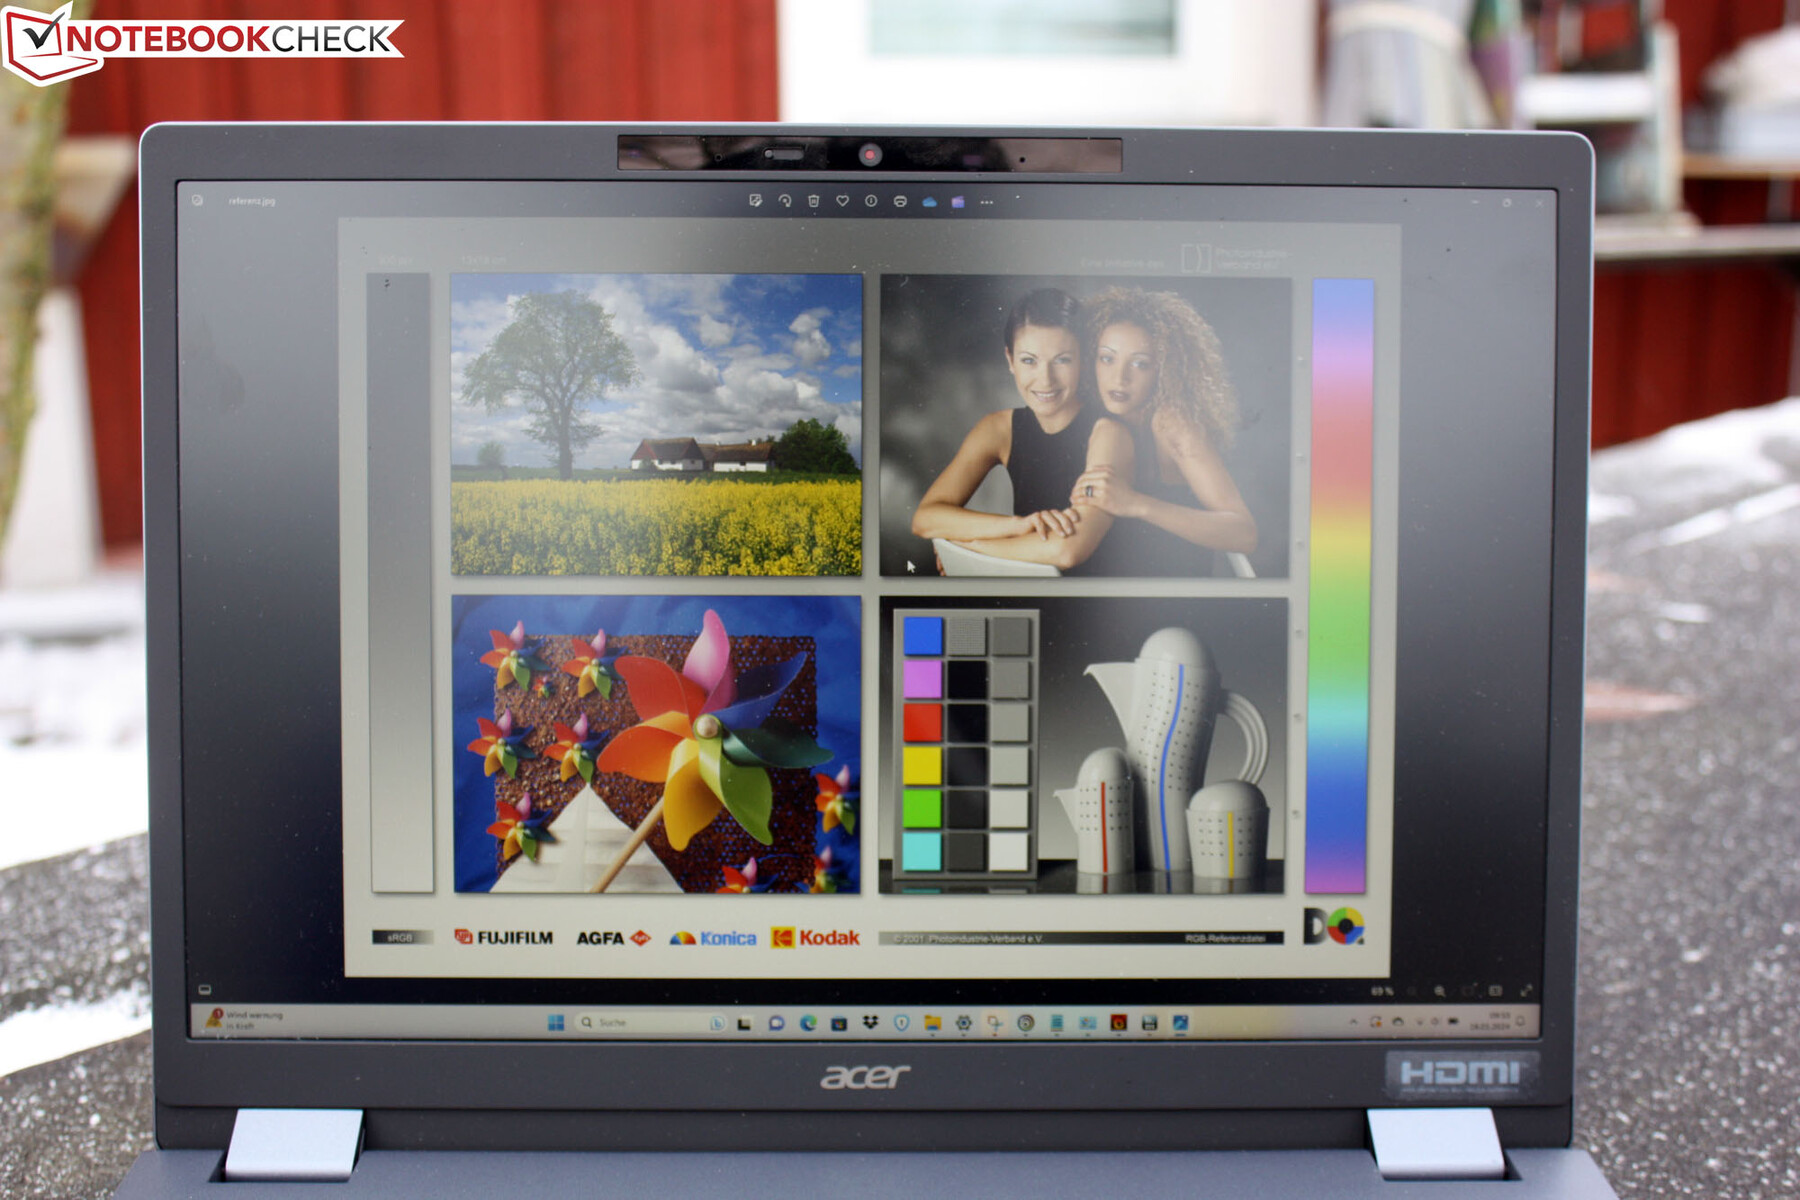
这款 14 英寸笔记本电脑采用非反射式京东方 IPS 面板,分辨率为 1,920 x 1,200 像素。这是 16:10 格式,而不是 16:9(1,920 x 1,080),例如,在处理 Excel 表或文档时,相同宽度下的高度更大。两个 Windows 可以舒适地并排放置。在同价位产品中,一些竞争对手提供了更高的分辨率,如 2,240 x 1,400 的 ThinkPad E14 G5-21JSS05C00.尽管这样可以在屏幕上安装四个较小的窗口,但对于许多用户来说,字迹还是太小了。我们仍然认为,全高清是 14 英寸屏幕的合适分辨率,办公室使用并不需要更高的分辨率。
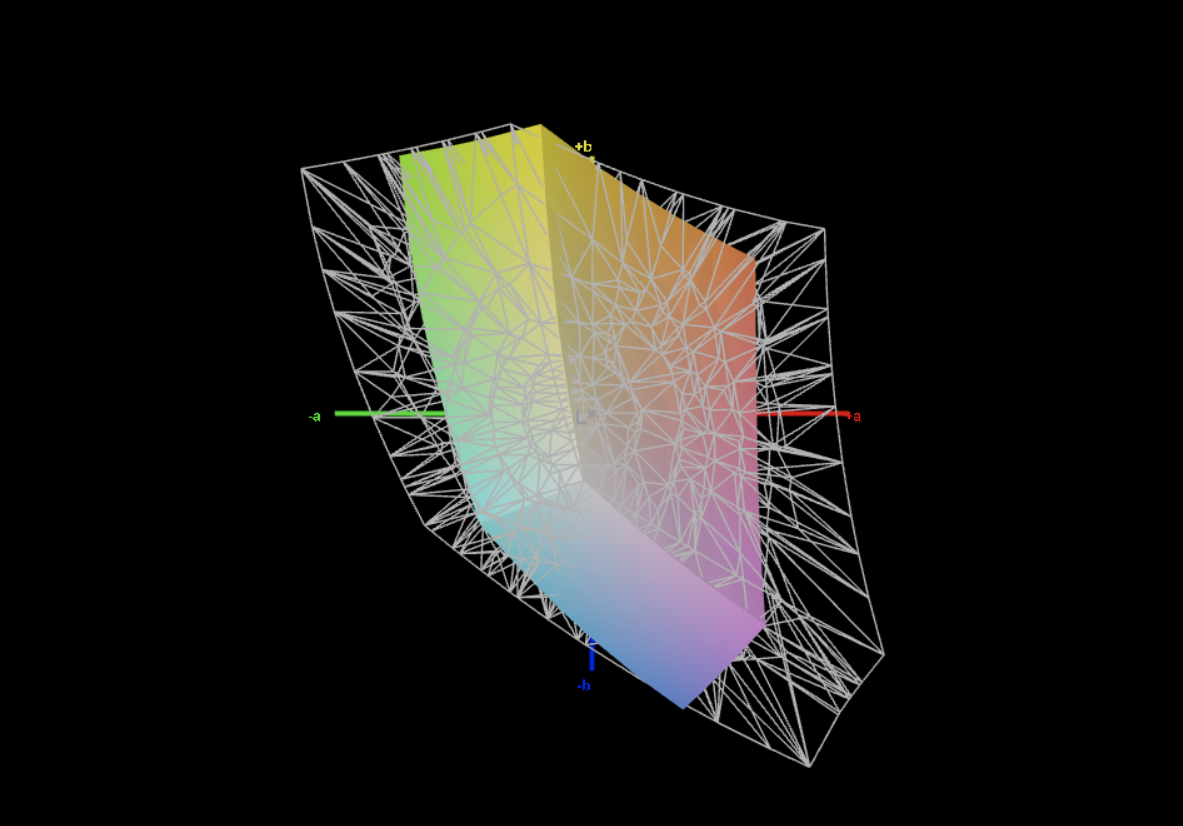
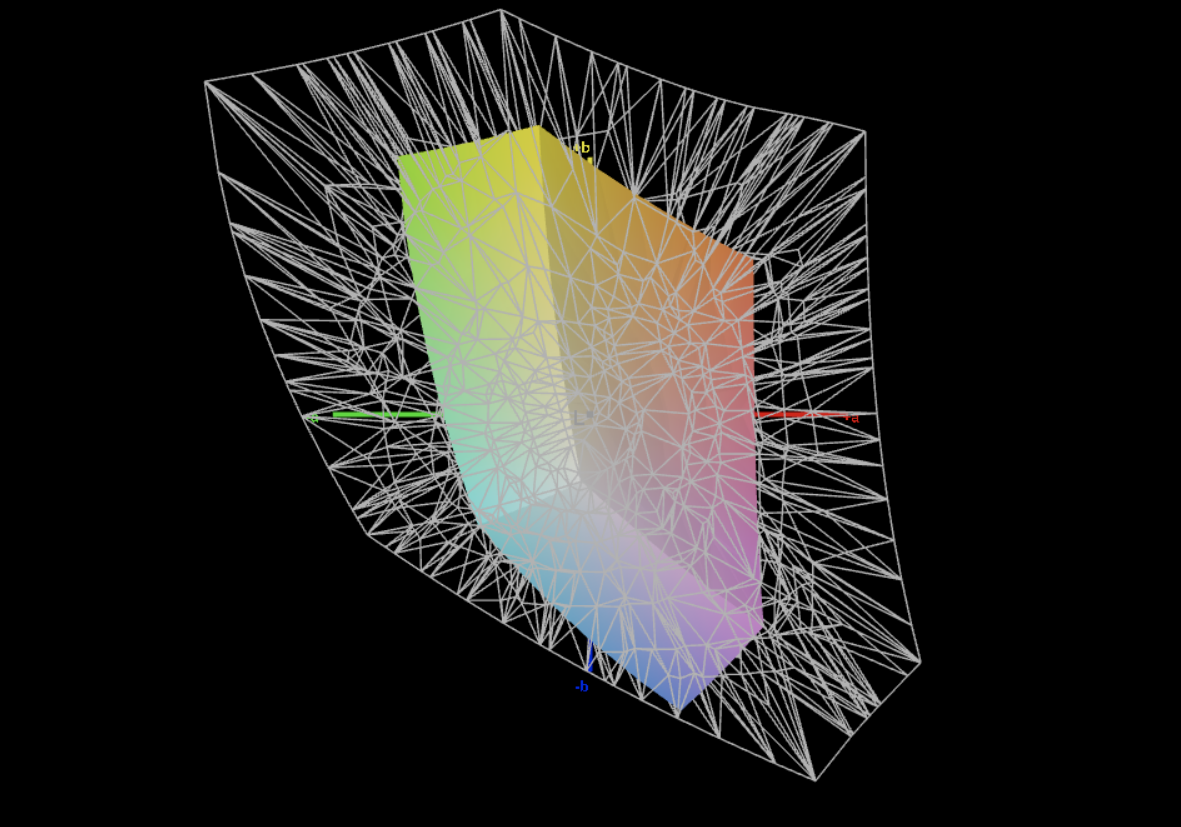
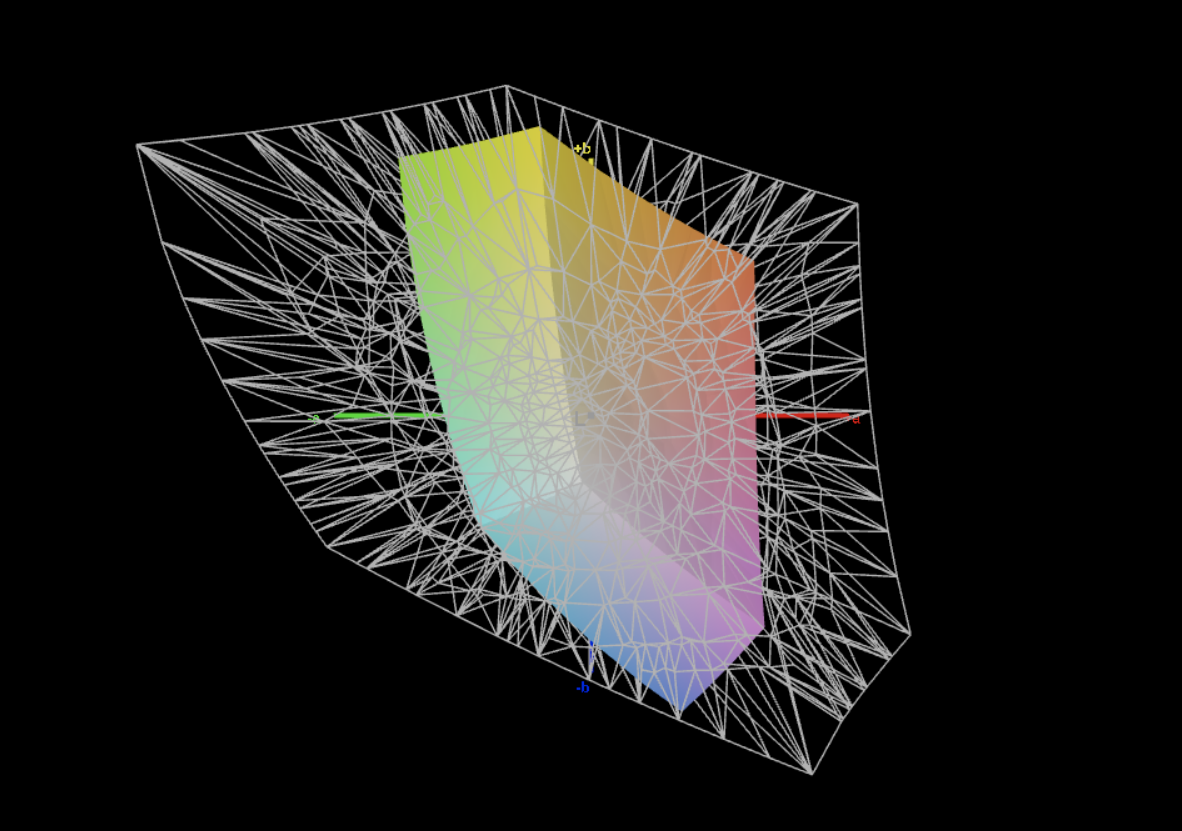
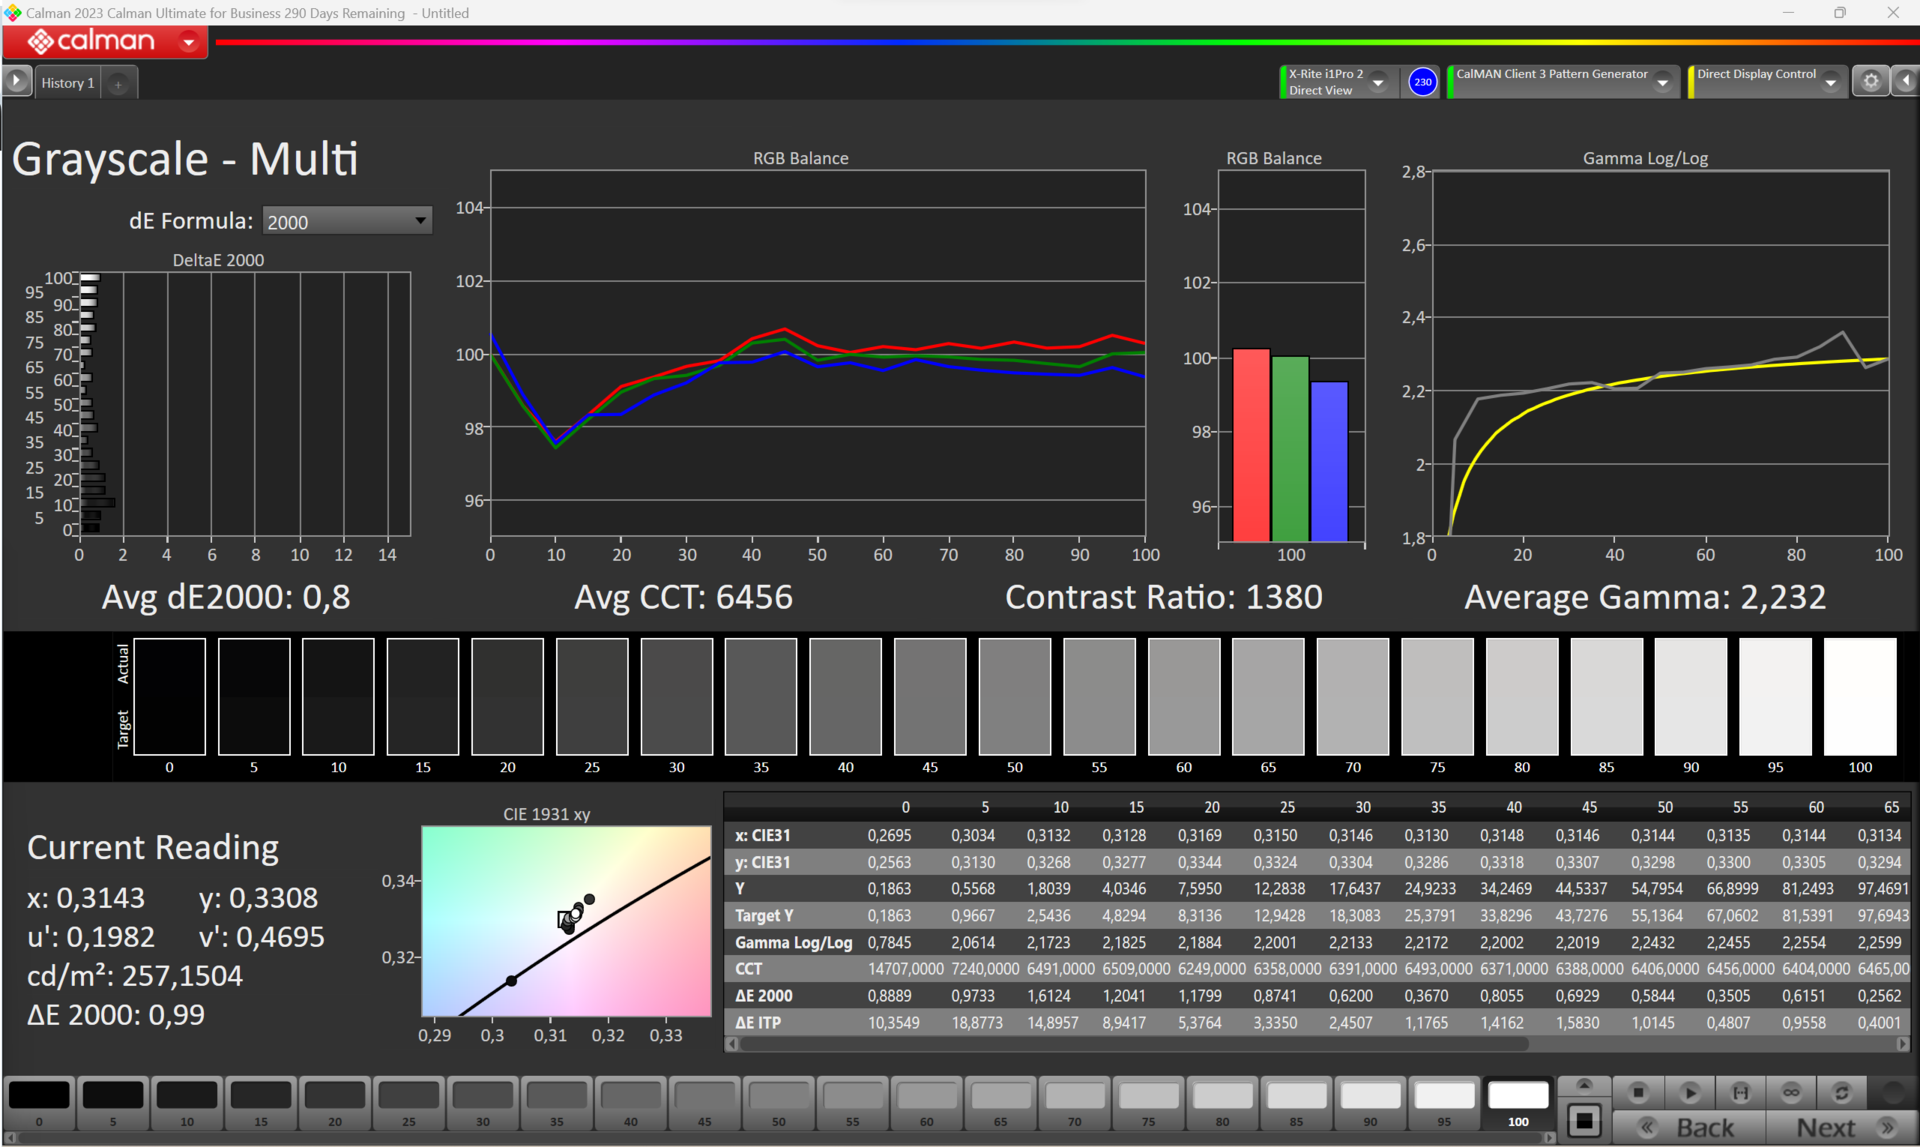
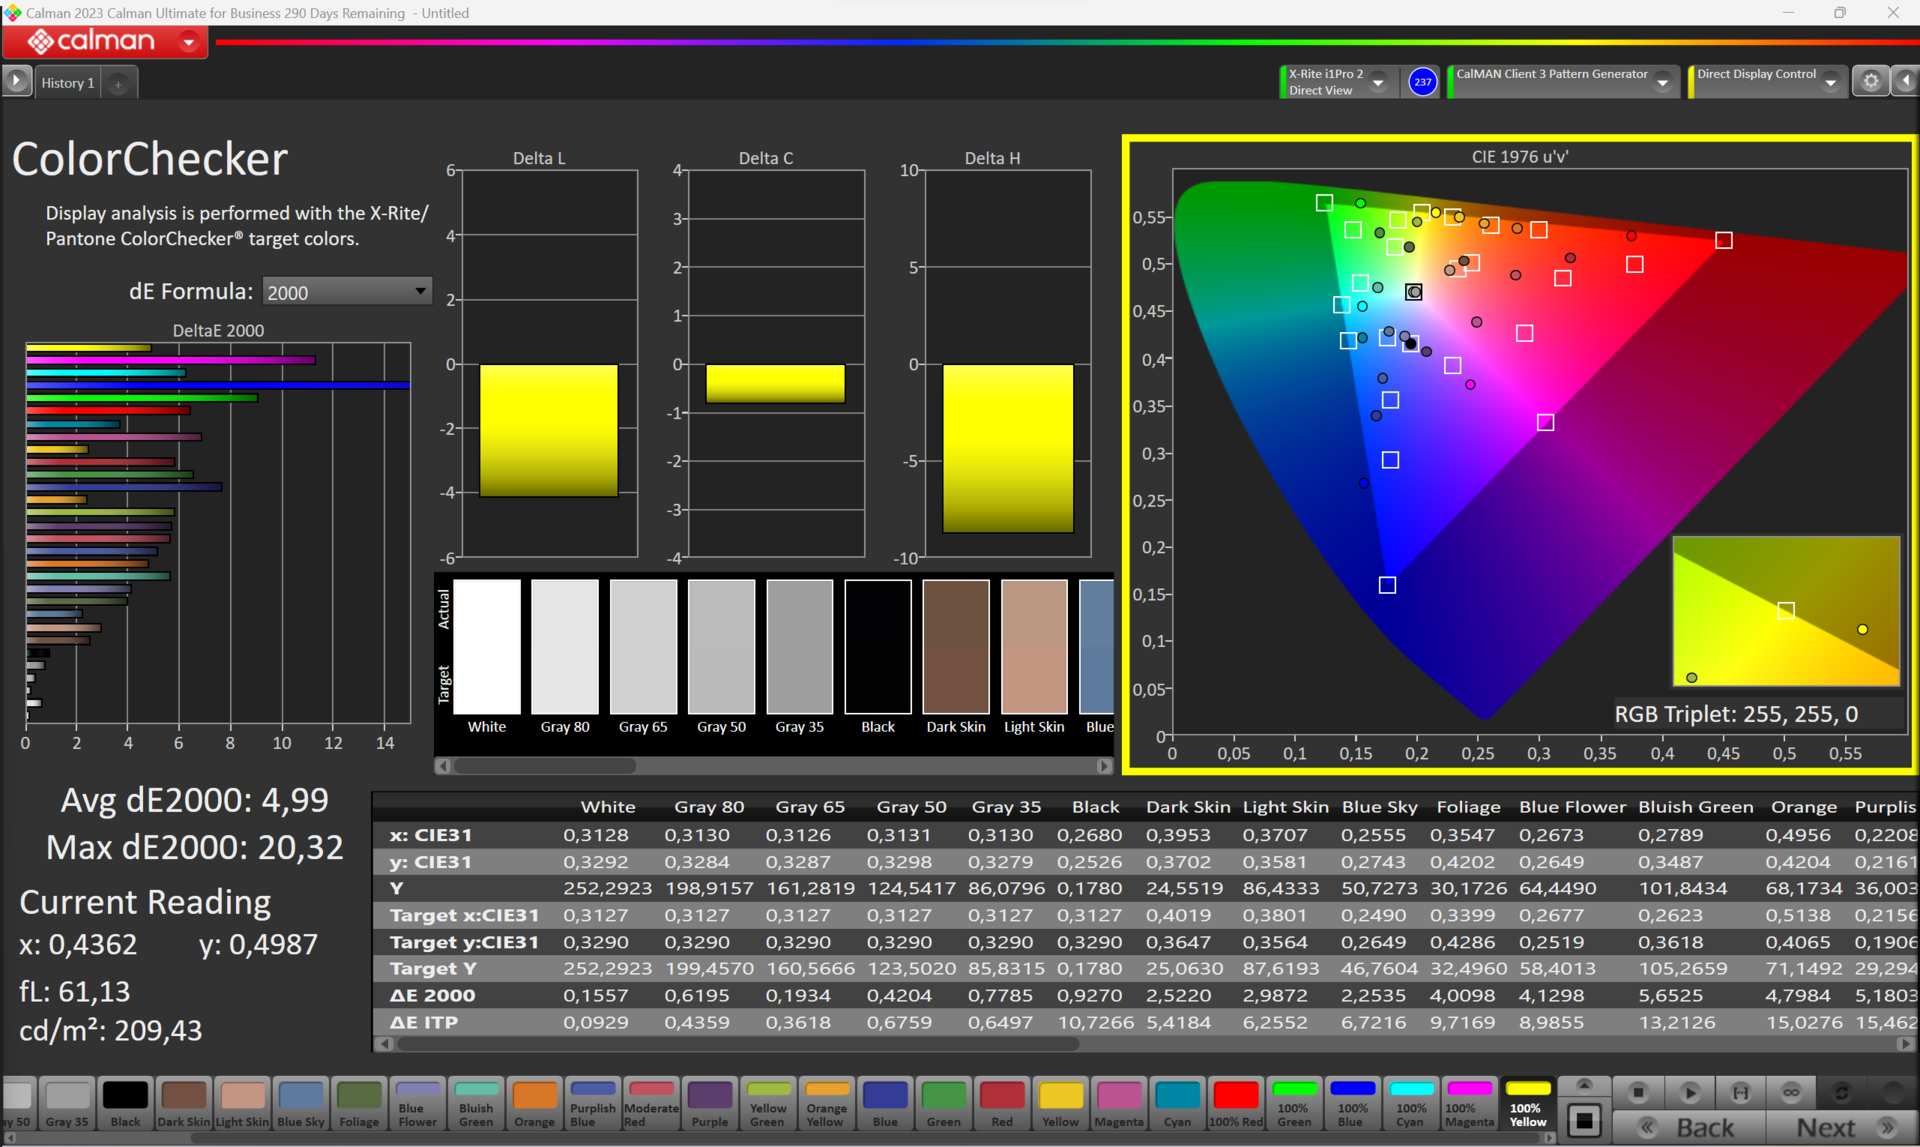
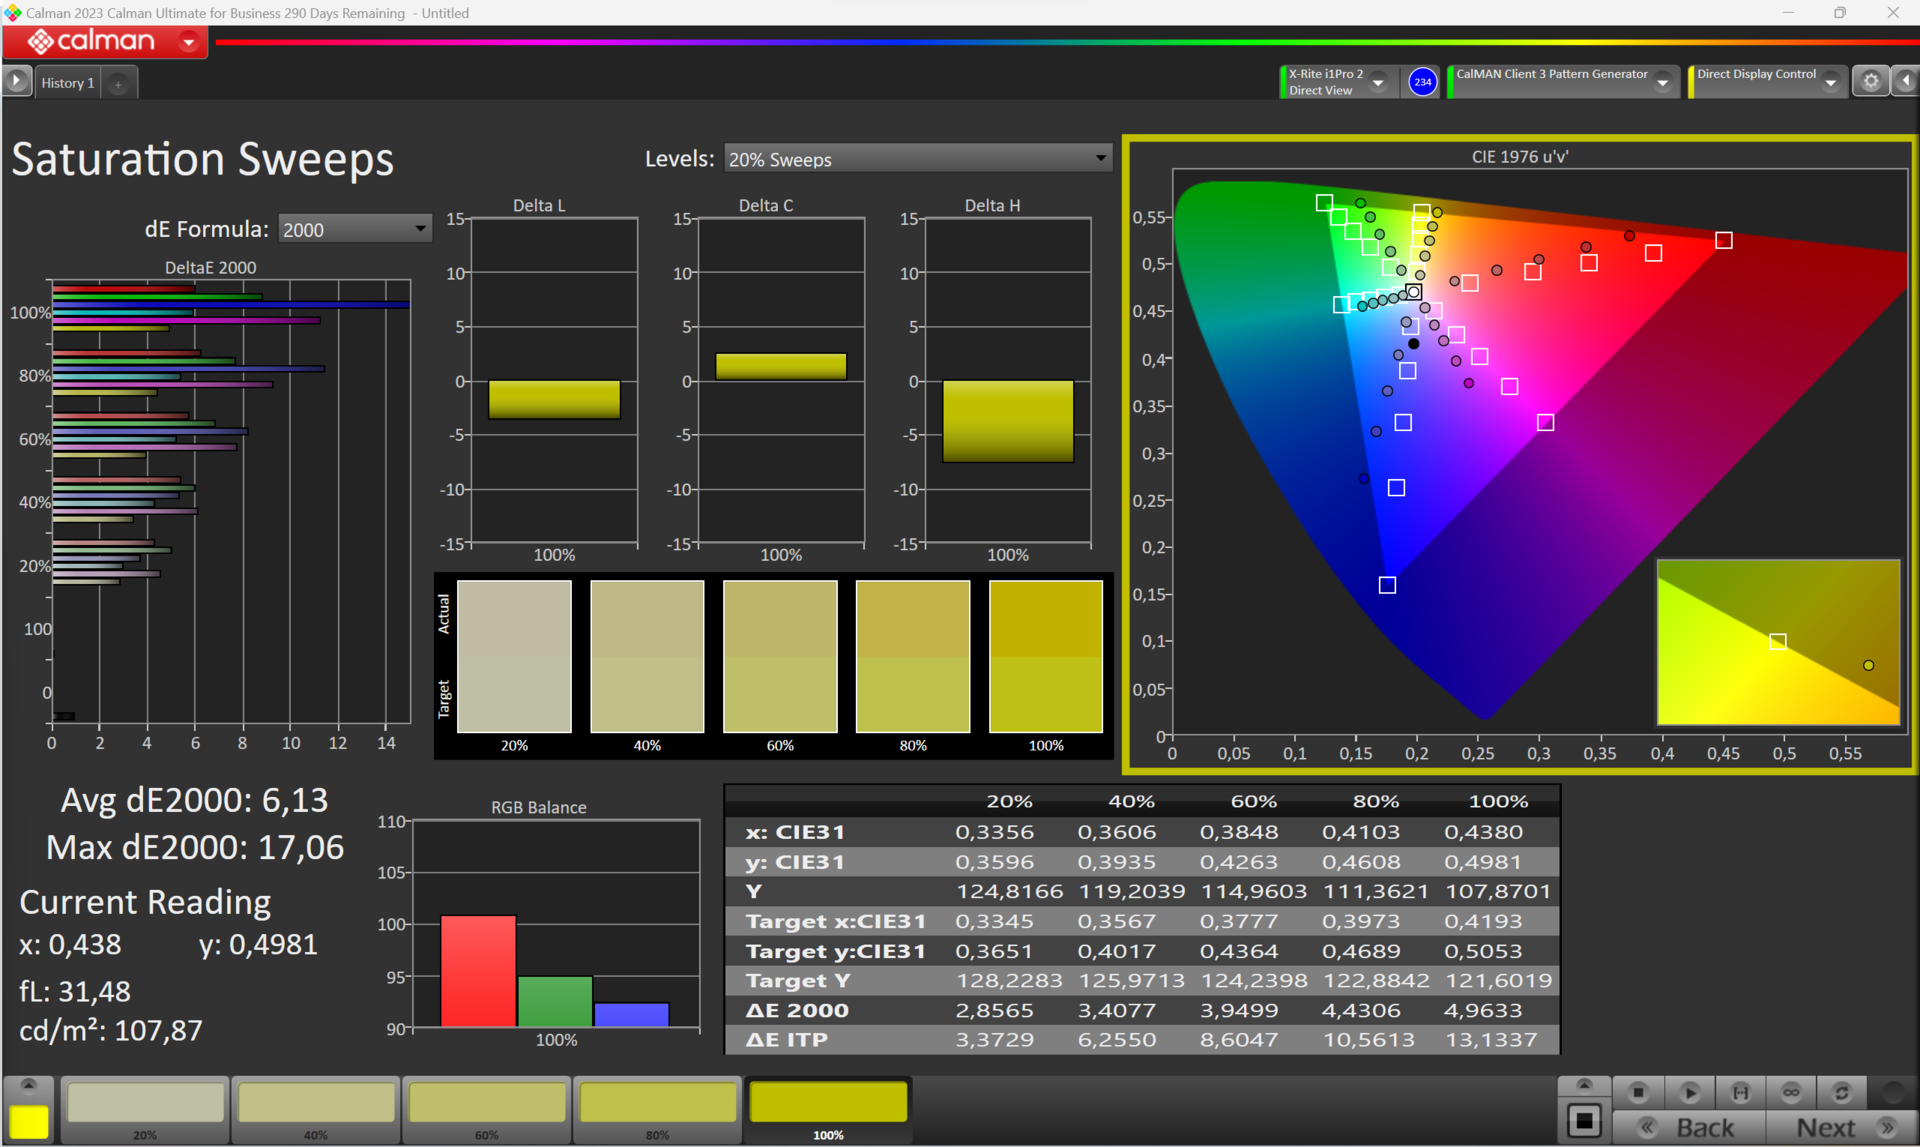
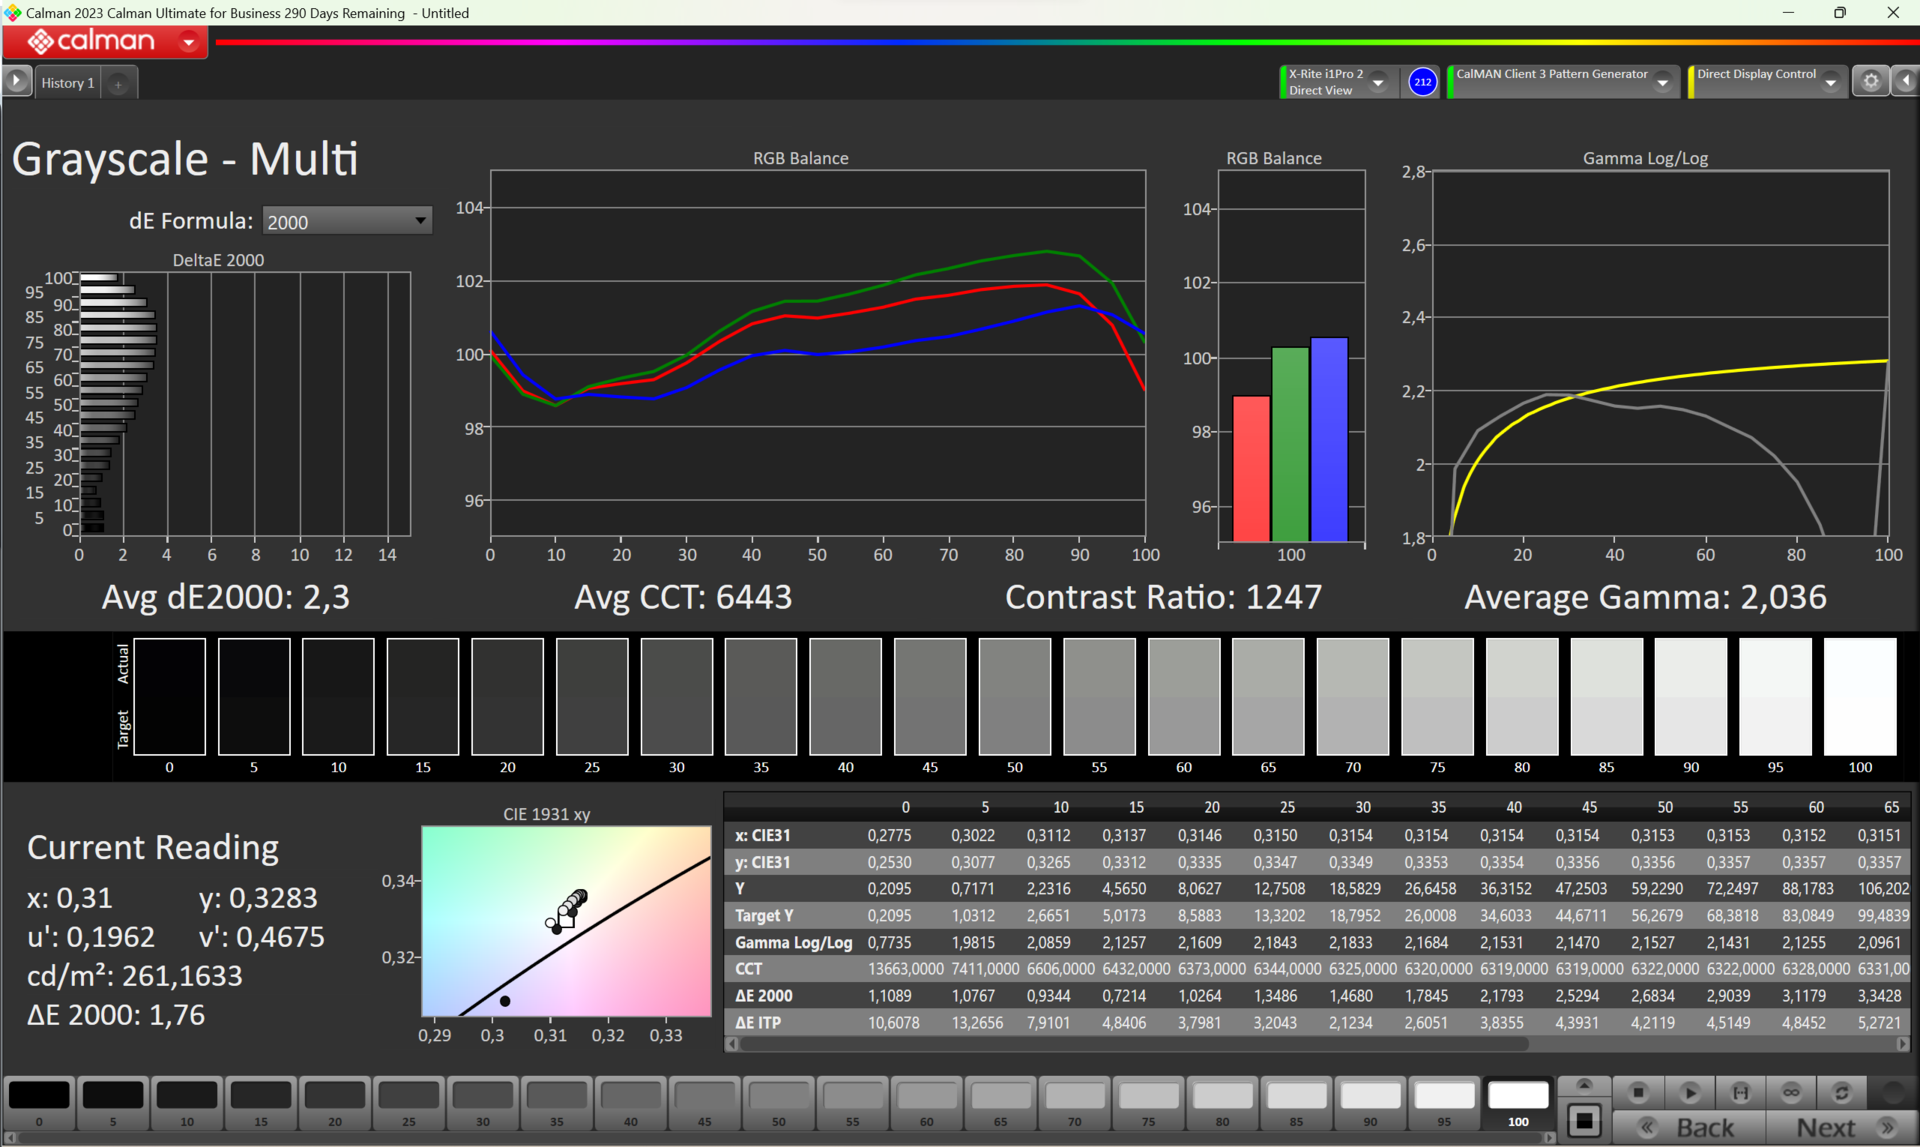
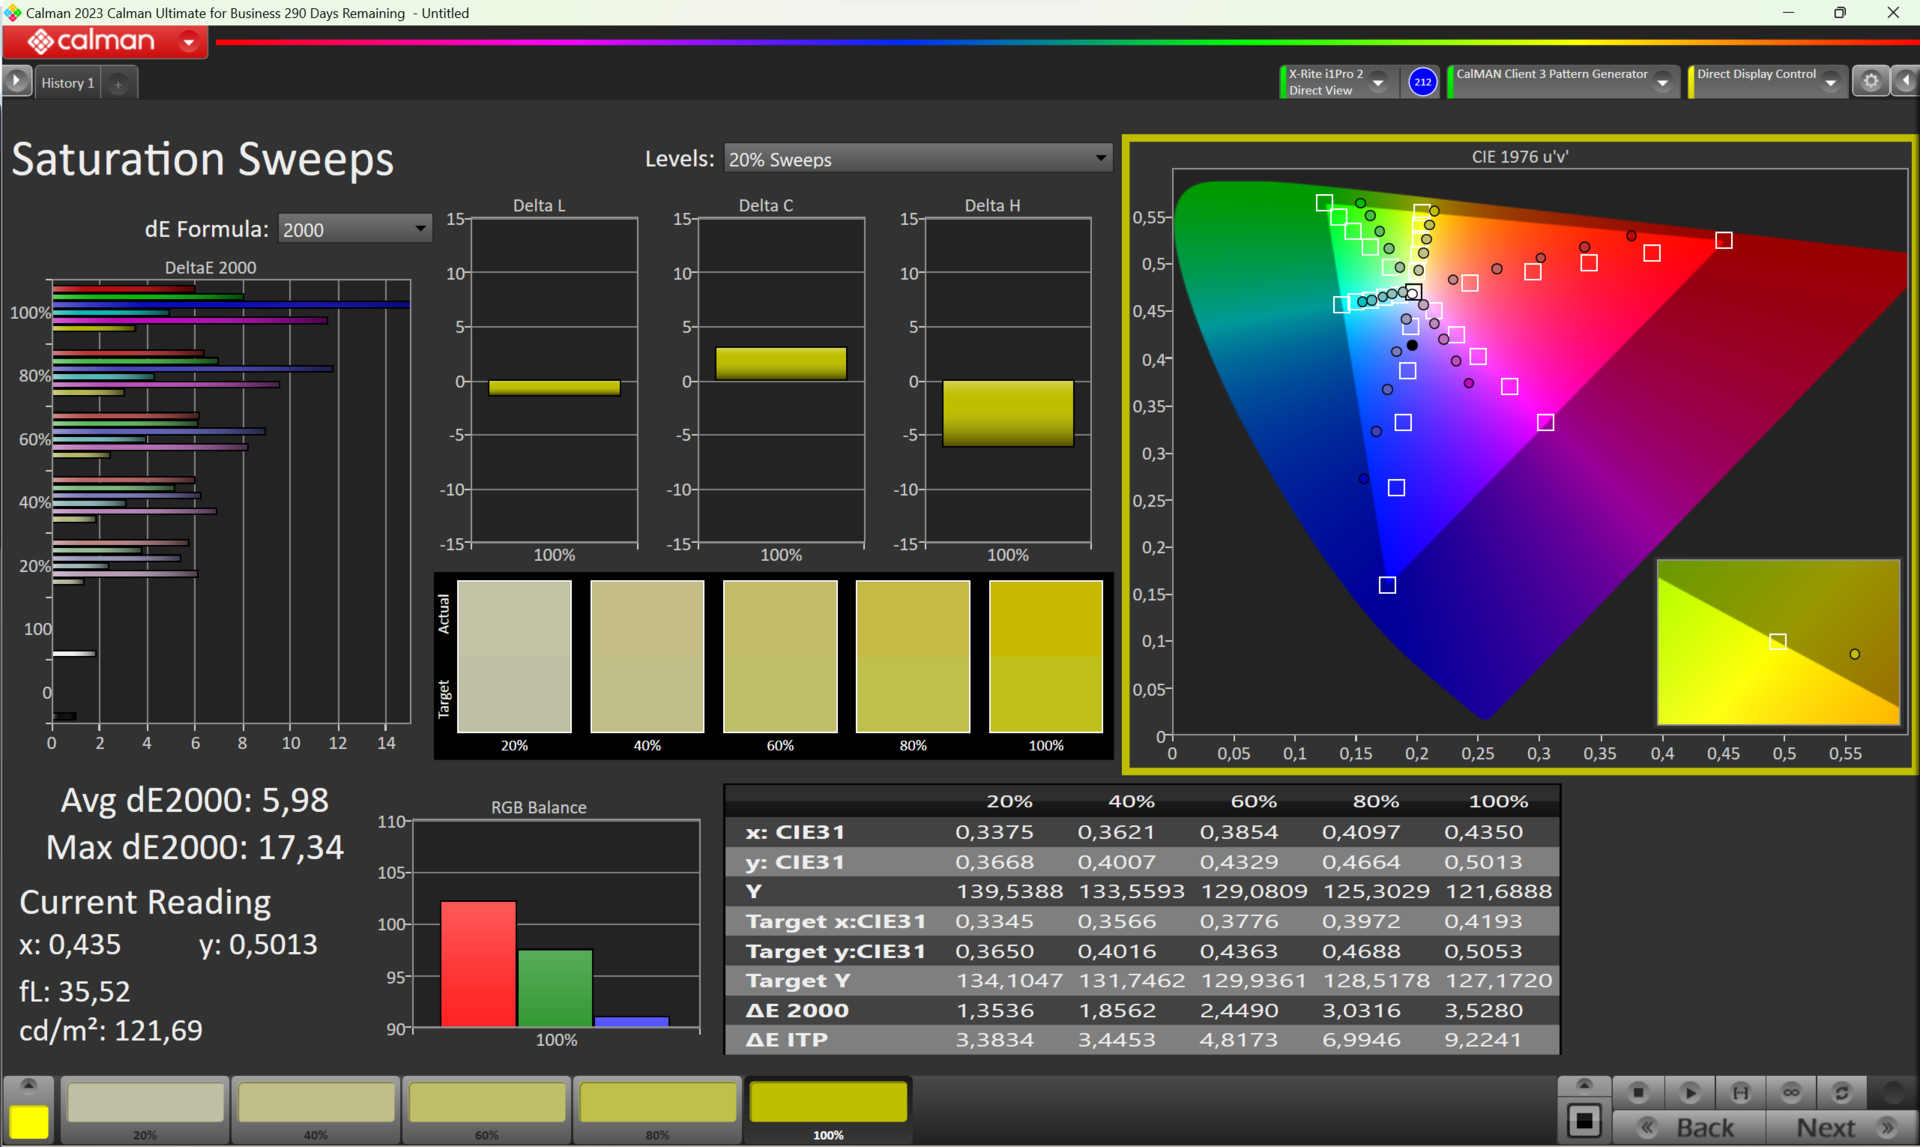
该面板的弱点在于色彩空间覆盖率低(59% sRGB)。尽管如此,我们在办公室仍能获得清晰的图像,高对比度也起到了积极作用。由于采用了磨砂表面,色彩并不鲜艳,而是比较苍白,但就其设计用途而言,这更有利于眼睛。PWM 并未用于亮度调节,这为敏感用户带来了一些安慰。虽然响应时间较慢,但对于办公笔记本电脑来说完全可以接受。
| |||||||||||||||||||||||||
Brightness Distribution: 91 %
Center on Battery: 213 cd/m²
Contrast: 1406:1 (Black: 0.18 cd/m²)
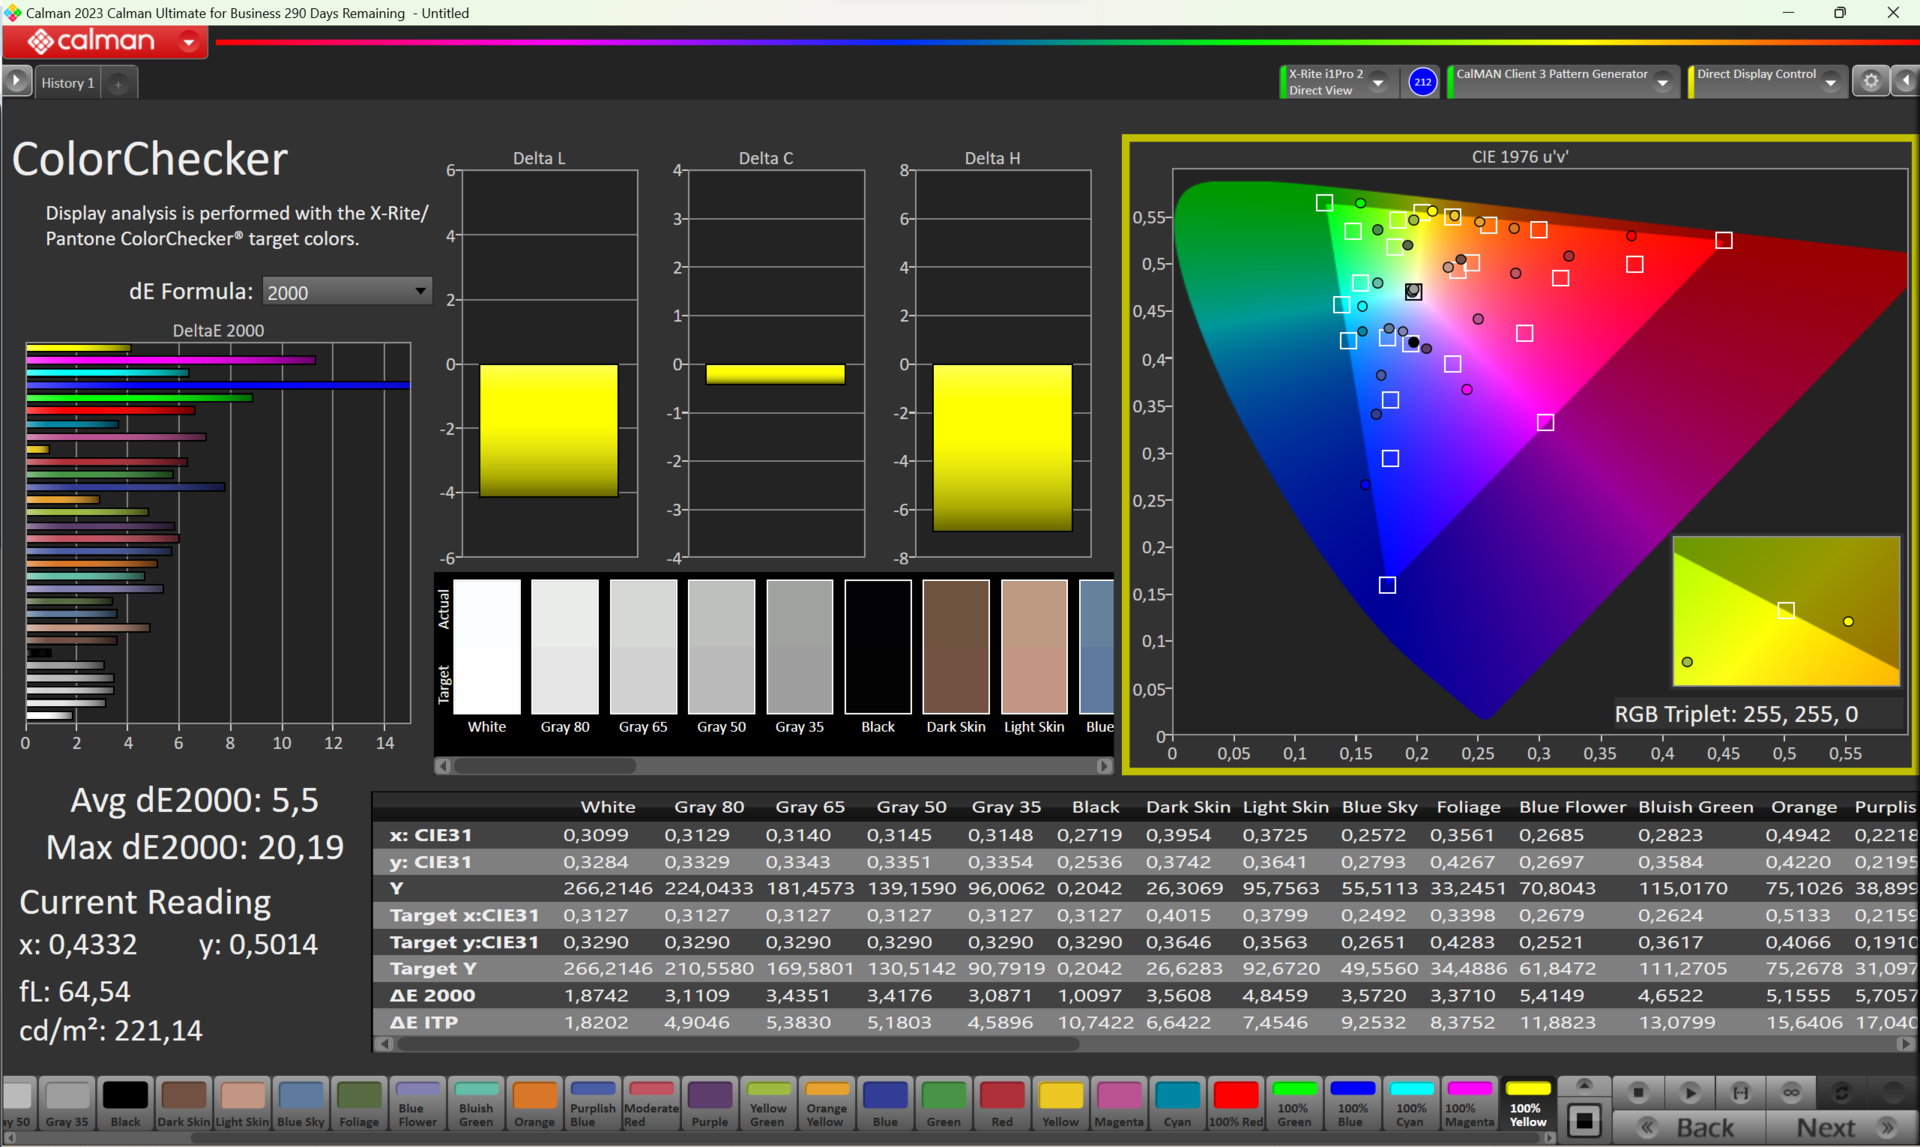
ΔE ColorChecker Calman: 5.5 | ∀{0.5-29.43 Ø4.71}
calibrated: 4.99
ΔE Greyscale Calman: 2.3 | ∀{0.09-98 Ø4.96}
41.3% AdobeRGB 1998 (Argyll 3D)
58.8% sRGB (Argyll 3D)
39.98% Display P3 (Argyll 3D)
Gamma: 2.036
CCT: 6443 K
| Acer TravelMate P4 TMP414-53-58XQ BOE NV140WUM-N41, IPS, 1920x1200, 14" | Dell Latitude 7440 AU Optronics B140QAX, IPS, 2560x1600, 14" | Lenovo ThinkPad E14 G5-21JSS05C00 M140NWHE R1, IPS, 2240x1400, 14" | Lenovo ThinkPad E14 G5 i7-1355U R140NW4D R5, IPS, 1920x1200, 14" | HP ProBook 440 G9-5Y3Z3EA AUO559C, , 1920x1080, 14" | HP ProBook 445 G10 AUO2FA6, IPS, 1920x1080, 14" | |
|---|---|---|---|---|---|---|
| Display | 81% | 70% | 6% | -7% | 68% | |
| Display P3 Coverage (%) | 39.98 | 75.4 89% | 69.3 73% | 41.9 5% | 37 -7% | 68.4 71% |
| sRGB Coverage (%) | 58.8 | 99.9 70% | 97.6 66% | 63 7% | 55.5 -6% | 95.2 62% |
| AdobeRGB 1998 Coverage (%) | 41.3 | 76.2 85% | 70.4 70% | 43.3 5% | 38.2 -8% | 70.6 71% |
| Response Times | -95% | -25% | -13% | -27% | -68% | |
| Response Time Grey 50% / Grey 80% * (ms) | 22.8 ? | 56 ? -146% | 36.3 ? -59% | 30.7 ? -35% | 42 ? -84% | 53.4 ? -134% |
| Response Time Black / White * (ms) | 21.5 ? | 30.8 ? -43% | 19.5 ? 9% | 19.6 ? 9% | 15 ? 30% | 21.8 ? -1% |
| PWM Frequency (Hz) | ||||||
| Screen | 18% | 34% | -1% | -43% | 35% | |
| Brightness middle (cd/m²) | 253 | 517.3 104% | 362 43% | 352.3 39% | 255 1% | 501 98% |
| Brightness (cd/m²) | 238 | 488 105% | 354 49% | 344 45% | 233 -2% | 464 95% |
| Brightness Distribution (%) | 91 | 88 -3% | 91 0% | 86 -5% | 86 -5% | 87 -4% |
| Black Level * (cd/m²) | 0.18 | 0.34 -89% | 0.18 -0% | 0.27 -50% | 0.26 -44% | |
| Contrast (:1) | 1406 | 1521 8% | 2011 43% | 1305 -7% | 1927 37% | |
| Colorchecker dE 2000 * | 5.5 | 3.3 40% | 2.6 53% | 4.99 9% | 8.41 -53% | 2.64 52% |
| Colorchecker dE 2000 max. * | 20.19 | 7.81 61% | 3.7 82% | 14.84 26% | 13.51 33% | 5.06 75% |
| Colorchecker dE 2000 calibrated * | 4.99 | 1.02 80% | 1.1 78% | 1.87 63% | 1.57 69% | |
| Greyscale dE 2000 * | 2.3 | 5.6 -143% | 3.3 -43% | 5.3 -130% | 7.6 -230% | 3.8 -65% |
| Gamma | 2.036 108% | 2.37 93% | 2.28 96% | 2.2 100% | 3.12 71% | 2.103 105% |
| CCT | 6443 101% | 6804 96% | 6761 96% | 7682 85% | 6233 104% | 6562 99% |
| Total Average (Program / Settings) | 1% /
16% | 26% /
33% | -3% /
-1% | -26% /
-30% | 12% /
27% |
* ... smaller is better
额外的校准并不值得,因为灰度的 DeltaE 只从 2.3 降到了 0.8。虽然这仍然是一个进步,但在大多数情况下,当偏差低于 3.0 时,我们的眼睛无法感知到与原始图像的任何差异。ColorChecker DeltaE 从 5.5 微降至 5.0,与神奇的 3.0 相差甚远。正如卡尔曼色彩校准工具所示,该面板并不适合专业图像处理。
Display Response Times
| ↔ Response Time Black to White | ||
|---|---|---|
| 21.5 ms ... rise ↗ and fall ↘ combined | ↗ 11 ms rise |  |
| ↘ 10.5 ms fall | ||
| The screen shows good response rates in our tests, but may be too slow for competitive gamers. In comparison, all tested devices range from 0.1 (minimum) to 240 (maximum) ms. » 48 % of all devices are better. This means that the measured response time is similar to the average of all tested devices (19.8 ms). | ||
| ↔ Response Time 50% Grey to 80% Grey | ||
| 22.8 ms ... rise ↗ and fall ↘ combined | ↗ 9.7 ms rise |  |
| ↘ 13.1 ms fall | ||
| The screen shows good response rates in our tests, but may be too slow for competitive gamers. In comparison, all tested devices range from 0.165 (minimum) to 636 (maximum) ms. » 34 % of all devices are better. This means that the measured response time is better than the average of all tested devices (31 ms). | ||
Screen Flickering / PWM (Pulse-Width Modulation)
| Screen flickering / PWM not detected | 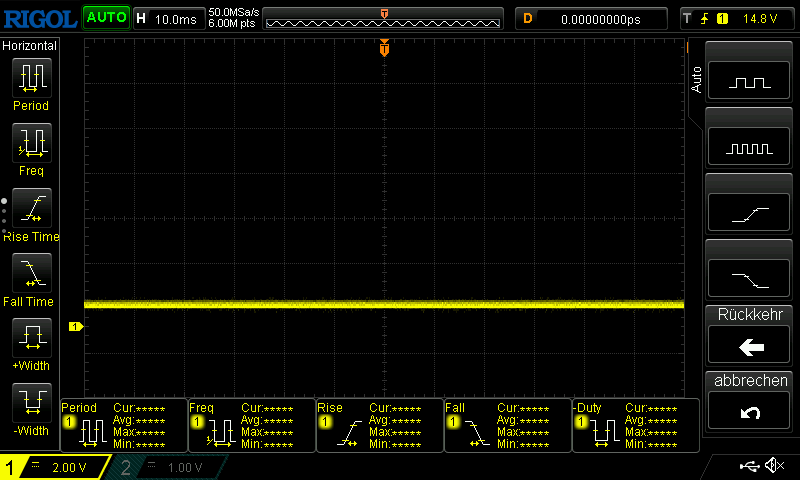 | ||
In comparison: 52 % of all tested devices do not use PWM to dim the display. If PWM was detected, an average of 7757 (minimum: 5 - maximum: 343500) Hz was measured. | |||
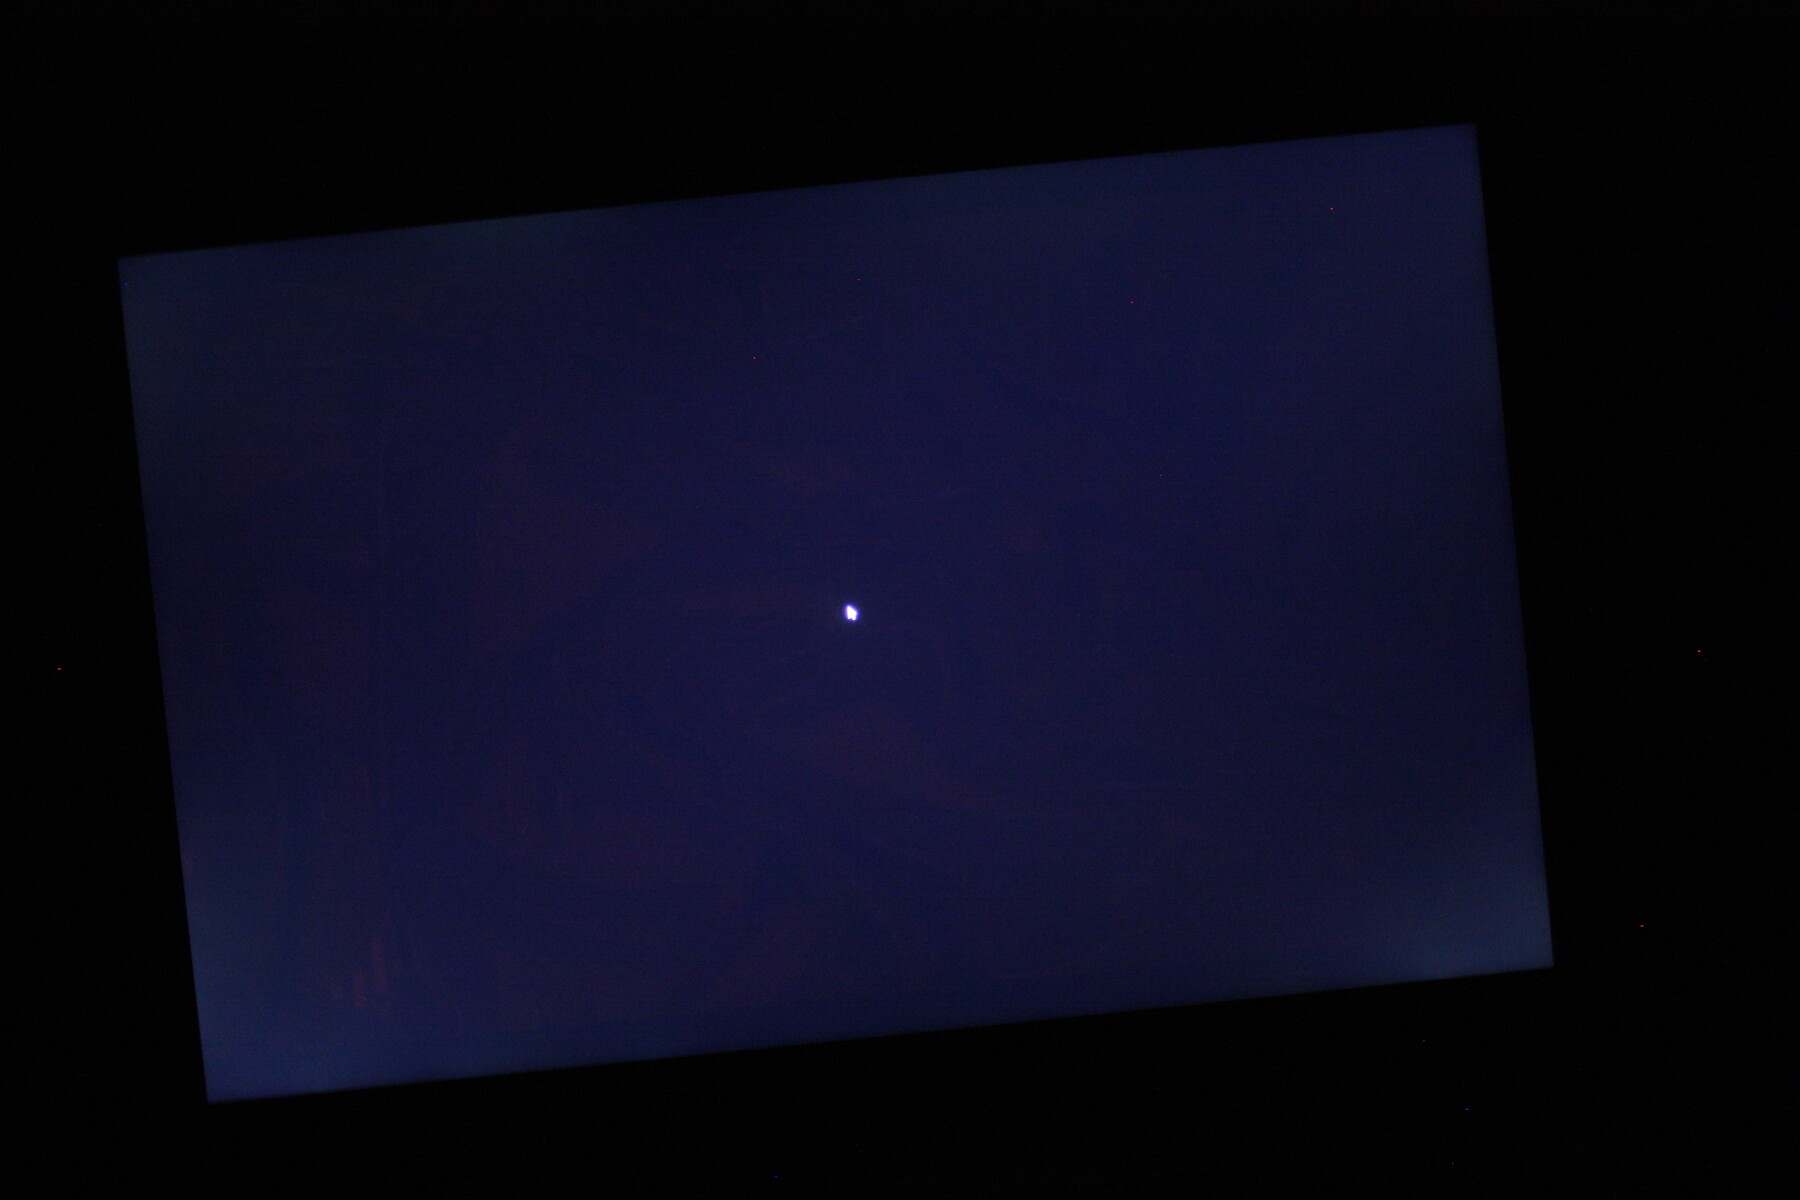
在日常操作中,最大的弱点在于 253 cd/m²(中心)的最大亮度较低。这在室内足够了,但在夏天的阳台或公园里,就会增加工作难度。在电池工作状态下,最大亮度降低到 213 cd/m²(中间)也无济于事。我们注意到左下角和右下角有些模糊,但仅限于黑色图像。
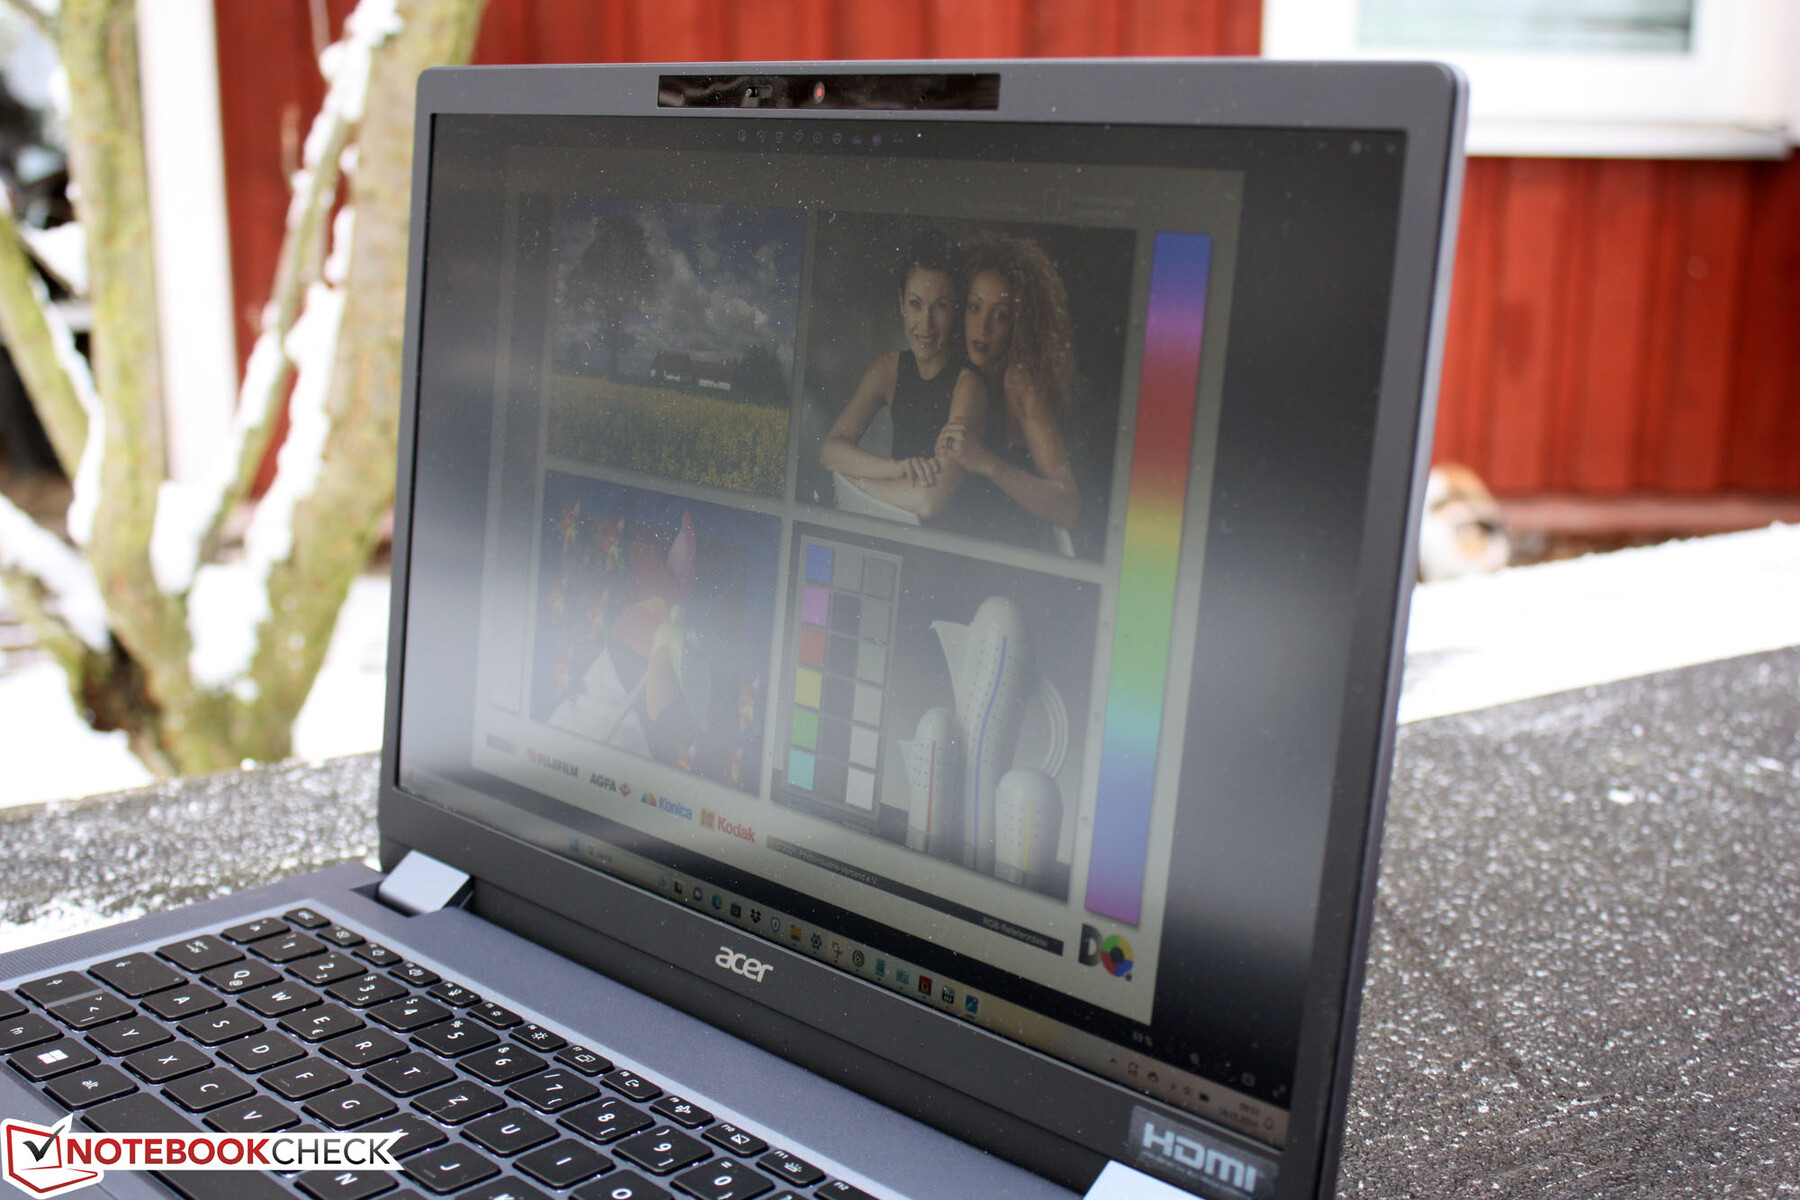
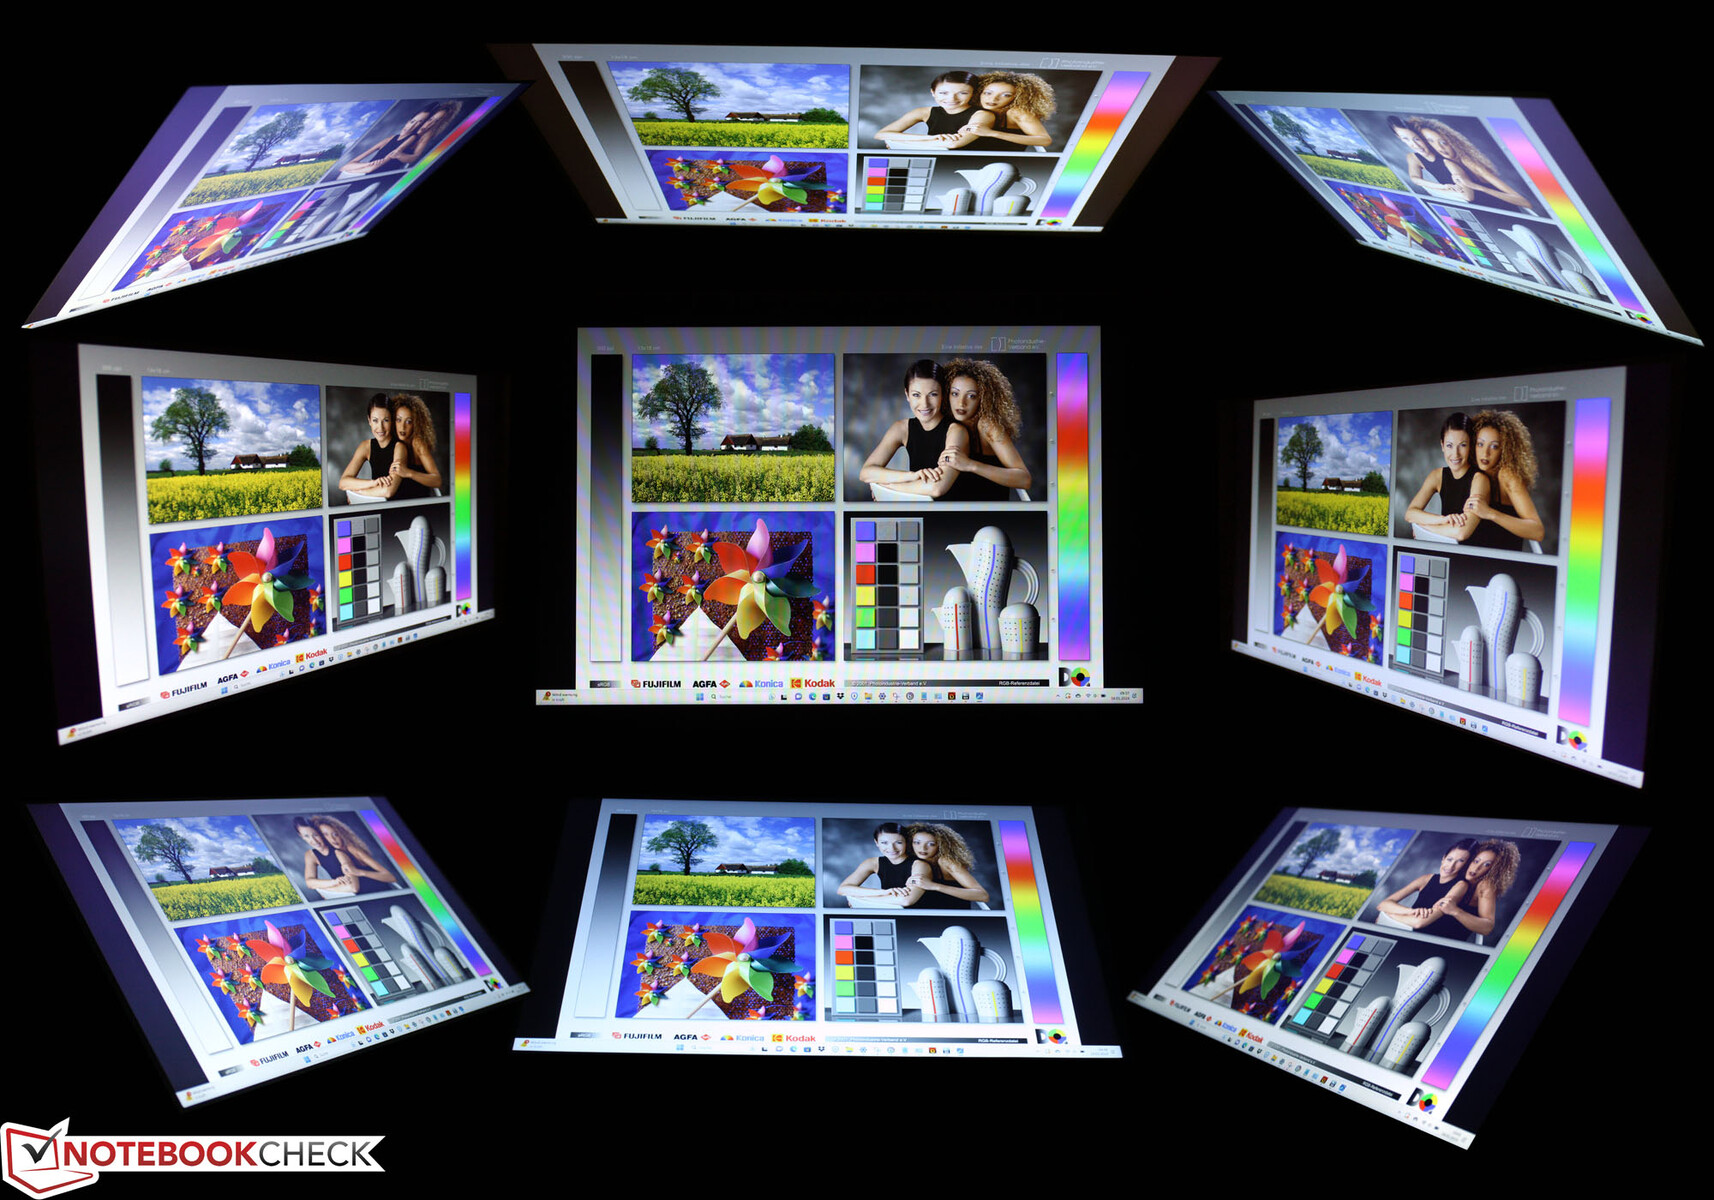
从侧面看显示屏会明显变暗,但这与防止他人偷看屏幕的隐私保护措施无关。不过,字迹仍然清晰可读。
性能
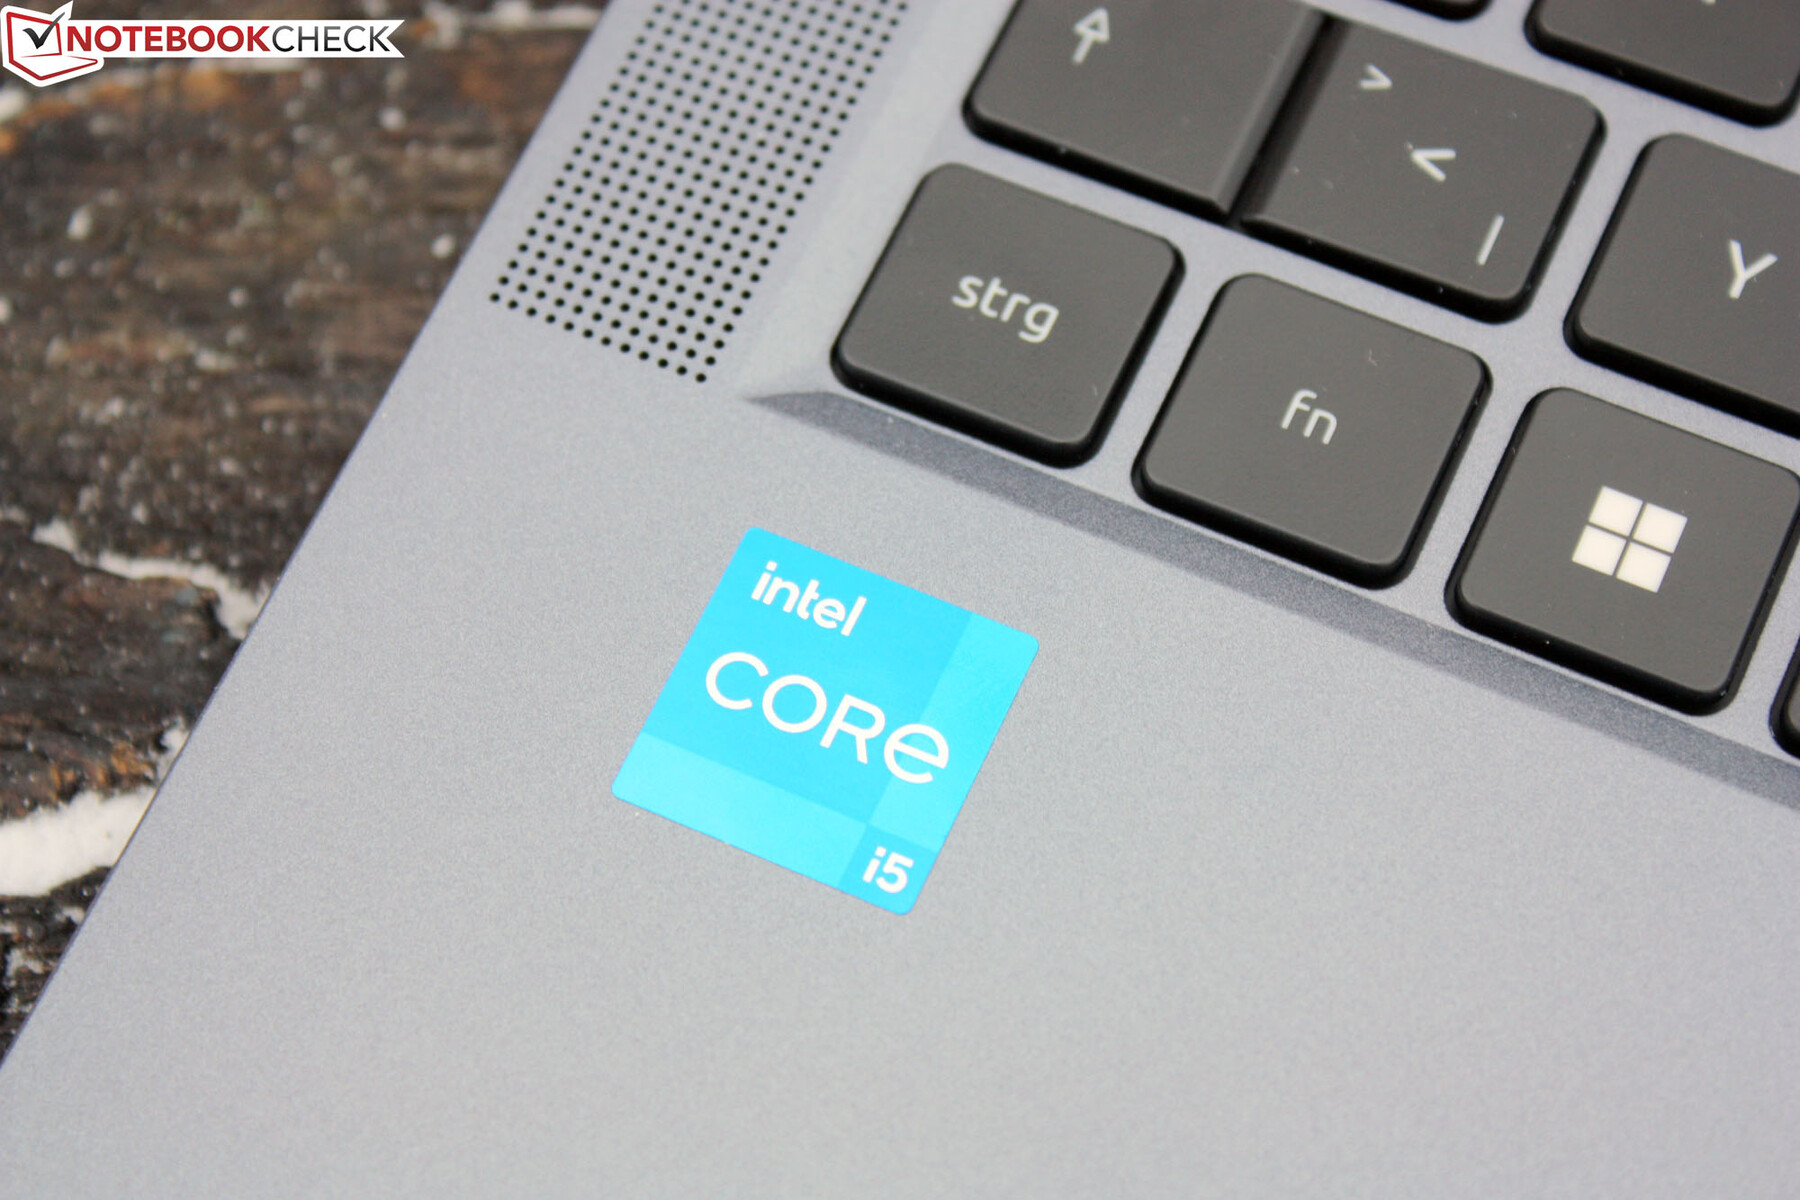
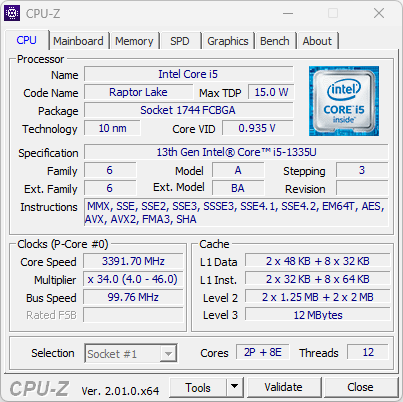
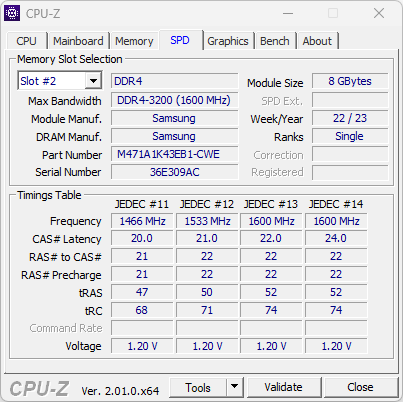
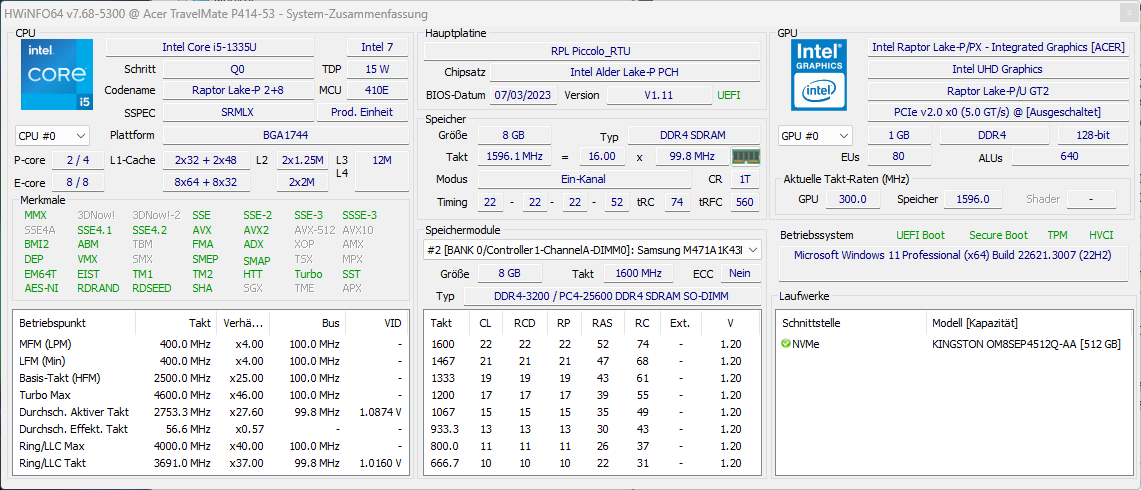
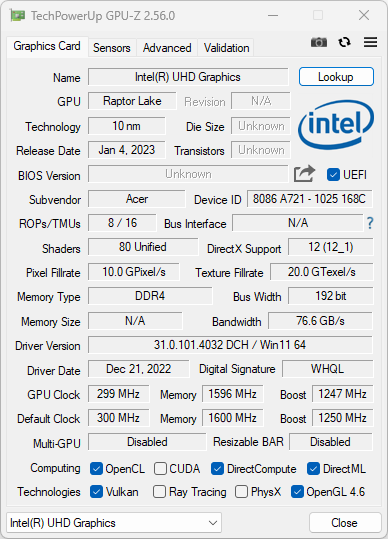
i5-1335U i5-1335Ui5-1335U 处理器于 2023 年 1 月推出,目标是通过两个性能内核和八个效率内核实现可扩展的性能发展。在这里,低功耗的长电池寿命比所有内核的恒定性能更重要,因此,这似乎正是适合闲置数小时的后台办公室使用的 SoC。与 SoC 配套的是来自金士顿的 512 GB SSD,其中 433 GB 仍可供用户使用。工作内存由一个 8GB 模块提供,可通过第二个模块轻松扩展。最大扩展容量为 2x 16GB。
测试条件
我们使用 "最佳性能 "Windows 模式进行了性能测试。
处理器
R15 恒定负载测试评估 SoC 在连续最大负载下的表现。它能否在基准测试中持续保持高分?答案是否定的,因为英特尔 酷睿 i5-1335U从低于平均水平开始,然后一直保持在这一水平。虽然该 SoC 的峰值性能可以达到 1,547 分,但 TravelMate 只能达到 1,238 分。i5-1345U i5-1345U兄弟 SoC 的起始性能较高,达到 1,541 分,但随后下滑至平均 1,310 分。总之,宏碁笔记本电脑没有充分发挥芯片的潜力,P 内核的性能仍未得到发挥。
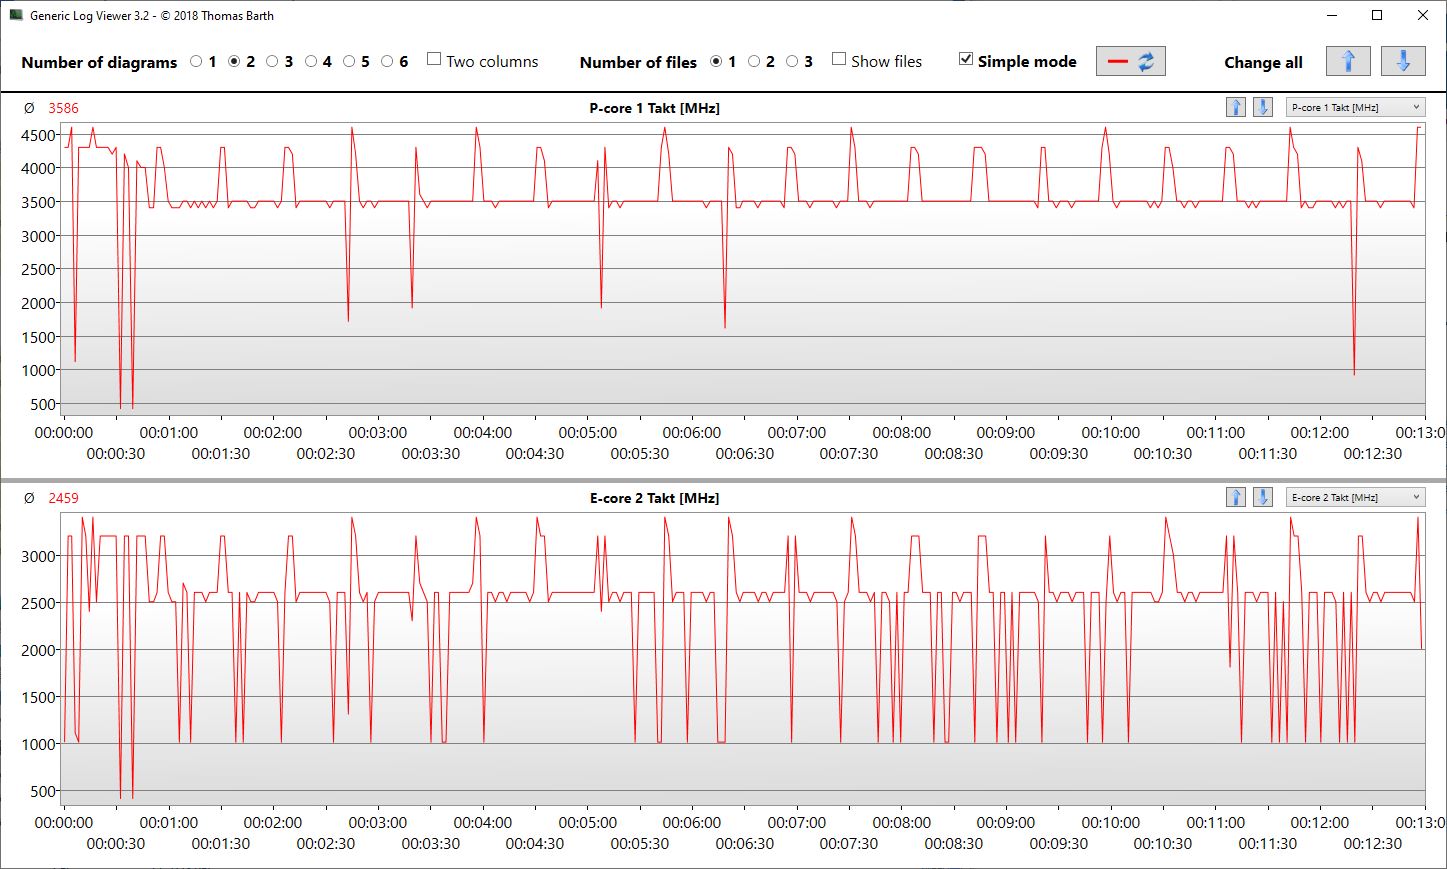
这是为什么呢? 4.在基准测试开始时,两个 P 核心的最高频率甚至没有达到 6 GHz,日志查看器仅在前两次运行时显示为 4.3 GHz。循环中 P 核心的平均频率为 3.58 GHz。E 核心也仅在开始时达到 3.3 GHz,之后平均频率降至 2.45 GHz。
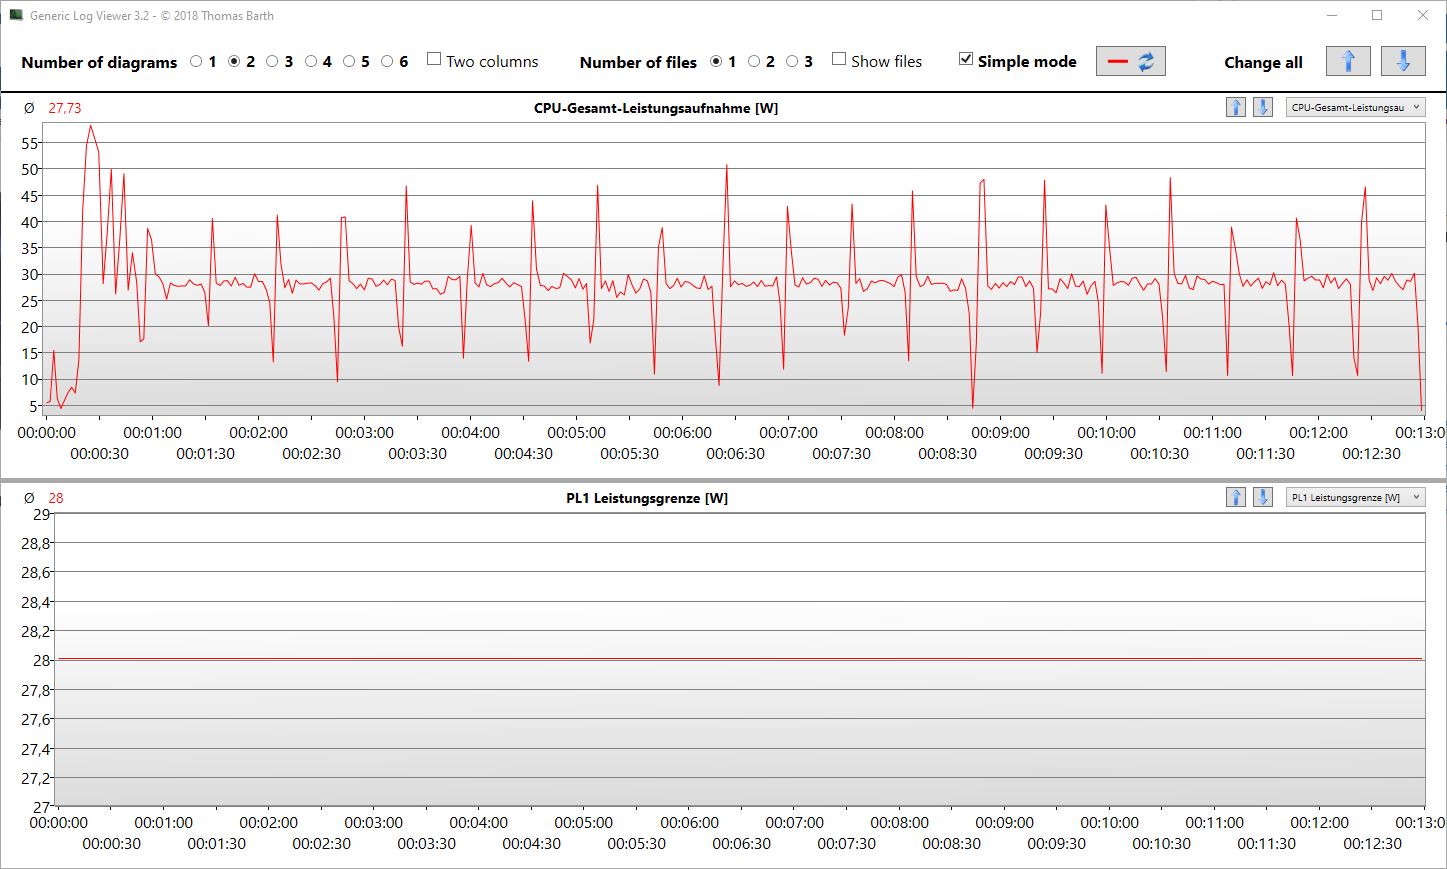
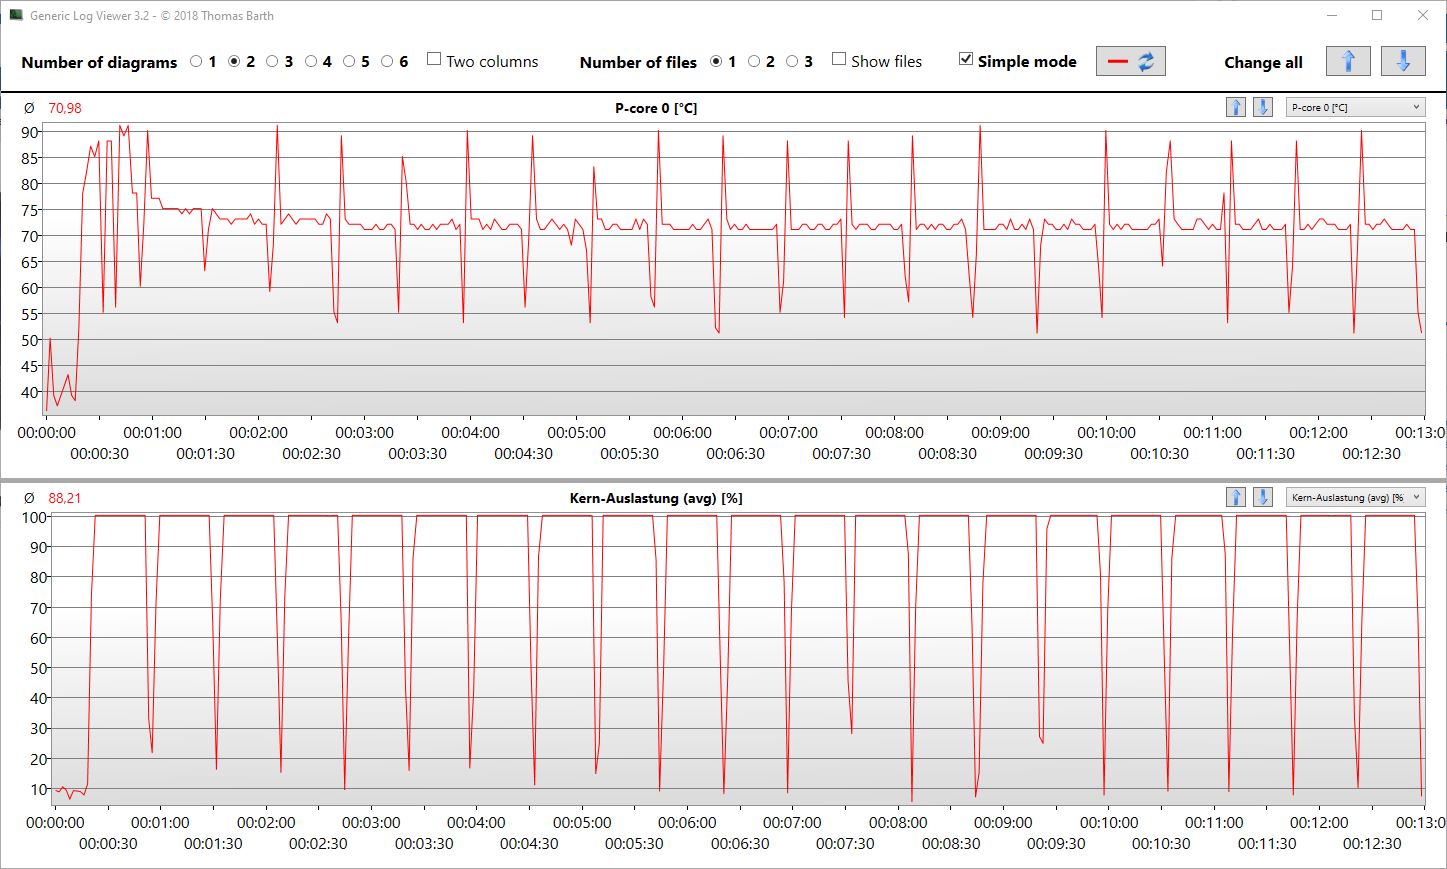
宏碁调整了温度限制,以降低表面温度,只要勉强达到 90 ºC(194 ºF),速度就会明显降低。在 SoC 功耗中,我们可以清楚地看到 55 瓦(短暂)和 28 瓦(长期)作为标记。
但这并不意味着宏碁 TravelMate P4 是一款糟糕的办公笔记本电脑。另一方面,那些需要最佳峰值和持续性能来满足应用需求的用户,最好还是选择笔记本电脑。 戴尔Latitude 7440或联想 ThinkPad E14 G5.
Cinebench R15 Multi Constant Load Test
Cinebench R23: Multi Core | Single Core
Cinebench R20: CPU (Multi Core) | CPU (Single Core)
Cinebench R15: CPU Multi 64Bit | CPU Single 64Bit
Blender: v2.79 BMW27 CPU
7-Zip 18.03: 7z b 4 | 7z b 4 -mmt1
Geekbench 5.5: Multi-Core | Single-Core
HWBOT x265 Benchmark v2.2: 4k Preset
LibreOffice : 20 Documents To PDF
R Benchmark 2.5: Overall mean
| CPU Performance rating | |
| Average of class Subnotebook | |
| Lenovo ThinkPad E14 G5-21JSS05C00 | |
| Dell Latitude 7440 | |
| Acer TravelMate P4 TMP414-53-58XQ | |
| Average Intel Core i5-1335U | |
| HP ProBook 445 G10 | |
| HP ProBook 440 G9-5Y3Z3EA | |
| Lenovo ThinkPad E14 G5 i7-1355U | |
| Fujitsu LifeBook E5412A E542AMHAAMDE | |
| Cinebench R23 / Multi Core | |
| Average of class Subnotebook (1555 - 21812, n=60, last 2 years) | |
| Lenovo ThinkPad E14 G5-21JSS05C00 | |
| Dell Latitude 7440 | |
| Acer TravelMate P4 TMP414-53-58XQ | |
| Acer TravelMate P4 TMP414-53-58XQ | |
| Average Intel Core i5-1335U (6957 - 9438, n=12) | |
| Lenovo ThinkPad E14 G5 i7-1355U | |
| HP ProBook 445 G10 | |
| HP ProBook 440 G9-5Y3Z3EA | |
| Fujitsu LifeBook E5412A E542AMHAAMDE | |
| Cinebench R23 / Single Core | |
| Lenovo ThinkPad E14 G5 i7-1355U | |
| Dell Latitude 7440 | |
| Average of class Subnotebook (358 - 2213, n=61, last 2 years) | |
| Acer TravelMate P4 TMP414-53-58XQ | |
| Acer TravelMate P4 TMP414-53-58XQ | |
| HP ProBook 440 G9-5Y3Z3EA | |
| Average Intel Core i5-1335U (1532 - 1733, n=12) | |
| Lenovo ThinkPad E14 G5-21JSS05C00 | |
| HP ProBook 445 G10 | |
| Fujitsu LifeBook E5412A E542AMHAAMDE | |
| Cinebench R20 / CPU (Multi Core) | |
| Average of class Subnotebook (579 - 8541, n=57, last 2 years) | |
| Lenovo ThinkPad E14 G5-21JSS05C00 | |
| Dell Latitude 7440 | |
| Acer TravelMate P4 TMP414-53-58XQ | |
| Average Intel Core i5-1335U (2602 - 3849, n=11) | |
| HP ProBook 445 G10 | |
| Lenovo ThinkPad E14 G5 i7-1355U | |
| HP ProBook 440 G9-5Y3Z3EA | |
| Fujitsu LifeBook E5412A E542AMHAAMDE | |
| Cinebench R20 / CPU (Single Core) | |
| Lenovo ThinkPad E14 G5 i7-1355U | |
| Average of class Subnotebook (128 - 832, n=57, last 2 years) | |
| Dell Latitude 7440 | |
| HP ProBook 440 G9-5Y3Z3EA | |
| Acer TravelMate P4 TMP414-53-58XQ | |
| Average Intel Core i5-1335U (593 - 663, n=11) | |
| Lenovo ThinkPad E14 G5-21JSS05C00 | |
| HP ProBook 445 G10 | |
| Fujitsu LifeBook E5412A E542AMHAAMDE | |
| Cinebench R15 / CPU Multi 64Bit | |
| Average of class Subnotebook (327 - 3345, n=57, last 2 years) | |
| Lenovo ThinkPad E14 G5-21JSS05C00 | |
| Dell Latitude 7440 | |
| Lenovo ThinkPad E14 G5 i7-1355U | |
| Average Intel Core i5-1335U (1109 - 1547, n=11) | |
| HP ProBook 440 G9-5Y3Z3EA | |
| HP ProBook 445 G10 | |
| Fujitsu LifeBook E5412A E542AMHAAMDE | |
| Acer TravelMate P4 TMP414-53-58XQ | |
| Cinebench R15 / CPU Single 64Bit | |
| Average of class Subnotebook (72.4 - 322, n=57, last 2 years) | |
| Lenovo ThinkPad E14 G5 i7-1355U | |
| Dell Latitude 7440 | |
| Acer TravelMate P4 TMP414-53-58XQ | |
| HP ProBook 440 G9-5Y3Z3EA | |
| HP ProBook 440 G9-5Y3Z3EA | |
| Average Intel Core i5-1335U (222 - 248, n=11) | |
| HP ProBook 445 G10 | |
| Lenovo ThinkPad E14 G5-21JSS05C00 | |
| Fujitsu LifeBook E5412A E542AMHAAMDE | |
| Blender / v2.79 BMW27 CPU | |
| Lenovo ThinkPad E14 G5 i7-1355U | |
| Average Intel Core i5-1335U (340 - 786, n=12) | |
| HP ProBook 440 G9-5Y3Z3EA | |
| Fujitsu LifeBook E5412A E542AMHAAMDE | |
| HP ProBook 445 G10 | |
| Average of class Subnotebook (159 - 2271, n=58, last 2 years) | |
| Acer TravelMate P4 TMP414-53-58XQ | |
| Dell Latitude 7440 | |
| Lenovo ThinkPad E14 G5-21JSS05C00 | |
| 7-Zip 18.03 / 7z b 4 | |
| Lenovo ThinkPad E14 G5-21JSS05C00 | |
| Average of class Subnotebook (11668 - 77867, n=57, last 2 years) | |
| Dell Latitude 7440 | |
| HP ProBook 445 G10 | |
| Fujitsu LifeBook E5412A E542AMHAAMDE | |
| Acer TravelMate P4 TMP414-53-58XQ | |
| Average Intel Core i5-1335U (25012 - 38513, n=11) | |
| Lenovo ThinkPad E14 G5 i7-1355U | |
| HP ProBook 440 G9-5Y3Z3EA | |
| 7-Zip 18.03 / 7z b 4 -mmt1 | |
| Lenovo ThinkPad E14 G5 i7-1355U | |
| Average of class Subnotebook (2643 - 6699, n=59, last 2 years) | |
| Acer TravelMate P4 TMP414-53-58XQ | |
| HP ProBook 445 G10 | |
| Lenovo ThinkPad E14 G5-21JSS05C00 | |
| Dell Latitude 7440 | |
| HP ProBook 440 G9-5Y3Z3EA | |
| Average Intel Core i5-1335U (4872 - 5545, n=11) | |
| Fujitsu LifeBook E5412A E542AMHAAMDE | |
| Geekbench 5.5 / Multi-Core | |
| Average of class Subnotebook (2557 - 17218, n=48, last 2 years) | |
| Dell Latitude 7440 | |
| Lenovo ThinkPad E14 G5 i7-1355U | |
| Average Intel Core i5-1335U (5459 - 8618, n=11) | |
| Lenovo ThinkPad E14 G5-21JSS05C00 | |
| Acer TravelMate P4 TMP414-53-58XQ | |
| HP ProBook 440 G9-5Y3Z3EA | |
| Fujitsu LifeBook E5412A E542AMHAAMDE | |
| HP ProBook 445 G10 | |
| Geekbench 5.5 / Single-Core | |
| Average of class Subnotebook (726 - 2224, n=48, last 2 years) | |
| Lenovo ThinkPad E14 G5 i7-1355U | |
| Dell Latitude 7440 | |
| Average Intel Core i5-1335U (1506 - 1700, n=11) | |
| Acer TravelMate P4 TMP414-53-58XQ | |
| HP ProBook 440 G9-5Y3Z3EA | |
| Lenovo ThinkPad E14 G5-21JSS05C00 | |
| HP ProBook 445 G10 | |
| Fujitsu LifeBook E5412A E542AMHAAMDE | |
| HWBOT x265 Benchmark v2.2 / 4k Preset | |
| Average of class Subnotebook (0.97 - 25.1, n=57, last 2 years) | |
| Lenovo ThinkPad E14 G5-21JSS05C00 | |
| Dell Latitude 7440 | |
| Fujitsu LifeBook E5412A E542AMHAAMDE | |
| HP ProBook 445 G10 | |
| Acer TravelMate P4 TMP414-53-58XQ | |
| Average Intel Core i5-1335U (6.55 - 10.7, n=11) | |
| HP ProBook 440 G9-5Y3Z3EA | |
| Lenovo ThinkPad E14 G5 i7-1355U | |
| LibreOffice / 20 Documents To PDF | |
| Lenovo ThinkPad E14 G5 i7-1355U | |
| Fujitsu LifeBook E5412A E542AMHAAMDE | |
| Average of class Subnotebook (39.9 - 220, n=56, last 2 years) | |
| Acer TravelMate P4 TMP414-53-58XQ | |
| HP ProBook 445 G10 | |
| HP ProBook 440 G9-5Y3Z3EA | |
| Average Intel Core i5-1335U (45 - 58.7, n=11) | |
| Lenovo ThinkPad E14 G5-21JSS05C00 | |
| Dell Latitude 7440 | |
| R Benchmark 2.5 / Overall mean | |
| Lenovo ThinkPad E14 G5 i7-1355U | |
| Fujitsu LifeBook E5412A E542AMHAAMDE | |
| HP ProBook 445 G10 | |
| Average of class Subnotebook (0.4024 - 1.456, n=58, last 2 years) | |
| Lenovo ThinkPad E14 G5-21JSS05C00 | |
| Acer TravelMate P4 TMP414-53-58XQ | |
| HP ProBook 440 G9-5Y3Z3EA | |
| Average Intel Core i5-1335U (0.4892 - 0.524, n=10) | |
| Dell Latitude 7440 | |
* ... smaller is better
AIDA64: FP32 Ray-Trace | FPU Julia | CPU SHA3 | CPU Queen | FPU SinJulia | FPU Mandel | CPU AES | CPU ZLib | FP64 Ray-Trace | CPU PhotoWorxx
| Performance rating | |
| Average of class Subnotebook | |
| Lenovo ThinkPad E14 G5-21JSS05C00 | |
| Dell Latitude 7440 | |
| HP ProBook 445 G10 | |
| Fujitsu LifeBook E5412A E542AMHAAMDE | |
| Acer TravelMate P4 TMP414-53-58XQ | |
| Average Intel Core i5-1335U | |
| Lenovo ThinkPad E14 G5 i7-1355U | |
| HP ProBook 440 G9-5Y3Z3EA | |
| AIDA64 / FP32 Ray-Trace | |
| Average of class Subnotebook (1135 - 32888, n=58, last 2 years) | |
| Lenovo ThinkPad E14 G5-21JSS05C00 | |
| HP ProBook 445 G10 | |
| Fujitsu LifeBook E5412A E542AMHAAMDE | |
| Dell Latitude 7440 | |
| Acer TravelMate P4 TMP414-53-58XQ | |
| Average Intel Core i5-1335U (5661 - 7809, n=11) | |
| HP ProBook 440 G9-5Y3Z3EA | |
| Lenovo ThinkPad E14 G5 i7-1355U | |
| AIDA64 / FPU Julia | |
| Lenovo ThinkPad E14 G5-21JSS05C00 | |
| Average of class Subnotebook (5218 - 123315, n=58, last 2 years) | |
| HP ProBook 445 G10 | |
| Fujitsu LifeBook E5412A E542AMHAAMDE | |
| Dell Latitude 7440 | |
| Acer TravelMate P4 TMP414-53-58XQ | |
| Average Intel Core i5-1335U (29483 - 43636, n=11) | |
| HP ProBook 440 G9-5Y3Z3EA | |
| Lenovo ThinkPad E14 G5 i7-1355U | |
| AIDA64 / CPU SHA3 | |
| Average of class Subnotebook (444 - 5287, n=58, last 2 years) | |
| Lenovo ThinkPad E14 G5-21JSS05C00 | |
| Dell Latitude 7440 | |
| Acer TravelMate P4 TMP414-53-58XQ | |
| HP ProBook 445 G10 | |
| Fujitsu LifeBook E5412A E542AMHAAMDE | |
| Average Intel Core i5-1335U (1515 - 2278, n=11) | |
| HP ProBook 440 G9-5Y3Z3EA | |
| Lenovo ThinkPad E14 G5 i7-1355U | |
| AIDA64 / CPU Queen | |
| Lenovo ThinkPad E14 G5-21JSS05C00 | |
| HP ProBook 445 G10 | |
| Fujitsu LifeBook E5412A E542AMHAAMDE | |
| Lenovo ThinkPad E14 G5 i7-1355U | |
| HP ProBook 440 G9-5Y3Z3EA | |
| Dell Latitude 7440 | |
| Average of class Subnotebook (10579 - 95002, n=49, last 2 years) | |
| Acer TravelMate P4 TMP414-53-58XQ | |
| Average Intel Core i5-1335U (53839 - 60992, n=11) | |
| AIDA64 / FPU SinJulia | |
| Lenovo ThinkPad E14 G5-21JSS05C00 | |
| HP ProBook 445 G10 | |
| Fujitsu LifeBook E5412A E542AMHAAMDE | |
| Average of class Subnotebook (744 - 18418, n=58, last 2 years) | |
| Dell Latitude 7440 | |
| Acer TravelMate P4 TMP414-53-58XQ | |
| Lenovo ThinkPad E14 G5 i7-1355U | |
| Average Intel Core i5-1335U (3873 - 5008, n=11) | |
| HP ProBook 440 G9-5Y3Z3EA | |
| AIDA64 / FPU Mandel | |
| Lenovo ThinkPad E14 G5-21JSS05C00 | |
| Average of class Subnotebook (3341 - 65433, n=58, last 2 years) | |
| HP ProBook 445 G10 | |
| Fujitsu LifeBook E5412A E542AMHAAMDE | |
| Dell Latitude 7440 | |
| Acer TravelMate P4 TMP414-53-58XQ | |
| Average Intel Core i5-1335U (14376 - 20553, n=11) | |
| HP ProBook 440 G9-5Y3Z3EA | |
| Lenovo ThinkPad E14 G5 i7-1355U | |
| AIDA64 / CPU AES | |
| Average of class Subnotebook (638 - 96917, n=58, last 2 years) | |
| Lenovo ThinkPad E14 G5-21JSS05C00 | |
| Dell Latitude 7440 | |
| Acer TravelMate P4 TMP414-53-58XQ | |
| Average Intel Core i5-1335U (31154 - 65997, n=11) | |
| Lenovo ThinkPad E14 G5 i7-1355U | |
| HP ProBook 440 G9-5Y3Z3EA | |
| HP ProBook 445 G10 | |
| Fujitsu LifeBook E5412A E542AMHAAMDE | |
| AIDA64 / CPU ZLib | |
| Average of class Subnotebook (164.9 - 1379, n=58, last 2 years) | |
| Lenovo ThinkPad E14 G5-21JSS05C00 | |
| Dell Latitude 7440 | |
| Acer TravelMate P4 TMP414-53-58XQ | |
| Average Intel Core i5-1335U (378 - 676, n=11) | |
| Lenovo ThinkPad E14 G5 i7-1355U | |
| HP ProBook 445 G10 | |
| Fujitsu LifeBook E5412A E542AMHAAMDE | |
| HP ProBook 440 G9-5Y3Z3EA | |
| AIDA64 / FP64 Ray-Trace | |
| Average of class Subnotebook (610 - 17495, n=58, last 2 years) | |
| Lenovo ThinkPad E14 G5-21JSS05C00 | |
| HP ProBook 445 G10 | |
| Fujitsu LifeBook E5412A E542AMHAAMDE | |
| Dell Latitude 7440 | |
| Acer TravelMate P4 TMP414-53-58XQ | |
| HP ProBook 440 G9-5Y3Z3EA | |
| Average Intel Core i5-1335U (2878 - 4214, n=11) | |
| Lenovo ThinkPad E14 G5 i7-1355U | |
| AIDA64 / CPU PhotoWorxx | |
| Average of class Subnotebook (6569 - 85600, n=58, last 2 years) | |
| Dell Latitude 7440 | |
| Average Intel Core i5-1335U (13584 - 41123, n=11) | |
| Lenovo ThinkPad E14 G5 i7-1355U | |
| Acer TravelMate P4 TMP414-53-58XQ | |
| Fujitsu LifeBook E5412A E542AMHAAMDE | |
| HP ProBook 440 G9-5Y3Z3EA | |
| Lenovo ThinkPad E14 G5-21JSS05C00 | |
| HP ProBook 445 G10 | |
系统性能
PCMark 10 和 Crossmark 基准测试评估笔记本电脑的应用性能,测试固态硬盘存储、内存、iGPU 和处理器的组合。我们的 TravelMate P4 在这里排名垫底,甚至低于次级笔记本的平均水平。不过,在实际使用 Word、Excel 和浏览器应用程序时,这些差异是否明显值得怀疑,因为即使在 PCMark 10 中表现最好的联想 ThinkPad E14 G5也只有 8%的优势(Crossmark 为 13%)。
CrossMark: Overall | Productivity | Creativity | Responsiveness
Mozilla Kraken 1.1: Total
| PCMark 10 / Score | |
| Average of class Subnotebook (4920 - 9939, n=45, last 2 years) | |
| Lenovo ThinkPad E14 G5-21JSS05C00 | |
| Lenovo ThinkPad E14 G5 i7-1355U | |
| HP ProBook 445 G10 | |
| Fujitsu LifeBook E5412A E542AMHAAMDE | |
| Dell Latitude 7440 | |
| Acer TravelMate P4 TMP414-53-58XQ | |
| HP ProBook 440 G9-5Y3Z3EA | |
| Average Intel Core i5-1335U, Intel Iris Xe Graphics G7 80EUs (5068 - 5600, n=11) | |
| PCMark 10 / Essentials | |
| Lenovo ThinkPad E14 G5 i7-1355U | |
| Dell Latitude 7440 | |
| Acer TravelMate P4 TMP414-53-58XQ | |
| Lenovo ThinkPad E14 G5-21JSS05C00 | |
| Average Intel Core i5-1335U, Intel Iris Xe Graphics G7 80EUs (9828 - 11912, n=11) | |
| Average of class Subnotebook (8552 - 11646, n=45, last 2 years) | |
| HP ProBook 445 G10 | |
| HP ProBook 440 G9-5Y3Z3EA | |
| Fujitsu LifeBook E5412A E542AMHAAMDE | |
| PCMark 10 / Productivity | |
| Average of class Subnotebook (5435 - 16606, n=45, last 2 years) | |
| HP ProBook 445 G10 | |
| Lenovo ThinkPad E14 G5-21JSS05C00 | |
| Fujitsu LifeBook E5412A E542AMHAAMDE | |
| Lenovo ThinkPad E14 G5 i7-1355U | |
| Acer TravelMate P4 TMP414-53-58XQ | |
| HP ProBook 440 G9-5Y3Z3EA | |
| Dell Latitude 7440 | |
| Average Intel Core i5-1335U, Intel Iris Xe Graphics G7 80EUs (6196 - 7261, n=11) | |
| PCMark 10 / Digital Content Creation | |
| Average of class Subnotebook (5722 - 13779, n=45, last 2 years) | |
| Lenovo ThinkPad E14 G5 i7-1355U | |
| Lenovo ThinkPad E14 G5-21JSS05C00 | |
| Dell Latitude 7440 | |
| HP ProBook 440 G9-5Y3Z3EA | |
| Acer TravelMate P4 TMP414-53-58XQ | |
| Average Intel Core i5-1335U, Intel Iris Xe Graphics G7 80EUs (5361 - 6164, n=11) | |
| Fujitsu LifeBook E5412A E542AMHAAMDE | |
| HP ProBook 445 G10 | |
| CrossMark / Overall | |
| Average of class Subnotebook (365 - 2356, n=60, last 2 years) | |
| Lenovo ThinkPad E14 G5 i7-1355U | |
| Average Intel Core i5-1335U, Intel Iris Xe Graphics G7 80EUs (1339 - 1599, n=11) | |
| Acer TravelMate P4 TMP414-53-58XQ | |
| HP ProBook 440 G9-5Y3Z3EA | |
| Lenovo ThinkPad E14 G5-21JSS05C00 | |
| Fujitsu LifeBook E5412A E542AMHAAMDE | |
| CrossMark / Productivity | |
| Average of class Subnotebook (364 - 2277, n=60, last 2 years) | |
| Lenovo ThinkPad E14 G5 i7-1355U | |
| Average Intel Core i5-1335U, Intel Iris Xe Graphics G7 80EUs (1337 - 1638, n=11) | |
| Acer TravelMate P4 TMP414-53-58XQ | |
| HP ProBook 440 G9-5Y3Z3EA | |
| Lenovo ThinkPad E14 G5-21JSS05C00 | |
| Fujitsu LifeBook E5412A E542AMHAAMDE | |
| CrossMark / Creativity | |
| Average of class Subnotebook (372 - 2743, n=60, last 2 years) | |
| Lenovo ThinkPad E14 G5 i7-1355U | |
| Average Intel Core i5-1335U, Intel Iris Xe Graphics G7 80EUs (1315 - 1620, n=11) | |
| HP ProBook 440 G9-5Y3Z3EA | |
| Lenovo ThinkPad E14 G5-21JSS05C00 | |
| Acer TravelMate P4 TMP414-53-58XQ | |
| Fujitsu LifeBook E5412A E542AMHAAMDE | |
| CrossMark / Responsiveness | |
| Average of class Subnotebook (312 - 1854, n=60, last 2 years) | |
| Lenovo ThinkPad E14 G5 i7-1355U | |
| Average Intel Core i5-1335U, Intel Iris Xe Graphics G7 80EUs (1023 - 1868, n=11) | |
| Acer TravelMate P4 TMP414-53-58XQ | |
| HP ProBook 440 G9-5Y3Z3EA | |
| Lenovo ThinkPad E14 G5-21JSS05C00 | |
| Fujitsu LifeBook E5412A E542AMHAAMDE | |
| Mozilla Kraken 1.1 / Total | |
| Lenovo ThinkPad E14 G5 i7-1355U | |
| Average Intel Core i5-1335U, Intel Iris Xe Graphics G7 80EUs (545 - 1914, n=12) | |
| Fujitsu LifeBook E5412A E542AMHAAMDE | |
| HP ProBook 440 G9-5Y3Z3EA | |
| Lenovo ThinkPad E14 G5-21JSS05C00 | |
| Acer TravelMate P4 TMP414-53-58XQ | |
| Dell Latitude 7440 | |
| Average of class Subnotebook (234 - 1104, n=61, last 2 years) | |
* ... smaller is better
| PCMark 10 Score | 5486 points | |
Help | ||
| AIDA64 / Memory Copy | |
| Average of class Subnotebook (14554 - 131023, n=58, last 2 years) | |
| Dell Latitude 7440 | |
| Average Intel Core i5-1335U (22417 - 60884, n=11) | |
| Lenovo ThinkPad E14 G5 i7-1355U | |
| Lenovo ThinkPad E14 G5-21JSS05C00 | |
| Fujitsu LifeBook E5412A E542AMHAAMDE | |
| HP ProBook 440 G9-5Y3Z3EA | |
| Acer TravelMate P4 TMP414-53-58XQ | |
| HP ProBook 445 G10 | |
| AIDA64 / Memory Read | |
| Average of class Subnotebook (15948 - 127174, n=58, last 2 years) | |
| Dell Latitude 7440 | |
| Average Intel Core i5-1335U (23104 - 61555, n=11) | |
| Fujitsu LifeBook E5412A E542AMHAAMDE | |
| Lenovo ThinkPad E14 G5-21JSS05C00 | |
| Lenovo ThinkPad E14 G5 i7-1355U | |
| HP ProBook 445 G10 | |
| Acer TravelMate P4 TMP414-53-58XQ | |
| HP ProBook 440 G9-5Y3Z3EA | |
| AIDA64 / Memory Write | |
| Average of class Subnotebook (15709 - 135141, n=58, last 2 years) | |
| Dell Latitude 7440 | |
| Average Intel Core i5-1335U (22936 - 72584, n=11) | |
| Lenovo ThinkPad E14 G5 i7-1355U | |
| Fujitsu LifeBook E5412A E542AMHAAMDE | |
| Lenovo ThinkPad E14 G5-21JSS05C00 | |
| HP ProBook 445 G10 | |
| Acer TravelMate P4 TMP414-53-58XQ | |
| HP ProBook 440 G9-5Y3Z3EA | |
| AIDA64 / Memory Latency | |
| Dell Latitude 7440 | |
| Fujitsu LifeBook E5412A E542AMHAAMDE | |
| Average of class Subnotebook (6.1 - 159.9, n=56, last 2 years) | |
| Average Intel Core i5-1335U (78.6 - 112.8, n=11) | |
| Lenovo ThinkPad E14 G5-21JSS05C00 | |
| HP ProBook 445 G10 | |
| Lenovo ThinkPad E14 G5 i7-1355U | |
| HP ProBook 440 G9-5Y3Z3EA | |
| Acer TravelMate P4 TMP414-53-58XQ | |
* ... smaller is better
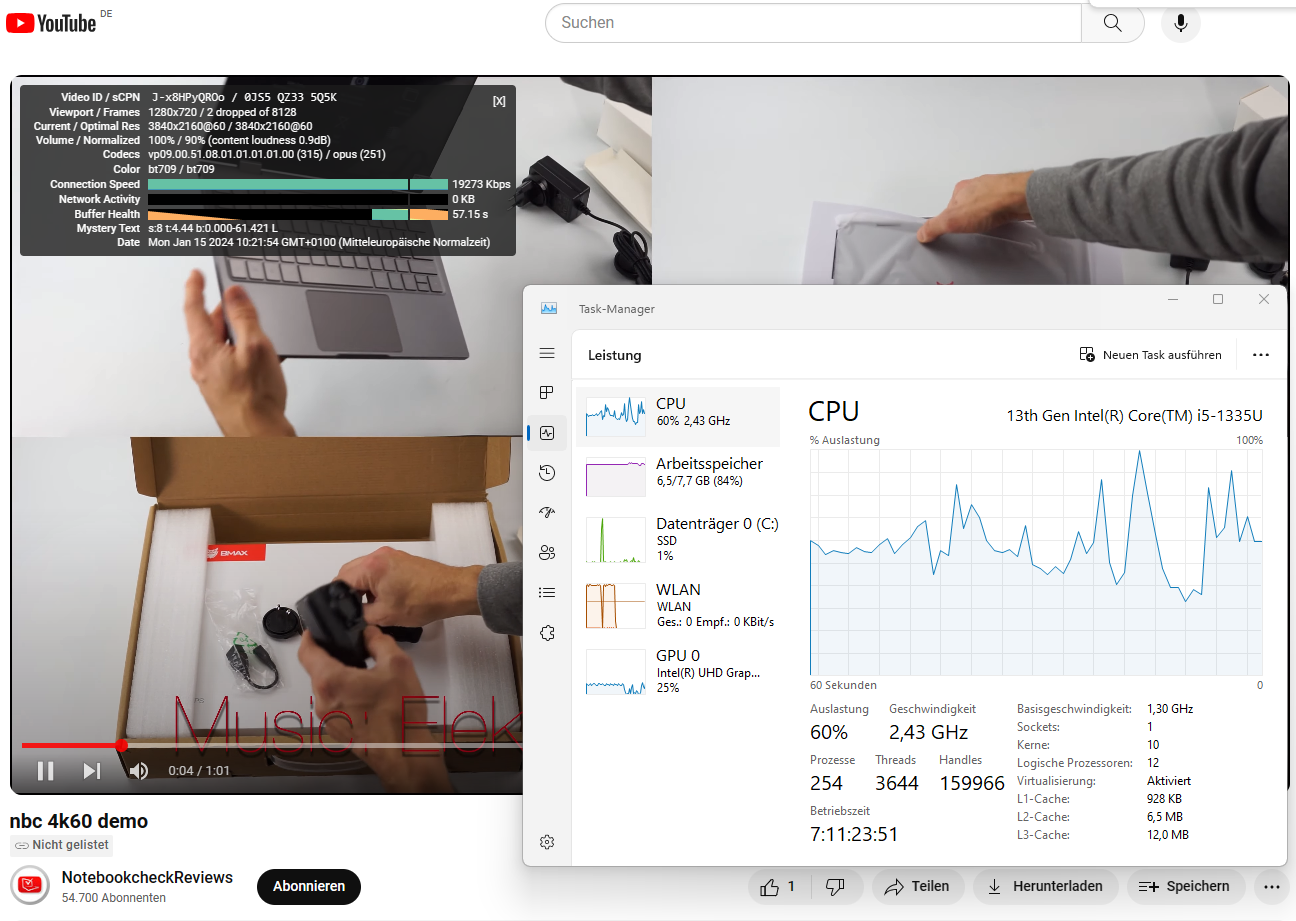
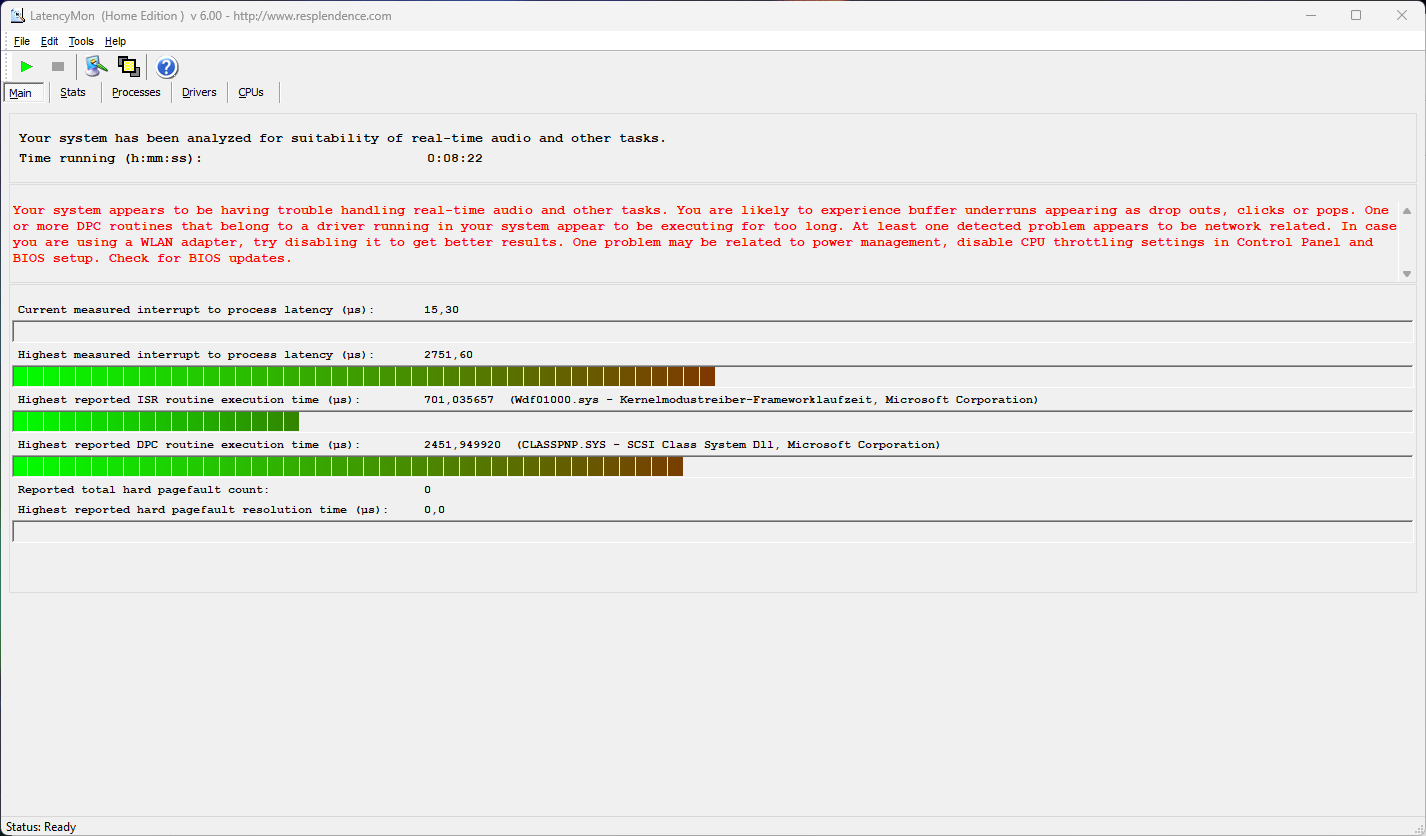
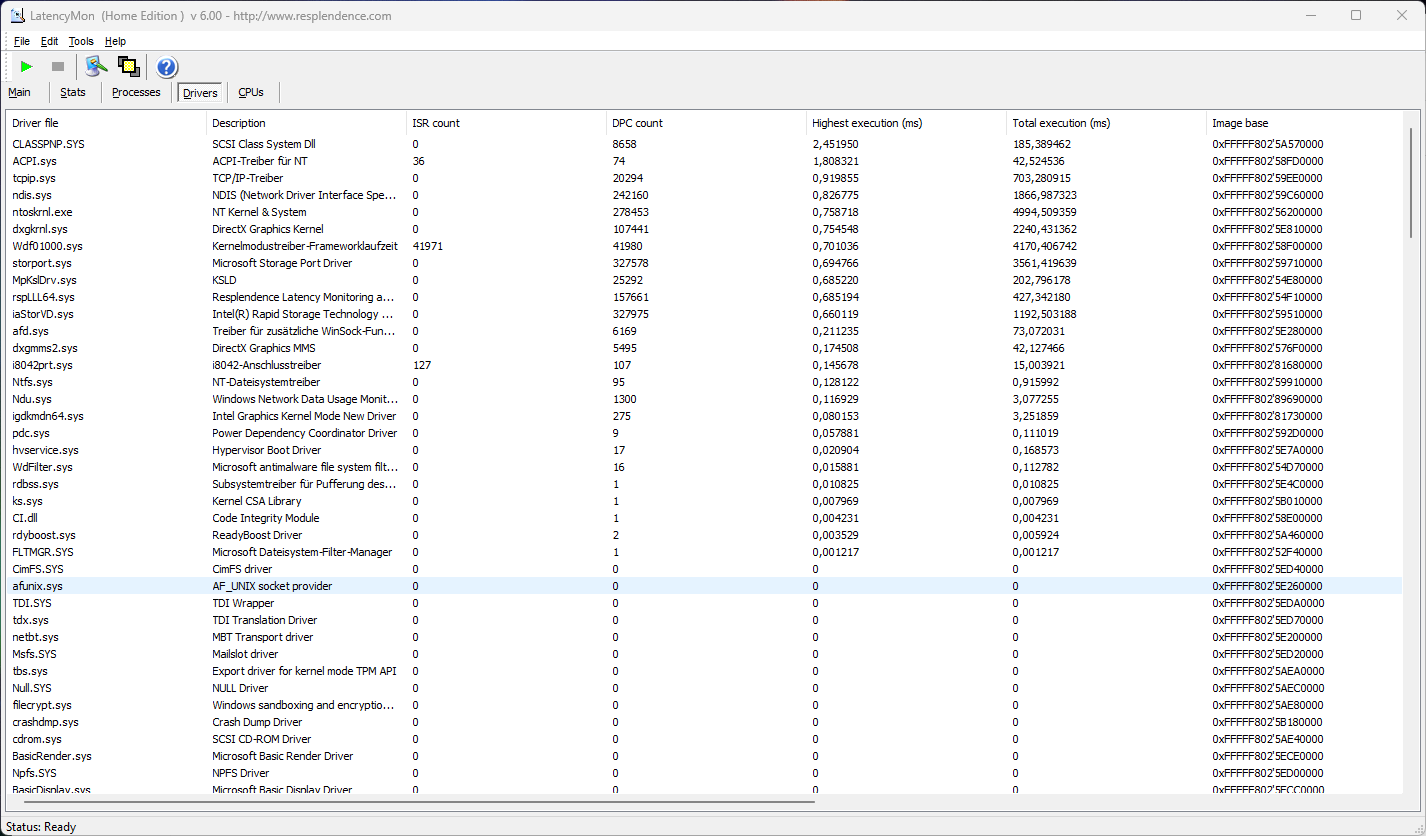
DPC 延迟
延迟是指系统处理驱动程序任务所需的时间。它们涉及音频、触摸板、固态硬盘、读卡器或存储控制器等各种设备之间的合作。如果我们测量的是高延迟,那么它们就是次优或故障设备驱动程序的表现形式或时间快照。更新(包括 BIOS 更新)可以弥补延迟。在音频制作过程中,高 DPC 延迟会导致音频卡顿或延迟。当我们打开大型网站和播放 4K YouTube 视频时,TravelMate 会显示出相当高的延迟,继而对 CPU 造成压力。
| DPC Latencies / LatencyMon - interrupt to process latency (max), Web, Youtube, Prime95 | |
| Acer TravelMate P4 TMP414-53-58XQ | |
| HP ProBook 440 G9-5Y3Z3EA | |
| Fujitsu LifeBook E5412A E542AMHAAMDE | |
| HP ProBook 445 G10 | |
| Lenovo ThinkPad E14 G5-21JSS05C00 | |
| Lenovo ThinkPad E14 G5 i7-1355U | |
| Dell Latitude 7440 | |
* ... smaller is better
存储解决方案
金士顿固态硬盘无法与三星和西部数据的众多竞争对手抗衡,仍然只能处于中下游水平。通常情况下,随着时间的推移,恒定性能会明显下降。其他型号也是如此,但金士顿的起始水平也低于 WD PC SN740 在 ThinkPad E14 G5为例。

* ... smaller is better
Disk Throttling: DiskSpd Read Loop, Queue Depth 8
图形卡
集成的 英特尔-Xe集成的 Intel-Xe 图形处理器只有区区 80 个 EU,是目前笔记本电脑中体积最小、功能最弱的 iGPU 之一。但这并不意味着它本身就很差,因为在播放 YouTube 视频或浏览器游戏时,它只需完成解码任务即可。
| 3DMark 11 Performance | 5149 points | |
| 3DMark Cloud Gate Standard Score | 16881 points | |
| 3DMark Fire Strike Score | 2655 points | |
| 3DMark Time Spy Score | 1139 points | |
Help | ||
* ... smaller is better
游戏性能
由于英特尔 Xe 并非为游戏而生,因此它在所有旧版测试游戏中的表现都不尽如人意。2023 年的最新游戏更是如此,如《全面战争法老王》(Total War Pharao),它只能在低预设值和全高清分辨率下运行。在电池工作状态下,3D 性能不会下降,浏览器游戏也无需担心。
| Performance rating - Percent | |
| Average of class Subnotebook | |
| Dell Latitude 7440 -2! | |
| Lenovo ThinkPad E14 G5-21JSS05C00 -3! | |
| Lenovo ThinkPad E14 G5 i7-1355U -2! | |
| Fujitsu LifeBook E5412A E542AMHAAMDE -2! | |
| HP EliteBook 845 G9 6F6H9EA -2! | |
| Acer TravelMate P4 TMP414-53-58XQ | |
| HP ProBook 440 G9-5Y3Z3EA -6! | |
| HP ProBook 445 G10 -2! | |
| Total War Pharaoh | |
| 1920x1080 Medium Preset | |
| Average of class Subnotebook (36.4 - 113, n=10, last 2 years) | |
| Acer TravelMate P4 TMP414-53-58XQ | |
| 1920x1080 Low Preset | |
| Average of class Subnotebook (46.1 - 159.5, n=11, last 2 years) | |
| Acer TravelMate P4 TMP414-53-58XQ | |
Witcher 3 的测试运行速度非常低(8-9 帧/秒)。虽然配备 AMD Vega iGPU 的竞争对手表现稍好一些,但也远远达不到可玩的数值。我们在商用笔记本电脑中添加了目前最强大的集成显卡之一(HP EliteBook 845 G 6.5 英寸)。HP EliteBook 845 G9 6F6H9EA)的综合评分:而不是 70 分的性能评分。 AMD Radeon 660M也只得到 67 分。总之,这样的 AMD iGPU 可以在某些游戏中有所作为,但其平均性能并不一定比英特尔 Xe 好。
The Witcher 3 FPS Chart
| low | med. | high | ultra | |
|---|---|---|---|---|
| GTA V (2015) | 86 | 70 | 13.8 | |
| The Witcher 3 (2015) | 49.9 | 33.4 | 11.2 | 8.5 |
| Dota 2 Reborn (2015) | 98.6 | 70.2 | 37.6 | 34.7 |
| Assassin´s Creed Origins (2017) | 32 | 17 | 11 | |
| Final Fantasy XV Benchmark (2018) | 42 | 22 | 14 | |
| X-Plane 11.11 (2018) | 42.6 | 29.8 | 26.3 | |
| Far Cry 5 (2018) | 41 | 20 | 17 | |
| Strange Brigade (2018) | 48.8 | 19.4 | 17.7 | |
| Total War Pharaoh (2023) | 29.8 | 23.2 | 16.2 |
排放量
噪音排放
单风扇在不产生任何噪音的情况下完成工作:即使周围有一些人声或办公室里的其他日常噪音,也几乎听不到它的声音。但在 "平衡 "模式下,风扇并不能保持完全静音,即使 CPU 负载仅为 3-7%,10 个浏览器标签页也会让风扇持续运转。在 "最佳节能 "模式下,风扇偶尔会关闭,但过不了多久又会重新启动。我们更喜欢风扇持续运转。在负载情况下,风扇转速会升至 36 或 48 dB(A),但这只发生在较长的复制过程或持续的计算任务中。震耳欲聋的 48 分贝(A)更多是我们的压力测试情景下产生的理论可能性。
Noise level
| Idle |
| 25.5 / 25.5 / 30.5 dB(A) |
| Load |
| 36.29 / 48.34 dB(A) |
 | ||
30 dB silent 40 dB(A) audible 50 dB(A) loud |
||
min: | ||
| Acer TravelMate P4 TMP414-53-58XQ Iris Xe G7 80EUs, i5-1335U, Kingston OM8SEP4512Q-AA | Dell Latitude 7440 Iris Xe G7 80EUs, i5-1345U, Samsung MZ9L4512HBLU-00BMV | Lenovo ThinkPad E14 G5-21JSS05C00 Vega 8, R7 7730U, WD PC SN740 SDDPNQD-1T00 | Lenovo ThinkPad E14 G5 i7-1355U Iris Xe G7 96EUs, i7-1355U, WD PC SN740 512GB SDDQMQD-512G | HP ProBook 440 G9-5Y3Z3EA Iris Xe G7 96EUs, i7-1255U, Samsung PM991 MZVLQ512HBLU | HP ProBook 445 G10 Vega 7, R5 7530U, Kioxia BG5 KBG50ZNS512G | Fujitsu LifeBook E5412A E542AMHAAMDE Vega 7, R5 PRO 5675U, WDC PC SN530 SDBQNPZ-512G | |
|---|---|---|---|---|---|---|---|
| Noise | 18% | 9% | 11% | 6% | 10% | 9% | |
| off / environment * (dB) | 25.5 | 22.8 11% | 24.4 4% | 23.2 9% | 27 -6% | 24 6% | 23.6 7% |
| Idle Minimum * (dB) | 25.5 | 22.8 11% | 24.4 4% | 23.2 9% | 27 -6% | 24 6% | 23.6 7% |
| Idle Average * (dB) | 25.5 | 22.8 11% | 24.4 4% | 23.2 9% | 27 -6% | 25 2% | 23.6 7% |
| Idle Maximum * (dB) | 30.5 | 22.8 25% | 25.7 16% | 23.2 24% | 27 11% | 28 8% | 28.7 6% |
| Load Average * (dB) | 36.29 | 26.3 28% | 31.8 12% | 36 1% | 31.5 13% | 33 9% | 36.3 -0% |
| Load Maximum * (dB) | 48.34 | 38.3 21% | 41.2 15% | 41 15% | 34.9 28% | 36 26% | 36.3 25% |
| Witcher 3 ultra * (dB) | 30 | 36.7 | 38.5 | 36 | 36.3 |
* ... smaller is better
温度
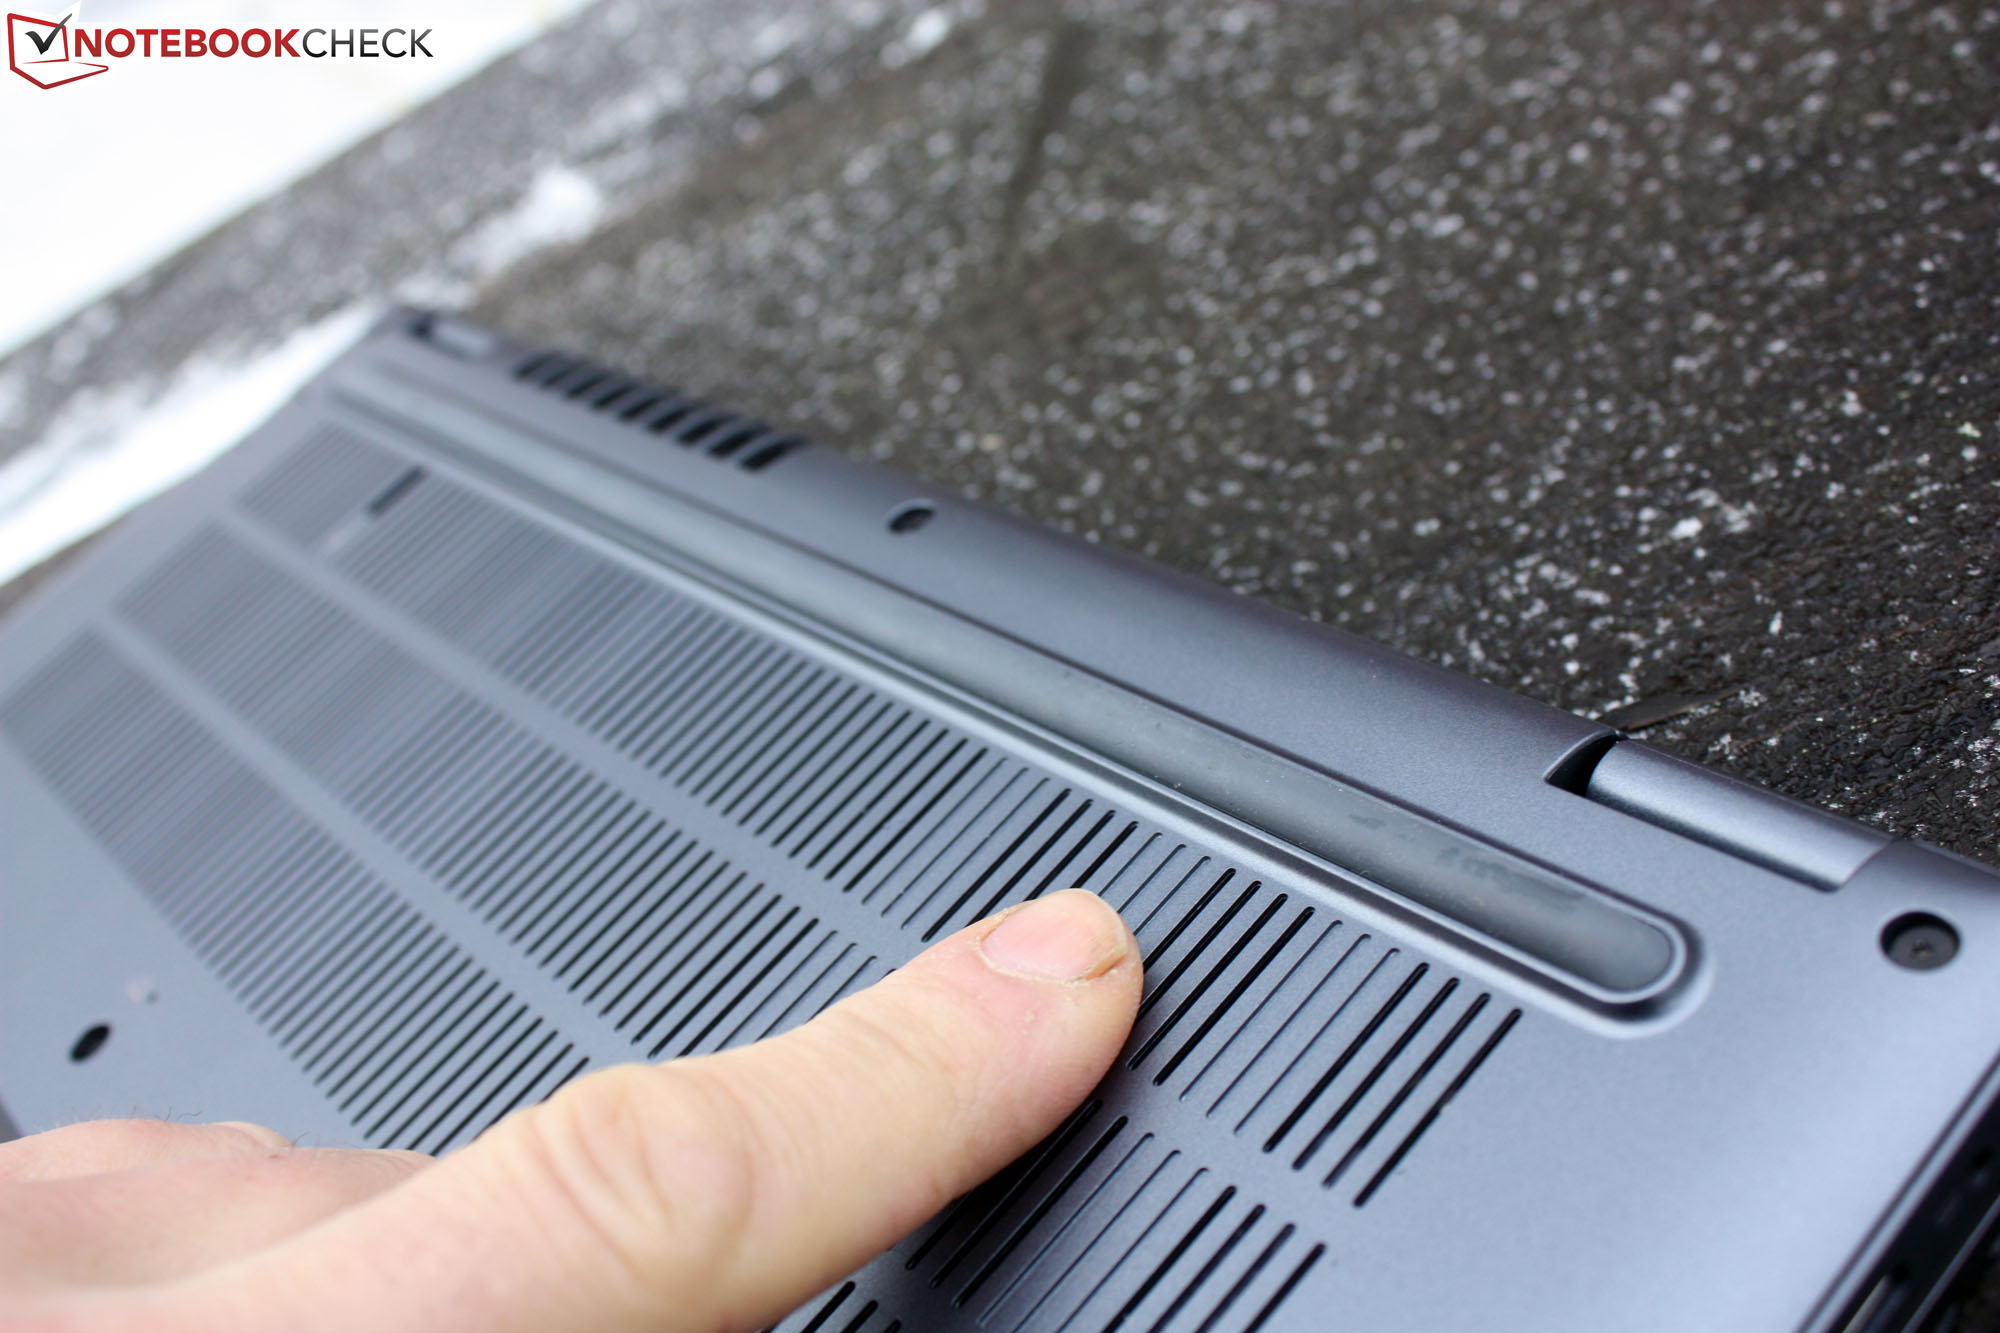
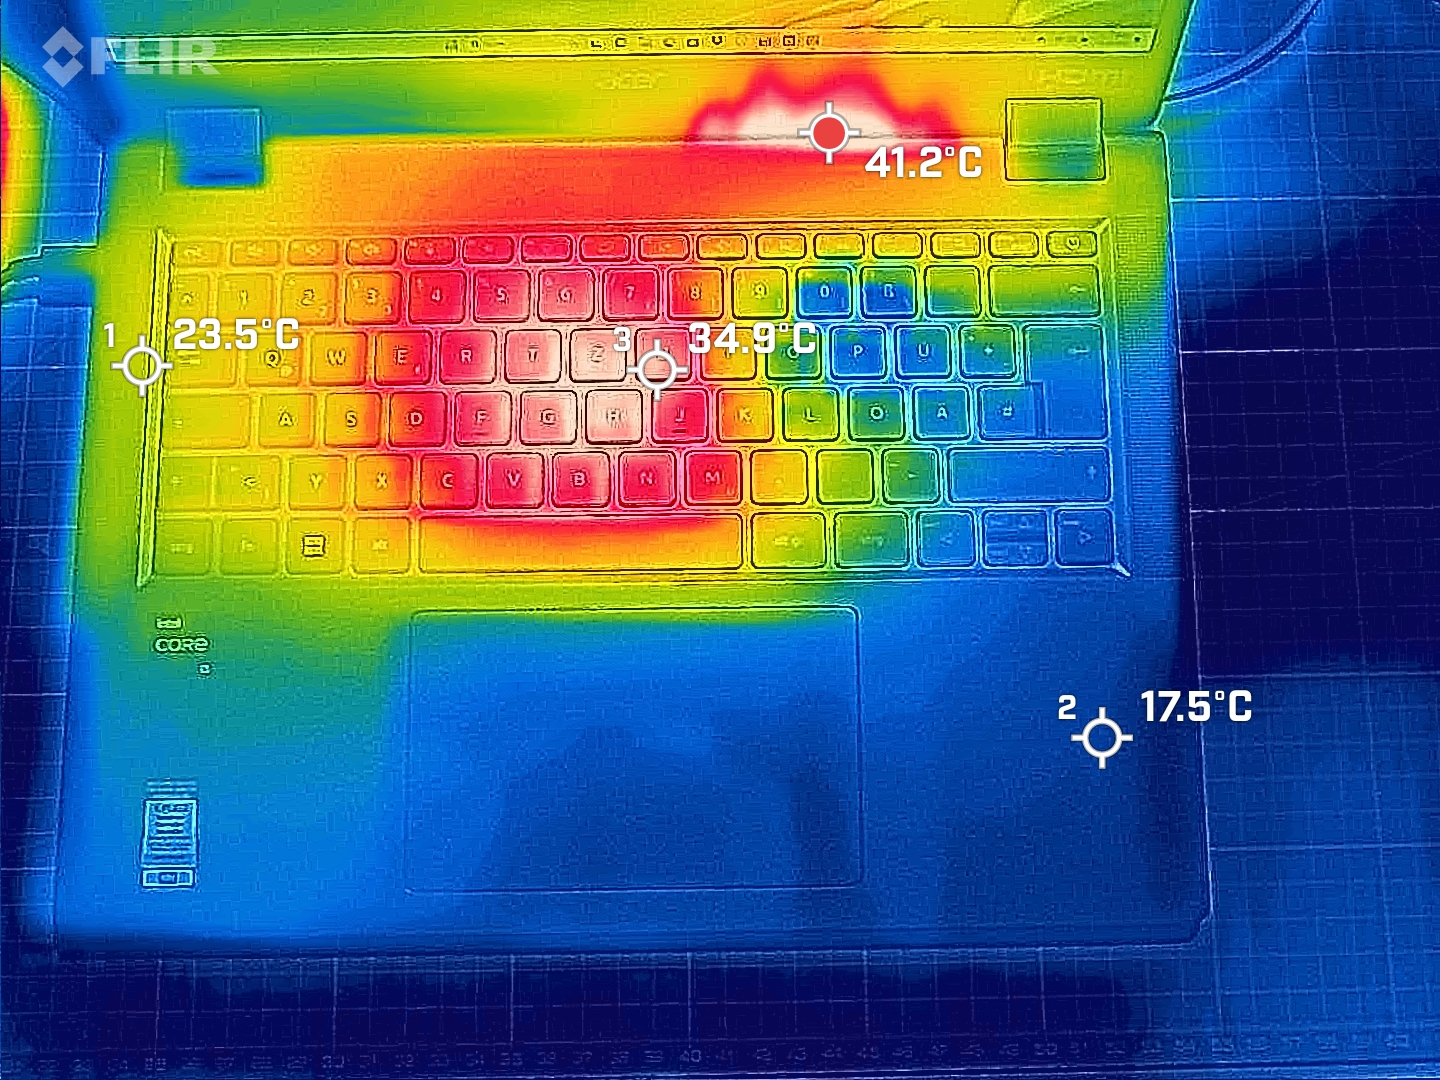
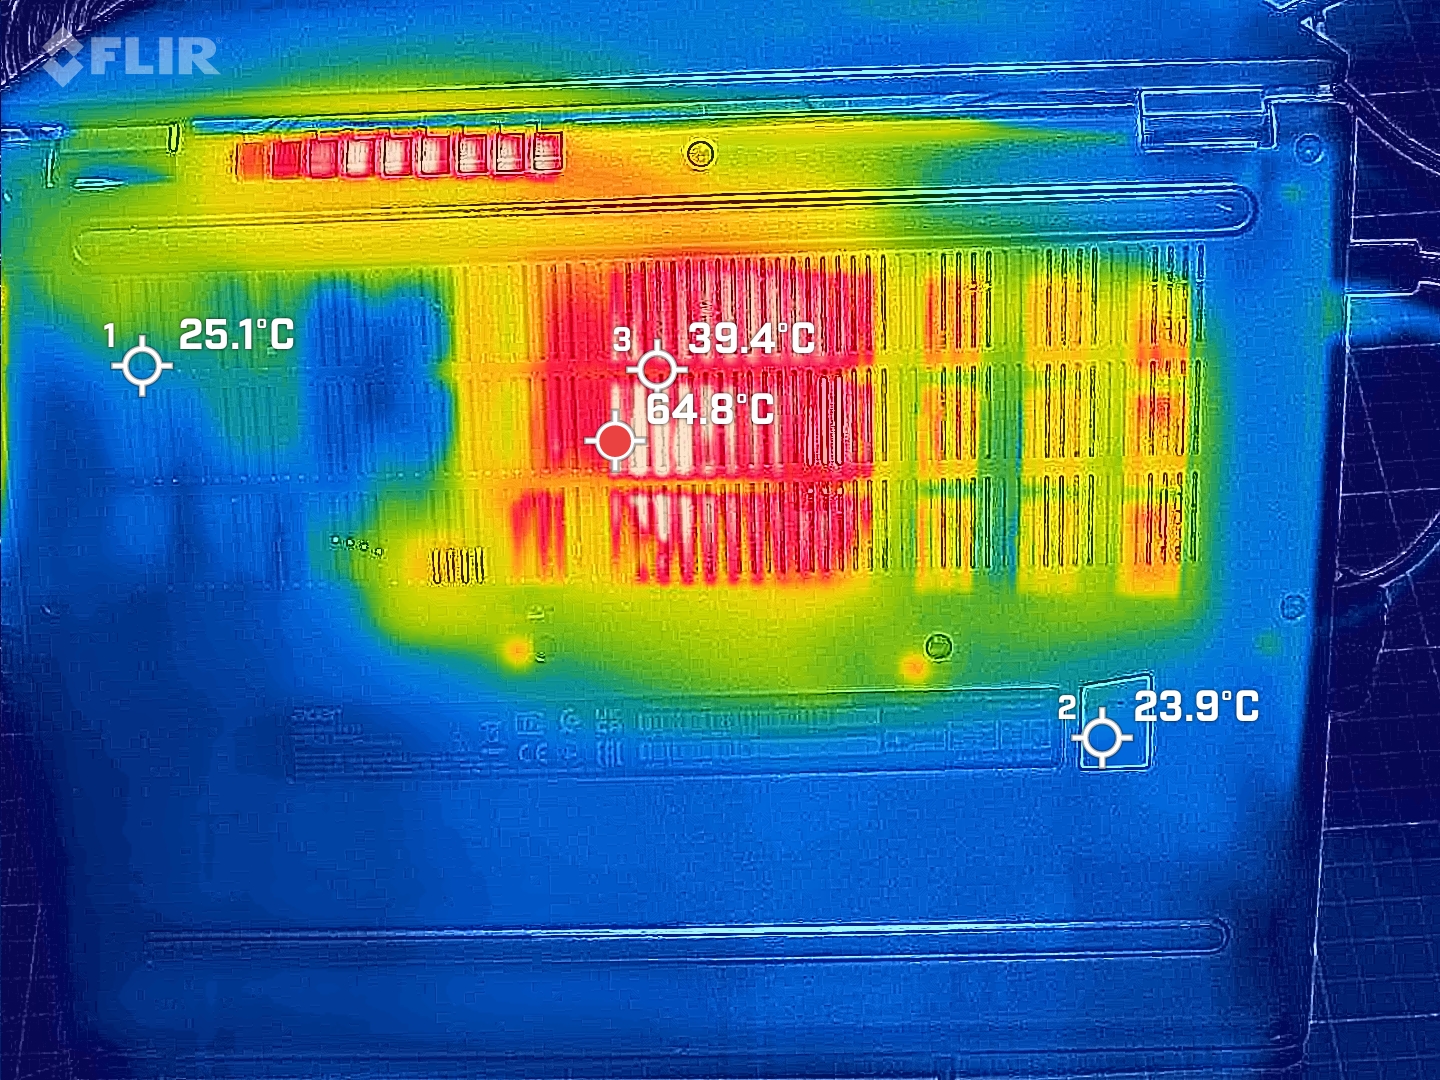
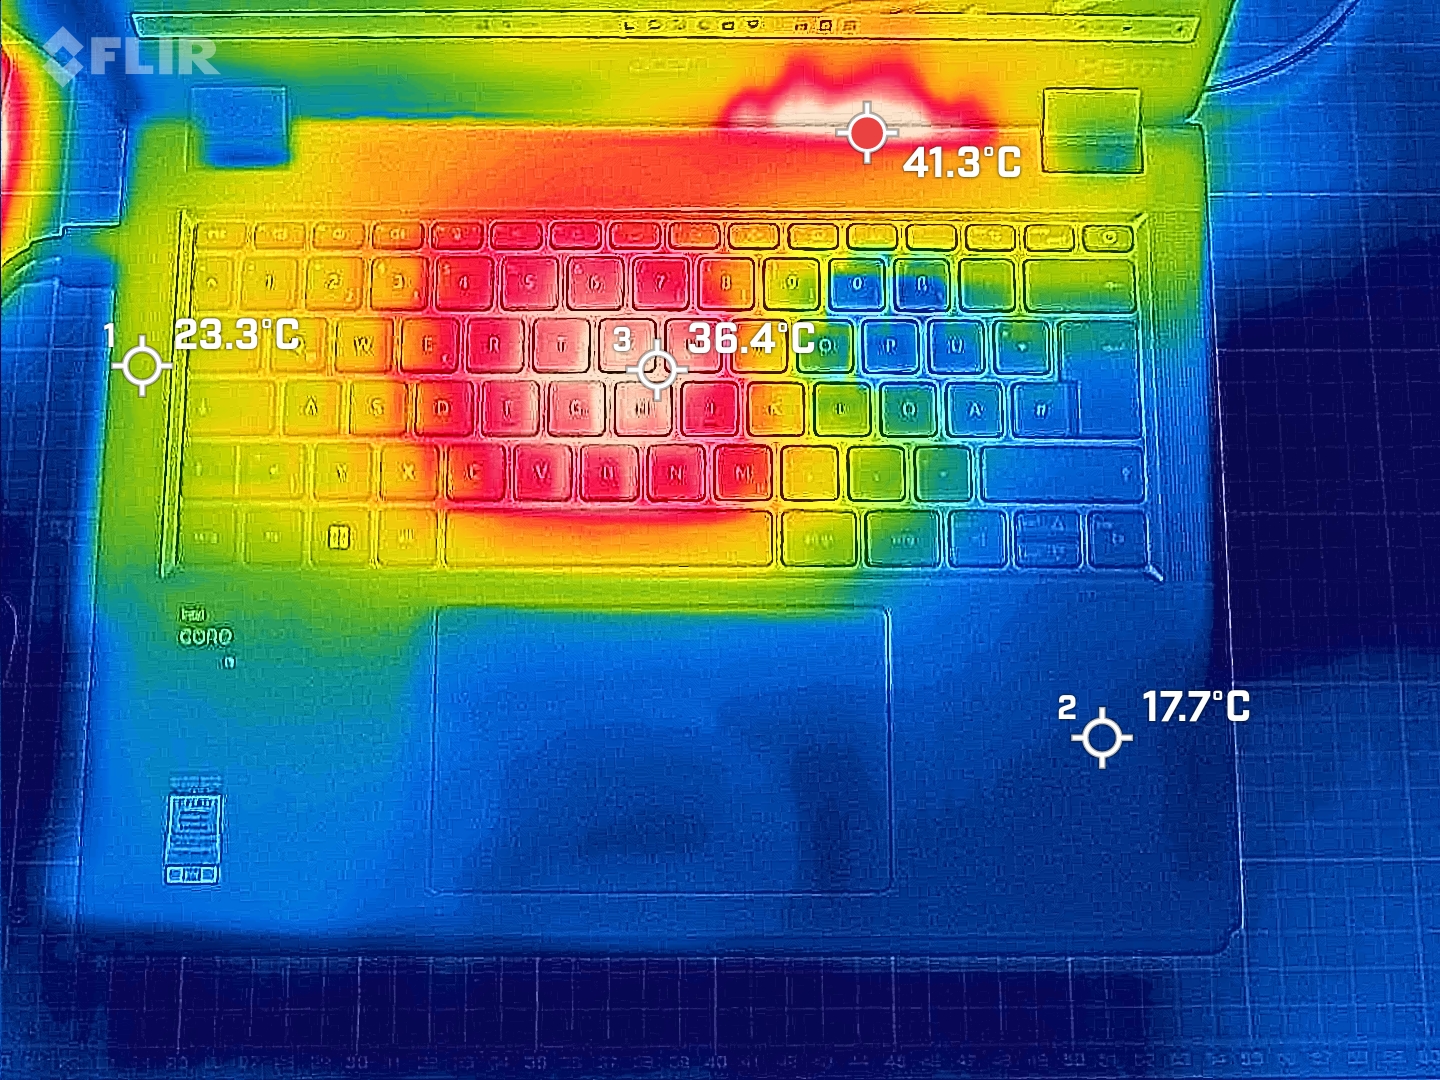
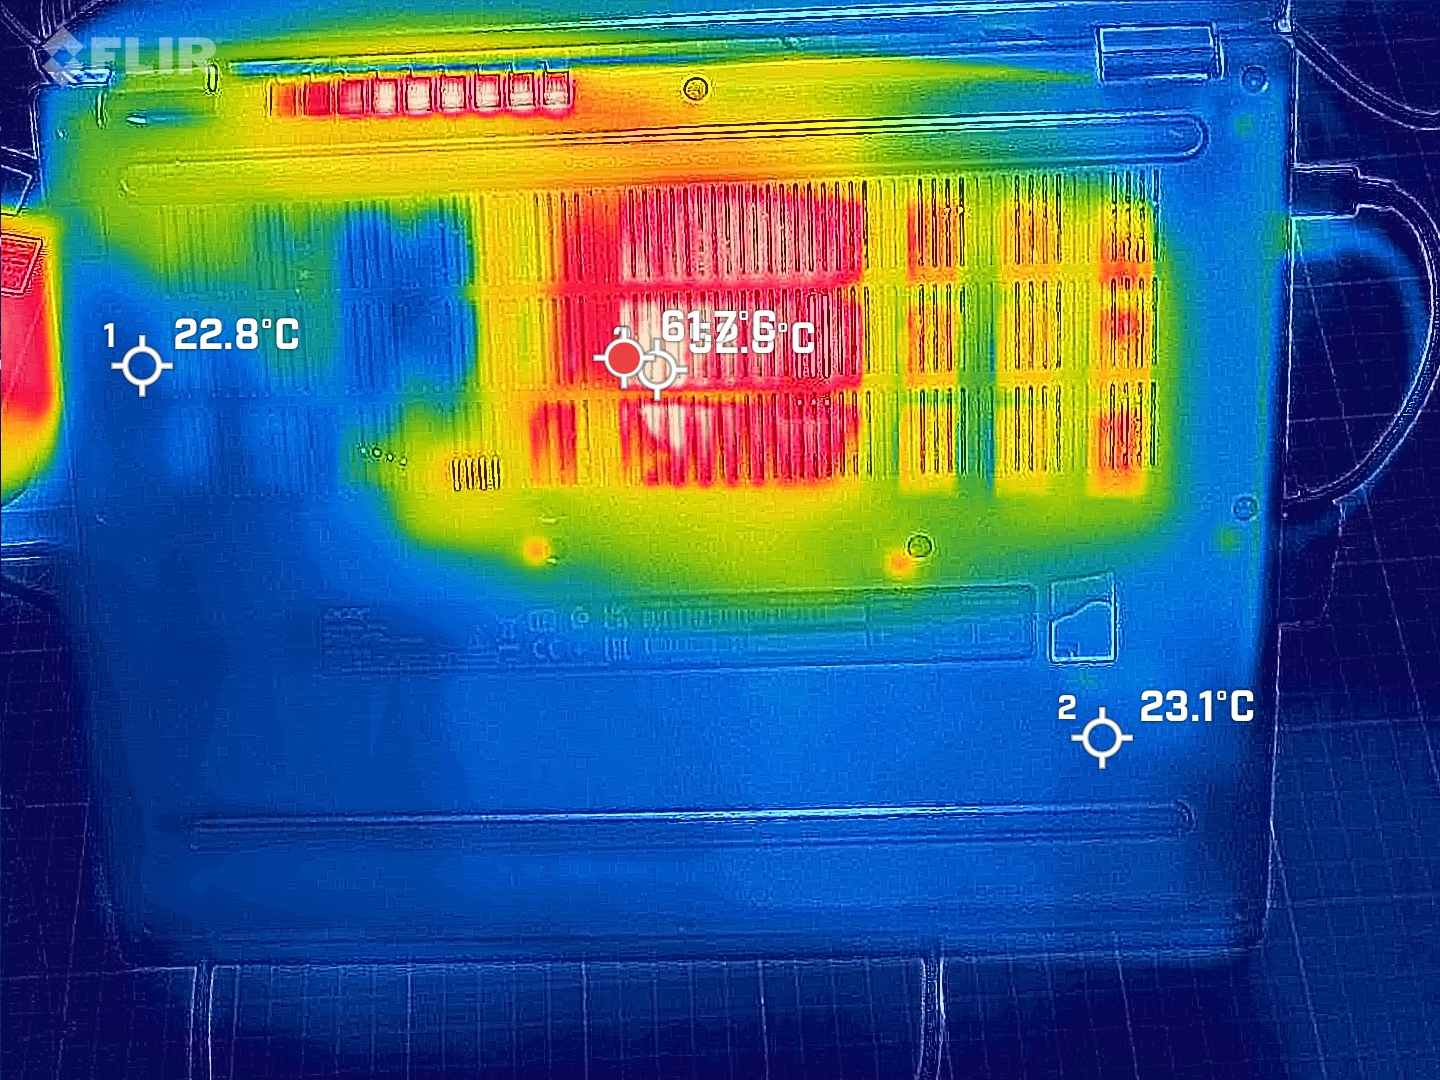
笔记本电脑由一条长长的橡胶条抬高,使背面略高于正面。这并不是为了提供更舒适的书写环境,而是为了改善散热,空气通过底部和键盘被吸入热管。
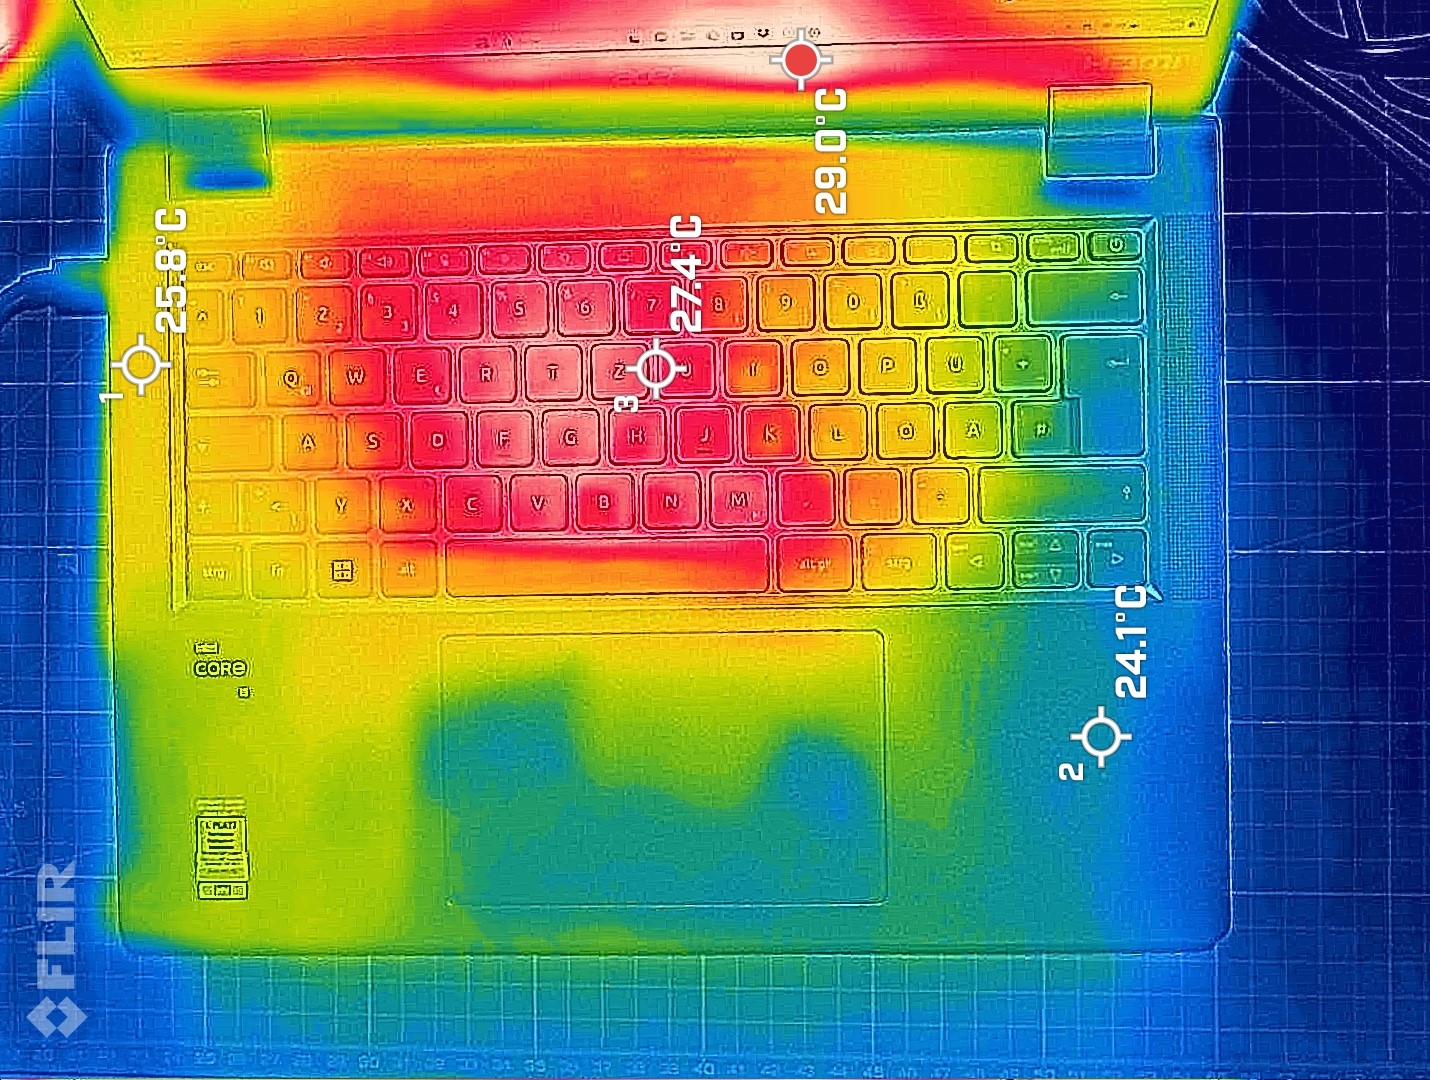
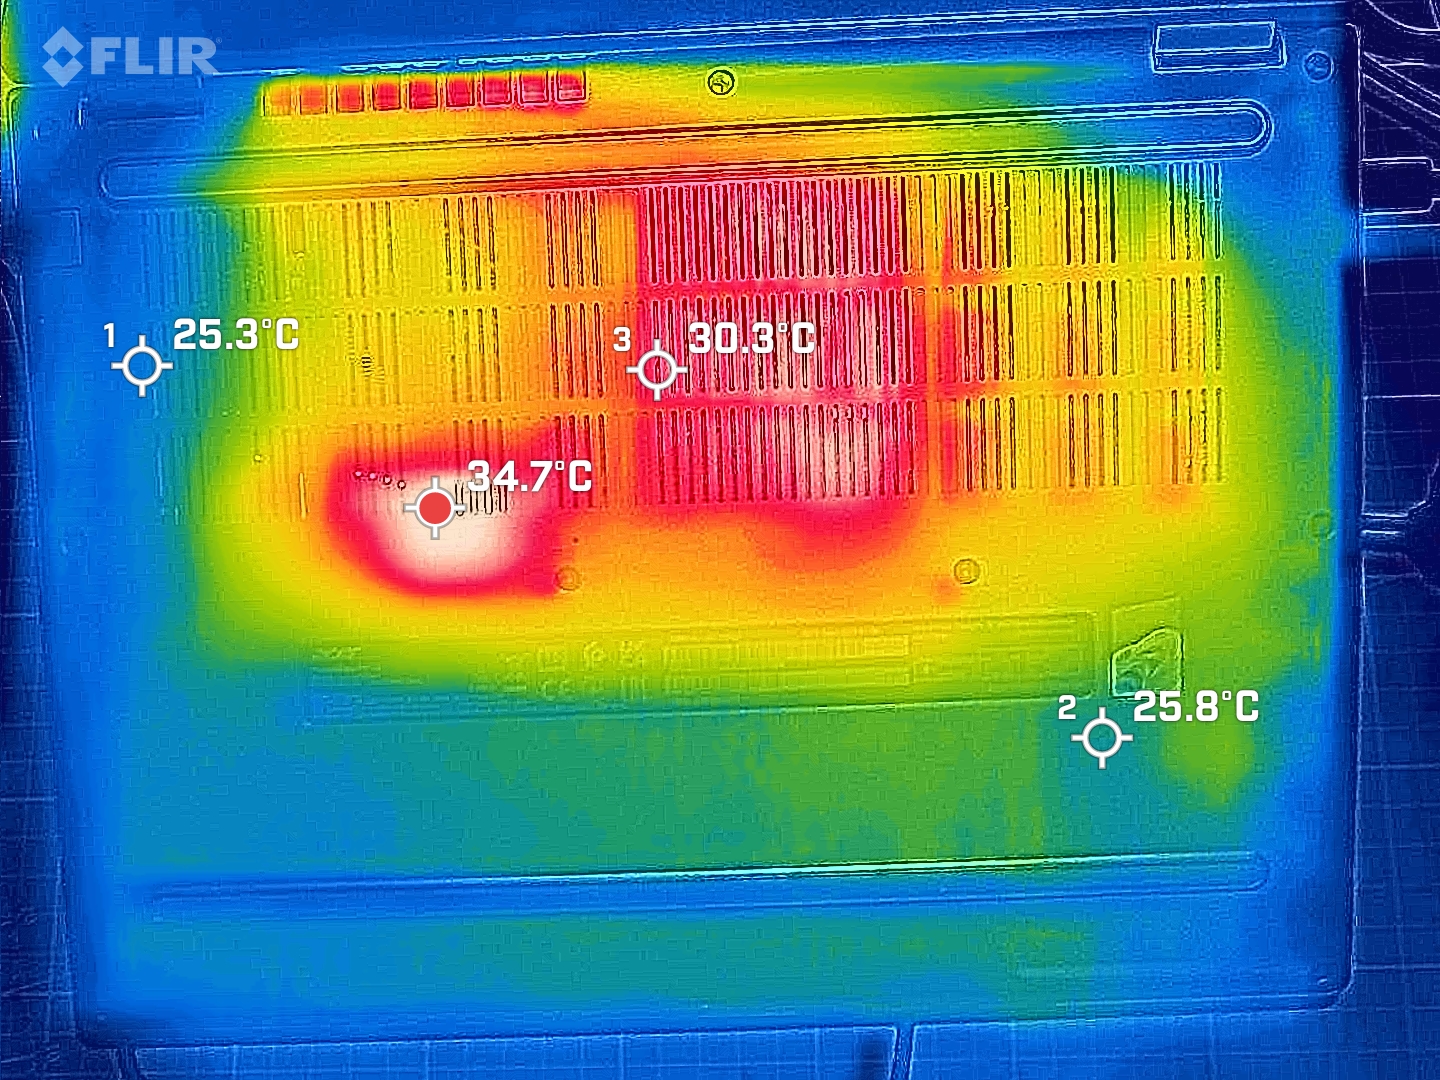
几乎持续运转的风扇起到了积极作用:在键入这篇评测时,SoC 键盘上方区域的温度保持在 35 ºC(95 ºF),右侧和下方区域的温度保持在 28 ºC(82 ºF)。在负载情况下,中央区域会明显升温,但周围区域不会,或只是适度升温。对竞争对手的分析表明,TravelMate 的优势在于它们之间的巨大差异。A Thinkpad E14(AMD 版)在压力测试中的发热温度高达 55 ºC (131 ºF),因为它的高性能也有其代价。
(+) The maximum temperature on the upper side is 35.8 °C / 96 F, compared to the average of 35.9 °C / 97 F, ranging from 21.4 to 59 °C for the class Subnotebook.
(±) The bottom heats up to a maximum of 41.5 °C / 107 F, compared to the average of 39.2 °C / 103 F
(+) In idle usage, the average temperature for the upper side is 25.1 °C / 77 F, compared to the device average of 30.8 °C / 87 F.
(+) The palmrests and touchpad are cooler than skin temperature with a maximum of 22.2 °C / 72 F and are therefore cool to the touch.
(+) The average temperature of the palmrest area of similar devices was 28.2 °C / 82.8 F (+6 °C / 10.8 F).
| Acer TravelMate P4 TMP414-53-58XQ Intel Core i5-1335U, Intel Iris Xe Graphics G7 80EUs | Lenovo ThinkPad E14 G5-21JSS05C00 AMD Ryzen 7 7730U, AMD Radeon RX Vega 8 (Ryzen 4000/5000) | Lenovo ThinkPad E14 G5 i7-1355U Intel Core i7-1355U, Intel Iris Xe Graphics G7 96EUs | HP ProBook 440 G9-5Y3Z3EA Intel Core i7-1255U, Intel Iris Xe Graphics G7 96EUs | HP ProBook 445 G10 AMD Ryzen 5 7530U, AMD Radeon RX Vega 7 | |
|---|---|---|---|---|---|
| Heat | -1% | -7% | 12% | -1% | |
| Maximum Upper Side * (°C) | 35.8 | 42.6 -19% | 45.4 -27% | 38.9 -9% | 43 -20% |
| Maximum Bottom * (°C) | 41.5 | 55.3 -33% | 50.8 -22% | 37.4 10% | 51 -23% |
| Idle Upper Side * (°C) | 35 | 25.8 26% | 30.2 14% | 26.7 24% | 27 23% |
| Idle Bottom * (°C) | 35.7 | 27.4 23% | 33.4 6% | 27.8 22% | 30 16% |
* ... smaller is better
压力测试
TravelMate P4 在进行传统的压力测试时,最初的功耗高达 50 瓦。一分钟后,功耗已降至 28 瓦,并在测试的剩余时间内保持在这一水平。P 核心的工作频率短暂达到 4.4 GHz,但随后被节流至 3.3 GHz。4 分钟后,它们的频率介于 2.4 和 3.0 GHz 之间。在这种情况下,我们测得了上述最高温度。
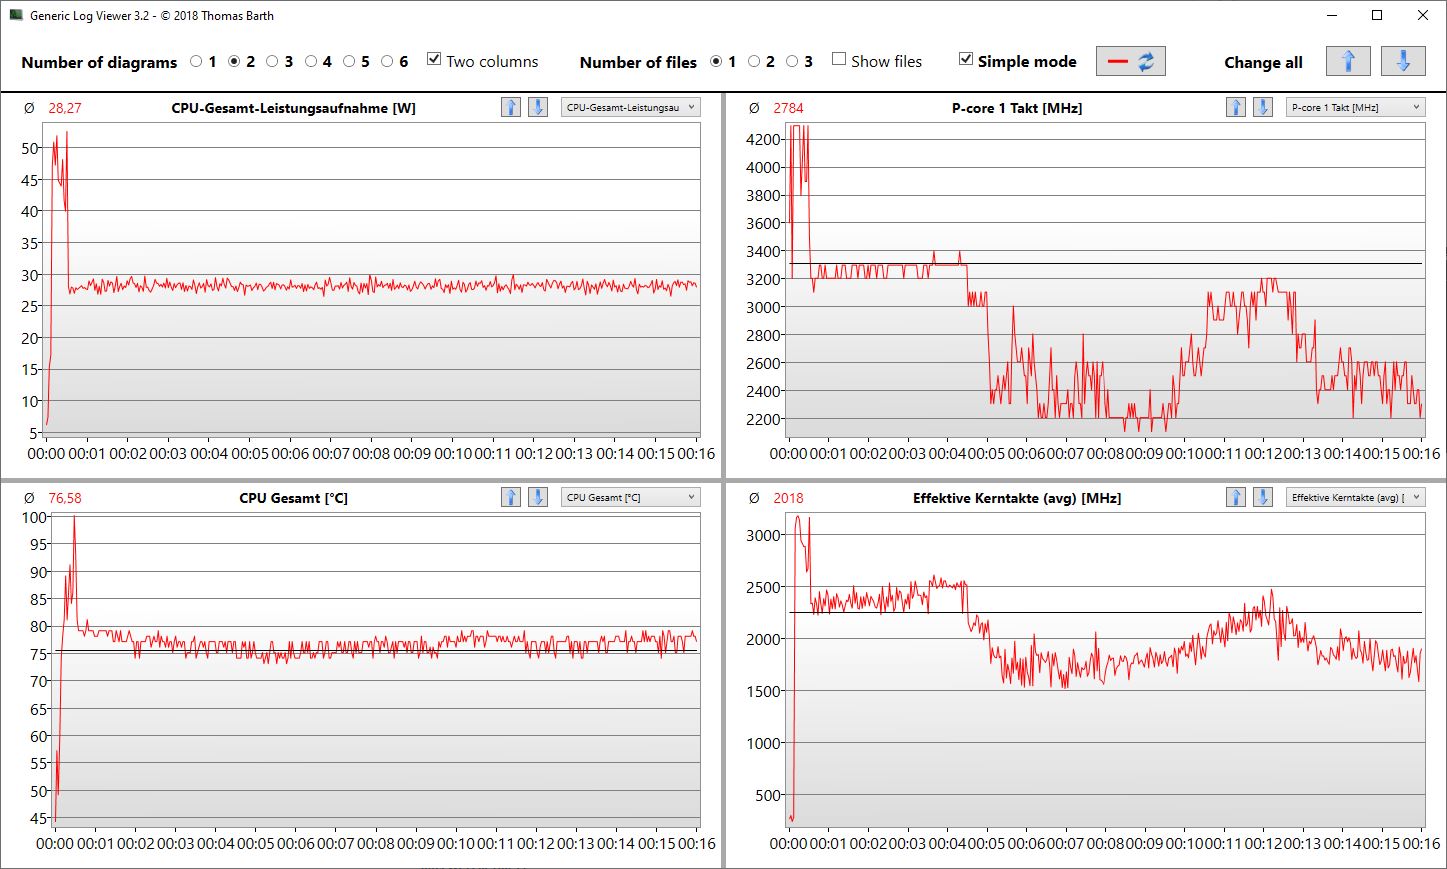
| CPU 时钟 (GHz) | GPU 时钟 (MHz) | CPU 平均温度 (°C) | GPU 平均温度(°C) | |
| 系统空闲 | 0.7 | 300 | 41 | 41 |
| Prime95, Stress | 4.4 | 300 | 60 | 60 |
| Prime95 + FurMark,压力 | 4.3 | 1,100 | 76 | 76 |
| Witcher 3, Stress | 3.7 | 1,150 | 78 | 78 |
发言人
立体声扬声器位于键盘的左右两侧,当笔记本电脑放在毯子上或膝上时,可避免声音受潮。许多笔记本电脑的扬声器都放在底部。音效仍有不足之处,尤其是低频,更不用说低音了。中音被过分强调,最大音量也只是适中。双阵列麦克风能非常清晰地录制我们的声音(AI 噪音抑制功能已激活),但这只是在笔记本电脑前一米距离内的情况(这将最大限度地减少背景噪音)。通过 Realtek 音频控制台可以调整特性,例如在个人电话或会议电话之间切换。总之,TravelMate 为团队通话提供了极佳的条件,但在播放音乐或电影时就显得力不从心了。
Acer TravelMate P4 TMP414-53-58XQ audio analysis
(±) | speaker loudness is average but good (79.3 dB)
Bass 100 - 315 Hz
(-) | nearly no bass - on average 31.1% lower than median
(±) | linearity of bass is average (13.7% delta to prev. frequency)
Mids 400 - 2000 Hz
(+) | balanced mids - only 4.5% away from median
(+) | mids are linear (6.4% delta to prev. frequency)
Highs 2 - 16 kHz
(+) | balanced highs - only 3.9% away from median
(+) | highs are linear (2.9% delta to prev. frequency)
Overall 100 - 16.000 Hz
(±) | linearity of overall sound is average (23.3% difference to median)
Compared to same class
» 81% of all tested devices in this class were better, 3% similar, 17% worse
» The best had a delta of 5%, average was 18%, worst was 53%
Compared to all devices tested
» 70% of all tested devices were better, 5% similar, 25% worse
» The best had a delta of 4%, average was 23%, worst was 134%
Apple MacBook Pro 16 2021 M1 Pro audio analysis
(+) | speakers can play relatively loud (84.7 dB)
Bass 100 - 315 Hz
(+) | good bass - only 3.8% away from median
(+) | bass is linear (5.2% delta to prev. frequency)
Mids 400 - 2000 Hz
(+) | balanced mids - only 1.3% away from median
(+) | mids are linear (2.1% delta to prev. frequency)
Highs 2 - 16 kHz
(+) | balanced highs - only 1.9% away from median
(+) | highs are linear (2.7% delta to prev. frequency)
Overall 100 - 16.000 Hz
(+) | overall sound is linear (4.6% difference to median)
Compared to same class
» 0% of all tested devices in this class were better, 0% similar, 100% worse
» The best had a delta of 5%, average was 17%, worst was 45%
Compared to all devices tested
» 0% of all tested devices were better, 0% similar, 100% worse
» The best had a delta of 4%, average was 23%, worst was 134%
电源管理
耗电量
酷睿 i5 性能低于平均水平也有一个优势,那就是功耗低。最大负载下 35 瓦的功耗是节流的结果。而竞争对手的情况并非如此,它们的功耗在 57 至 64 瓦之间,英特尔机型的功耗最高。我们将 TravelMate 的外接显示器功耗与 AMD ThinkPad E14 进行了比较。在要求性能的情况下,ThinkPad 的功耗更高,但在空闲运行时功耗略低。
| Idle | |
| Load |
|
Key:
min: | |
| Acer TravelMate P4 TMP414-53-58XQ i5-1335U, Iris Xe G7 80EUs, Kingston OM8SEP4512Q-AA, IPS, 1920x1200, 14" | Dell Latitude 7440 i5-1345U, Iris Xe G7 80EUs, Samsung MZ9L4512HBLU-00BMV, IPS, 2560x1600, 14" | Lenovo ThinkPad E14 G5-21JSS05C00 R7 7730U, Vega 8, WD PC SN740 SDDPNQD-1T00, IPS, 2240x1400, 14" | Lenovo ThinkPad E14 G5 i7-1355U i7-1355U, Iris Xe G7 96EUs, WD PC SN740 512GB SDDQMQD-512G, IPS, 1920x1200, 14" | HP ProBook 440 G9-5Y3Z3EA i7-1255U, Iris Xe G7 96EUs, Samsung PM991 MZVLQ512HBLU, , 1920x1080, 14" | HP ProBook 445 G10 R5 7530U, Vega 7, Kioxia BG5 KBG50ZNS512G, IPS, 1920x1080, 14" | Average Intel Iris Xe Graphics G7 80EUs | Average of class Subnotebook | |
|---|---|---|---|---|---|---|---|---|
| Power Consumption | -36% | -35% | -36% | -45% | -47% | -47% | -35% | |
| Idle Minimum * (Watt) | 3.4 | 4.5 -32% | 3.3 3% | 3.6 -6% | 5.1 -50% | 7 -106% | 4.49 ? -32% | 3.76 ? -11% |
| Idle Average * (Watt) | 5.4 | 6.5 -20% | 7.6 -41% | 6.9 -28% | 7.4 -37% | 8 -48% | 7.4 ? -37% | 6.54 ? -21% |
| Idle Maximum * (Watt) | 6.4 | 7.3 -14% | 8.9 -39% | 7 -9% | 8.4 -31% | 9 -41% | 9.26 ? -45% | 7.89 ? -23% |
| Witcher 3 ultra * (Watt) | 34.2 | 46.2 -35% | 45.1 -32% | 50.5 -48% | 42.3 -24% | 36.2 -6% | ||
| Load Maximum * (Watt) | 35.16 | 63 -79% | 57.8 -64% | 67 -91% | 64 -82% | 47 -34% | 61.7 ? -75% | 64.8 ? -84% |
| Load Average * (Watt) | 52.5 | 47.3 | 42.3 | 42.6 | 34 | 36.6 ? | 42 ? |
* ... smaller is better
Power Consumption The Witcher 3 / Stress Test
Power Consumption With External Monitor
电池寿命
在电池寿命测试中,TravelMate 保持了 8 至 10.5 小时(使用 56 瓦时电池)的良好成绩。在亮度降低到 150 cd/m² 的情况下,我们的续航时间达到了 10:33 小时,使 TravelMate 轻松超越了两款 ThinkPad E14 机型。不过,这仍然不是最高值,因为 戴尔Latitude 7440(57 Wh)的续航时间要长 2:20 小时。
Battery Eater Classic 测试的结果是最短运行时间为 143 分钟。当我们使用 TravelMate(亮度降至 1/3、Wi-Fi 和平衡模式)撰写本评论时,这款 14 英寸笔记本电脑的续航时间接近 9 小时。
| Acer TravelMate P4 TMP414-53-58XQ i5-1335U, Iris Xe G7 80EUs, 56 Wh | Dell Latitude 7440 i5-1345U, Iris Xe G7 80EUs, 57 Wh | Lenovo ThinkPad E14 G5-21JSS05C00 R7 7730U, Vega 8, 57 Wh | Lenovo ThinkPad E14 G5 i7-1355U i7-1355U, Iris Xe G7 96EUs, 47 Wh | HP ProBook 440 G9-5Y3Z3EA i7-1255U, Iris Xe G7 96EUs, 42 Wh | HP ProBook 445 G10 R5 7530U, Vega 7, 42 Wh | Fujitsu LifeBook E5412A E542AMHAAMDE R5 PRO 5675U, Vega 7, 60 Wh | Average of class Subnotebook | |
|---|---|---|---|---|---|---|---|---|
| Battery runtime | 18% | -29% | -48% | -46% | -10% | -26% | 7% | |
| WiFi v1.3 (h) | 10.6 | 13 23% | 9.9 -7% | 5.5 -48% | 5.7 -46% | 9.5 -10% | 10.4 -2% | 14 ? 32% |
| Load (h) | 2.4 | 2.7 13% | 1.2 -50% | 1.2 -50% | 1.969 ? -18% | |||
| Reader / Idle (h) | 23.8 | 28.6 ? | ||||||
| H.264 (h) | 10.8 | 8.2 | 15.4 ? |
Pros
Cons
判决
TravelMate P4 将低调变成了老板们的事情:不显眼的性能、鼠标灰的视觉效果、简单的全高清显示屏、最低的发热量以及扬声器的静音效果。那些想在笔记本电脑上夸夸其谈的人一定要避开宏碁的 14 英寸笔记本电脑。
在使用这款枯燥的办公伴侣时,它能完成 95% 的任务。
亮度降低的原因是 IPS 面板的整体亮度较弱,在电池工作时亮度会进一步降低。这将给阳光下的家庭办公带来一些困难。
我们看到,这款笔记本电脑的优势在于 8 至 10.5 小时的良好电池续航时间,以及坚固耐用的机箱,大部分时间都能保持低温。低发热量和低功耗是酷睿 i5 低于其性能的结果,但在使用网络应用程序和 Excel 电子表格时,几乎没有人会注意到这一点。更重要的是实际问题,例如可以清洁风扇或升级工作内存。在这方面,宏碁提供了一个很好的范例,它提供了一个可以吹出强制风的开口来清洁风扇,或者提供了一个方便拆卸底板的开口。
宏碁(Acer)没有放弃有线以太网连接,而且还配备了快速和非常先进的 Wi-Fi 芯片。键盘可以让我们快速键入,中间放置的 14 厘米大的 ClickPad 也是一些新的优势。此外,宏碁还重新进行了设计。最后,如果需要使用功能强大的扩展坞,两个 Thunderbolt 4 端口就变得非常重要了。
虽然显示屏不是最好的,但其 16:10 的格式为文档和 Excel 提供了更大的工作空间。
对于经常打字的人来说,提供良好反馈的键盘和坚固掌托上的大尺寸 ClickPad 是非常重要的。
如果您正在寻找性价比最高的产品,联想 ThinkPad E14 G5可以选择英特尔或 AMD 芯片。特别是 AMD 机型,如果需要价格在 1000 欧元(约合 1087 美元)左右的产品,那么它将是高功率用户的最佳选择。联想 ThinkPad E14 G5-21JSS05C00 和联想 ThinkPad E14 G5i7-1355U的综合评分相同,但根据配置的不同,它们的硬件性价比更高(在内存、固态硬盘或分辨率方面),而且可升级性更强(有第二个固态硬盘插槽!)。ThinkPad E 的缺点是标准保修期只有 12 个月。
价格和供应情况
我们建议比较各种配置的价格。例如,亚马逊列出的宏碁 TravelMate P4 TMP414-51 与我们的测试配置规格相似,售价约为 740 美元,而配备 1 TB 固态硬盘和 16 GB 内存的更强大的第 12 代酷睿 i7 版本售价约为 1,052 美元。
Acer TravelMate P4 TMP414-53-58XQ
- 01/16/2024 v7 (old)
Sebastian Jentsch
Transparency
The selection of devices to be reviewed is made by our editorial team. The test sample was provided to the author as a loan by the manufacturer or retailer for the purpose of this review. The lender had no influence on this review, nor did the manufacturer receive a copy of this review before publication. There was no obligation to publish this review. As an independent media company, Notebookcheck is not subjected to the authority of manufacturers, retailers or publishers.
This is how Notebookcheck is testing
Every year, Notebookcheck independently reviews hundreds of laptops and smartphones using standardized procedures to ensure that all results are comparable. We have continuously developed our test methods for around 20 years and set industry standards in the process. In our test labs, high-quality measuring equipment is utilized by experienced technicians and editors. These tests involve a multi-stage validation process. Our complex rating system is based on hundreds of well-founded measurements and benchmarks, which maintains objectivity. Further information on our test methods can be found here.
Price comparison

