富士通 LifeBook U757 (7200U, 全高清) 笔记本电脑简短评测
| SD Card Reader | |
| average JPG Copy Test (av. of 3 runs) | |
| Dell Latitude 15 E5570 | |
| Fujitsu LifeBook U757 | |
| Lenovo ThinkPad T570-20H90002GE | |
| HP EliteBook 850 G4-Z2W86ET | |
| Acer TravelMate P658-M-537B | |
| maximum AS SSD Seq Read Test (1GB) | |
| Lenovo ThinkPad T570-20H90002GE | |
| HP EliteBook 850 G4-Z2W86ET | |
| Fujitsu LifeBook U757 | |
| Networking | |
| iperf3 transmit AX12 | |
| Lenovo ThinkPad T570-20H90002GE | |
| HP EliteBook 850 G4-Z2W86ET | |
| Fujitsu LifeBook U757 | |
| iperf3 receive AX12 | |
| Fujitsu LifeBook U757 | |
| Lenovo ThinkPad T570-20H90002GE | |
| HP EliteBook 850 G4-Z2W86ET | |
| |||||||||||||||||||||||||
Brightness Distribution: 84 %
Center on Battery: 310 cd/m²
Contrast: 1159:1 (Black: 0.27 cd/m²)
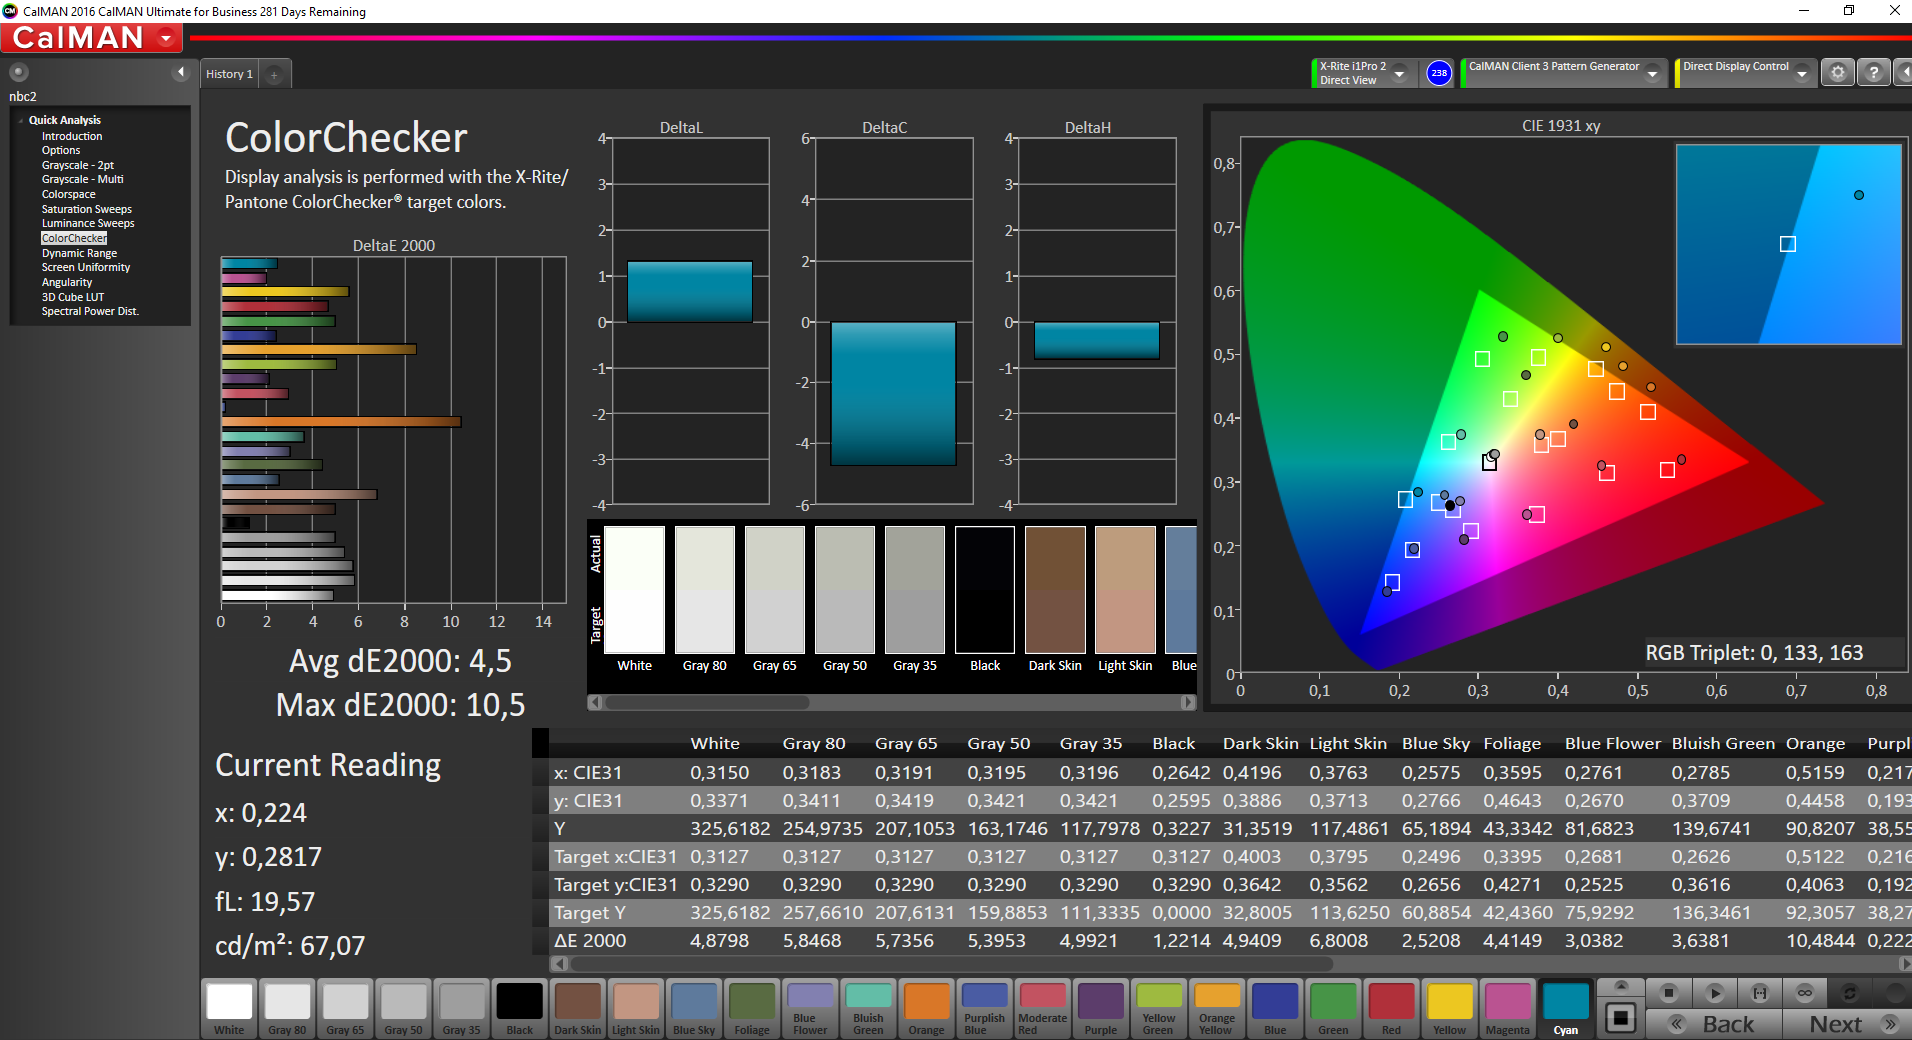
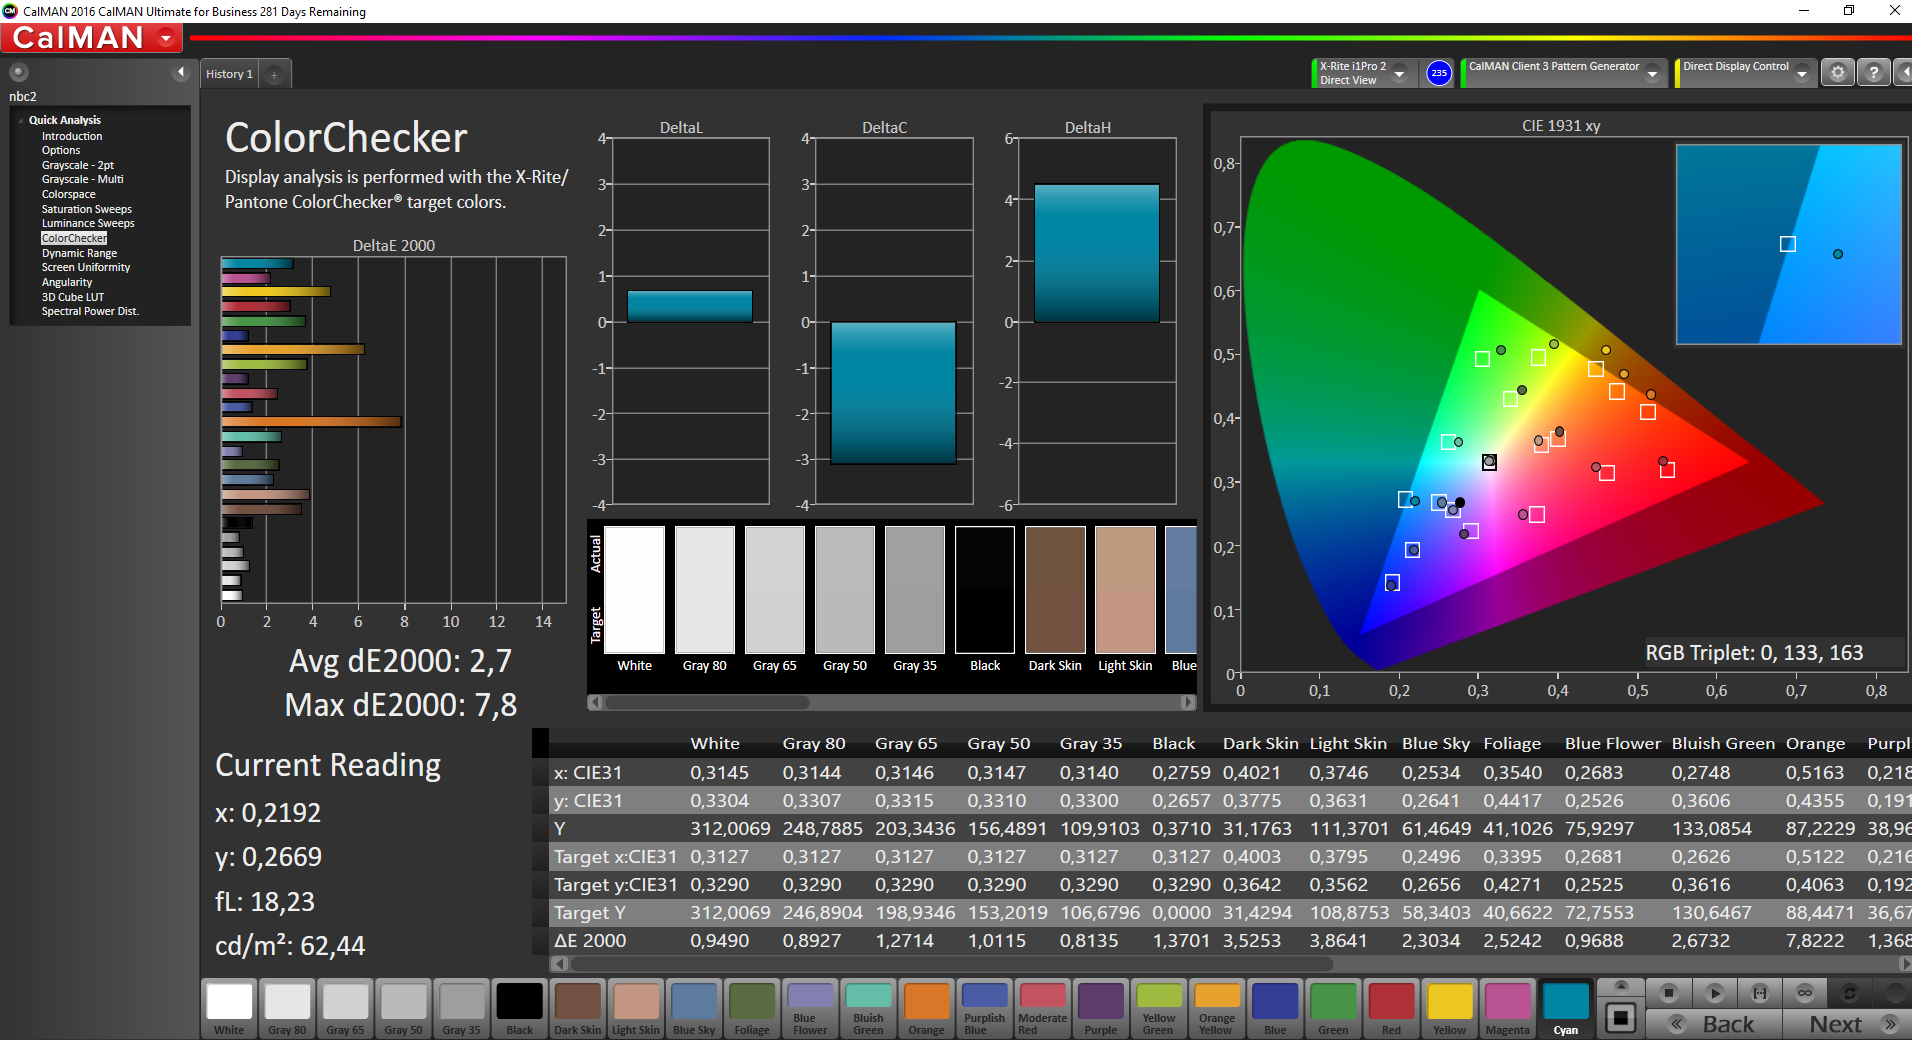
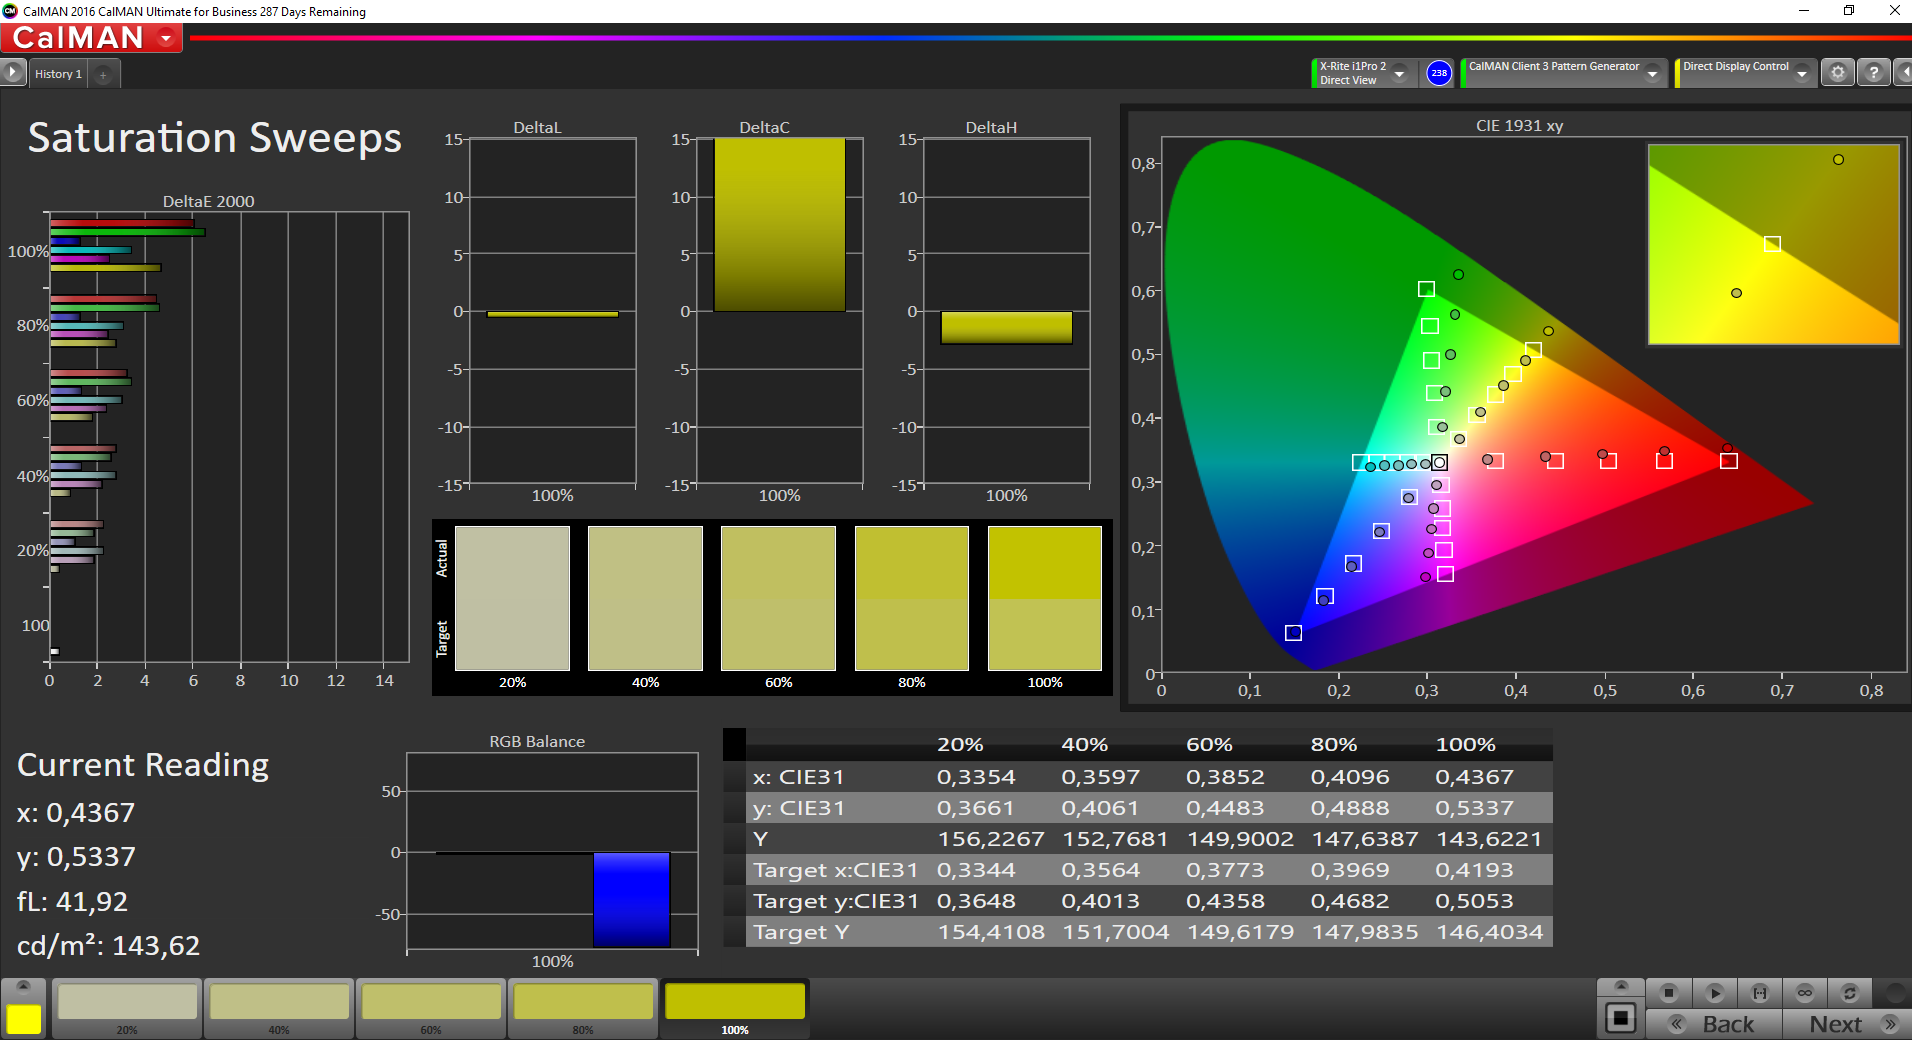
ΔE ColorChecker Calman: 4.5 | ∀{0.5-29.43 Ø4.71}
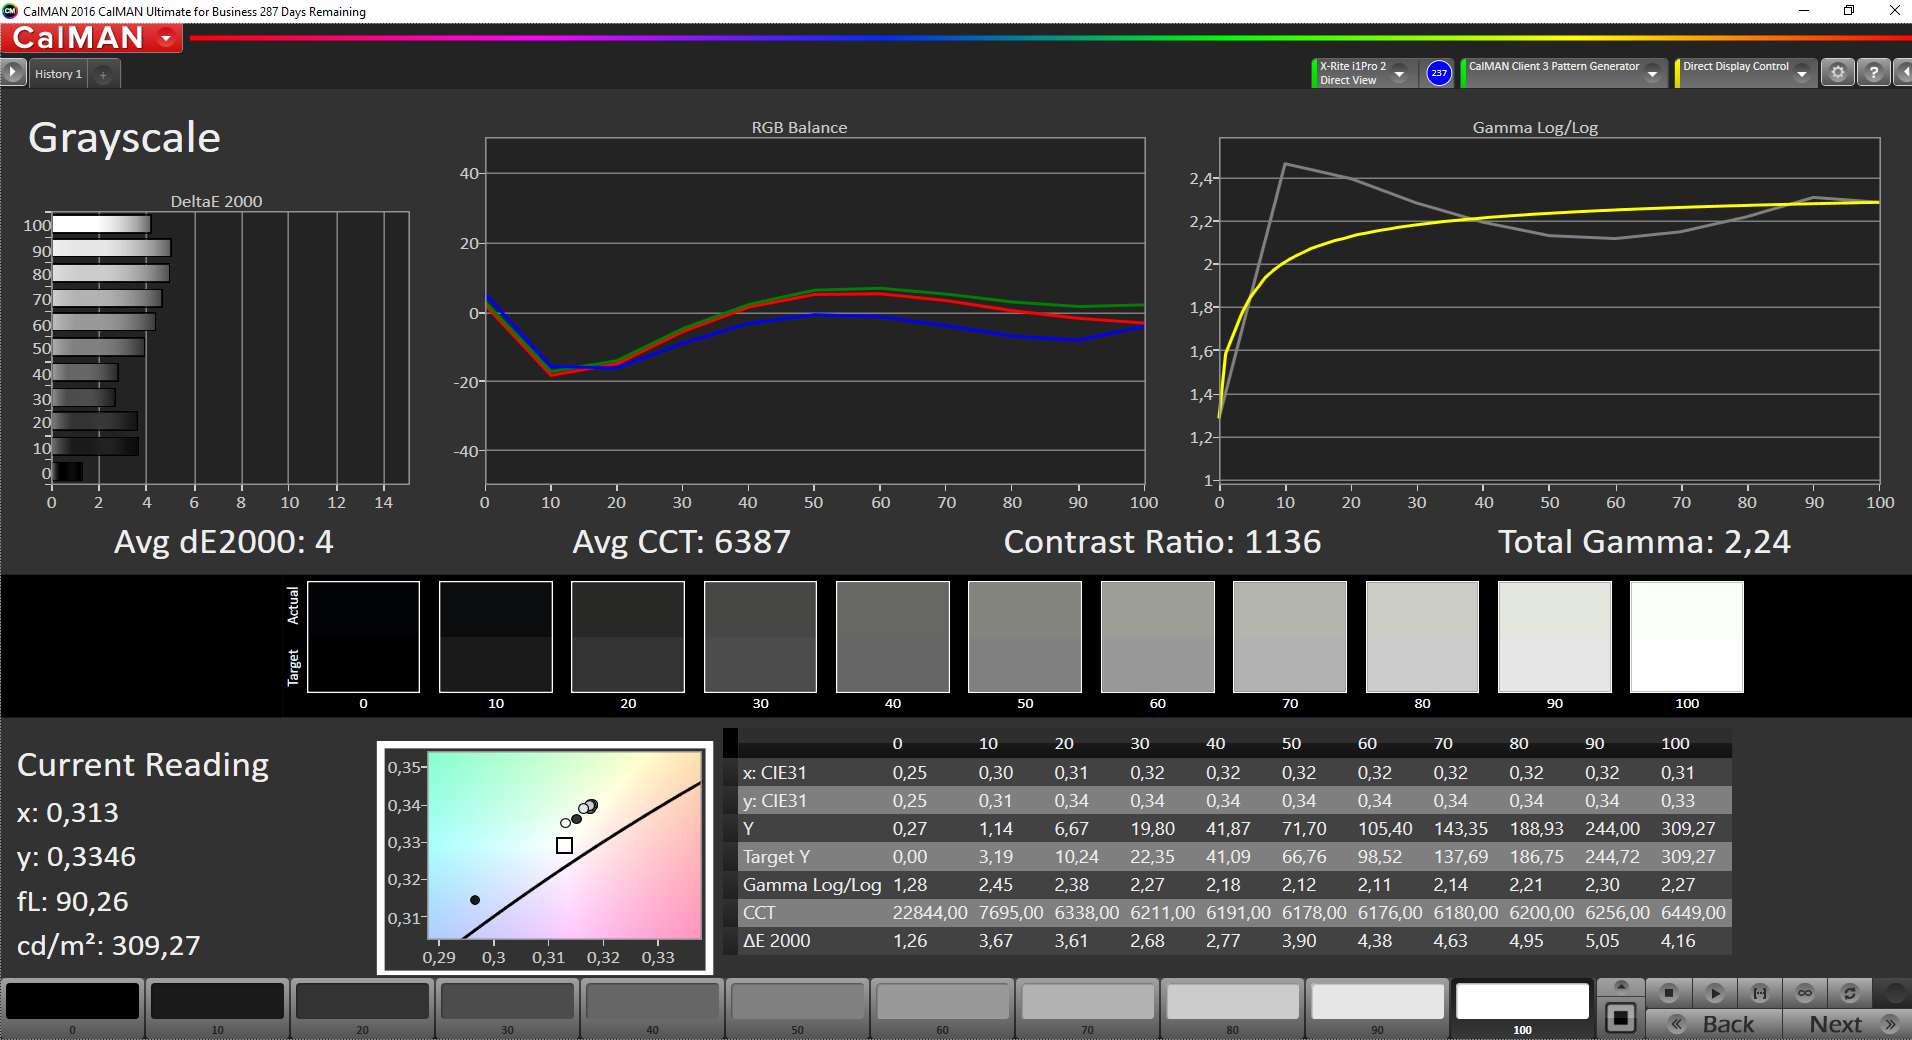
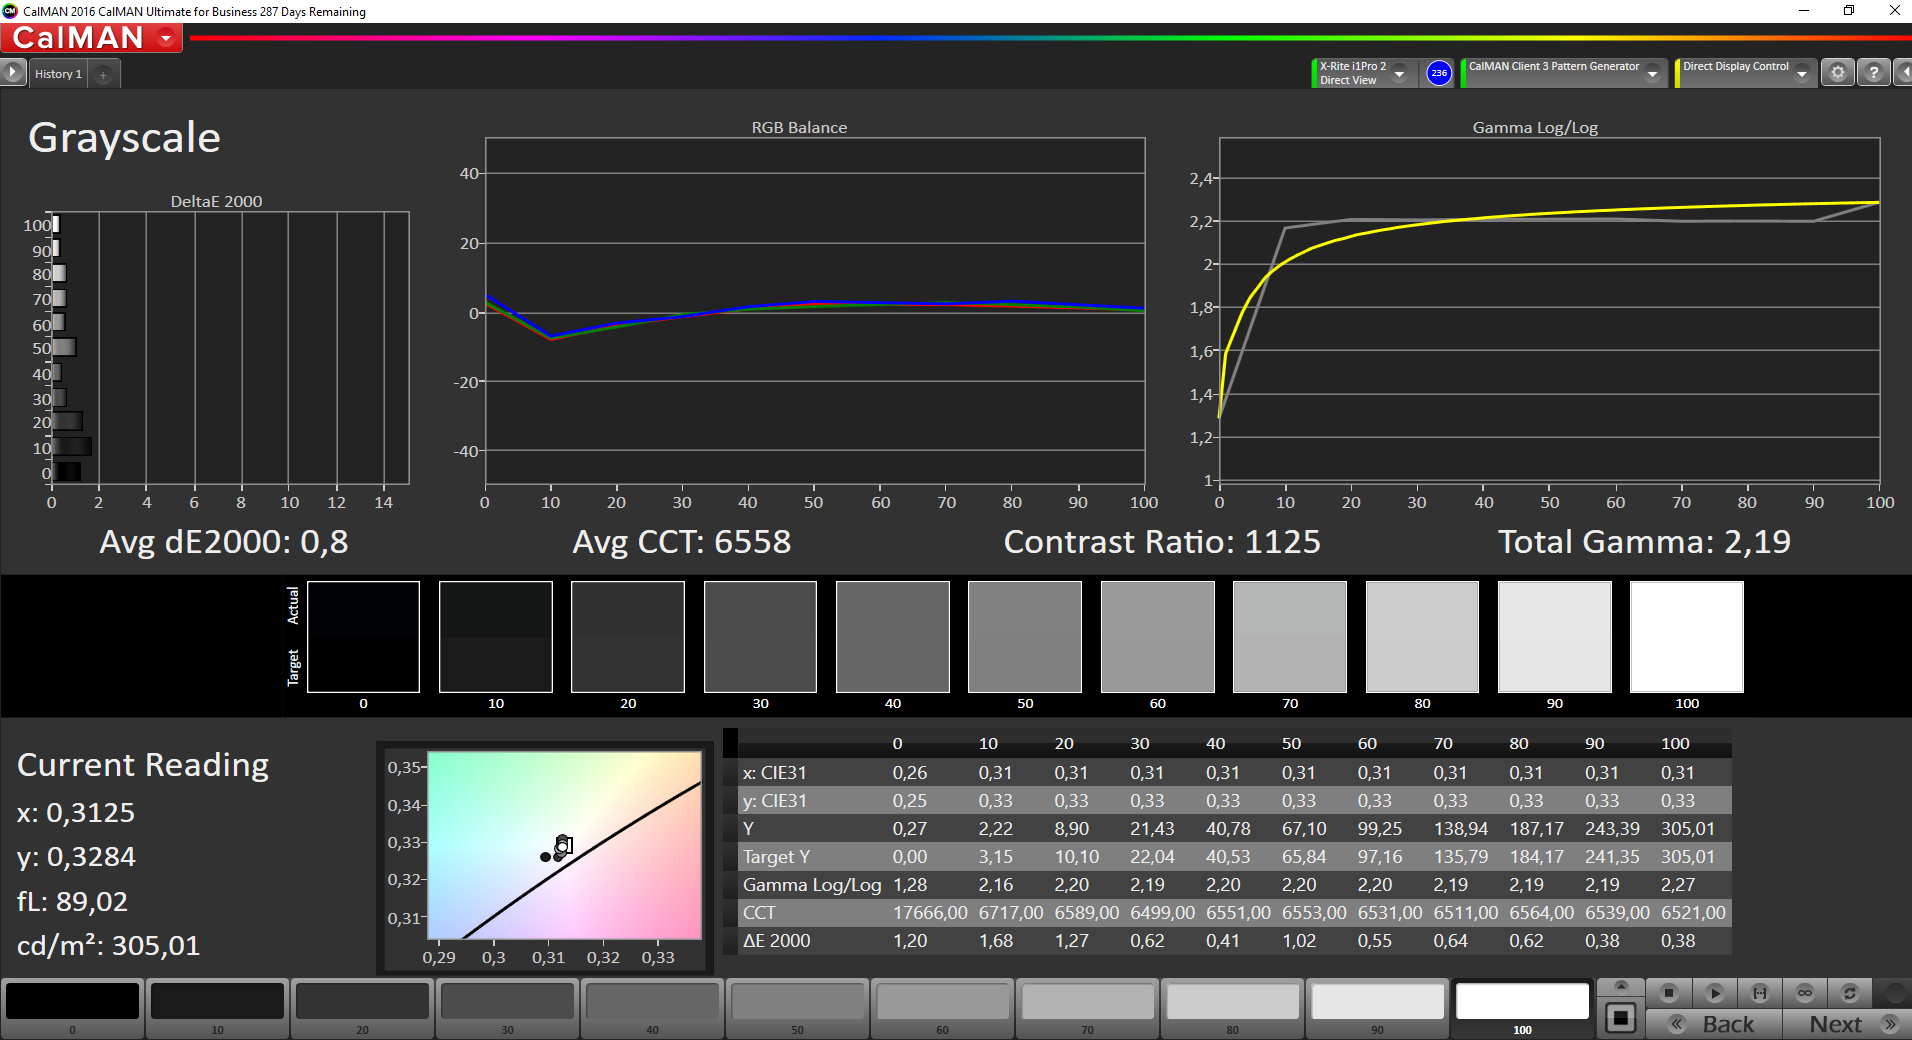
ΔE Greyscale Calman: 4 | ∀{0.09-98 Ø4.96}
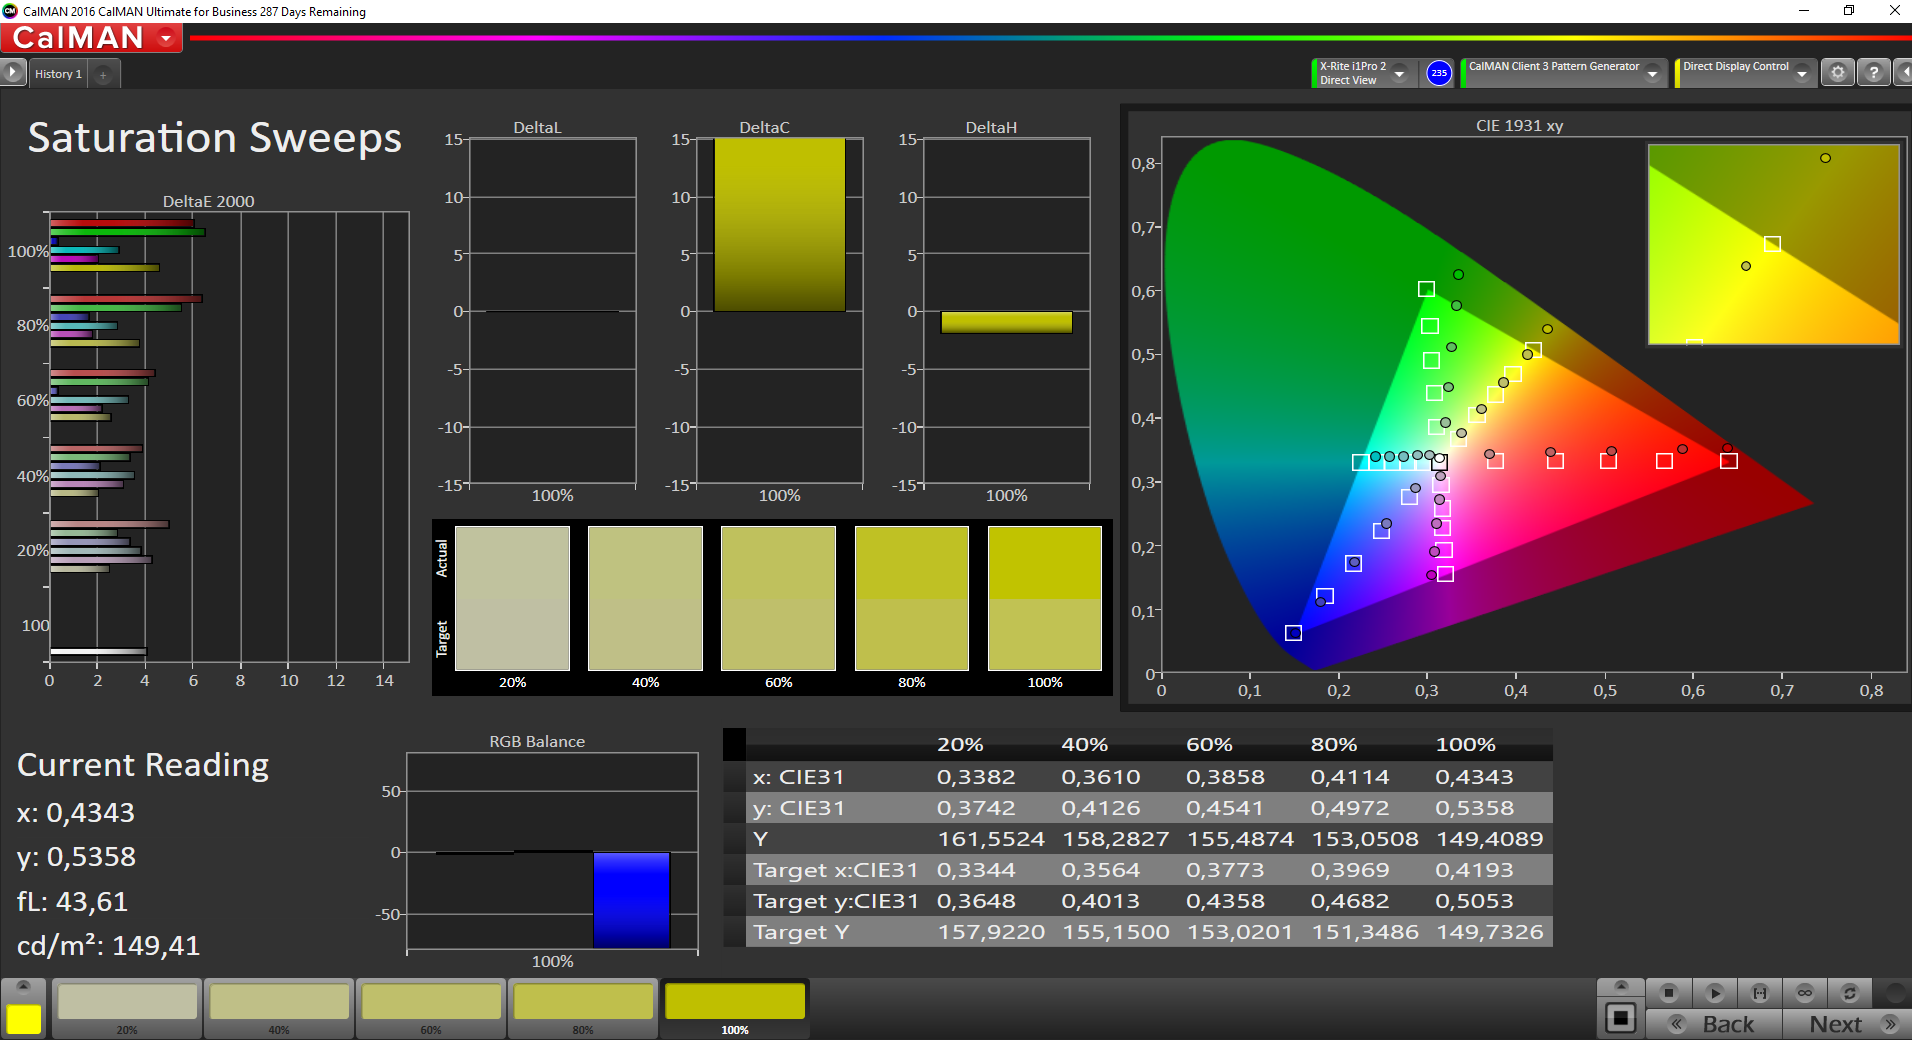
84.74% sRGB (Argyll 1.6.3 3D)
55.3% AdobeRGB 1998 (Argyll 1.6.3 3D)
62% AdobeRGB 1998 (Argyll 3D)
84.8% sRGB (Argyll 3D)
65.8% Display P3 (Argyll 3D)
Gamma: 2.24
CCT: 6387 K
| Fujitsu LifeBook U757 LP156WF6-SPP1, , 1920x1080, 15.6" | Lenovo ThinkPad T570-20H90002GE N156HCA-EAA, , 1920x1080, 15.6" | HP EliteBook 850 G4-Z2W86ET AUO35ED, , 1920x1080, 15.6" | Dell Latitude 15 E5570 LG Philips 156WHU, , 1366x768, 15.6" | Acer TravelMate P658-M-537B LG Philips LGD04D5 / LG Display LP156WF6-SPP1, , 1920x1080, 15.6" | |
|---|---|---|---|---|---|
| Display | -27% | -7% | -33% | 1% | |
| Display P3 Coverage (%) | 65.8 | 44.08 -33% | 56.8 -14% | 40.48 -38% | 66.6 1% |
| sRGB Coverage (%) | 84.8 | 65.6 -23% | 83.7 -1% | 60.9 -28% | 85.7 1% |
| AdobeRGB 1998 Coverage (%) | 62 | 45.66 -26% | 58.7 -5% | 41.82 -33% | 62.8 1% |
| Response Times | 3% | 6% | -17% | -1% | |
| Response Time Grey 50% / Grey 80% * (ms) | 36 ? | 41.6 ? -16% | 47.2 ? -31% | 47 ? -31% | 38 ? -6% |
| Response Time Black / White * (ms) | 26.4 ? | 20.8 ? 21% | 15.2 ? 42% | 27 ? -2% | 25 ? 5% |
| PWM Frequency (Hz) | 26040 ? | 199.2 ? | |||
| Screen | -6% | -69% | -61% | -16% | |
| Brightness middle (cd/m²) | 313 | 262 -16% | 338 8% | 228 -27% | 308 -2% |
| Brightness (cd/m²) | 294 | 245 -17% | 341 16% | 236 -20% | 319 9% |
| Brightness Distribution (%) | 84 | 89 6% | 90 7% | 90 7% | 71 -15% |
| Black Level * (cd/m²) | 0.27 | 0.24 11% | 0.81 -200% | 0.56 -107% | 0.61 -126% |
| Contrast (:1) | 1159 | 1092 -6% | 417 -64% | 407 -65% | 505 -56% |
| Colorchecker dE 2000 * | 4.5 | 4.5 -0% | 10.9 -142% | 10.02 -123% | 4.51 -0% |
| Colorchecker dE 2000 max. * | 10.5 | 10.5 -0% | 18.7 -78% | 15.93 -52% | 10.19 3% |
| Greyscale dE 2000 * | 4 | 3.5 12% | 13.3 -233% | 10.66 -167% | 2.91 27% |
| Gamma | 2.24 98% | 2.32 95% | 2.11 104% | 2.48 89% | 2.4 92% |
| CCT | 6387 102% | 6524 100% | 16030 41% | 11800 55% | 6740 96% |
| Color Space (Percent of AdobeRGB 1998) (%) | 55.3 | 42.04 -24% | 53.8 -3% | 39 -29% | 56 1% |
| Color Space (Percent of sRGB) (%) | 84.74 | 65.4 -23% | 83.4 -2% | 61 -28% | 86 1% |
| Total Average (Program / Settings) | -10% /
-9% | -23% /
-47% | -37% /
-50% | -5% /
-10% |
* ... smaller is better
Display Response Times
| ↔ Response Time Black to White | ||
|---|---|---|
| 26.4 ms ... rise ↗ and fall ↘ combined | ↗ 15.6 ms rise | 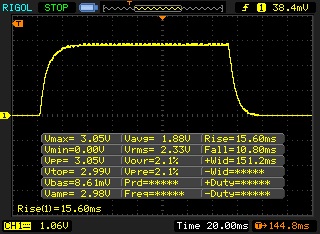 |
| ↘ 10.8 ms fall | ||
| The screen shows relatively slow response rates in our tests and may be too slow for gamers. In comparison, all tested devices range from 0.1 (minimum) to 240 (maximum) ms. » 66 % of all devices are better. This means that the measured response time is worse than the average of all tested devices (19.8 ms). | ||
| ↔ Response Time 50% Grey to 80% Grey | ||
| 36 ms ... rise ↗ and fall ↘ combined | ↗ 17.2 ms rise | 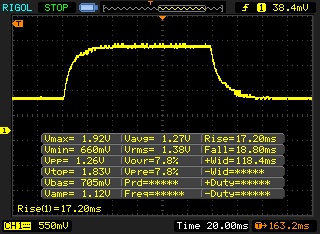 |
| ↘ 18.8 ms fall | ||
| The screen shows slow response rates in our tests and will be unsatisfactory for gamers. In comparison, all tested devices range from 0.165 (minimum) to 636 (maximum) ms. » 51 % of all devices are better. This means that the measured response time is worse than the average of all tested devices (31 ms). | ||
Screen Flickering / PWM (Pulse-Width Modulation)
| Screen flickering / PWM not detected | ||
In comparison: 52 % of all tested devices do not use PWM to dim the display. If PWM was detected, an average of 7754 (minimum: 5 - maximum: 343500) Hz was measured. | ||
| Cinebench R15 | |
| CPU Single 64Bit | |
| Fujitsu LifeBook U757 | |
| Lenovo ThinkPad T570-20H90002GE | |
| HP EliteBook 850 G4-Z2W86ET | |
| Dell Latitude 15 E5570 | |
| Acer TravelMate P658-M-537B | |
| CPU Multi 64Bit | |
| Fujitsu LifeBook U757 | |
| HP EliteBook 850 G4-Z2W86ET | |
| Lenovo ThinkPad T570-20H90002GE | |
| Dell Latitude 15 E5570 | |
| Acer TravelMate P658-M-537B | |
| PCMark 8 - Home Score Accelerated v2 | |
| HP EliteBook 850 G4-Z2W86ET | |
| Lenovo ThinkPad T570-20H90002GE | |
| Acer TravelMate P658-M-537B | |
| Fujitsu LifeBook U757 | |
| Dell Latitude 15 E5570 | |
| PCMark 8 Home Score Accelerated v2 | 3320 points | |
Help | ||
| Fujitsu LifeBook U757 Samsung CM871a MZNTY256HDHP | Lenovo ThinkPad T570-20H90002GE Samsung PM961 MZVLW256HEHP | HP EliteBook 850 G4-Z2W86ET Samsung PM951 NVMe MZVLV256 | Dell Latitude 15 E5570 Samsung SSD PM871 MZ7LN128HCHP | Acer TravelMate P658-M-537B Kingston RBU-SNS8152S3256GG2 | |
|---|---|---|---|---|---|
| CrystalDiskMark 3.0 | 98% | 34% | -26% | -20% | |
| Read Seq (MB/s) | 509 | 1318 159% | 1245 145% | 474.7 -7% | 479.1 -6% |
| Write Seq (MB/s) | 488.4 | 1166 139% | 298.6 -39% | 155 -68% | 333.1 -32% |
| Read 512 (MB/s) | 414.3 | 933 125% | 673 62% | 393.6 -5% | 418 1% |
| Write 512 (MB/s) | 321.7 | 860 167% | 298.8 -7% | 119.7 -63% | 320.5 0% |
| Read 4k (MB/s) | 36.43 | 56.6 55% | 41.79 15% | 34 -7% | 25.66 -30% |
| Write 4k (MB/s) | 88.4 | 130.6 48% | 138.4 57% | 96.6 9% | 64.7 -27% |
| Read 4k QD32 (MB/s) | 402.8 | 510 27% | 495 23% | 383.3 -5% | 226.2 -44% |
| Write 4k QD32 (MB/s) | 256.7 | 426.4 66% | 297.5 16% | 100.2 -61% | 211.4 -18% |

| 3DMark 11 - 1280x720 Performance GPU | |
| Lenovo ThinkPad T570-20H90002GE | |
| HP EliteBook 850 G4-Z2W86ET | |
| Acer TravelMate P658-M-537B | |
| Fujitsu LifeBook U757 | |
| Dell Latitude 15 E5570 | |
| 3DMark 11 Performance | 1436 points | |
Help | ||
| low | med. | high | ultra | |
|---|---|---|---|---|
| BioShock Infinite (2013) | 41.62 | 24.13 | 19.76 |
Noise level
| Idle |
| 28.2 / 28.2 / 28.2 dB(A) |
| Load |
| 33.3 / 34 dB(A) |
 | ||
30 dB silent 40 dB(A) audible 50 dB(A) loud |
||
min: | ||
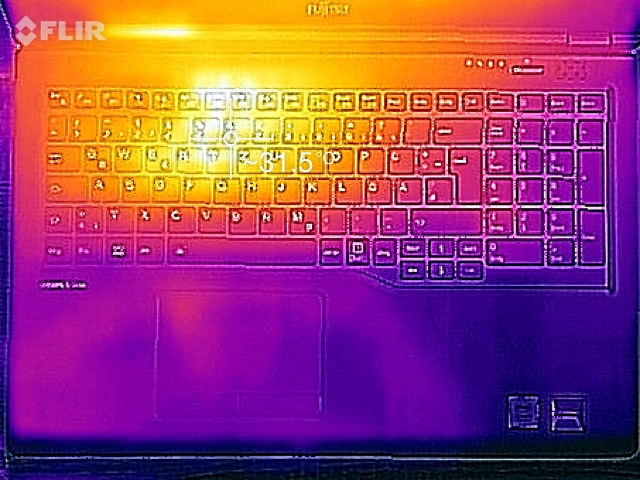
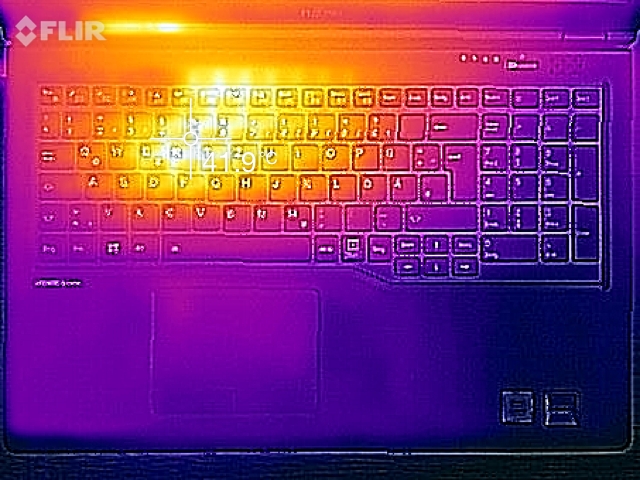
(±) The maximum temperature on the upper side is 42 °C / 108 F, compared to the average of 34.3 °C / 94 F, ranging from 21.2 to 62.5 °C for the class Office.
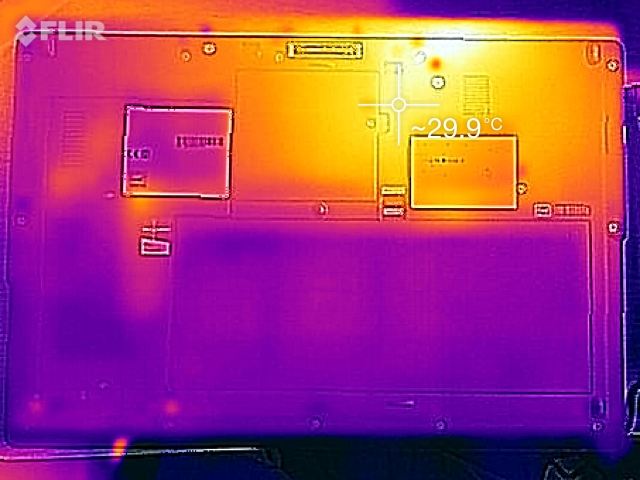
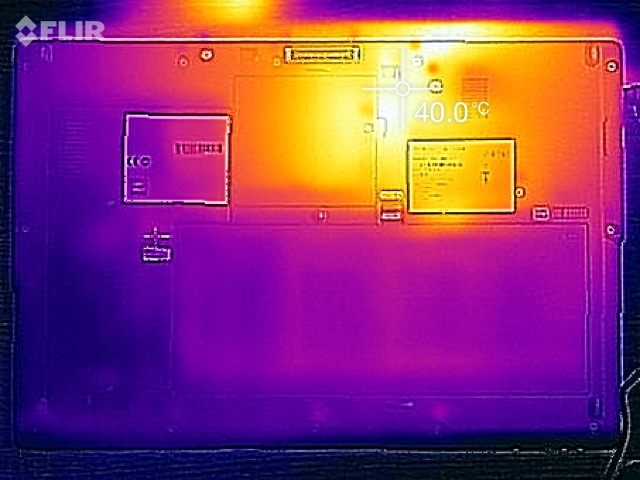
(+) The bottom heats up to a maximum of 38.8 °C / 102 F, compared to the average of 36.8 °C / 98 F
(+) In idle usage, the average temperature for the upper side is 23.6 °C / 74 F, compared to the device average of 29.5 °C / 85 F.
(+) The palmrests and touchpad are cooler than skin temperature with a maximum of 23.3 °C / 73.9 F and are therefore cool to the touch.
(+) The average temperature of the palmrest area of similar devices was 27.5 °C / 81.5 F (+4.2 °C / 7.6 F).
Fujitsu LifeBook U757 audio analysis
(-) | not very loud speakers (68 dB)
Bass 100 - 315 Hz
(-) | nearly no bass - on average 16.4% lower than median
(±) | linearity of bass is average (7.5% delta to prev. frequency)
Mids 400 - 2000 Hz
(±) | higher mids - on average 5.5% higher than median
(±) | linearity of mids is average (9.7% delta to prev. frequency)
Highs 2 - 16 kHz
(+) | balanced highs - only 4.4% away from median
(±) | linearity of highs is average (8.7% delta to prev. frequency)
Overall 100 - 16.000 Hz
(±) | linearity of overall sound is average (26.6% difference to median)
Compared to same class
» 82% of all tested devices in this class were better, 6% similar, 12% worse
» The best had a delta of 7%, average was 21%, worst was 53%
Compared to all devices tested
» 82% of all tested devices were better, 3% similar, 15% worse
» The best had a delta of 4%, average was 23%, worst was 134%
Apple MacBook 12 (Early 2016) 1.1 GHz audio analysis
(+) | speakers can play relatively loud (83.6 dB)
Bass 100 - 315 Hz
(±) | reduced bass - on average 11.3% lower than median
(±) | linearity of bass is average (14.2% delta to prev. frequency)
Mids 400 - 2000 Hz
(+) | balanced mids - only 2.4% away from median
(+) | mids are linear (5.5% delta to prev. frequency)
Highs 2 - 16 kHz
(+) | balanced highs - only 2% away from median
(+) | highs are linear (4.5% delta to prev. frequency)
Overall 100 - 16.000 Hz
(+) | overall sound is linear (10.2% difference to median)
Compared to same class
» 7% of all tested devices in this class were better, 2% similar, 90% worse
» The best had a delta of 5%, average was 18%, worst was 53%
Compared to all devices tested
» 5% of all tested devices were better, 1% similar, 94% worse
» The best had a delta of 4%, average was 23%, worst was 134%
| Off / Standby | |
| Idle | |
| Load |
|
Key:
min: | |
| Fujitsu LifeBook U757 HD Graphics 620, i5-7200U, Samsung CM871a MZNTY256HDHP | Lenovo ThinkPad T570-20H90002GE HD Graphics 620, i5-7200U, Samsung PM961 MZVLW256HEHP | HP EliteBook 850 G4-Z2W86ET HD Graphics 620, i5-7200U, Samsung PM951 NVMe MZVLV256 | Dell Latitude 15 E5570 HD Graphics 520, 6300U, Samsung SSD PM871 MZ7LN128HCHP | Acer TravelMate P658-M-537B HD Graphics 520, 6200U, Kingston RBU-SNS8152S3256GG2 | |
|---|---|---|---|---|---|
| Power Consumption | -7% | 6% | -1% | -36% | |
| Idle Minimum * (Watt) | 3.96 | 3.6 9% | 3.58 10% | 4.5 -14% | 6.6 -67% |
| Idle Average * (Watt) | 7.74 | 7.7 1% | 5.97 23% | 7.6 2% | 10.4 -34% |
| Idle Maximum * (Watt) | 8.64 | 8.2 5% | 6.81 21% | 8.7 -1% | 12.7 -47% |
| Load Average * (Watt) | 28.8 | 30.8 -7% | 29.4 -2% | 28.5 1% | 36 -25% |
| Load Maximum * (Watt) | 32 | 46.1 -44% | 39.7 -24% | 29.2 9% | 35 -9% |
* ... smaller is better
| Battery Runtime - WiFi Websurfing | |
| Dell Latitude 15 E5570 | |
| HP EliteBook 850 G4-Z2W86ET | |
| Acer TravelMate P658-M-537B | |
| Lenovo ThinkPad T570-20H90002GE | |
| Fujitsu LifeBook U757 | |
Pros
Cons

我们所评测的这两个新的Lifebook U笔记本非常相似。U757在某种程度上可以说是U747 的一个尺寸更大的版本,因此它继承了原本型号的优缺点:良好的屏幕,舒适的键盘,优秀的外壳。触摸板变化很大。U757的风扇噪音对比尺寸较小的型号有所优化,但同时也可能会产生来自固态硬盘的噪声。
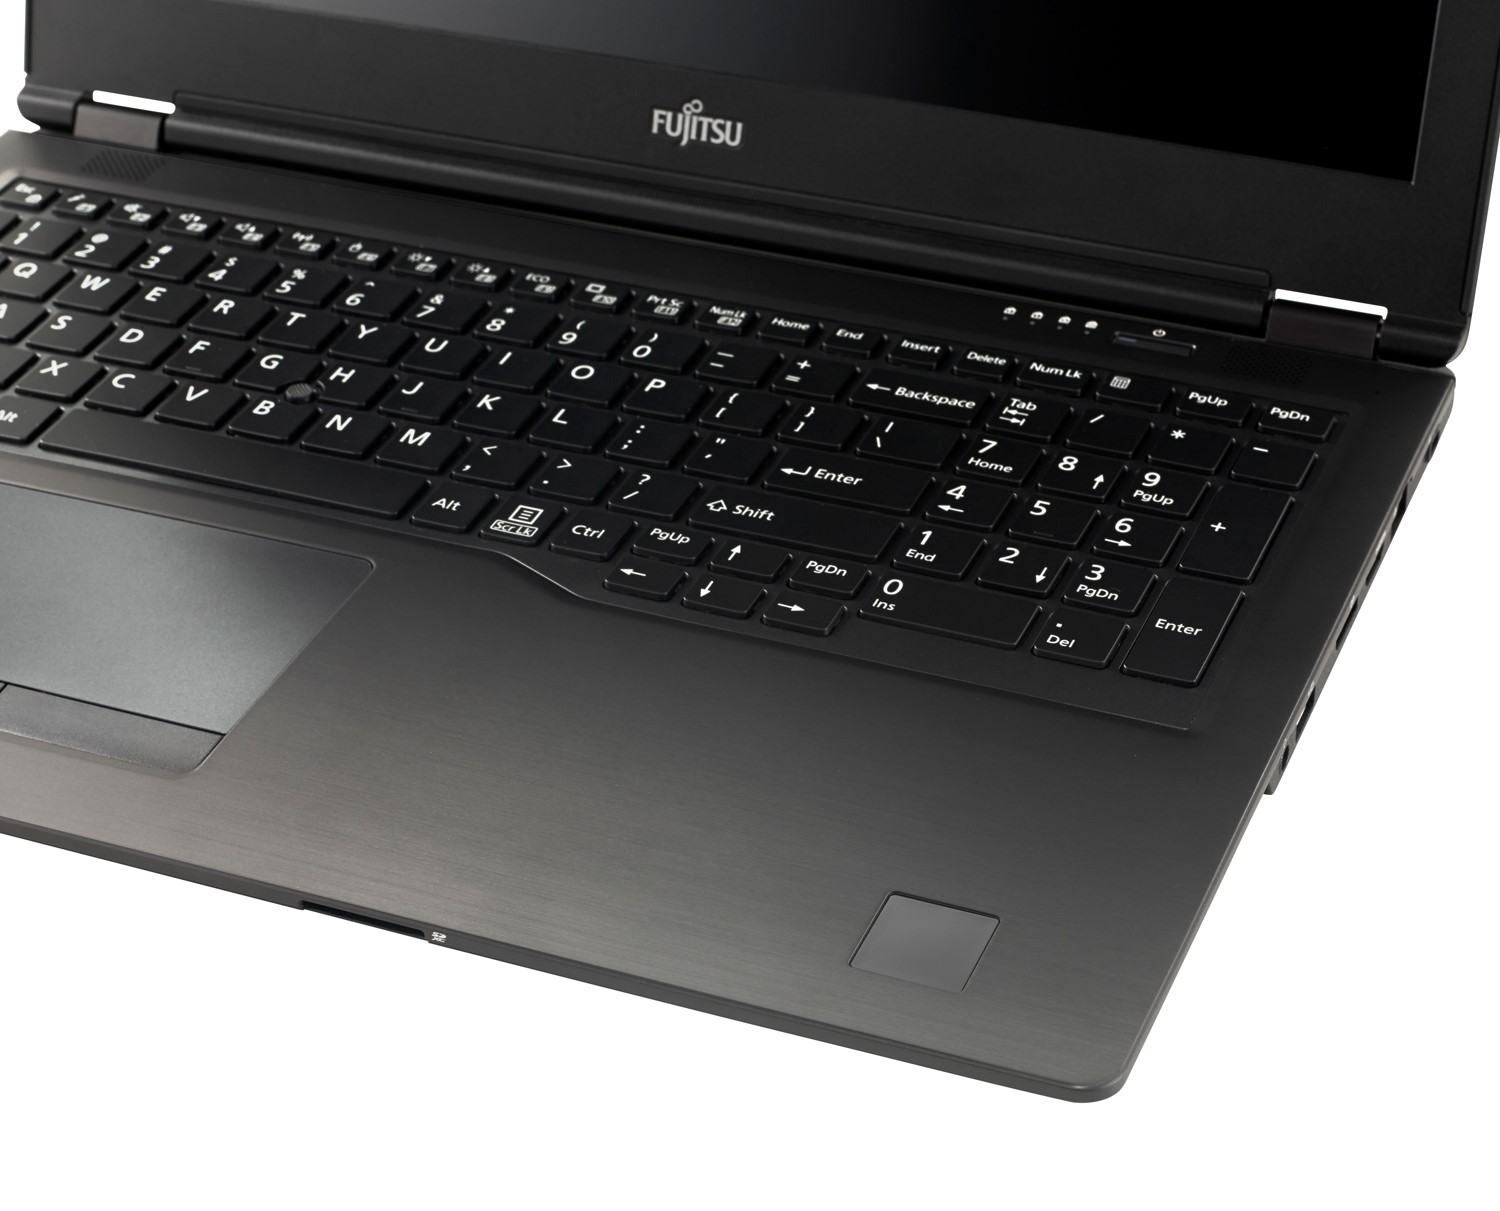
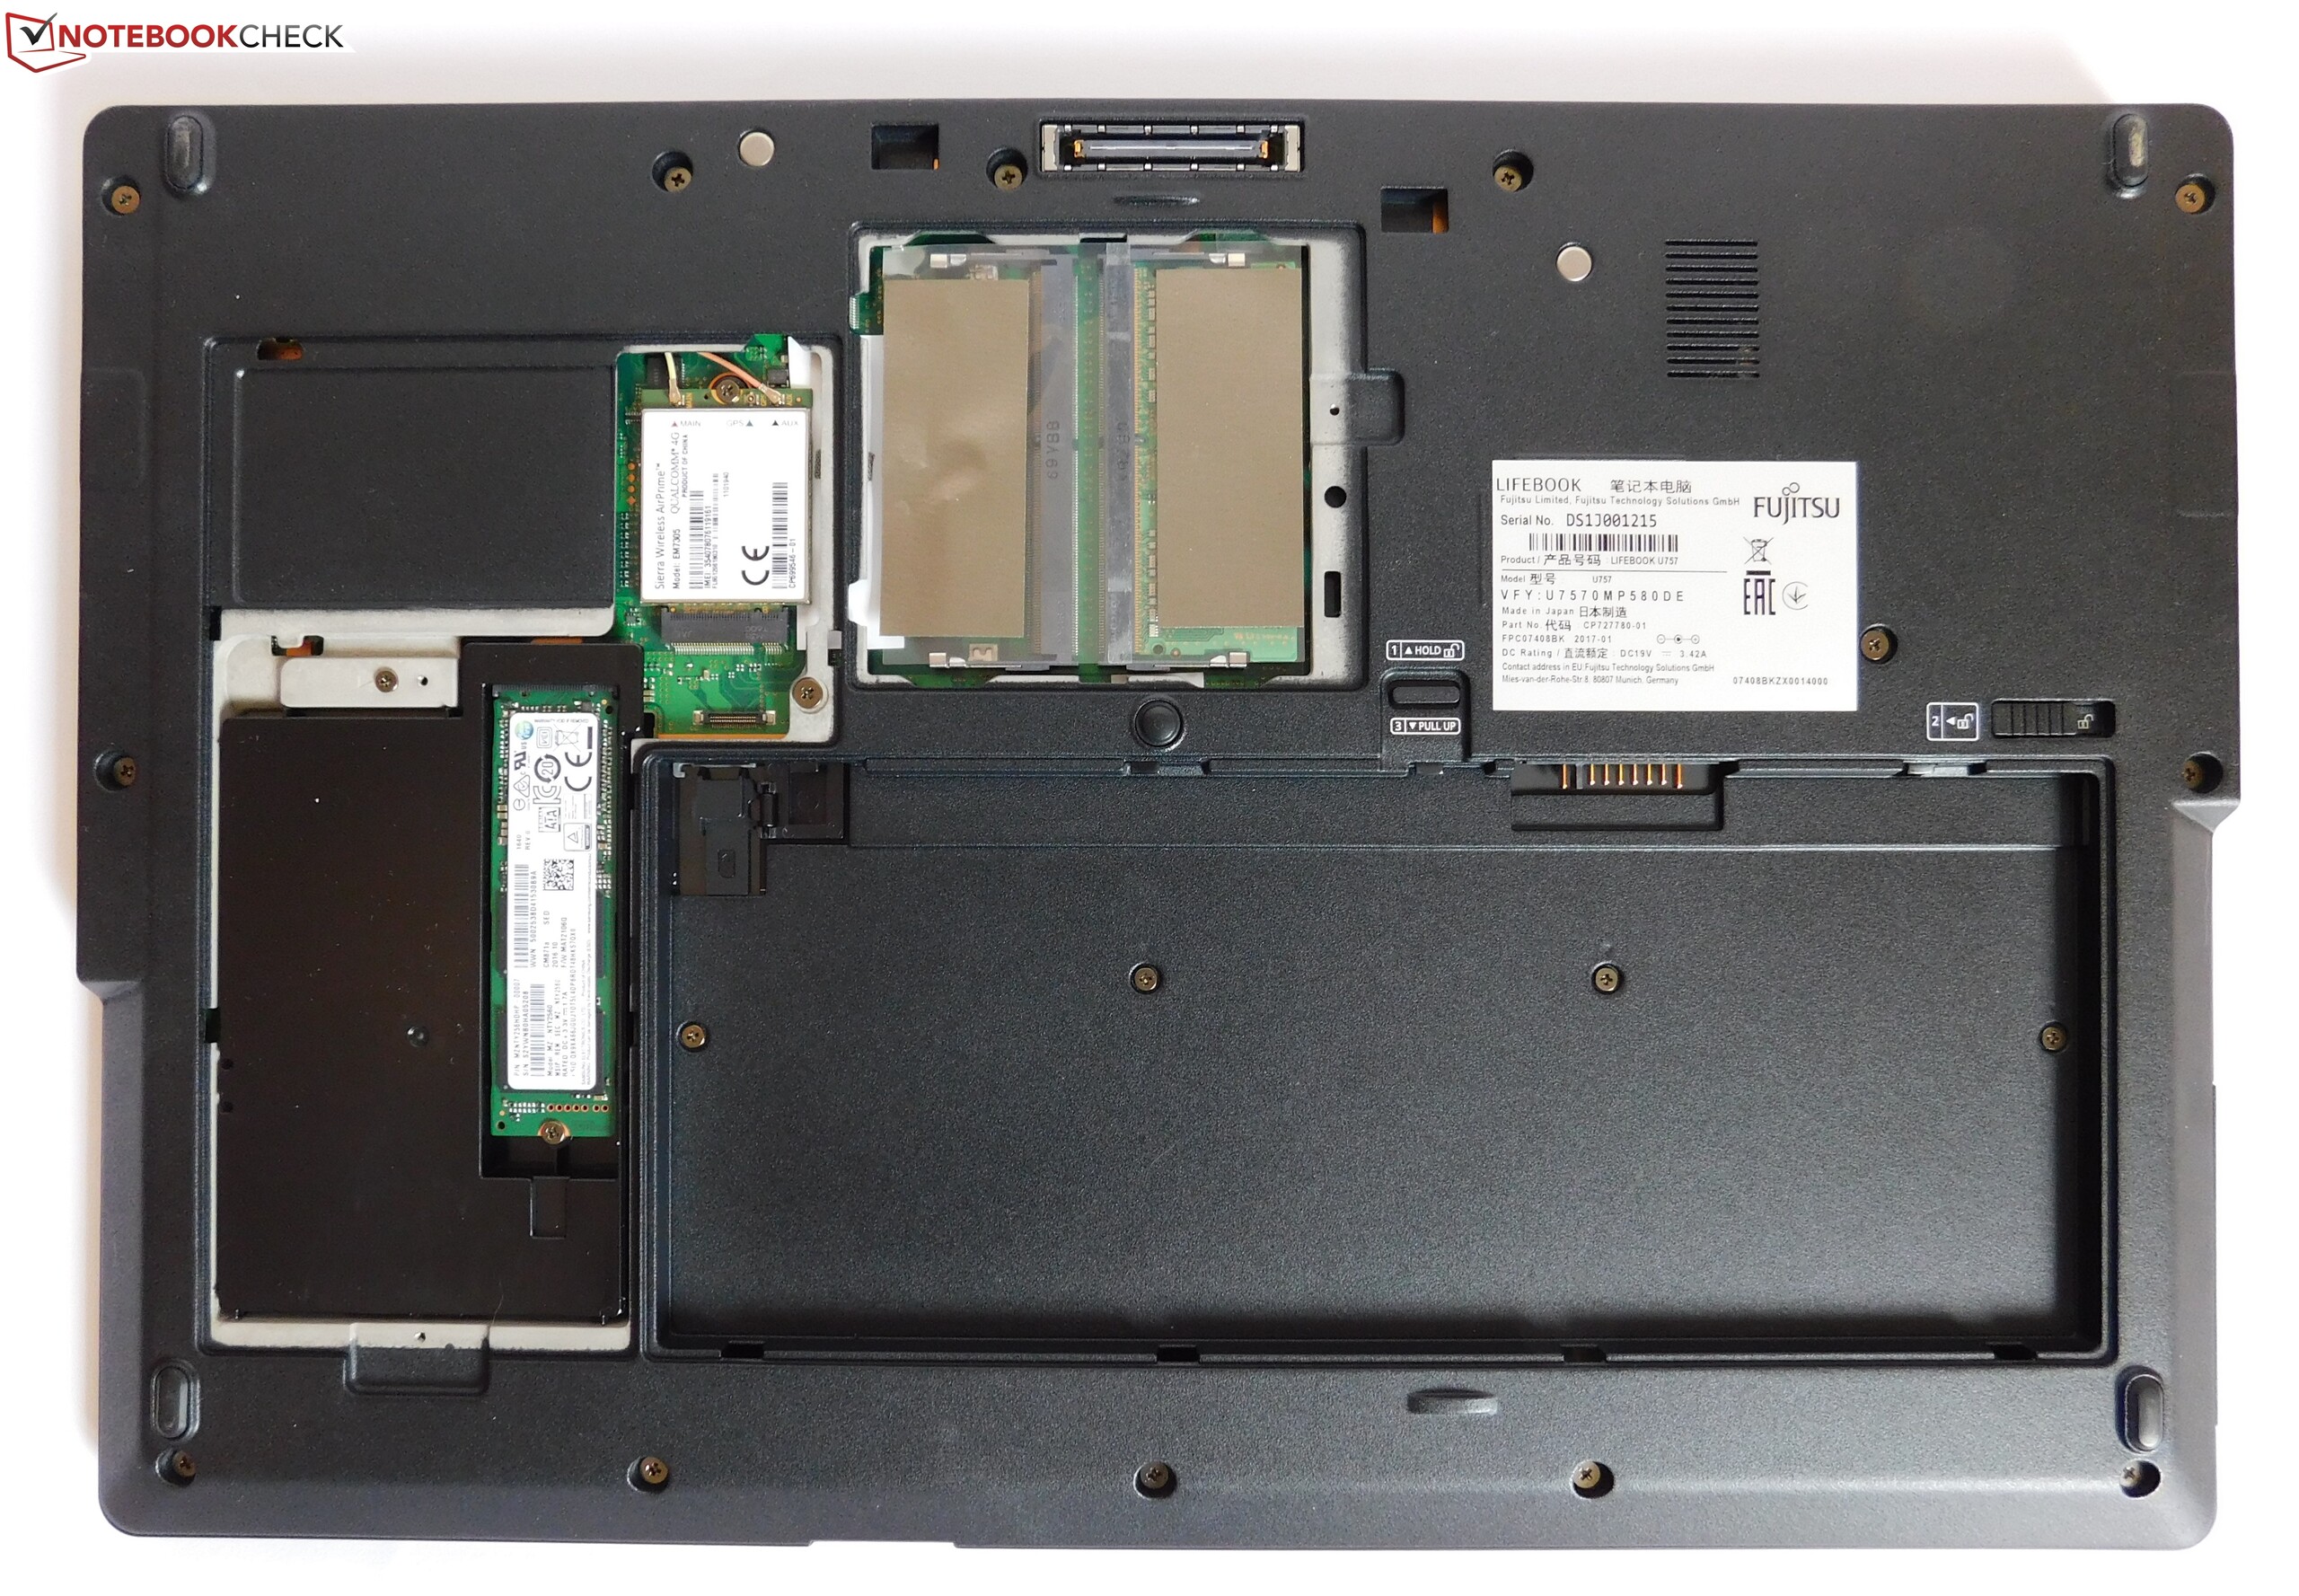
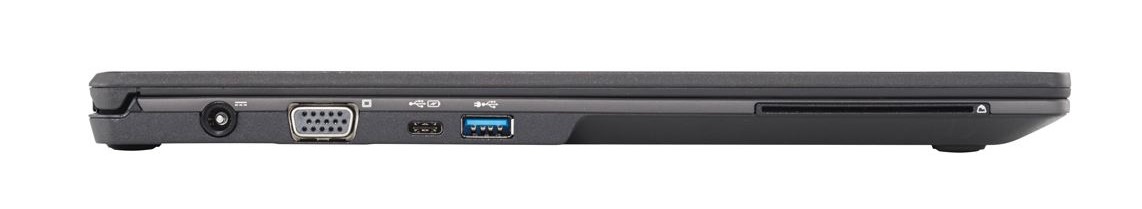
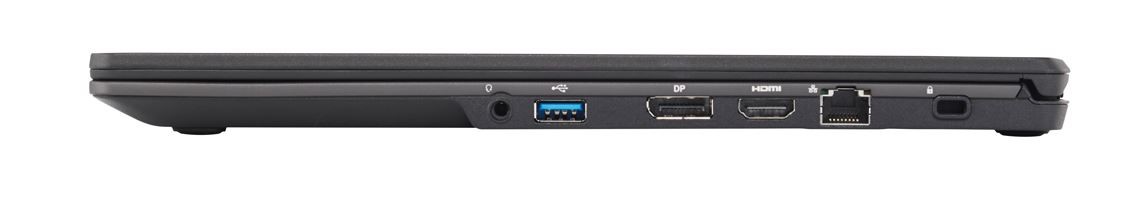
与较小型号相比,U757最大的缺点在于,富士通并没有真正利用这个机会让15英寸机型独特化,没有有效地利用更大尺寸带来的优势。数字键盘,一个可选的2.5英寸机械硬盘/固态硬盘插槽,另外一个HDMI接口和一个可选的(目前没有安装在任何德国机型上)的UHD屏幕:这些是U757与U747的差别。其实,在其他方面也可以做出改变:例如,对于15英寸商用笔记本电脑来说,两个USB Type-A接口相当薄弱,50瓦时的电池相对较小(与较小型号相同),鉴于拥有额外的空间,一个可以安装到U757中的专用显卡也应该被配备。然而,这也没有。
U757与其较小的原有机型没有做够的差异性。所以如果要在富士通的U系列中Lifebook中做选择时,我们推荐较小型号。其尺寸在日常使用中更加让人愉快。
因此,U757可以说是U747的加大版本。如果觉得LifeBook U系列的硬件条件有吸引力,买家应该选择U747. 更大的机型只的优势在于当需要数字小键盘和更大的屏幕。可选的超高清机型目前无法在德国获取。这个类别下,有一些设备也很有趣;特别是 ThinkPad T570 ,并且可能是一个强劲的对手。惠普Elitebook 850 G4 也是一个很好的竞争对手。
注:本文是基于完整评测的缩减版本,阅读完整的英文评测,请点击这里。
Fujitsu LifeBook U757
- 03/20/2017 v6 (old)
Benjamin Herzig