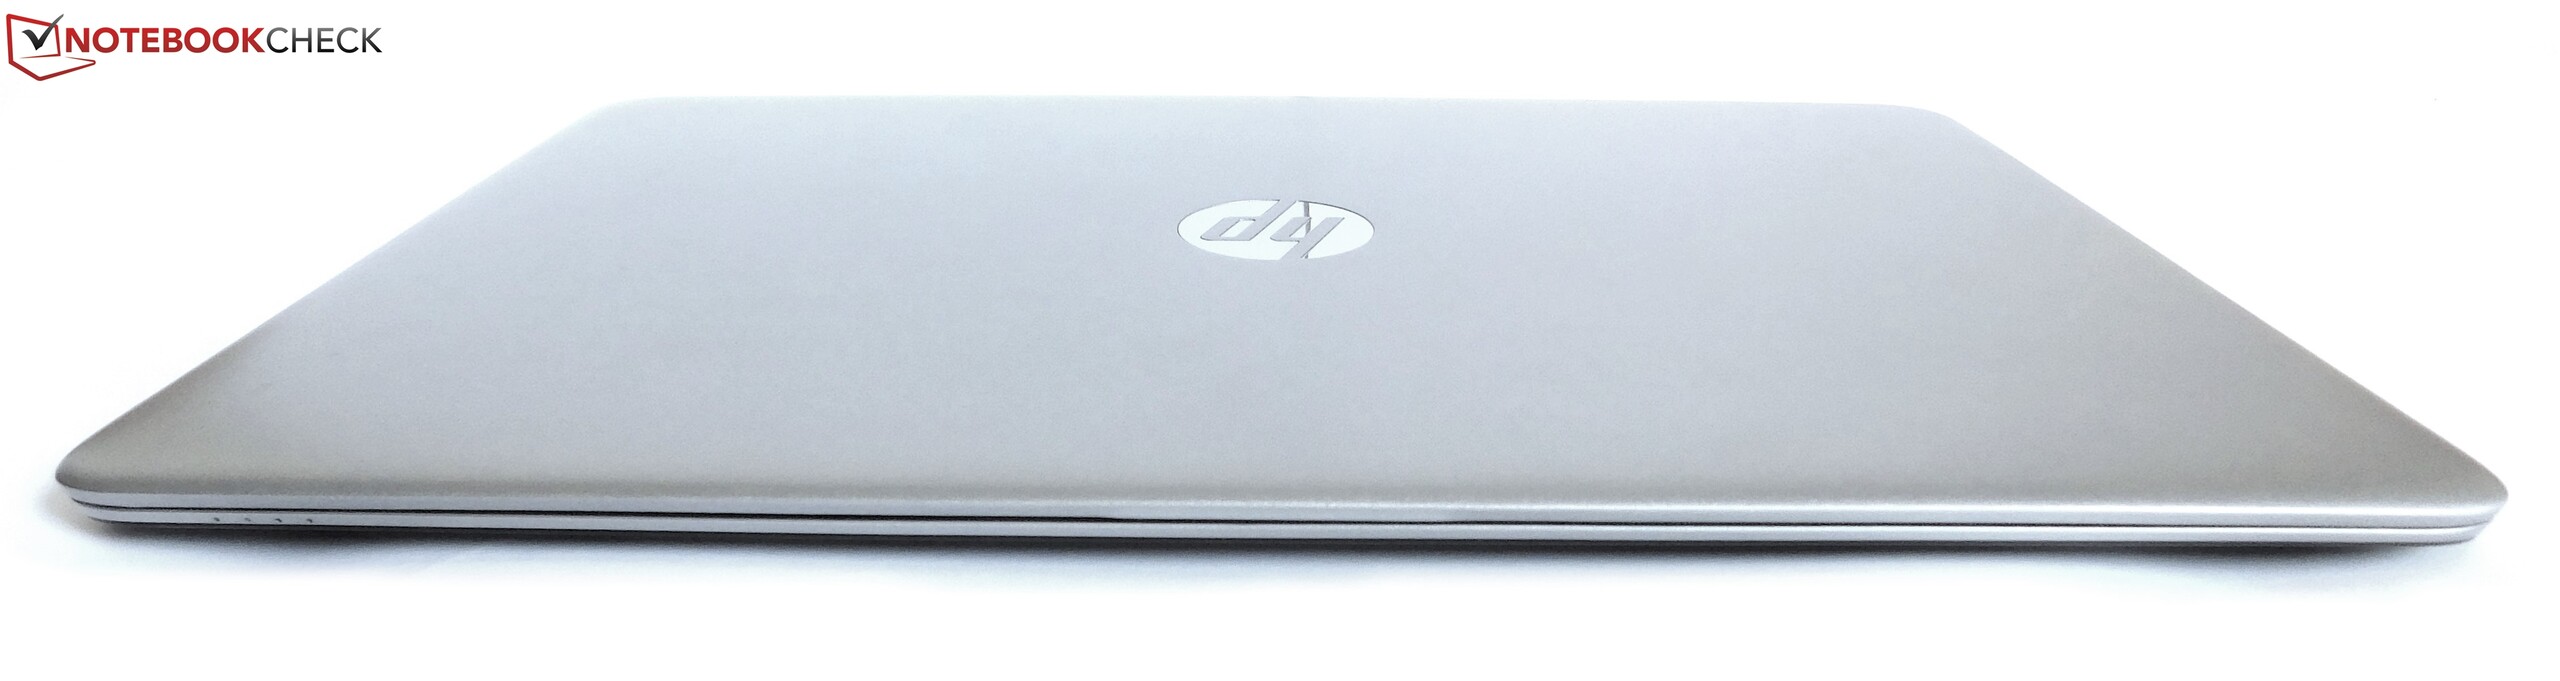
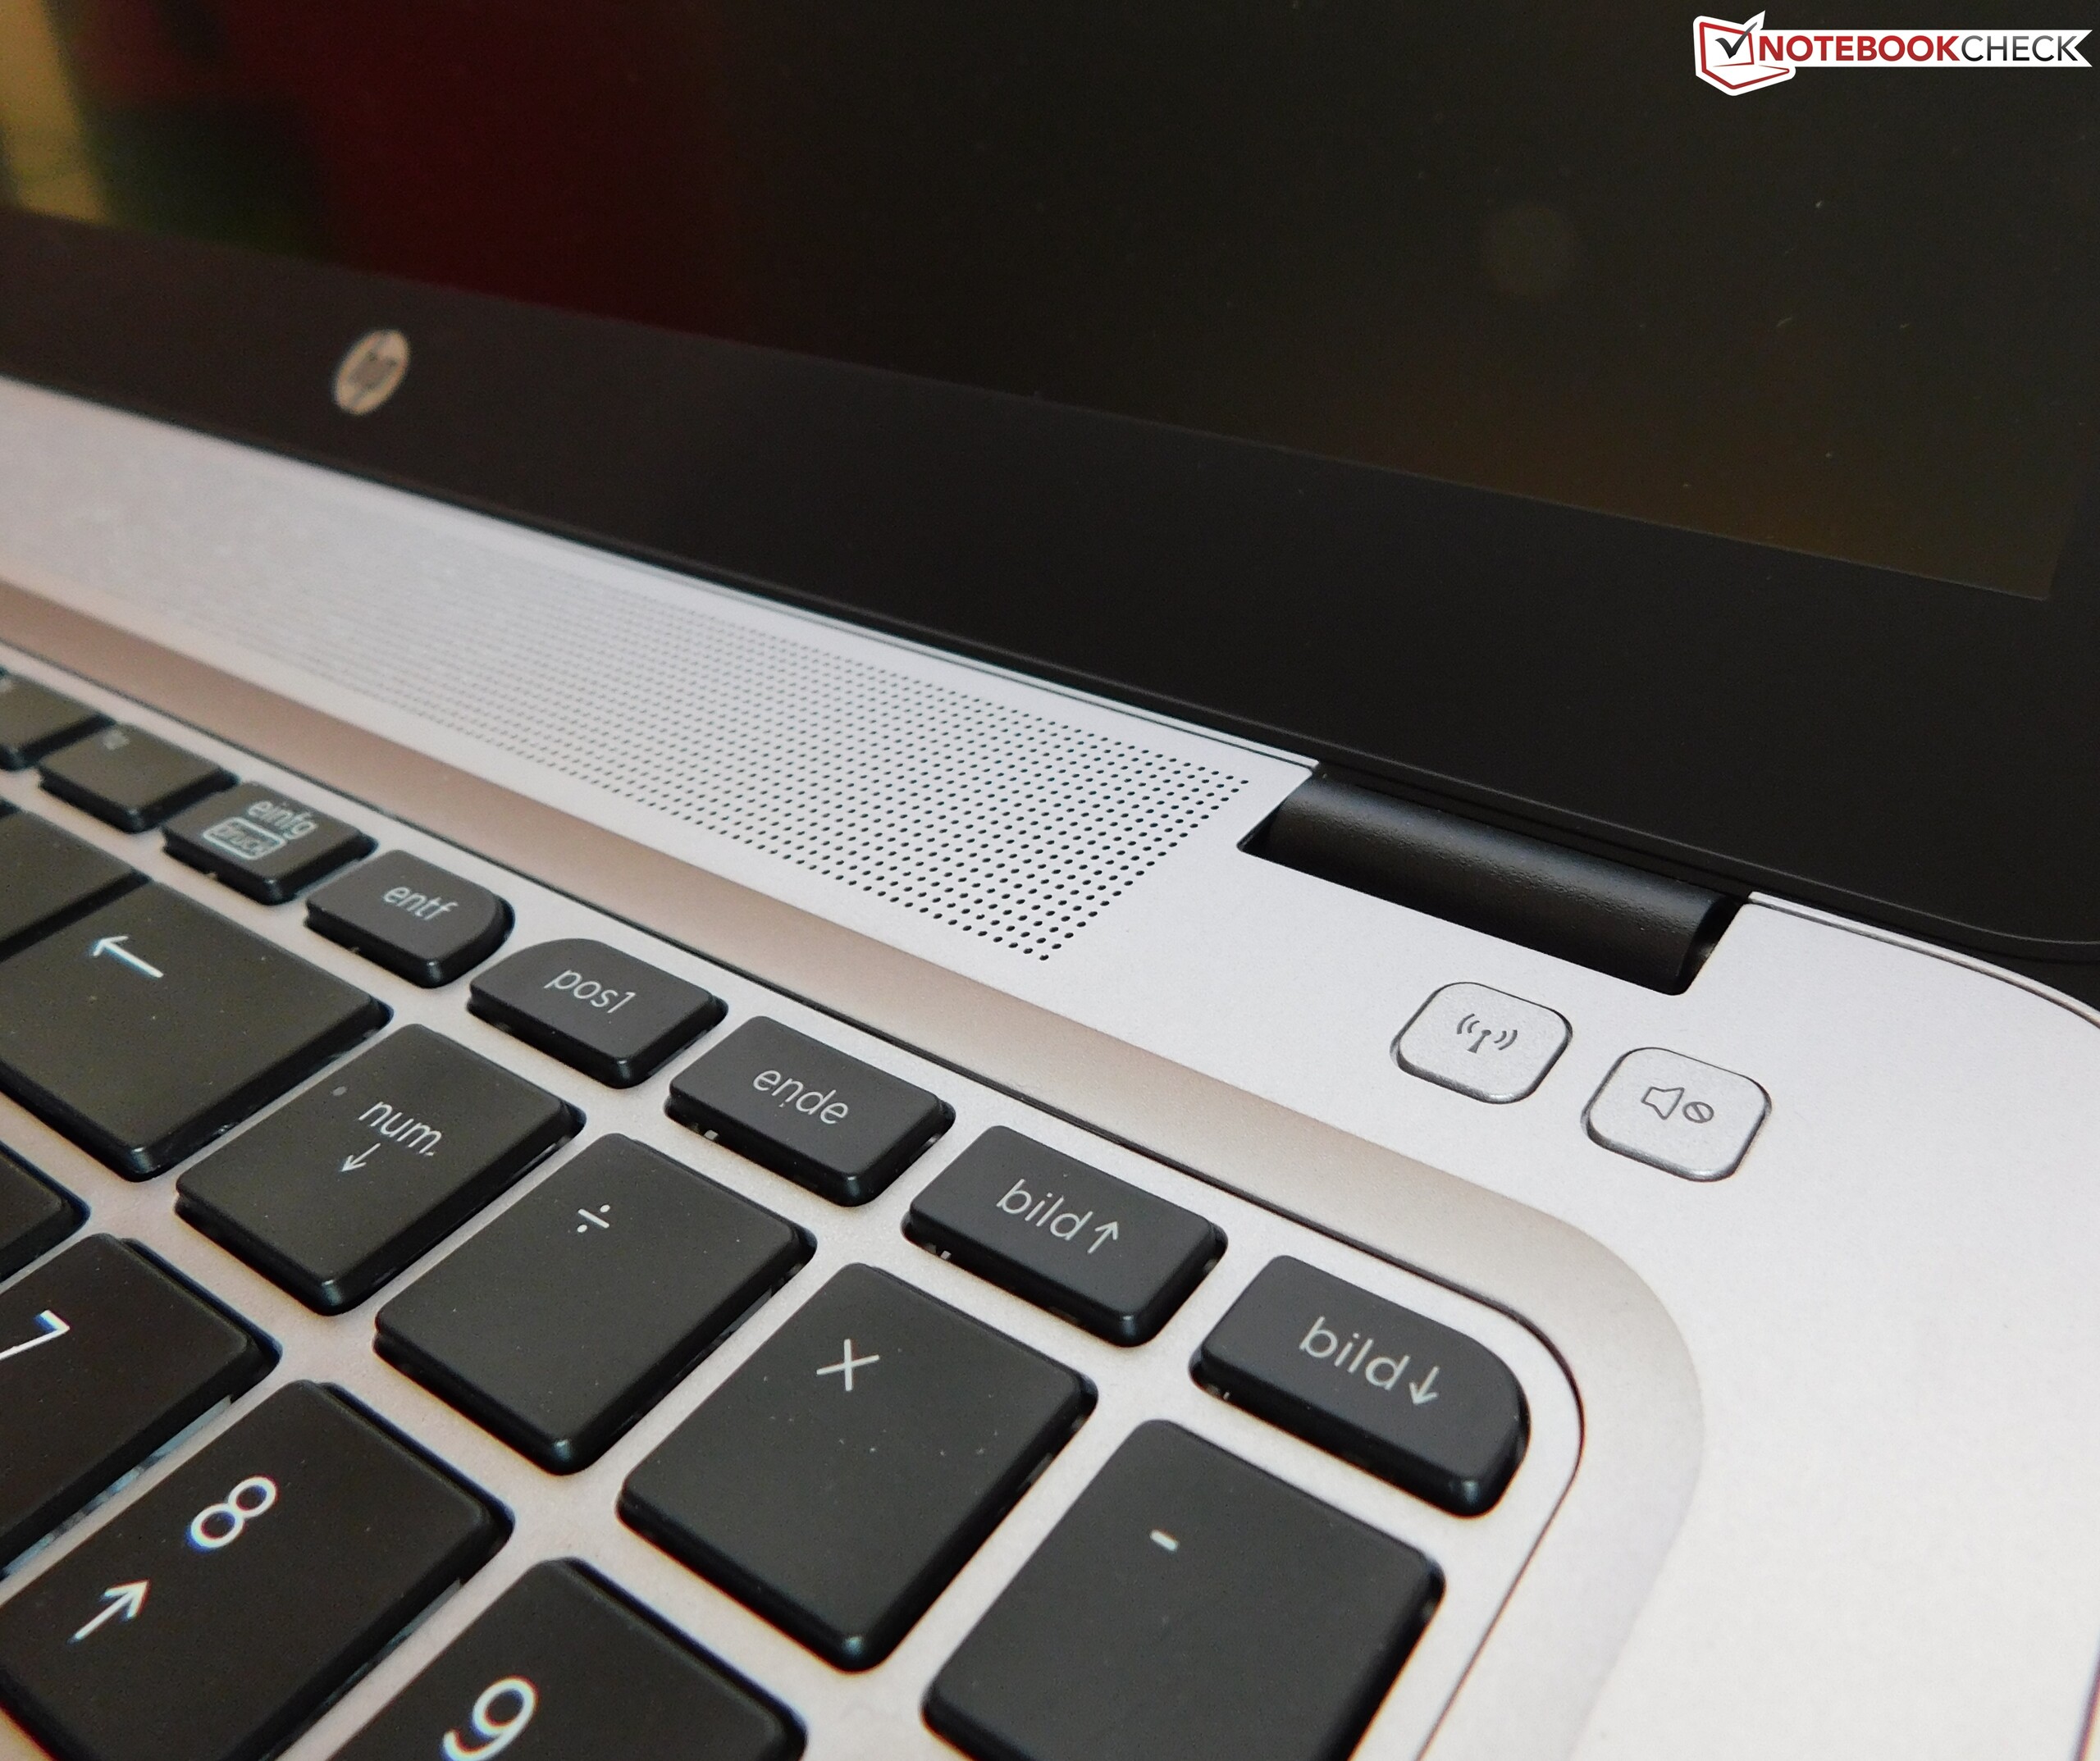
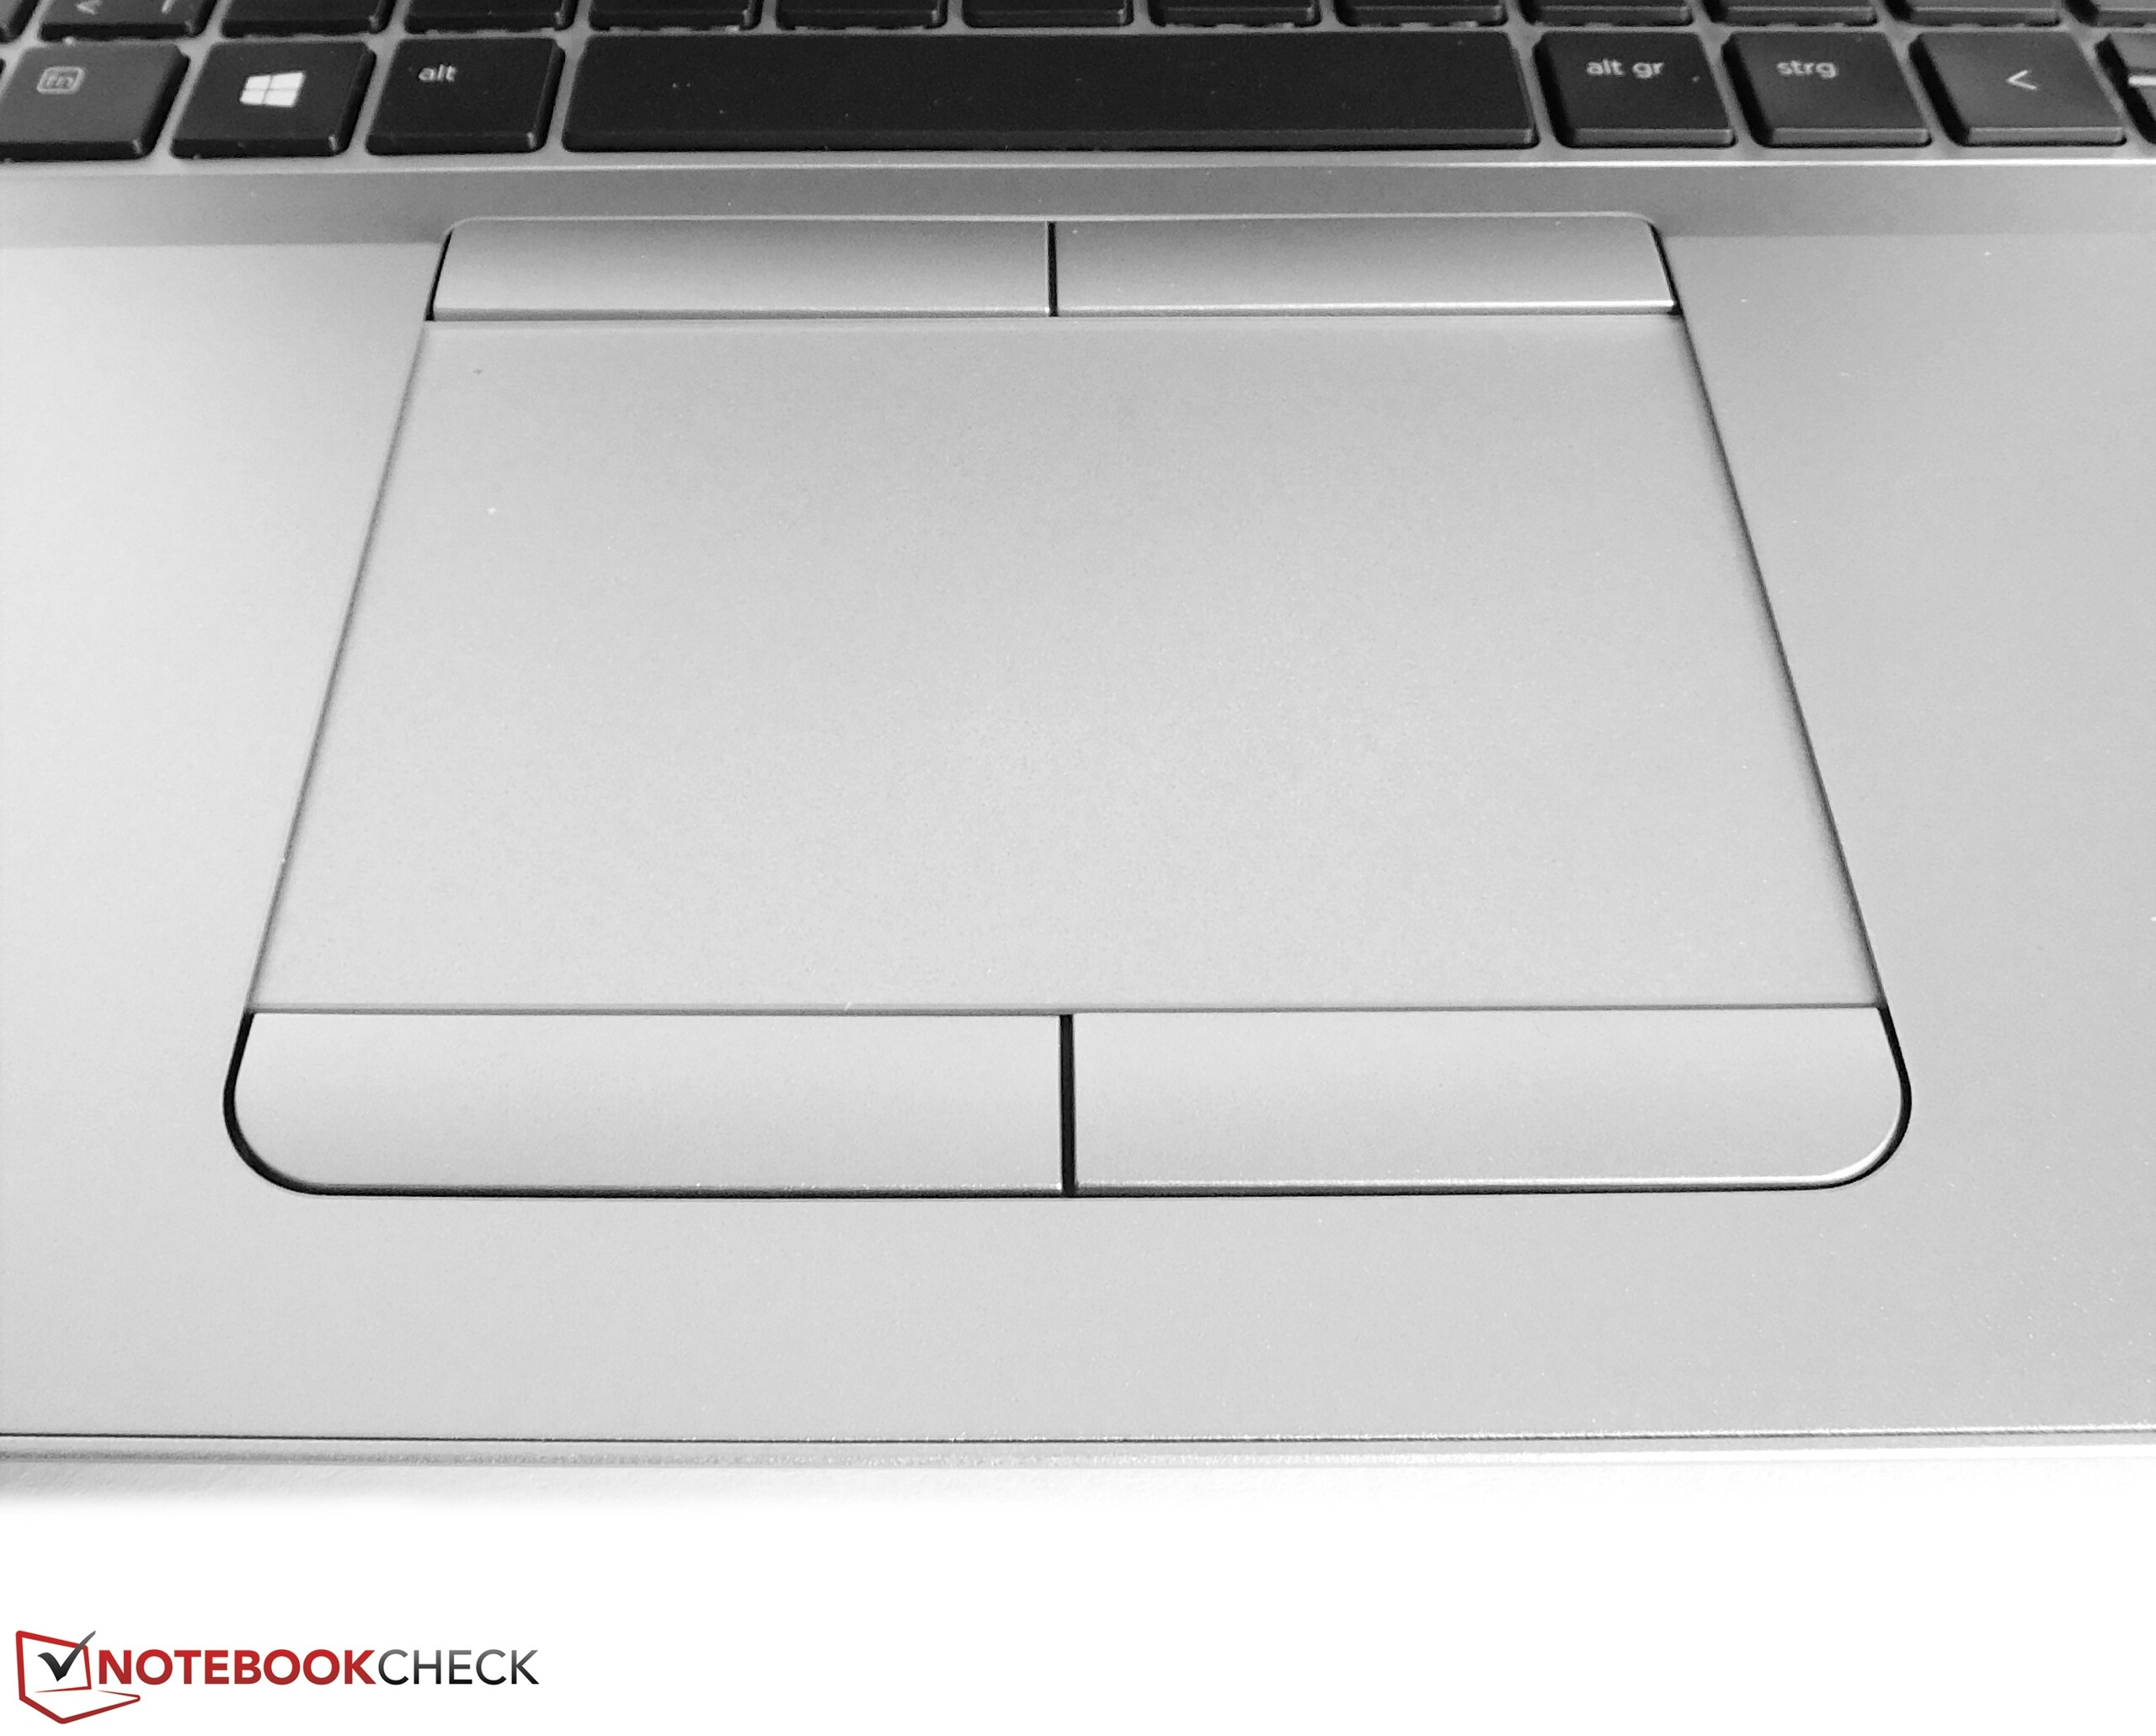
惠普 EliteBook 850 G4 (酷睿 i5, 全高清) 笔记本电脑简短评测
| SD Card Reader | |
| average JPG Copy Test (av. of 3 runs) | |
| Dell Latitude 15 E5570 | |
| Fujitsu LifeBook U757 | |
| Lenovo ThinkPad T570-20H90002GE | |
| HP EliteBook 850 G4-Z2W86ET | |
| Acer TravelMate P658-M-537B | |
| maximum AS SSD Seq Read Test (1GB) | |
| Lenovo ThinkPad T570-20H90002GE | |
| HP EliteBook 850 G4-Z2W86ET | |
| Fujitsu LifeBook U757 | |
| Networking | |
| iperf3 transmit AX12 | |
| Lenovo ThinkPad T570-20H90002GE | |
| HP EliteBook 850 G4-Z2W86ET | |
| Fujitsu LifeBook U757 | |
| iperf3 receive AX12 | |
| Fujitsu LifeBook U757 | |
| Lenovo ThinkPad T570-20H90002GE | |
| HP EliteBook 850 G4-Z2W86ET | |
| |||||||||||||||||||||||||
Brightness Distribution: 90 %
Center on Battery: 336 cd/m²
Contrast: 417:1 (Black: 0.81 cd/m²)
ΔE ColorChecker Calman: 10.9 | ∀{0.5-29.43 Ø4.71}
ΔE Greyscale Calman: 13.3 | ∀{0.09-98 Ø4.96}
83.4% sRGB (Argyll 1.6.3 3D)
53.8% AdobeRGB 1998 (Argyll 1.6.3 3D)
58.7% AdobeRGB 1998 (Argyll 3D)
83.7% sRGB (Argyll 3D)
56.8% Display P3 (Argyll 3D)
Gamma: 2.11
CCT: 16030 K
| HP EliteBook 850 G4-Z2W86ET AUO35ED, , 1920x1080, 15.6" | Lenovo ThinkPad T570-20H90002GE N156HCA-EAA, , 1920x1080, 15.6" | Fujitsu LifeBook U757 LP156WF6-SPP1, , 1920x1080, 15.6" | Acer TravelMate P658-M-537B LG Philips LGD04D5 / LG Display LP156WF6-SPP1, , 1920x1080, 15.6" | Dell Latitude 15 E5570 LG Philips 156WHU, , 1366x768, 15.6" | HP EliteBook 850 G3 AU Optronics, , 1920x1080, 15.6" | |
|---|---|---|---|---|---|---|
| Display | -22% | 8% | 9% | -28% | -5% | |
| Display P3 Coverage (%) | 56.8 | 44.08 -22% | 65.8 16% | 66.6 17% | 40.48 -29% | 54.2 -5% |
| sRGB Coverage (%) | 83.7 | 65.6 -22% | 84.8 1% | 85.7 2% | 60.9 -27% | 79.3 -5% |
| AdobeRGB 1998 Coverage (%) | 58.7 | 45.66 -22% | 62 6% | 62.8 7% | 41.82 -29% | 56 -5% |
| Response Times | -13% | -25% | -23% | -39% | -39% | |
| Response Time Grey 50% / Grey 80% * (ms) | 47.2 ? | 41.6 ? 12% | 36 ? 24% | 38 ? 19% | 47 ? -0% | 46.4 ? 2% |
| Response Time Black / White * (ms) | 15.2 ? | 20.8 ? -37% | 26.4 ? -74% | 25 ? -64% | 27 ? -78% | 27.2 ? -79% |
| PWM Frequency (Hz) | 199.2 ? | 26040 ? | 200 ? | |||
| Screen | 31% | 40% | 20% | -5% | 7% | |
| Brightness middle (cd/m²) | 338 | 262 -22% | 313 -7% | 308 -9% | 228 -33% | 290 -14% |
| Brightness (cd/m²) | 341 | 245 -28% | 294 -14% | 319 -6% | 236 -31% | 287 -16% |
| Brightness Distribution (%) | 90 | 89 -1% | 84 -7% | 71 -21% | 90 0% | 85 -6% |
| Black Level * (cd/m²) | 0.81 | 0.24 70% | 0.27 67% | 0.61 25% | 0.56 31% | 0.54 33% |
| Contrast (:1) | 417 | 1092 162% | 1159 178% | 505 21% | 407 -2% | 537 29% |
| Colorchecker dE 2000 * | 10.9 | 4.5 59% | 4.5 59% | 4.51 59% | 10.02 8% | 9.7 11% |
| Colorchecker dE 2000 max. * | 18.7 | 10.5 44% | 10.5 44% | 10.19 46% | 15.93 15% | 14.39 23% |
| Greyscale dE 2000 * | 13.3 | 3.5 74% | 4 70% | 2.91 78% | 10.66 20% | 10.83 19% |
| Gamma | 2.11 104% | 2.32 95% | 2.24 98% | 2.4 92% | 2.48 89% | 2.91 76% |
| CCT | 16030 41% | 6524 100% | 6387 102% | 6740 96% | 11800 55% | 12761 51% |
| Color Space (Percent of AdobeRGB 1998) (%) | 53.8 | 42.04 -22% | 55.3 3% | 56 4% | 39 -28% | 51.15 -5% |
| Color Space (Percent of sRGB) (%) | 83.4 | 65.4 -22% | 84.74 2% | 86 3% | 61 -27% | 78.96 -5% |
| Total Average (Program / Settings) | -1% /
15% | 8% /
25% | 2% /
12% | -24% /
-14% | -12% /
-2% |
* ... smaller is better
Display Response Times
| ↔ Response Time Black to White | ||
|---|---|---|
| 15.2 ms ... rise ↗ and fall ↘ combined | ↗ 10 ms rise | 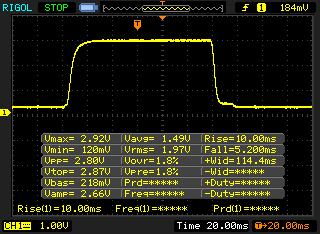 |
| ↘ 5.2 ms fall | ||
| The screen shows good response rates in our tests, but may be too slow for competitive gamers. In comparison, all tested devices range from 0.1 (minimum) to 240 (maximum) ms. » 37 % of all devices are better. This means that the measured response time is better than the average of all tested devices (19.8 ms). | ||
| ↔ Response Time 50% Grey to 80% Grey | ||
| 47.2 ms ... rise ↗ and fall ↘ combined | ↗ 26.8 ms rise | 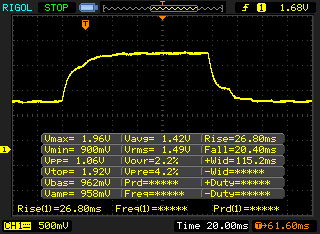 |
| ↘ 20.4 ms fall | ||
| The screen shows slow response rates in our tests and will be unsatisfactory for gamers. In comparison, all tested devices range from 0.165 (minimum) to 636 (maximum) ms. » 82 % of all devices are better. This means that the measured response time is worse than the average of all tested devices (30.9 ms). | ||
Screen Flickering / PWM (Pulse-Width Modulation)
| Screen flickering / PWM detected | 199.2 Hz | ≤ 50 % brightness setting | 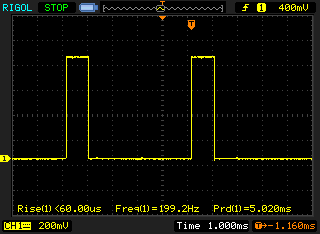 |
The display backlight flickers at 199.2 Hz (worst case, e.g., utilizing PWM) Flickering detected at a brightness setting of 50 % and below. There should be no flickering or PWM above this brightness setting. The frequency of 199.2 Hz is relatively low, so sensitive users will likely notice flickering and experience eyestrain at the stated brightness setting and below. In comparison: 52 % of all tested devices do not use PWM to dim the display. If PWM was detected, an average of 7748 (minimum: 5 - maximum: 343500) Hz was measured. | |||
| Cinebench R15 | |
| CPU Single 64Bit | |
| HP EliteBook 850 G3 | |
| Fujitsu LifeBook U757 | |
| Lenovo ThinkPad T570-20H90002GE | |
| HP EliteBook 850 G4-Z2W86ET | |
| Dell Latitude 15 E5570 | |
| Acer TravelMate P658-M-537B | |
| CPU Multi 64Bit | |
| Fujitsu LifeBook U757 | |
| HP EliteBook 850 G4-Z2W86ET | |
| Lenovo ThinkPad T570-20H90002GE | |
| HP EliteBook 850 G3 | |
| Dell Latitude 15 E5570 | |
| Acer TravelMate P658-M-537B | |
| PCMark 8 | |
| Home Score Accelerated v2 | |
| HP EliteBook 850 G4-Z2W86ET | |
| Lenovo ThinkPad T570-20H90002GE | |
| Acer TravelMate P658-M-537B | |
| Fujitsu LifeBook U757 | |
| Dell Latitude 15 E5570 | |
| Work Score Accelerated v2 | |
| Lenovo ThinkPad T570-20H90002GE | |
| Acer TravelMate P658-M-537B | |
| HP EliteBook 850 G4-Z2W86ET | |
| Dell Latitude 15 E5570 | |
| PCMark 8 Home Score Accelerated v2 | 3542 points | |
| PCMark 8 Work Score Accelerated v2 | 4330 points | |
Help | ||
| HP EliteBook 850 G4-Z2W86ET Samsung PM951 NVMe MZVLV256 | Lenovo ThinkPad T570-20H90002GE Samsung PM961 MZVLW256HEHP | Fujitsu LifeBook U757 Samsung CM871a MZNTY256HDHP | Acer TravelMate P658-M-537B Kingston RBU-SNS8152S3256GG2 | Dell Latitude 15 E5570 Samsung SSD PM871 MZ7LN128HCHP | |
|---|---|---|---|---|---|
| CrystalDiskMark 3.0 | 75% | -13% | -32% | -44% | |
| Read Seq (MB/s) | 1245 | 1318 6% | 509 -59% | 479.1 -62% | 474.7 -62% |
| Write Seq (MB/s) | 298.6 | 1166 290% | 488.4 64% | 333.1 12% | 155 -48% |
| Read 512 (MB/s) | 673 | 933 39% | 414.3 -38% | 418 -38% | 393.6 -42% |
| Write 512 (MB/s) | 298.8 | 860 188% | 321.7 8% | 320.5 7% | 119.7 -60% |
| Read 4k (MB/s) | 41.79 | 56.6 35% | 36.43 -13% | 25.66 -39% | 34 -19% |
| Write 4k (MB/s) | 138.4 | 130.6 -6% | 88.4 -36% | 64.7 -53% | 96.6 -30% |
| Read 4k QD32 (MB/s) | 495 | 510 3% | 402.8 -19% | 226.2 -54% | 383.3 -23% |
| Write 4k QD32 (MB/s) | 297.5 | 426.4 43% | 256.7 -14% | 211.4 -29% | 100.2 -66% |

| 3DMark 11 - 1280x720 Performance GPU | |
| Lenovo ThinkPad T570-20H90002GE | |
| HP EliteBook 850 G4-Z2W86ET | |
| Acer TravelMate P658-M-537B | |
| HP EliteBook 850 G3 | |
| Fujitsu LifeBook U757 | |
| Dell Latitude 15 E5570 | |
| 3DMark | |
| 1280x720 Cloud Gate Standard Graphics | |
| Lenovo ThinkPad T570-20H90002GE | |
| Acer TravelMate P658-M-537B | |
| HP EliteBook 850 G4-Z2W86ET | |
| Dell Latitude 15 E5570 | |
| HP EliteBook 850 G3 | |
| 1920x1080 Fire Strike Graphics | |
| Lenovo ThinkPad T570-20H90002GE | |
| HP EliteBook 850 G4-Z2W86ET | |
| HP EliteBook 850 G3 | |
| Dell Latitude 15 E5570 | |
| 3DMark 11 Performance | 1534 points | |
| 3DMark Cloud Gate Standard Score | 5666 points | |
| 3DMark Fire Strike Score | 748 points | |
Help | ||
| low | med. | high | ultra | |
|---|---|---|---|---|
| BioShock Infinite (2013) | 42.4 | 24.2 | 20.5 | |
| Company of Heroes 2 (2013) | 21.6 | |||
| Rise of the Tomb Raider (2016) | 17.7 |
Noise level
| Idle |
| 29 / 29 / 29 dB(A) |
| Load |
| 31 / 33.4 dB(A) |
 | ||
30 dB silent 40 dB(A) audible 50 dB(A) loud |
||
min: | ||
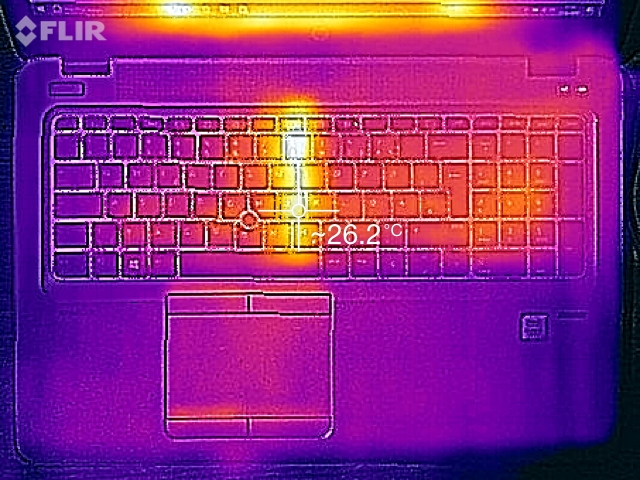
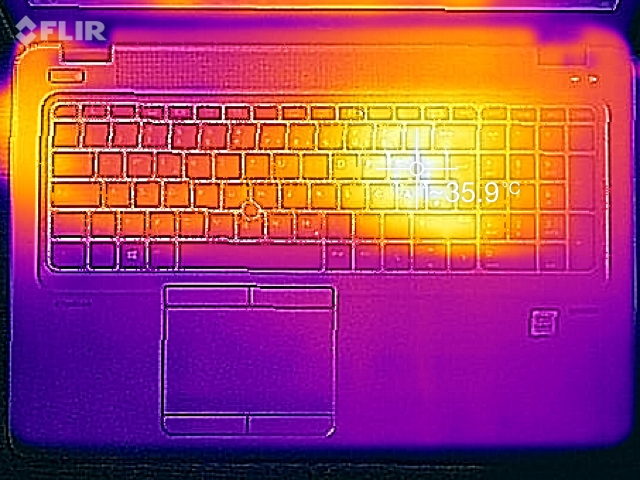
(+) The maximum temperature on the upper side is 37 °C / 99 F, compared to the average of 34.3 °C / 94 F, ranging from 21.2 to 62.5 °C for the class Office.
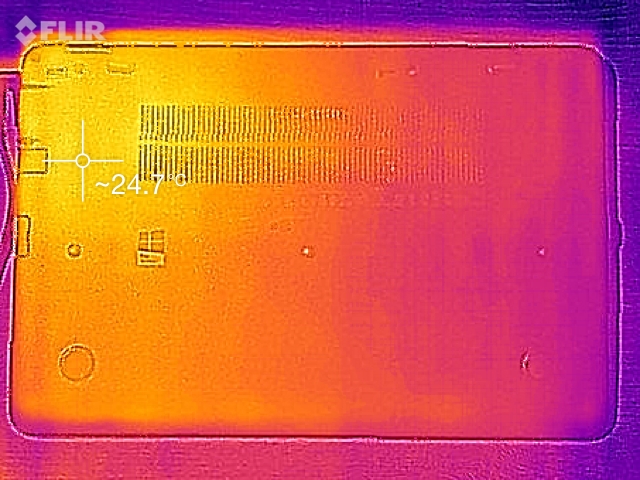
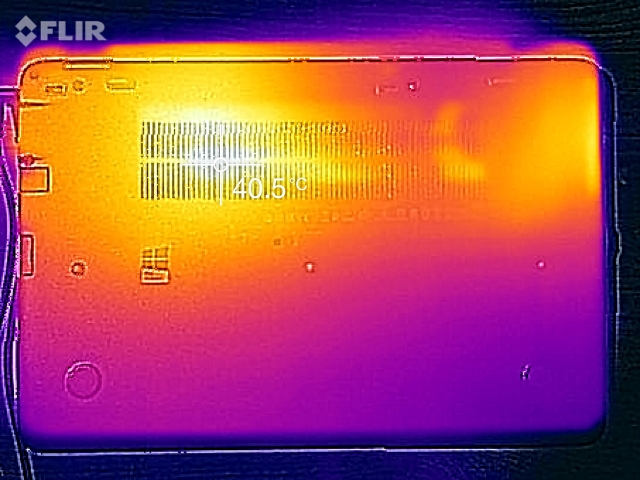
(±) The bottom heats up to a maximum of 41.1 °C / 106 F, compared to the average of 36.8 °C / 98 F
(+) In idle usage, the average temperature for the upper side is 21.8 °C / 71 F, compared to the device average of 29.5 °C / 85 F.
(+) The palmrests and touchpad are cooler than skin temperature with a maximum of 24.8 °C / 76.6 F and are therefore cool to the touch.
(+) The average temperature of the palmrest area of similar devices was 27.5 °C / 81.5 F (+2.7 °C / 4.9 F).
HP EliteBook 850 G4-Z2W86ET audio analysis
(±) | speaker loudness is average but good (74.6 dB)
Bass 100 - 315 Hz
(-) | nearly no bass - on average 15.5% lower than median
(±) | linearity of bass is average (11% delta to prev. frequency)
Mids 400 - 2000 Hz
(+) | balanced mids - only 1.7% away from median
(+) | mids are linear (3.8% delta to prev. frequency)
Highs 2 - 16 kHz
(+) | balanced highs - only 3.2% away from median
(±) | linearity of highs is average (7.6% delta to prev. frequency)
Overall 100 - 16.000 Hz
(±) | linearity of overall sound is average (17.7% difference to median)
Compared to same class
» 29% of all tested devices in this class were better, 6% similar, 65% worse
» The best had a delta of 7%, average was 21%, worst was 53%
Compared to all devices tested
» 35% of all tested devices were better, 8% similar, 57% worse
» The best had a delta of 4%, average was 23%, worst was 134%
Apple MacBook 12 (Early 2016) 1.1 GHz audio analysis
(+) | speakers can play relatively loud (83.6 dB)
Bass 100 - 315 Hz
(±) | reduced bass - on average 11.3% lower than median
(±) | linearity of bass is average (14.2% delta to prev. frequency)
Mids 400 - 2000 Hz
(+) | balanced mids - only 2.4% away from median
(+) | mids are linear (5.5% delta to prev. frequency)
Highs 2 - 16 kHz
(+) | balanced highs - only 2% away from median
(+) | highs are linear (4.5% delta to prev. frequency)
Overall 100 - 16.000 Hz
(+) | overall sound is linear (10.2% difference to median)
Compared to same class
» 7% of all tested devices in this class were better, 2% similar, 90% worse
» The best had a delta of 5%, average was 18%, worst was 53%
Compared to all devices tested
» 5% of all tested devices were better, 1% similar, 94% worse
» The best had a delta of 4%, average was 23%, worst was 134%
| Off / Standby | |
| Idle | |
| Load |
|
Key:
min: | |
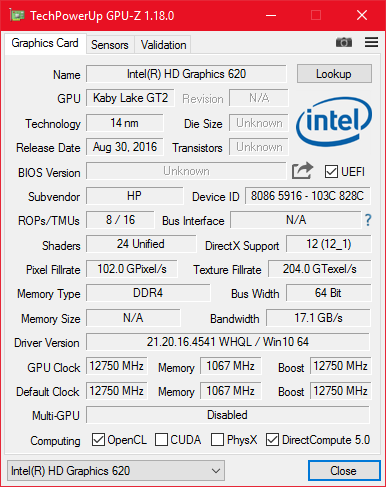
| HP EliteBook 850 G4-Z2W86ET i5-7200U, HD Graphics 620, TN LED, 1920x1080 | Lenovo ThinkPad T570-20H90002GE i5-7200U, HD Graphics 620, IPS, 1920x1080 | Fujitsu LifeBook U757 i5-7200U, HD Graphics 620, IPS LED, 1920x1080 | Acer TravelMate P658-M-537B 6200U, HD Graphics 520, IPS, 1920x1080 | Dell Latitude 15 E5570 6300U, HD Graphics 520, TN LED, 1366x768 | HP EliteBook 850 G3 6500U, HD Graphics 520, TN LED, 1920x1080 | |
|---|---|---|---|---|---|---|
| Power Consumption | -14% | -9% | -51% | -10% | -20% | |
| Idle Minimum * (Watt) | 3.58 | 3.6 -1% | 3.96 -11% | 6.6 -84% | 4.5 -26% | 5 -40% |
| Idle Average * (Watt) | 5.97 | 7.7 -29% | 7.74 -30% | 10.4 -74% | 7.6 -27% | 7.8 -31% |
| Idle Maximum * (Watt) | 6.81 | 8.2 -20% | 8.64 -27% | 12.7 -86% | 8.7 -28% | 8.4 -23% |
| Load Average * (Watt) | 29.4 | 30.8 -5% | 28.8 2% | 36 -22% | 28.5 3% | 28.8 2% |
| Load Maximum * (Watt) | 39.7 | 46.1 -16% | 32 19% | 35 12% | 29.2 26% | 43 -8% |
* ... smaller is better
| HP EliteBook 850 G4-Z2W86ET i5-7200U, HD Graphics 620, 51 Wh | Lenovo ThinkPad T570-20H90002GE i5-7200U, HD Graphics 620, 56 Wh | Fujitsu LifeBook U757 i5-7200U, HD Graphics 620, 50 Wh | Acer TravelMate P658-M-537B 6200U, HD Graphics 520, 55 Wh | Dell Latitude 15 E5570 6300U, HD Graphics 520, 62 Wh | HP EliteBook 850 G3 6500U, HD Graphics 520, 46 Wh | |
|---|---|---|---|---|---|---|
| Battery runtime | 3% | -17% | -16% | 4% | -20% | |
| Reader / Idle (h) | 18 | 19.5 8% | 14 -22% | 20.5 14% | 15.3 -15% | |
| H.264 (h) | 10.6 | 9.8 -8% | 9.5 -10% | 7.2 -32% | ||
| WiFi v1.3 (h) | 8.8 | 7.6 -14% | 7.3 -17% | 8.5 -3% | 10.5 19% | 7 -20% |
| Load (h) | 2.7 | 3.4 26% | 2.1 -22% | 2.5 -7% | 2.4 -11% |
Pros
Cons

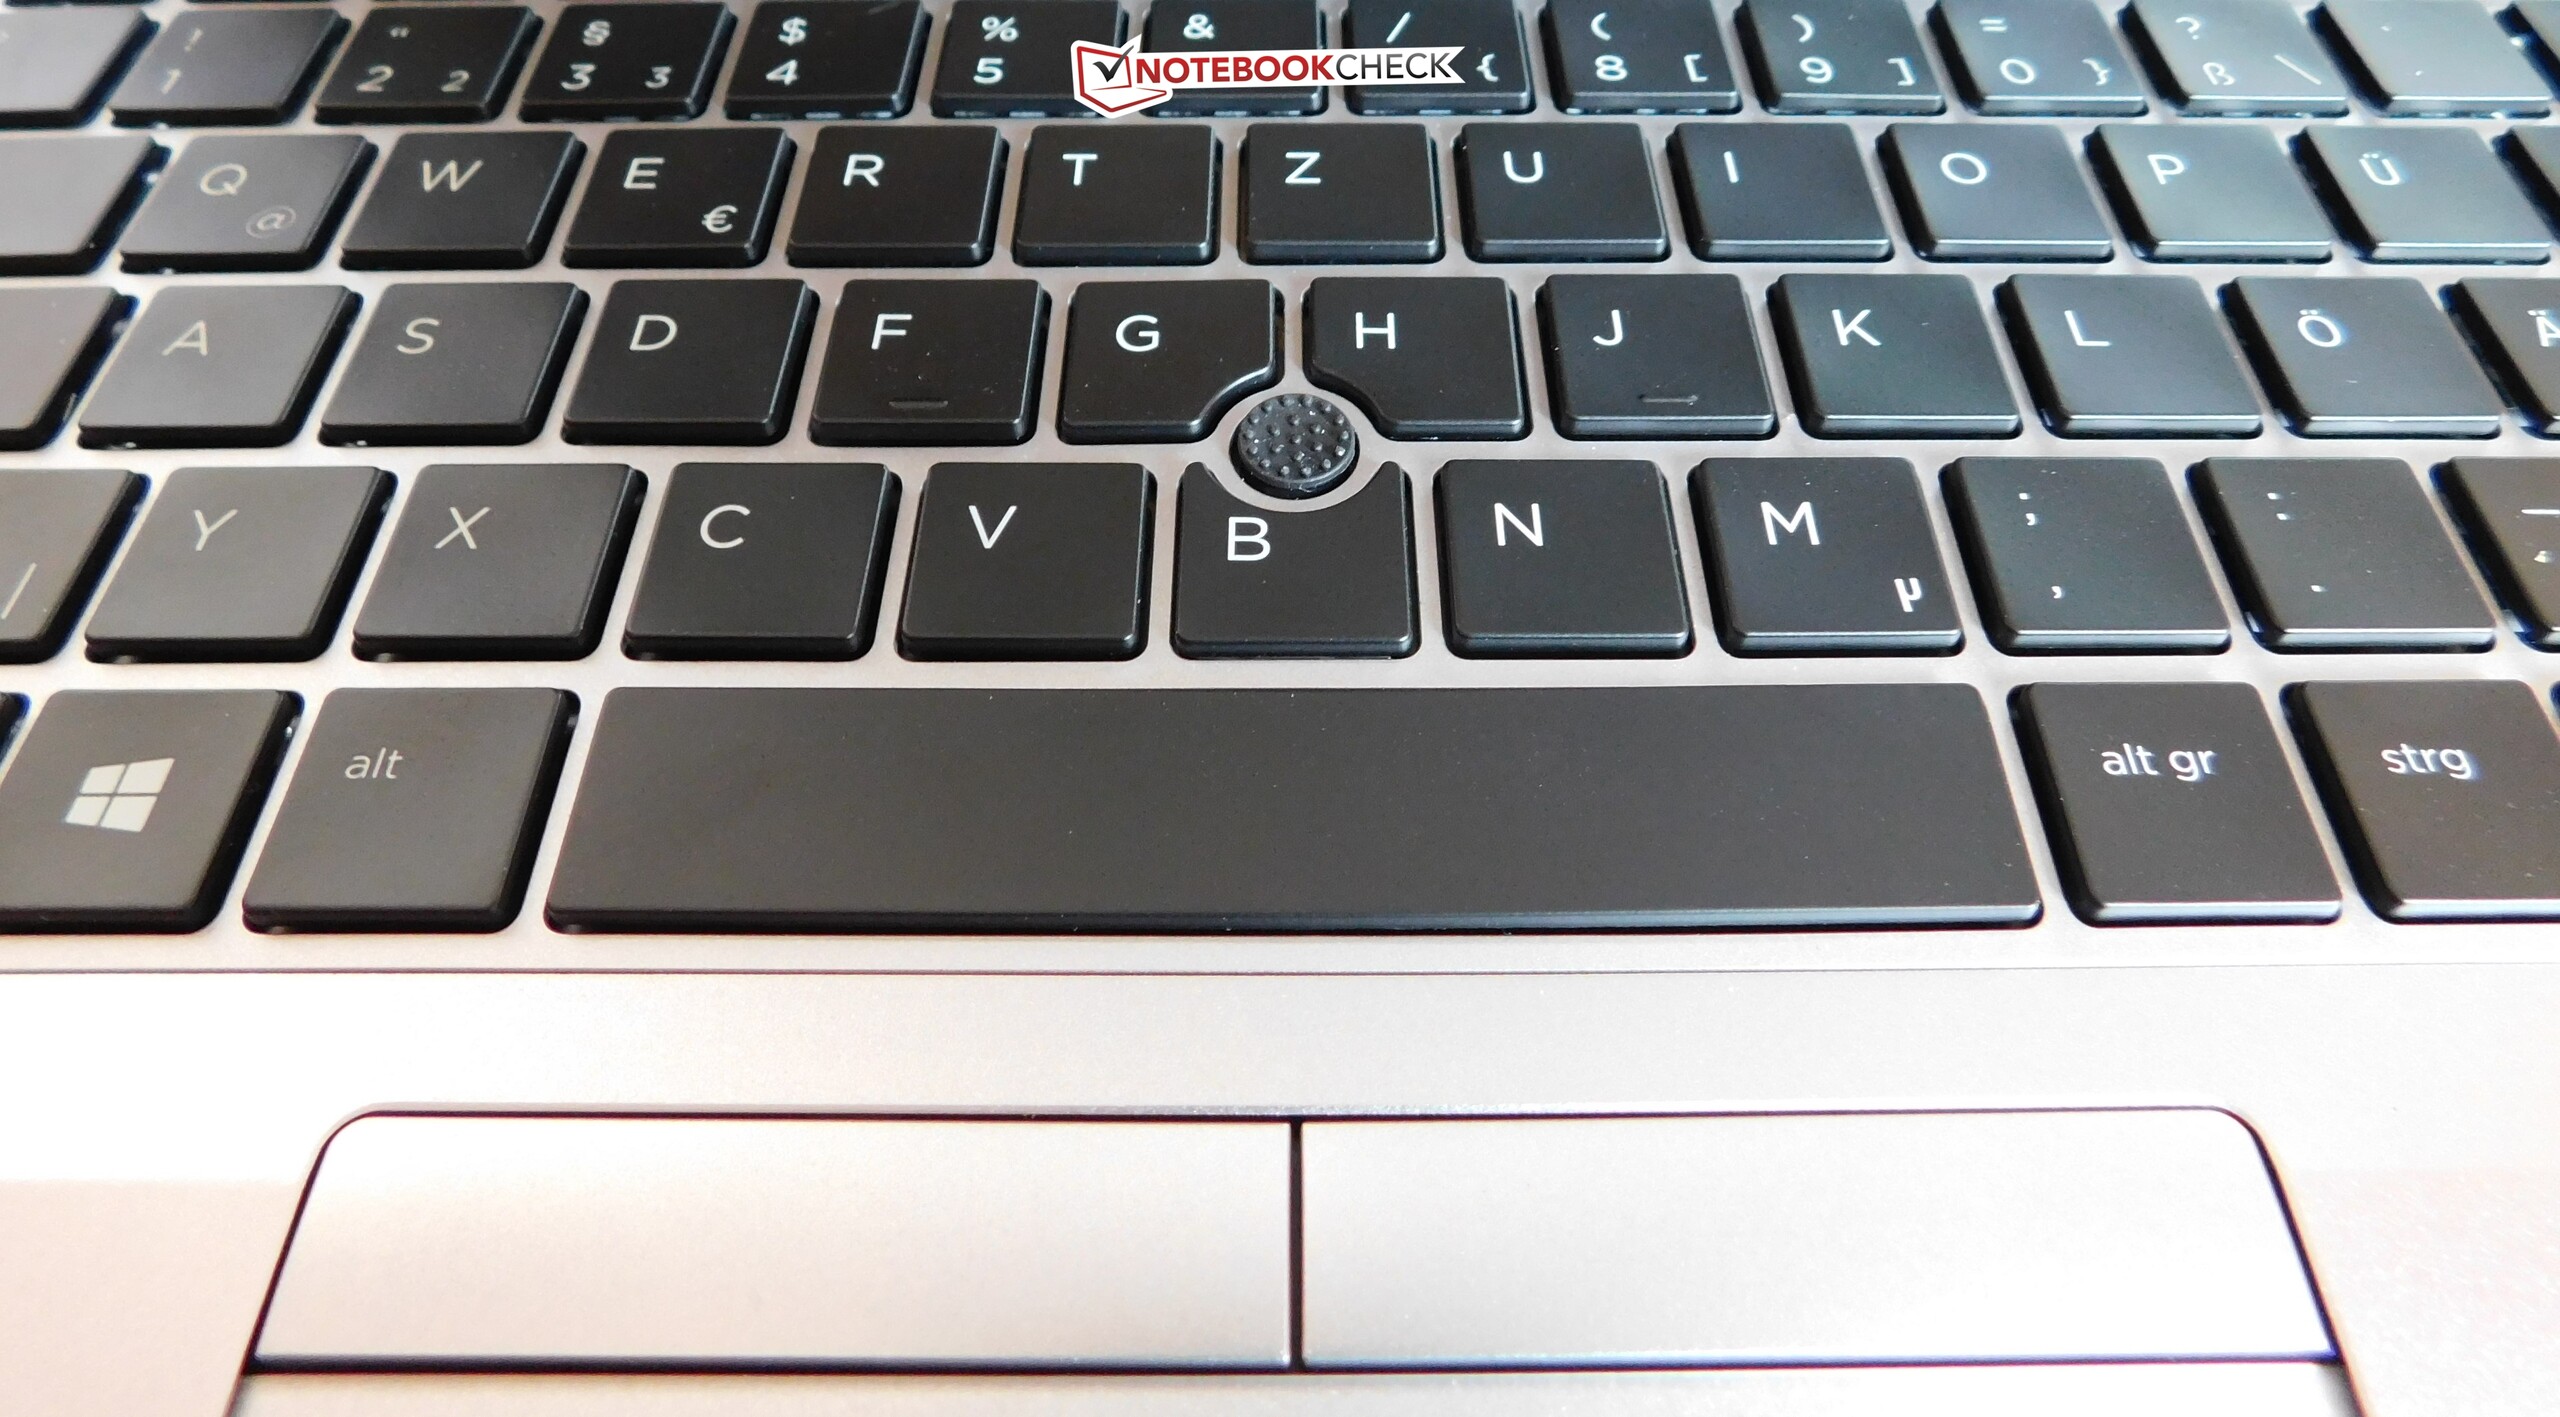
总的来说EliteBook 850 G4是难免令人沮丧。虽然惠普使用此设备配备了正确的配件,但仍然令人失望。外壳坚固而且制作精良,输入设备是不错(虽然不完美),散热出色,电池续航也非常好,考虑到电池容量。总而言之,除了雷电3的缺乏,难以维护和价格高之外,还没有太多的缺点。
不幸的是,所有这一切惠普传统上的高端商务本特质,都被劣质的TN显示屏幕所掩盖。毕竟,该机价格在稍微超过1400欧元(约合1491美元)的区间里,即使是在你以1700欧元(约1811美元)获取最高配置机,它的显示效果也是一样的。是的,屏幕是是明亮的,但除此之外,它显示了您可以从TN面板中预期的所有“质量”。笔记本电脑规格表中列出,在德国尚不能获得超高清IPS选项。
惠普采用了所有正确的配件......除了一个:EliteBook 850 G4的TN面板,它搞砸了原本可以非常好的印象。
但除这就是为什么尽管它的所有功能和质量都不错,我们还是不能推荐EliteBook 850 G4的原因。如果是在五年前,这是一个完全不同的情况:当时几乎所有的商业笔记本电脑配备了类似的显示器。然而,惠普似乎是唯一没有获得备忘录的人。如今,TN面板在价格相同的笔记本电脑中全部消失。其主要竞争对手在其高端业务设备中提供全高清IPS面板。 就连ThinkPad T570相当差劲的IPS面板都击败了EliteBook的劣质TN面板,更不用说其他高品质的IPS面板,例如富士通 Lifebook U757。
注:本文是基于完整评测的缩减版本,阅读完整的英文评测,请点击这里。
HP EliteBook 850 G4-Z2W86ET
- 03/25/2017 v6 (old)
Benjamin Herzig