戴尔 Precision 7510 (4K IGZO) 移动工作站简短评测
| |||||||||||||||||||||||||
Brightness Distribution: 83 %
Center on Battery: 279.2 cd/m²
Contrast: 1050:1 (Black: 0.266 cd/m²)
ΔE ColorChecker Calman: 4.14 | ∀{0.5-29.43 Ø4.72}
ΔE Greyscale Calman: 3.26 | ∀{0.09-98 Ø4.97}
99.72% sRGB (Argyll 1.6.3 3D)
85.68% AdobeRGB 1998 (Argyll 1.6.3 3D)
99% AdobeRGB 1998 (Argyll 3D)
99.7% sRGB (Argyll 3D)
86.2% Display P3 (Argyll 3D)
Gamma: 2.19
CCT: 6375 K
| Dell Precision 7510 (4K IGZO) 15.6", 3840x2160 | HP ZBook 15 G3 15.6", 1920x1080 | MSI WS60-6QJE316H11 15.6", 3840x2160 | Lenovo ThinkPad P50s-20FKS00400 15.5", 2880x1620 | Lenovo ThinkPad P50 15.6", 1920x1080 | Dell Precision 5510 15.6", 3840x2160 | |
|---|---|---|---|---|---|---|
| Display | -19% | -32% | -25% | -52% | 1% | |
| Display P3 Coverage (%) | 86.2 | 66.8 -23% | 55.1 -36% | 63.7 -26% | 39.13 -55% | 88.4 3% |
| sRGB Coverage (%) | 99.7 | 95.5 -4% | 83 -17% | 87.6 -12% | 58.5 -41% | 100 0% |
| AdobeRGB 1998 Coverage (%) | 99 | 69 -30% | 56.9 -43% | 63.8 -36% | 40.45 -59% | 99.5 1% |
| Response Times | -32% | 15% | 1% | -4% | -32% | |
| Response Time Grey 50% / Grey 80% * (ms) | 40.4 ? | 54 ? -34% | 34 ? 16% | 38 ? 6% | 46 ? -14% | 56.4 ? -40% |
| Response Time Black / White * (ms) | 27.6 ? | 35.6 ? -29% | 24 ? 13% | 28.8 ? -4% | 26 ? 6% | 34 ? -23% |
| PWM Frequency (Hz) | 198.4 ? | 198 ? | 1316 ? | 219 ? | ||
| Screen | -26% | -19% | -16% | -15% | -1% | |
| Brightness middle (cd/m²) | 279.2 | 306 10% | 237 -15% | 319 14% | 263 -6% | 391 40% |
| Brightness (cd/m²) | 271 | 289 7% | 208 -23% | 290 7% | 236 -13% | 361 33% |
| Brightness Distribution (%) | 83 | 85 2% | 77 -7% | 82 -1% | 78 -6% | 87 5% |
| Black Level * (cd/m²) | 0.266 | 0.34 -28% | 0.26 2% | 0.31 -17% | 0.34 -28% | 0.4 -50% |
| Contrast (:1) | 1050 | 900 -14% | 912 -13% | 1029 -2% | 774 -26% | 978 -7% |
| Colorchecker dE 2000 * | 4.14 | 5.1 -23% | 4.42 -7% | 4.8 -16% | 2.35 43% | 4.85 -17% |
| Colorchecker dE 2000 max. * | 6.56 | 9.9 -51% | 8.54 -30% | 7.8 -19% | ||
| Greyscale dE 2000 * | 3.26 | 7.4 -127% | 4.43 -36% | 5.7 -75% | 3.33 -2% | 4.01 -23% |
| Gamma | 2.19 100% | 2.37 93% | 2.23 99% | 2.07 106% | 2.38 92% | 2.18 101% |
| CCT | 6375 102% | 7263 89% | 6133 106% | 6260 104% | 6917 94% | 7340 89% |
| Color Space (Percent of AdobeRGB 1998) (%) | 85.68 | 63 -26% | 52.5 -39% | 56.9 -34% | 37 -57% | 96 12% |
| Color Space (Percent of sRGB) (%) | 99.72 | 95 -5% | 82.9 -17% | 87.4 -12% | 58 -42% | 100 0% |
| Total Average (Program / Settings) | -26% /
-25% | -12% /
-17% | -13% /
-15% | -24% /
-21% | -11% /
-5% |
* ... smaller is better
Display Response Times
| ↔ Response Time Black to White | ||
|---|---|---|
| 27.6 ms ... rise ↗ and fall ↘ combined | ↗ 6.8 ms rise | 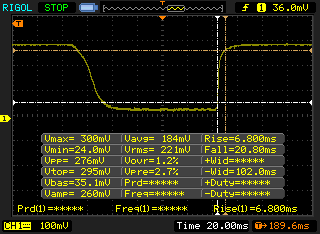 |
| ↘ 20.8 ms fall | ||
| The screen shows relatively slow response rates in our tests and may be too slow for gamers. In comparison, all tested devices range from 0.1 (minimum) to 240 (maximum) ms. » 70 % of all devices are better. This means that the measured response time is worse than the average of all tested devices (19.8 ms). | ||
| ↔ Response Time 50% Grey to 80% Grey | ||
| 40.4 ms ... rise ↗ and fall ↘ combined | ↗ 19.6 ms rise | 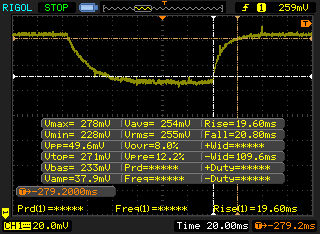 |
| ↘ 20.8 ms fall | ||
| The screen shows slow response rates in our tests and will be unsatisfactory for gamers. In comparison, all tested devices range from 0.165 (minimum) to 636 (maximum) ms. » 63 % of all devices are better. This means that the measured response time is worse than the average of all tested devices (31 ms). | ||
Screen Flickering / PWM (Pulse-Width Modulation)
| Screen flickering / PWM detected | 198.4 Hz | ≤ 29 % brightness setting | 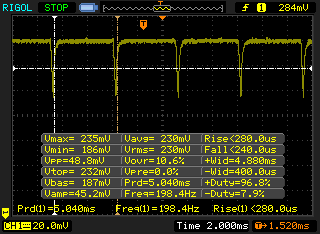 |
The display backlight flickers at 198.4 Hz (worst case, e.g., utilizing PWM) Flickering detected at a brightness setting of 29 % and below. There should be no flickering or PWM above this brightness setting. The frequency of 198.4 Hz is relatively low, so sensitive users will likely notice flickering and experience eyestrain at the stated brightness setting and below. In comparison: 52 % of all tested devices do not use PWM to dim the display. If PWM was detected, an average of 7778 (minimum: 5 - maximum: 343500) Hz was measured. | |||
| Cinebench R11.5 | |
| CPU Single 64Bit (sort by value) | |
| Dell Precision 7510 (4K IGZO) | |
| HP ZBook 15 G3 | |
| MSI WS60-6QJE316H11 | |
| Lenovo ThinkPad P50s-20FKS00400 | |
| Lenovo ThinkPad P50 | |
| Dell Precision 5510 | |
| CPU Multi 64Bit (sort by value) | |
| Dell Precision 7510 (4K IGZO) | |
| HP ZBook 15 G3 | |
| MSI WS60-6QJE316H11 | |
| Lenovo ThinkPad P50s-20FKS00400 | |
| Lenovo ThinkPad P50 | |
| Dell Precision 5510 | |
| Cinebench R15 | |
| CPU Single 64Bit (sort by value) | |
| Dell Precision 7510 (4K IGZO) | |
| HP ZBook 15 G3 | |
| MSI WS60-6QJE316H11 | |
| Lenovo ThinkPad P50s-20FKS00400 | |
| Lenovo ThinkPad P50 | |
| Dell Precision 5510 | |
| CPU Multi 64Bit (sort by value) | |
| Dell Precision 7510 (4K IGZO) | |
| HP ZBook 15 G3 | |
| MSI WS60-6QJE316H11 | |
| Lenovo ThinkPad P50s-20FKS00400 | |
| Lenovo ThinkPad P50 | |
| Dell Precision 5510 | |
| wPrime 2.10 - 1024m (sort by value) | |
| Dell Precision 7510 (4K IGZO) | |
| Dell Precision 5510 | |
| Super Pi Mod 1.5 XS 32M - 32M (sort by value) | |
| Dell Precision 7510 (4K IGZO) | |
| Dell Precision 5510 | |
* ... smaller is better
| PCMark 8 | |
| Home Score Accelerated v2 (sort by value) | |
| Dell Precision 7510 (4K IGZO) | |
| HP ZBook 15 G3 | |
| MSI WS60-6QJE316H11 | |
| Lenovo ThinkPad P50s-20FKS00400 | |
| Lenovo ThinkPad P50 | |
| Dell Precision 5510 | |
| Work Score Accelerated v2 (sort by value) | |
| Dell Precision 7510 (4K IGZO) | |
| HP ZBook 15 G3 | |
| MSI WS60-6QJE316H11 | |
| Lenovo ThinkPad P50s-20FKS00400 | |
| Lenovo ThinkPad P50 | |
| Dell Precision 5510 | |
| Creative Score Accelerated v2 (sort by value) | |
| Dell Precision 7510 (4K IGZO) | |
| HP ZBook 15 G3 | |
| Dell Precision 5510 | |
| PCMark 8 Home Score Accelerated v2 | 4020 points | |
| PCMark 8 Creative Score Accelerated v2 | 5537 points | |
| PCMark 8 Work Score Accelerated v2 | 4246 points | |
Help | ||

| 3DMark 11 | |
| 1280x720 Performance GPU (sort by value) | |
| Dell Precision 7510 (4K IGZO) | |
| HP ZBook 15 G3 | |
| MSI WS60-6QJE316H11 | |
| Lenovo ThinkPad P50s-20FKS00400 | |
| Lenovo ThinkPad P50 | |
| Dell Precision 5510 | |
| 1280x720 Performance Combined (sort by value) | |
| Dell Precision 7510 (4K IGZO) | |
| HP ZBook 15 G3 | |
| MSI WS60-6QJE316H11 | |
| Lenovo ThinkPad P50s-20FKS00400 | |
| Lenovo ThinkPad P50 | |
| Dell Precision 5510 | |
| 3DMark | |
| 1280x720 Cloud Gate Standard Graphics (sort by value) | |
| Dell Precision 7510 (4K IGZO) | |
| HP ZBook 15 G3 | |
| MSI WS60-6QJE316H11 | |
| Lenovo ThinkPad P50s-20FKS00400 | |
| Lenovo ThinkPad P50 | |
| Dell Precision 5510 | |
| 1920x1080 Fire Strike Graphics (sort by value) | |
| Dell Precision 7510 (4K IGZO) | |
| HP ZBook 15 G3 | |
| MSI WS60-6QJE316H11 | |
| Lenovo ThinkPad P50s-20FKS00400 | |
| Lenovo ThinkPad P50 | |
| Dell Precision 5510 | |
| 3DMark 06 Standard Score | 27269 points | |
| 3DMark 11 Performance | 5419 points | |
| 3DMark Ice Storm Standard Score | 99266 points | |
| 3DMark Cloud Gate Standard Score | 17525 points | |
| 3DMark Fire Strike Score | 3919 points | |
Help | ||
| low | med. | high | ultra | 4K | |
|---|---|---|---|---|---|
| BioShock Infinite (2013) | 219 | 139 | 123 | 45 | |
| Rise of the Tomb Raider (2016) | 72 | 49 | 28 | 23 | 16 |
| Dell Precision 7510 (4K IGZO) Quadro M2000M, E3-1535M v5, Samsung SSD SM951a 512GB M.2 PCIe 3.0 x4 NVMe (MZVKV512) | HP ZBook 15 G3 Quadro M2000M, E3-1505M v5, Samsung SM951 MZVPV512HDGL m.2 PCI-e | MSI WS60-6QJE316H11 Quadro M2000M, E3-1505M v5, Toshiba NVMe THNSN5128GP | Lenovo ThinkPad P50s-20FKS00400 Quadro M500M, 6500U, Samsung PM871 MZYLN256HCHP | Lenovo ThinkPad P50 Quadro M2000M, 6820HQ, Samsung SSD PM871 MZNLN256HCHP | Dell Precision 5510 Quadro M1000M, E3-1505M v5, SK hynix SC920 512 GB | |
|---|---|---|---|---|---|---|
| Noise | -5% | -17% | 5% | 5% | -1% | |
| off / environment * (dB) | 28.2 | 30 -6% | ||||
| Idle Minimum * (dB) | 29.8 | 30 -1% | 37.2 -25% | 30 -1% | 30 -1% | 30 -1% |
| Idle Average * (dB) | 29.8 | 30 -1% | 37.2 -25% | 30 -1% | 30 -1% | 30 -1% |
| Idle Maximum * (dB) | 31.2 | 30 4% | 37.2 -19% | 30 4% | 30 4% | 30 4% |
| Load Average * (dB) | 37.2 | 45.3 -22% | 42.1 -13% | 33.5 10% | 34.5 7% | 42.08 -13% |
| Load Maximum * (dB) | 49.4 | 49.7 -1% | 50.7 -3% | 41.9 15% | 42.1 15% | 46.78 5% |
* ... smaller is better
Noise level
| Idle |
| 29.8 / 29.8 / 31.2 dB(A) |
| Load |
| 37.2 / 49.4 dB(A) |
 | ||
30 dB silent 40 dB(A) audible 50 dB(A) loud |
||
min: | ||
(±) The maximum temperature on the upper side is 43 °C / 109 F, compared to the average of 38.2 °C / 101 F, ranging from 22.2 to 69.8 °C for the class Workstation.
(±) The bottom heats up to a maximum of 41.2 °C / 106 F, compared to the average of 41.1 °C / 106 F
(+) In idle usage, the average temperature for the upper side is 26.7 °C / 80 F, compared to the device average of 32 °C / 90 F.
(+) The palmrests and touchpad are cooler than skin temperature with a maximum of 24.8 °C / 76.6 F and are therefore cool to the touch.
(+) The average temperature of the palmrest area of similar devices was 27.8 °C / 82 F (+3 °C / 5.4 F).
| Dell Precision 7510 (4K IGZO) Quadro M2000M, E3-1535M v5, Samsung SSD SM951a 512GB M.2 PCIe 3.0 x4 NVMe (MZVKV512) | HP ZBook 15 G3 Quadro M2000M, E3-1505M v5, Samsung SM951 MZVPV512HDGL m.2 PCI-e | MSI WS60-6QJE316H11 Quadro M2000M, E3-1505M v5, Toshiba NVMe THNSN5128GP | Lenovo ThinkPad P50s-20FKS00400 Quadro M500M, 6500U, Samsung PM871 MZYLN256HCHP | Lenovo ThinkPad P50 Quadro M2000M, 6820HQ, Samsung SSD PM871 MZNLN256HCHP | Dell Precision 5510 Quadro M1000M, E3-1505M v5, SK hynix SC920 512 GB | |
|---|---|---|---|---|---|---|
| Power Consumption | 43% | 5% | 66% | 51% | 36% | |
| Idle Minimum * (Watt) | 23.9 | 5.7 76% | 18.8 21% | 4.3 82% | 5.6 77% | 8.6 64% |
| Idle Average * (Watt) | 28.9 | 12.2 58% | 29.6 -2% | 9.7 66% | 8.6 70% | 16.2 44% |
| Idle Maximum * (Watt) | 30 | 12.6 58% | 30.3 -1% | 10.2 66% | 9.3 69% | 16.7 44% |
| Load Average * (Watt) | 95.2 | 83.1 13% | 90.4 5% | 45.7 52% | 89.5 6% | 82.6 13% |
| Load Maximum * (Watt) | 157.1 | 138.2 12% | 150.2 4% | 55.8 64% | 105 33% | 131.8 16% |
* ... smaller is better
| Off / Standby | |
| Idle | |
| Load |
|
Key:
min: | |
| Dell Precision 7510 (4K IGZO) Quadro M2000M, E3-1535M v5, Samsung SSD SM951a 512GB M.2 PCIe 3.0 x4 NVMe (MZVKV512) | HP ZBook 15 G3 Quadro M2000M, E3-1505M v5, Samsung SM951 MZVPV512HDGL m.2 PCI-e | MSI WS60-6QJE316H11 Quadro M2000M, E3-1505M v5, Toshiba NVMe THNSN5128GP | Lenovo ThinkPad P50s-20FKS00400 Quadro M500M, 6500U, Samsung PM871 MZYLN256HCHP | Lenovo ThinkPad P50 Quadro M2000M, 6820HQ, Samsung SSD PM871 MZNLN256HCHP | Dell Precision 5510 Quadro M1000M, E3-1505M v5, SK hynix SC920 512 GB | |
|---|---|---|---|---|---|---|
| Battery runtime | 105% | -40% | 155% | 128% | 43% | |
| Reader / Idle (h) | 4.5 | 13.7 204% | 2.7 -40% | 18.5 311% | 14.3 218% | 7.1 58% |
| WiFi v1.3 (h) | 4 | 6.4 60% | 1.8 -55% | 6.8 70% | 8.3 108% | 4.8 20% |
| Load (h) | 1.2 | 1.8 50% | 0.9 -25% | 2.2 83% | 1.9 58% | 1.8 50% |
| WiFi (h) | 5 |
Pros
Cons
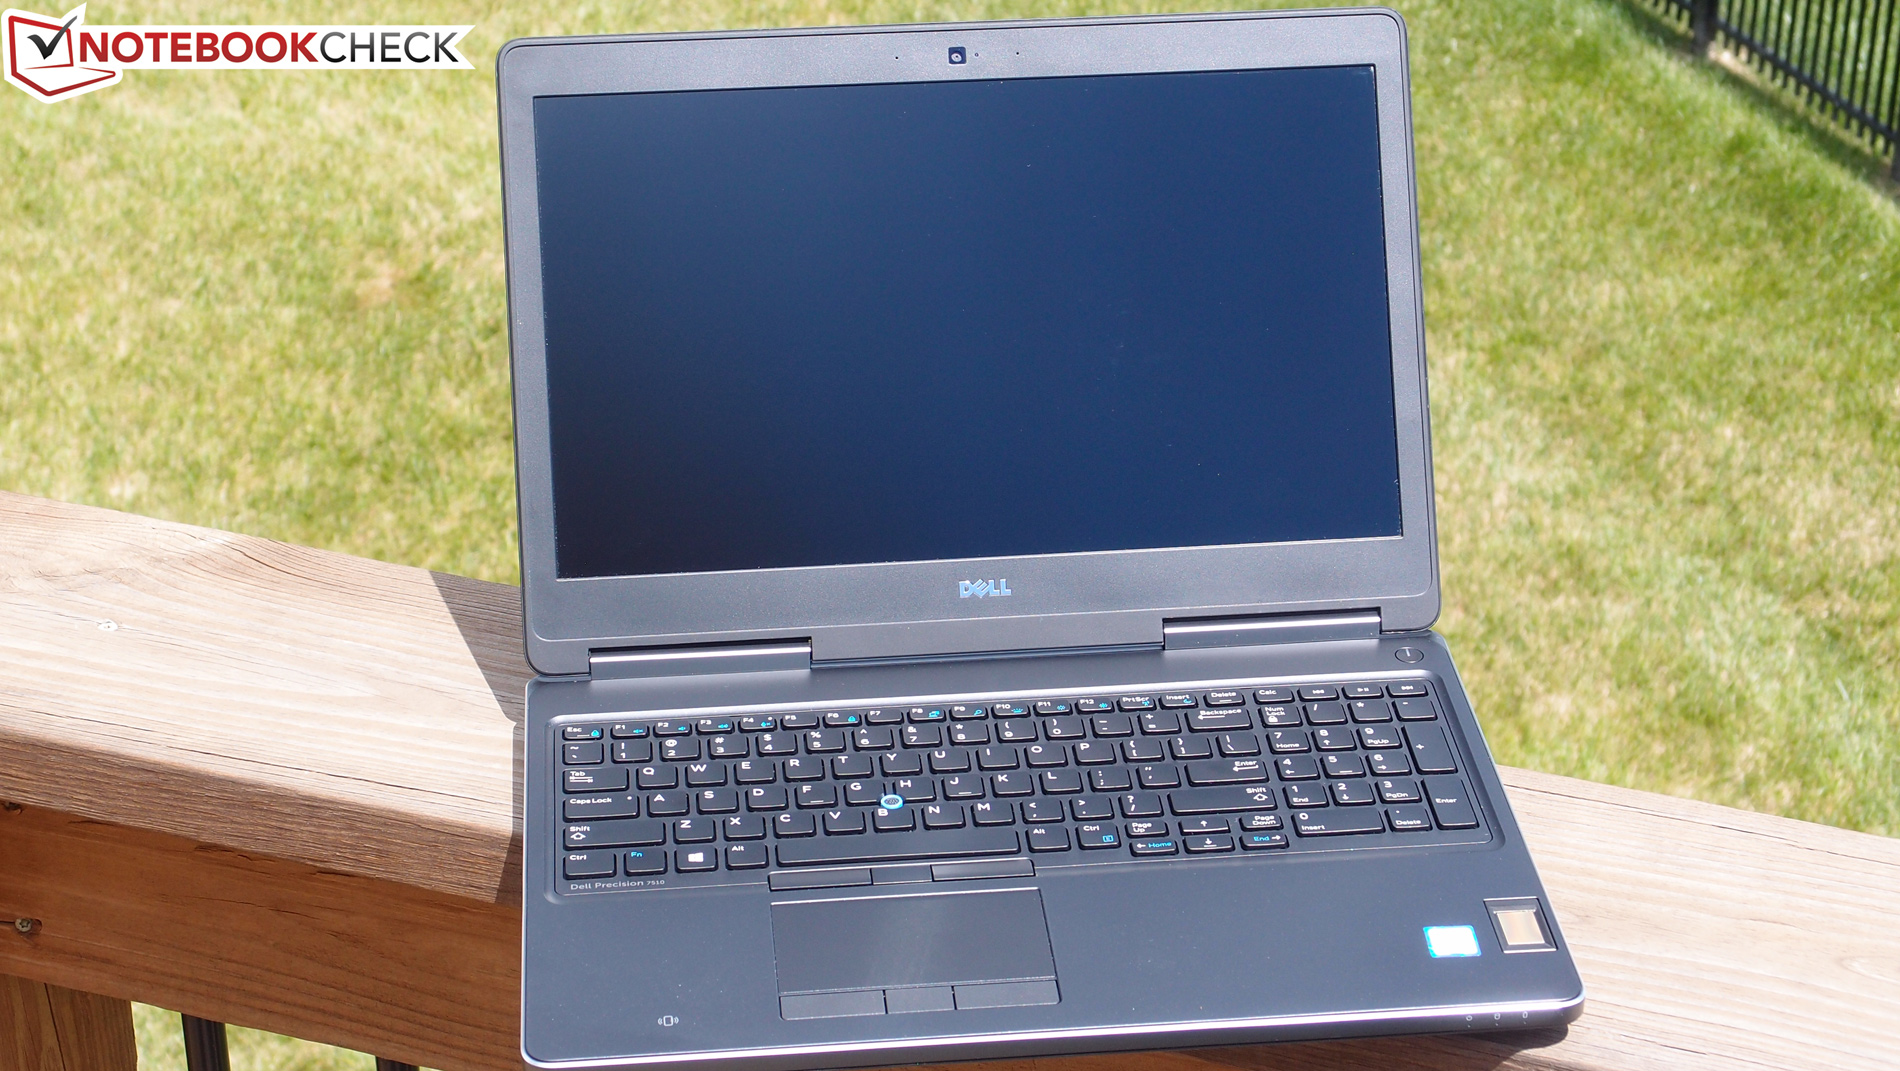
设计完美的15.6寸移动工作站并不是个简单的任务;同类机型基本都有一个或两个严重的缺点。Precision 7510也没能逃脱这个宿命,它是我们测试过遇到最严重实用性问题的设备之一。
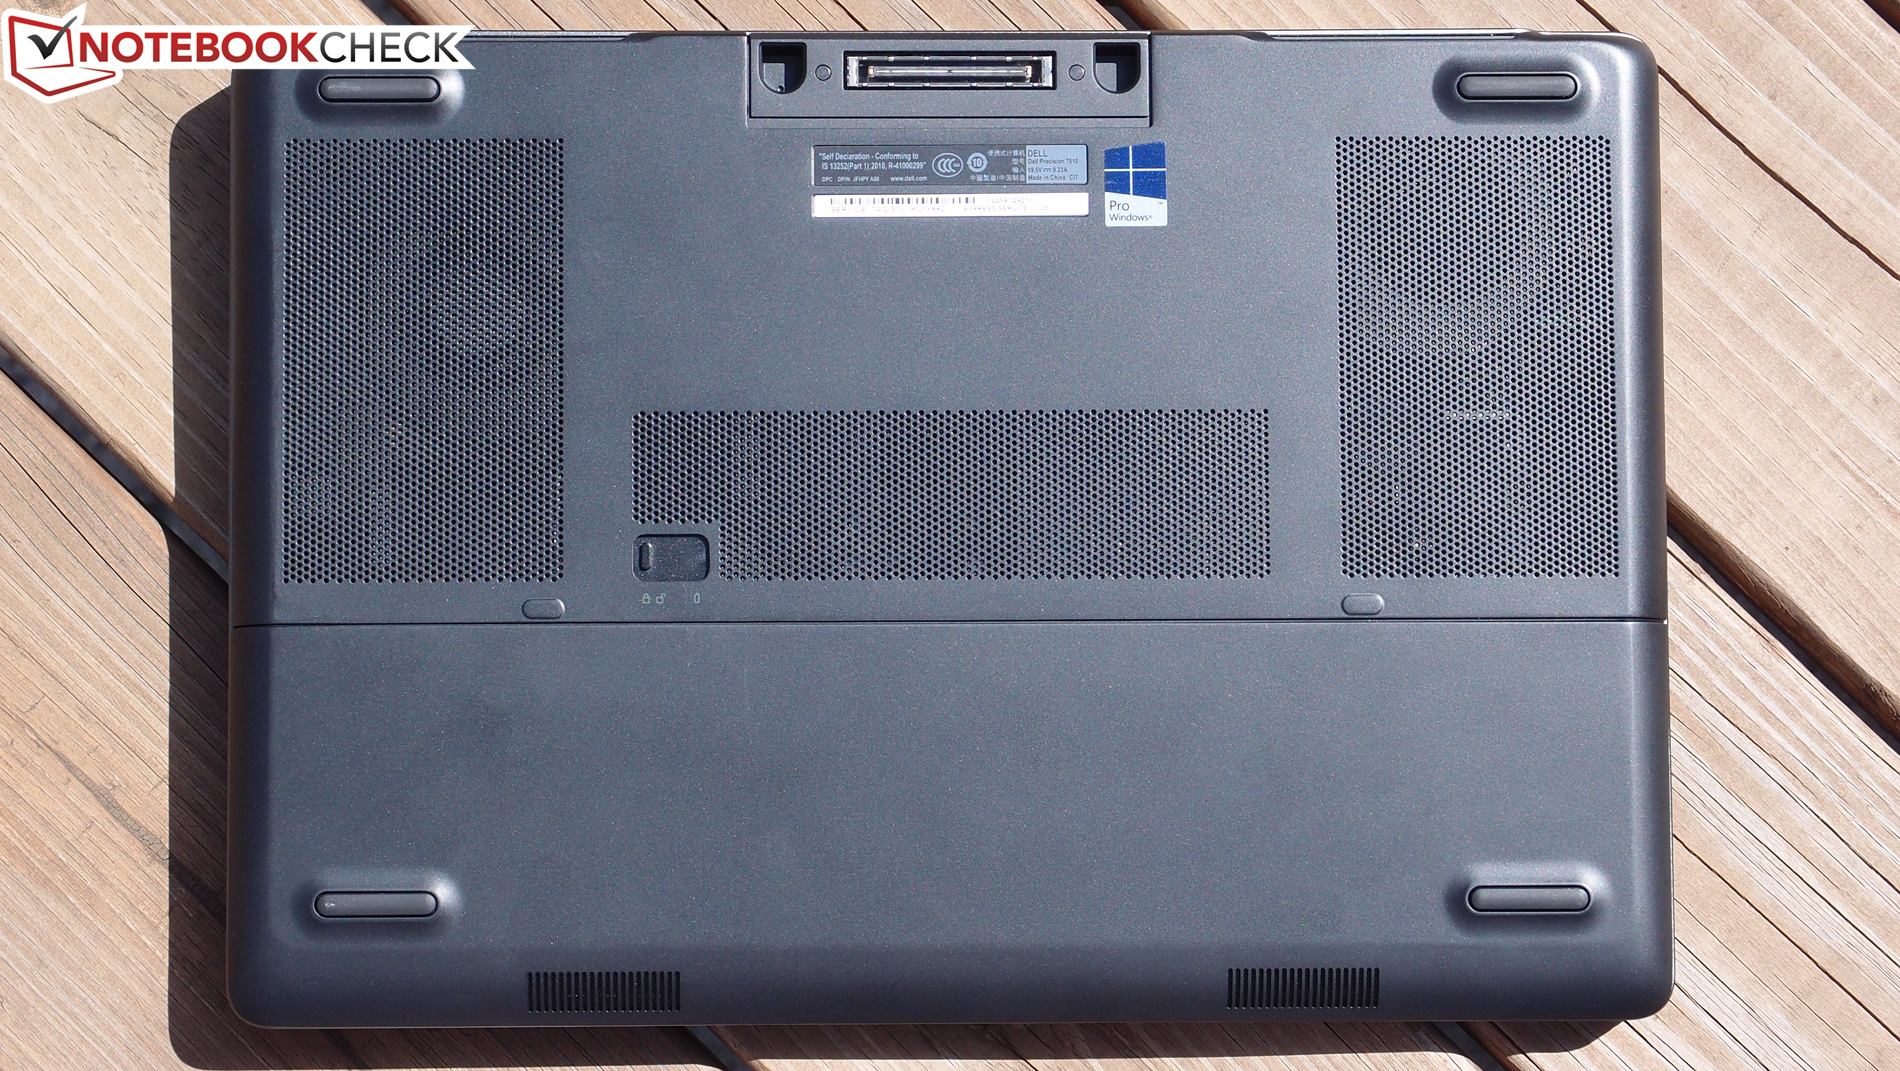
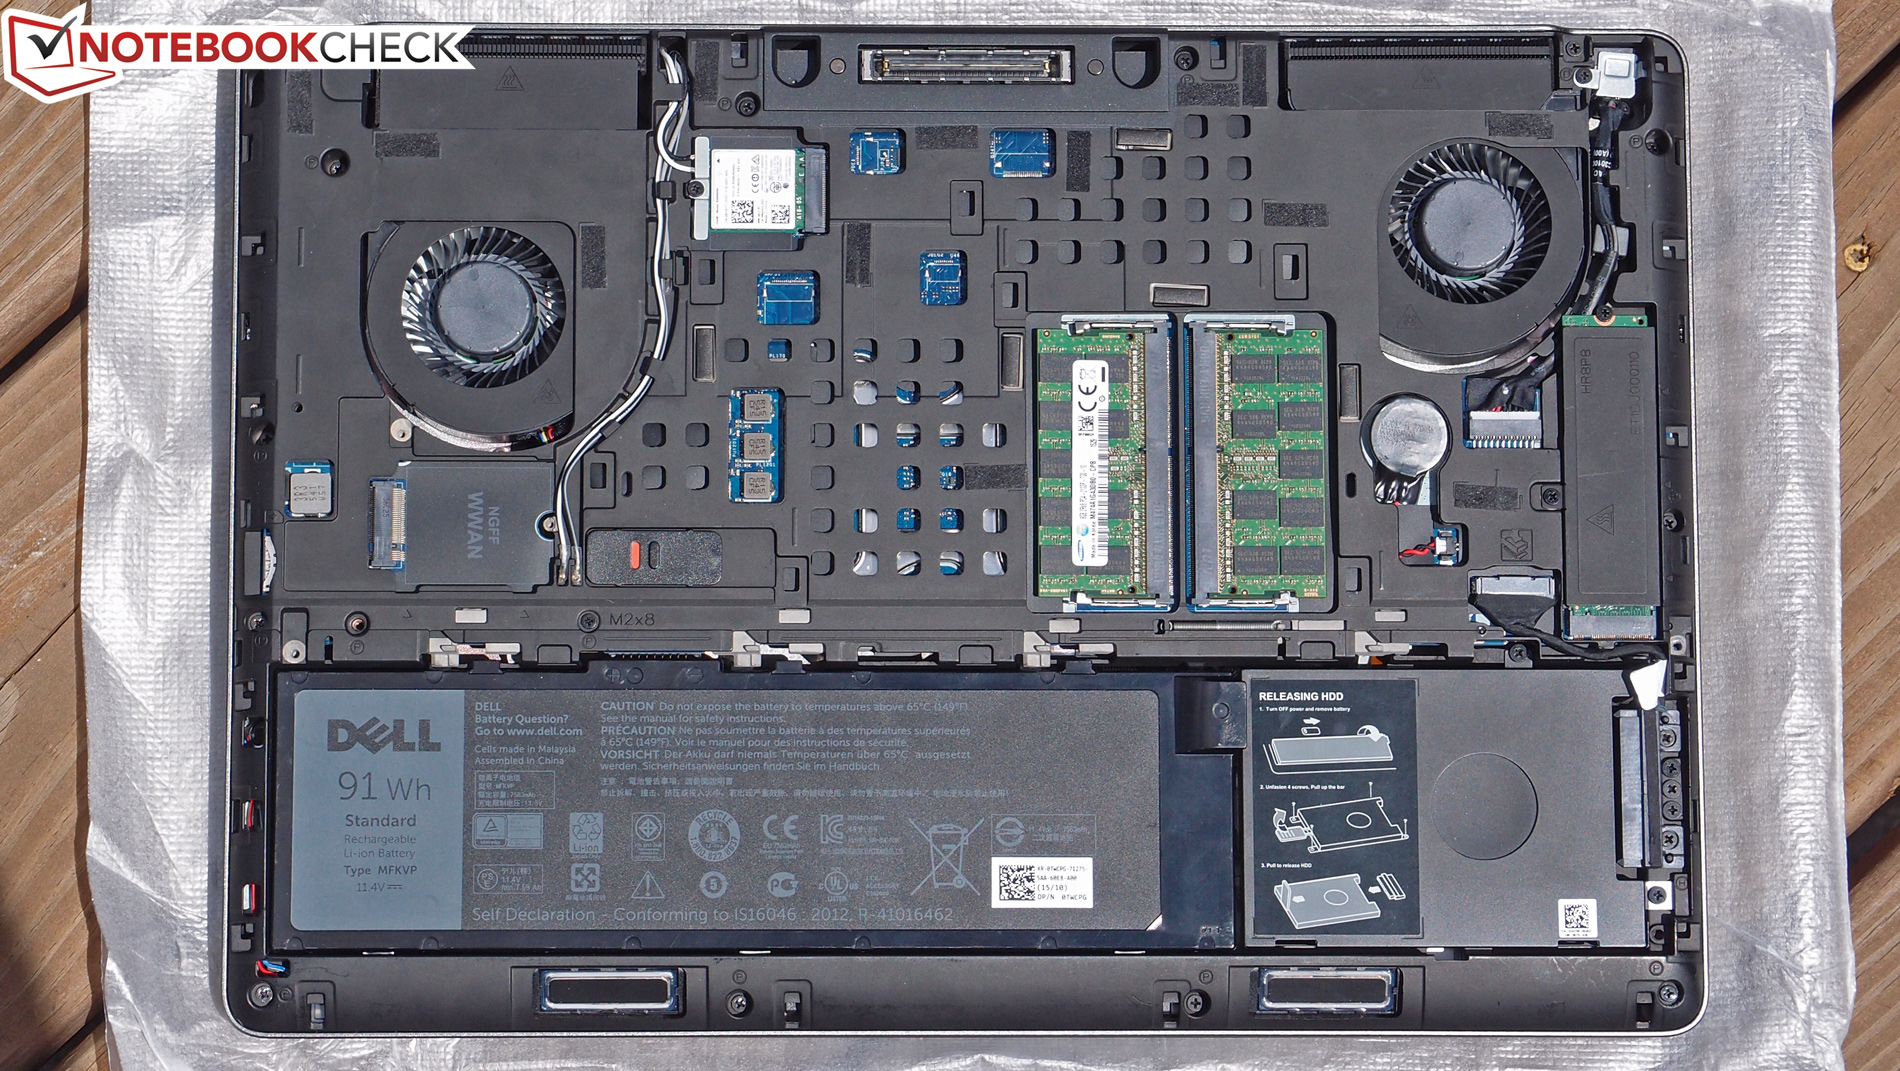
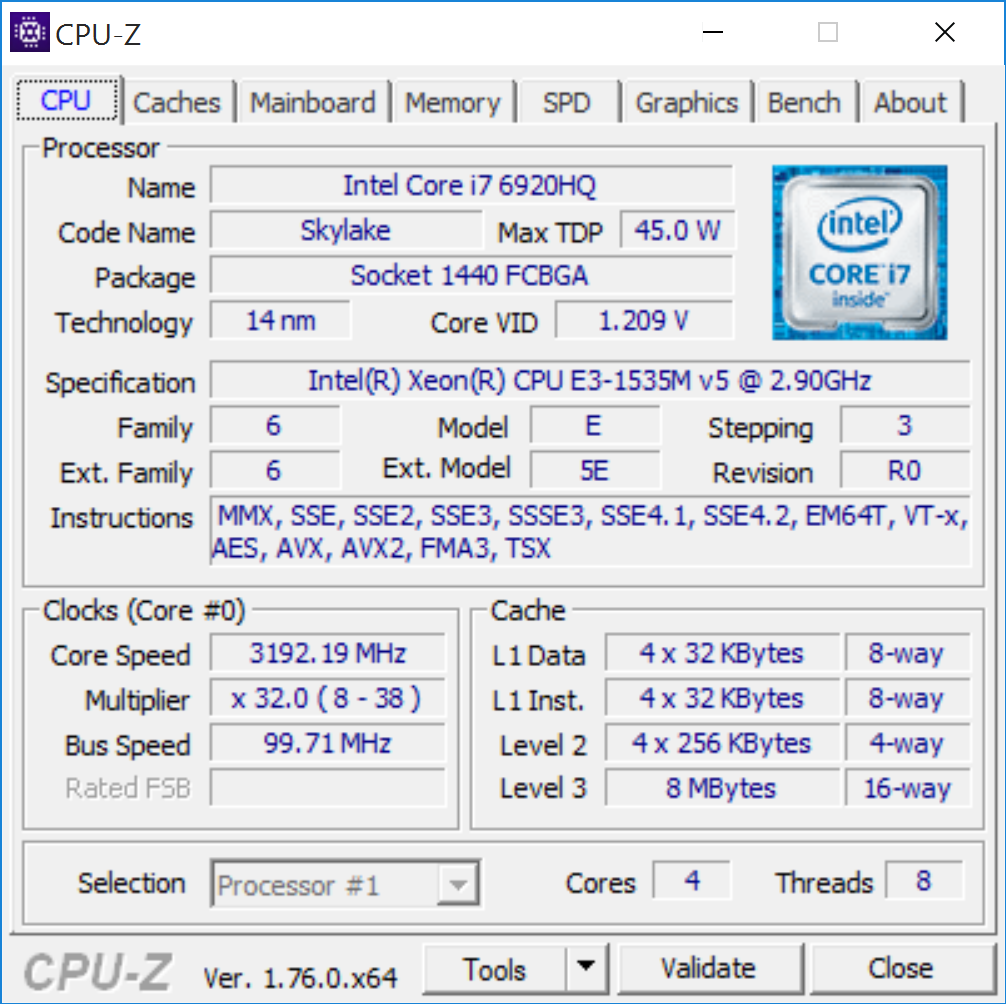
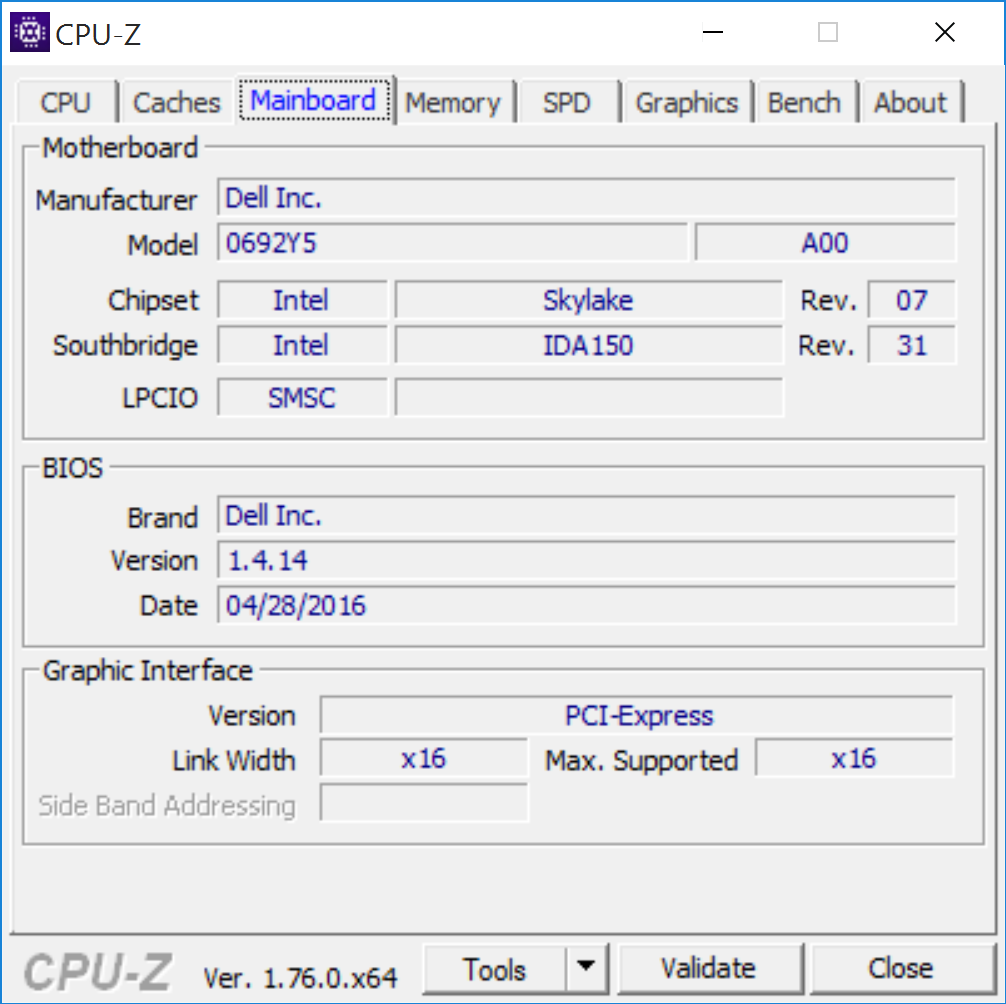
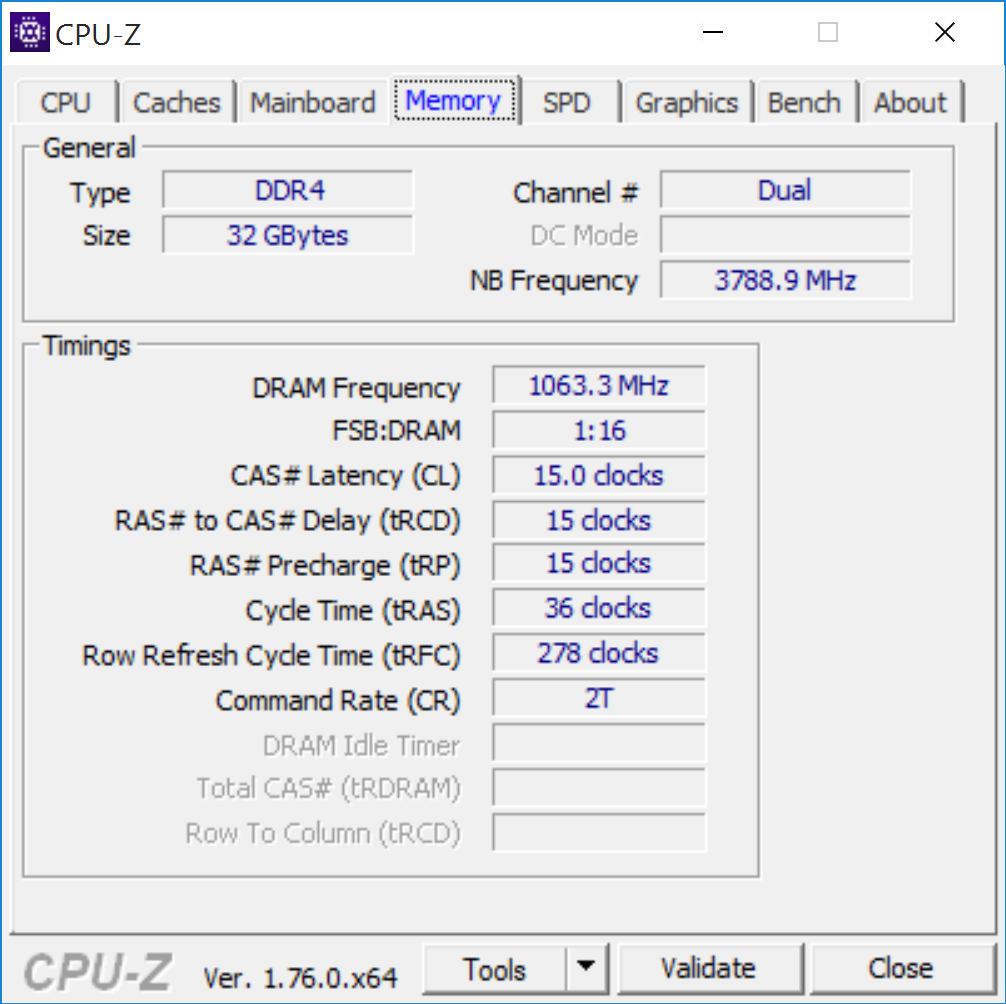
首先让我们看看它的优势:7510相比前代机型M4800在机身设计上做出了很大的改变,而没有做出任何明显的妥协。它的接口配备仍然十分优秀,同时机身稳定性(包括转轴,材质硬度和给人的感受)似乎十分可靠,尽管它的屏幕上盖十分易于弯折。可维护性也是个十分重要的方面,它几乎所有的主要部件都可以通过机身底部的维护窗口快速更换。在大多数情况下,它都提供了极致的性能,它的处理器不论是连接电源还是使用电池都非常强大,同时它还搭配了一块驱动完备的中端专业显卡,以及极速的存储设备——如果用户启用AHCI接口的话。这一切都由合理的散热系统提供了保障,除了在最高负载之下,它都可以保持较低的噪音。同时,4K的屏幕面板有很高的对比度,出色的色域覆盖,以及优秀的色彩准确度(出厂校对状态),只是亮度略显不足。
那么,我们之前提到的它的缺点在哪里呢?主要是在于电池续航,尽管配备了巨大的91瓦时电池,Precision 7510几乎落后于所有的同类机型。其他的缺点还有在处理器和显卡同时负载下的显卡降频问题,以及不足平均水平的扬声器品质。最后,用户需要从RAID调整到AHCI才能利用NVMe固态硬盘的完全性能,这造成了很多麻烦-不过由于不小的改进,可能很多用户应该都会考虑这个选项。
Precision 7510并不完美,在同类产品中,它有一些可能最影响用户实际使用的问题。
我们的测试机型售价3267美元(约21361人民币),这不是个小数目——对于需要一台往返于办公室和家之间的强劲移动工作站的用户来说,可以参考戴尔的这台最新15.6寸设备。
注:本文是基于完整评测的缩减版本,阅读完整的英文评测,请点击这里。
Dell Precision 7510 (4K IGZO)
- 06/19/2016 v5.1 (old)
Steve Schardein
Price comparison
