宏碁 Predator 15 (7700HQ, GTX 1070, 全高清) 笔记本电脑简短评测
| SD Card Reader | |
| average JPG Copy Test (av. of 3 runs) | |
| MSI GT62VR 7RE-223 | |
| Acer Predator 15 G9-593-751X | |
| Acer Predator 15 G9-593-765Q | |
| Asus Strix GL502VS-FY032T | |
| maximum AS SSD Seq Read Test (1GB) | |
| MSI GT62VR 7RE-223 | |
| Acer Predator 15 G9-593-765Q | |
| Acer Predator 15 G9-593-751X | |
| Asus Strix GL502VS-FY032T | |
| Networking | |
| iperf3 transmit AX12 | |
| Acer Predator 15 G9-593-751X | |
| Acer Predator 15 G9-593-765Q | |
| MSI GT62VR 7RE-223 | |
| Alienware 15 R3 | |
| iperf3 receive AX12 | |
| Acer Predator 15 G9-593-751X | |
| Alienware 15 R3 | |
| Acer Predator 15 G9-593-765Q | |
| MSI GT62VR 7RE-223 | |
| |||||||||||||||||||||||||
Brightness Distribution: 88 %
Center on Battery: 295 cd/m²
Contrast: 922:1 (Black: 0.32 cd/m²)
ΔE ColorChecker Calman: 4.59 | ∀{0.5-29.43 Ø4.73}
ΔE Greyscale Calman: 4.03 | ∀{0.09-98 Ø4.97}
85% sRGB (Argyll 1.6.3 3D)
56% AdobeRGB 1998 (Argyll 1.6.3 3D)
62.5% AdobeRGB 1998 (Argyll 3D)
85.5% sRGB (Argyll 3D)
65.4% Display P3 (Argyll 3D)
Gamma: 2.3
CCT: 7229 K
| Acer Predator 15 G9-593-751X LG Philips LP156WF6-SPP1 (LGD04D5), 1920x1080 | Acer Predator 15 G9-593-765Q LG Philips LP156WF6-SPP1 (LGD04D5), 1920x1080 | Alienware 15 R3 HPJGK_B156HTN (AUO51ED), 1920x1080 | MSI GT62VR 7RE-223 LG Philips LP156WF6 (LGD046F), 1920x1080 | Asus Strix GL502VS-FY032T LG Philips LP156WF6-SPB6 (LGD046F), 1920x1080 | |
|---|---|---|---|---|---|
| Display | -2% | 4% | -3% | -2% | |
| Display P3 Coverage (%) | 65.4 | 63.6 -3% | 66 1% | 63.9 -2% | 64.5 -1% |
| sRGB Coverage (%) | 85.5 | 83.9 -2% | 90.5 6% | 83.1 -3% | 83.1 -3% |
| AdobeRGB 1998 Coverage (%) | 62.5 | 61.3 -2% | 66.2 6% | 60.8 -3% | 60.8 -3% |
| Response Times | 4% | 43% | 1% | 4% | |
| Response Time Grey 50% / Grey 80% * (ms) | 36 ? | 35 ? 3% | 25 ? 31% | 37 ? -3% | 38 ? -6% |
| Response Time Black / White * (ms) | 26.4 ? | 25 ? 5% | 12 ? 55% | 25 ? 5% | 23 ? 13% |
| PWM Frequency (Hz) | 20830 ? | ||||
| Screen | 7% | -27% | 3% | 2% | |
| Brightness middle (cd/m²) | 295 | 273 -7% | 386 31% | 310 5% | 315 7% |
| Brightness (cd/m²) | 274 | 267 -3% | 382 39% | 311 14% | 290 6% |
| Brightness Distribution (%) | 88 | 83 -6% | 93 6% | 85 -3% | 85 -3% |
| Black Level * (cd/m²) | 0.32 | 0.27 16% | 0.39 -22% | 0.3 6% | 0.32 -0% |
| Contrast (:1) | 922 | 1011 10% | 990 7% | 1033 12% | 984 7% |
| Colorchecker dE 2000 * | 4.59 | 3.77 18% | 10.2 -122% | 4.82 -5% | 4.88 -6% |
| Colorchecker dE 2000 max. * | 11 | 10.64 3% | 15.81 -44% | 10.14 8% | 8.88 19% |
| Greyscale dE 2000 * | 4.03 | 2.48 38% | 11.28 -180% | 3.94 2% | 4.17 -3% |
| Gamma | 2.3 96% | 2.37 93% | 2.23 99% | 2.45 90% | 2.53 87% |
| CCT | 7229 90% | 6854 95% | 11383 57% | 6877 95% | 6683 97% |
| Color Space (Percent of AdobeRGB 1998) (%) | 56 | 55 -2% | 59 5% | 54 -4% | 55 -2% |
| Color Space (Percent of sRGB) (%) | 85 | 84 -1% | 90 6% | 83 -2% | 83 -2% |
| Total Average (Program / Settings) | 3% /
4% | 7% /
-12% | 0% /
2% | 1% /
2% |
* ... smaller is better
Screen Flickering / PWM (Pulse-Width Modulation)
| Screen flickering / PWM detected | 20830 Hz | ≤ 90 % brightness setting | 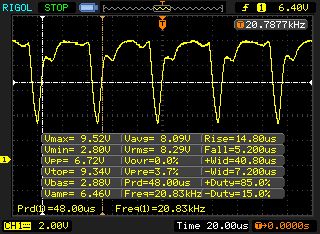 |
The display backlight flickers at 20830 Hz (worst case, e.g., utilizing PWM) Flickering detected at a brightness setting of 90 % and below. There should be no flickering or PWM above this brightness setting. The frequency of 20830 Hz is quite high, so most users sensitive to PWM should not notice any flickering. In comparison: 52 % of all tested devices do not use PWM to dim the display. If PWM was detected, an average of 7798 (minimum: 5 - maximum: 343500) Hz was measured. | |||
Display Response Times
| ↔ Response Time Black to White | ||
|---|---|---|
| 26.4 ms ... rise ↗ and fall ↘ combined | ↗ 15.2 ms rise | 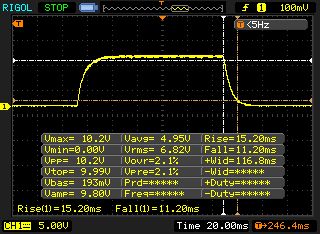 |
| ↘ 11.2 ms fall | ||
| The screen shows relatively slow response rates in our tests and may be too slow for gamers. In comparison, all tested devices range from 0.1 (minimum) to 240 (maximum) ms. » 66 % of all devices are better. This means that the measured response time is worse than the average of all tested devices (19.9 ms). | ||
| ↔ Response Time 50% Grey to 80% Grey | ||
| 36 ms ... rise ↗ and fall ↘ combined | ↗ 18 ms rise | 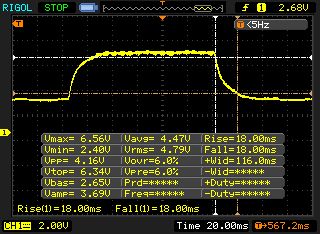 |
| ↘ 18 ms fall | ||
| The screen shows slow response rates in our tests and will be unsatisfactory for gamers. In comparison, all tested devices range from 0.165 (minimum) to 636 (maximum) ms. » 50 % of all devices are better. This means that the measured response time is worse than the average of all tested devices (31.1 ms). | ||
| Cinebench R10 | |
| Rendering Multiple CPUs 32Bit | |
| MSI GT62VR 7RE-223 | |
| Acer Predator 15 G9-593-751X | |
| Rendering Single 32Bit | |
| Acer Predator 15 G9-593-751X | |
| MSI GT62VR 7RE-223 | |
| Geekbench 3 | |
| 32 Bit Multi-Core Score | |
| Acer Predator 15 G9-593-751X | |
| MSI GT62VR 7RE-223 | |
| 32 Bit Single-Core Score | |
| Acer Predator 15 G9-593-751X | |
| MSI GT62VR 7RE-223 | |
| Geekbench 4.0 | |
| 64 Bit Multi-Core Score | |
| Acer Predator 15 G9-593-751X | |
| MSI GT62VR 7RE-223 | |
| 64 Bit Single-Core Score | |
| MSI GT62VR 7RE-223 | |
| Acer Predator 15 G9-593-751X | |
| Geekbench 4.4 | |
| 64 Bit Multi-Core Score | |
| Acer Predator 15 G9-593-751X | |
| 64 Bit Single-Core Score | |
| Acer Predator 15 G9-593-751X | |
| JetStream 1.1 - 1.1 Total | |
| MSI GT62VR 7RE-223 | |
| Acer Predator 15 G9-593-751X | |
| Asus Strix GL502VS-FY032T | |
| PCMark 7 Score | 7004 points | |
| PCMark 8 Home Score Accelerated v2 | 5169 points | |
| PCMark 8 Creative Score Accelerated v2 | 8034 points | |
| PCMark 8 Work Score Accelerated v2 | 5426 points | |
Help | ||
| PCMark 8 | |
| Home Score Accelerated v2 | |
| Acer Predator 15 G9-593-751X | |
| MSI GT62VR 7RE-223 | |
| Alienware 15 R3 | |
| Acer Predator 15 G9-593-765Q | |
| Asus Strix GL502VS-FY032T | |
| Work Score Accelerated v2 | |
| Acer Predator 15 G9-593-751X | |
| MSI GT62VR 7RE-223 | |
| Alienware 15 R3 | |
| Acer Predator 15 G9-593-765Q | |
| Asus Strix GL502VS-FY032T | |

| Acer Predator 15 G9-593-751X Samsung SM951 MZVPV256HDGL m.2 PCI-e | Acer Predator 15 G9-593-765Q LiteOn CV1-8B512 | Alienware 15 R3 | MSI GT62VR 7RE-223 Samsung SSD PM871a MZNLN256HMHQ | Asus Strix GL502VS-FY032T SanDisk SD8SNAT256G1002 | |
|---|---|---|---|---|---|
| CrystalDiskMark 3.0 | -55% | -28% | -47% | -64% | |
| Read Seq (MB/s) | 1939 | 517 -73% | 1123 -42% | 521 -73% | 485.4 -75% |
| Write Seq (MB/s) | 1262 | 449.7 -64% | 429.2 -66% | 422.8 -66% | 312.4 -75% |
| Read 512 (MB/s) | 1078 | 355.3 -67% | 833 -23% | 462 -57% | 294.8 -73% |
| Write 512 (MB/s) | 1192 | 433.7 -64% | 428.1 -64% | 286.9 -76% | 287.8 -76% |
| Read 4k (MB/s) | 50.8 | 27.69 -45% | 37.8 -26% | 38.55 -24% | 21.44 -58% |
| Write 4k (MB/s) | 141.9 | 72.9 -49% | 122.9 -13% | 122.8 -13% | 75.7 -47% |
| Read 4k QD32 (MB/s) | 573 | 290.9 -49% | 542 -5% | 388.4 -32% | 149.4 -74% |
| Write 4k QD32 (MB/s) | 375.3 | 273.8 -27% | 429.8 15% | 257.9 -31% | 256.3 -32% |
| 3DMark 06 Standard Score | 29731 points | |
| 3DMark 11 Performance | 16110 points | |
| 3DMark Ice Storm Standard Score | 139109 points | |
| 3DMark Cloud Gate Standard Score | 28014 points | |
| 3DMark Fire Strike Score | 13584 points | |
| 3DMark Fire Strike Extreme Score | 7411 points | |
| 3DMark Time Spy Score | 5133 points | |
Help | ||
| 3DMark - 1920x1080 Fire Strike Graphics | |
| Alienware 15 R3 | |
| MSI GT62VR 7RE-223 | |
| Acer Predator 15 G9-593-765Q | |
| Acer Predator 15 G9-593-751X | |
| Asus Strix GL502VS-FY032T | |
| Gigabyte Aero 15 | |
| Lenovo Legion Y720 80VR002XGE | |
| 3DMark 11 - 1280x720 Performance GPU | |
| Alienware 15 R3 | |
| MSI GT62VR 7RE-223 | |
| Acer Predator 15 G9-593-765Q | |
| Asus Strix GL502VS-FY032T | |
| Acer Predator 15 G9-593-751X | |
| Gigabyte Aero 15 | |
| Lenovo Legion Y720 80VR002XGE | |
| The Witcher 3 - 1920x1080 Ultra Graphics & Postprocessing (HBAO+) | |
| Acer Predator 15 G9-593-765Q | |
| Acer Predator 15 G9-593-751X | |
| Asus Strix GL502VS-FY032T | |
| Gigabyte Aero 15 | |
| Lenovo Legion Y720 80VR002XGE | |
| Battlefield 1 - 1920x1080 Ultra Preset AA:T | |
| Acer Predator 15 G9-593-751X | |
| Alienware 15 R3 | |
| MSI GT62VR 7RE-223 | |
| BioShock Infinite - 1920x1080 Ultra Preset, DX11 (DDOF) | |
| Acer Predator 15 G9-593-751X | |
| MSI GT62VR 7RE-223 | |
| Lenovo Legion Y720 80VR002XGE | |
| low | med. | high | ultra | |
|---|---|---|---|---|
| Tomb Raider (2013) | 456.5 | 446.2 | 408.4 | 207.3 |
| BioShock Infinite (2013) | 270 | 230.1 | 213.6 | 138.4 |
| The Witcher 3 (2015) | 236.2 | 178 | 110.1 | 59.6 |
| Battlefield 1 (2016) | 184.6 | 159.7 | 123.6 | 112.5 |
| For Honor (2017) | 245.3 | 150.6 | 143.3 | 105.6 |
| Ghost Recon Wildlands (2017) | 127.9 | 95.3 | 84.1 | 51.6 |
| Warhammer 40.000: Dawn of War III (2017) | 151.3 | 89.5 | 64.2 | 55.1 |
| Prey (2017) | 142.5 | 139.3 | 134.5 | 131.6 |
Noise level
| Idle |
| 34 / 36 / 38 dB(A) |
| HDD |
| 36 dB(A) |
| Load |
| 41 / 50 dB(A) |
 | ||
30 dB silent 40 dB(A) audible 50 dB(A) loud |
||
min: | ||
| Acer Predator 15 G9-593-751X i7-7700HQ, GeForce GTX 1070 Mobile | Acer Predator 15 G9-593-765Q 6700HQ, GeForce GTX 1070 Mobile | Alienware 15 R3 i7-7700HQ, GeForce GTX 1070 Mobile | MSI GT62VR 7RE-223 i7-7700HQ, GeForce GTX 1070 Mobile | Asus Strix GL502VS-FY032T 6700HQ, GeForce GTX 1070 Mobile | |
|---|---|---|---|---|---|
| Noise | 3% | -1% | 4% | 6% | |
| off / environment * (dB) | 32 | 30 6% | 30 6% | 30 6% | 30 6% |
| Idle Minimum * (dB) | 34 | 31 9% | 31 9% | 34 -0% | 32 6% |
| Idle Average * (dB) | 36 | 35 3% | 32 11% | 35 3% | 33 8% |
| Idle Maximum * (dB) | 38 | 38 -0% | 42 -11% | 36 5% | 34 11% |
| Load Average * (dB) | 41 | 43 -5% | 49 -20% | 40 2% | 39 5% |
| Witcher 3 ultra * (dB) | 42 | ||||
| Load Maximum * (dB) | 50 | 49 2% | 50 -0% | 46 8% | 51 -2% |
* ... smaller is better
(±) The maximum temperature on the upper side is 42.3 °C / 108 F, compared to the average of 40.4 °C / 105 F, ranging from 21.2 to 68.8 °C for the class Gaming.
(±) The bottom heats up to a maximum of 40.9 °C / 106 F, compared to the average of 43.2 °C / 110 F
(+) In idle usage, the average temperature for the upper side is 26.3 °C / 79 F, compared to the device average of 33.9 °C / 93 F.
(±) Playing The Witcher 3, the average temperature for the upper side is 34.8 °C / 95 F, compared to the device average of 33.9 °C / 93 F.
(+) The palmrests and touchpad are reaching skin temperature as a maximum (32.1 °C / 89.8 F) and are therefore not hot.
(-) The average temperature of the palmrest area of similar devices was 28.8 °C / 83.8 F (-3.3 °C / -6 F).
| Acer Predator 15 G9-593-751X i7-7700HQ, GeForce GTX 1070 Mobile | Acer Predator 15 G9-593-765Q 6700HQ, GeForce GTX 1070 Mobile | Alienware 15 R3 i7-7700HQ, GeForce GTX 1070 Mobile | MSI GT62VR 7RE-223 i7-7700HQ, GeForce GTX 1070 Mobile | Asus Strix GL502VS-FY032T 6700HQ, GeForce GTX 1070 Mobile | |
|---|---|---|---|---|---|
| Heat | 2% | -29% | -3% | -17% | |
| Maximum Upper Side * (°C) | 42.3 | 40.5 4% | 46 -9% | 40.6 4% | 48 -13% |
| Maximum Bottom * (°C) | 40.9 | 42 -3% | 51.8 -27% | 48.4 -18% | 46.8 -14% |
| Idle Upper Side * (°C) | 28.4 | 28.2 1% | 36.5 -29% | 26.8 6% | 33.7 -19% |
| Idle Bottom * (°C) | 25.2 | 24.3 4% | 38.2 -52% | 26.4 -5% | 30.5 -21% |
* ... smaller is better
Acer Predator 15 G9-593-751X audio analysis
(+) | speakers can play relatively loud (91 dB)
Bass 100 - 315 Hz
(±) | reduced bass - on average 14.1% lower than median
(±) | linearity of bass is average (10.6% delta to prev. frequency)
Mids 400 - 2000 Hz
(+) | balanced mids - only 3.2% away from median
(+) | mids are linear (4.9% delta to prev. frequency)
Highs 2 - 16 kHz
(+) | balanced highs - only 3.7% away from median
(+) | highs are linear (5.3% delta to prev. frequency)
Overall 100 - 16.000 Hz
(+) | overall sound is linear (14.1% difference to median)
Compared to same class
» 24% of all tested devices in this class were better, 8% similar, 68% worse
» The best had a delta of 6%, average was 18%, worst was 132%
Compared to all devices tested
» 17% of all tested devices were better, 4% similar, 80% worse
» The best had a delta of 4%, average was 24%, worst was 134%
Alienware 15 R3 audio analysis
(+) | speakers can play relatively loud (82 dB)
Bass 100 - 315 Hz
(-) | nearly no bass - on average 19.1% lower than median
(±) | linearity of bass is average (10.4% delta to prev. frequency)
Mids 400 - 2000 Hz
(±) | higher mids - on average 6.7% higher than median
(±) | linearity of mids is average (7.5% delta to prev. frequency)
Highs 2 - 16 kHz
(+) | balanced highs - only 3.6% away from median
(+) | highs are linear (5.2% delta to prev. frequency)
Overall 100 - 16.000 Hz
(±) | linearity of overall sound is average (21.6% difference to median)
Compared to same class
» 77% of all tested devices in this class were better, 5% similar, 18% worse
» The best had a delta of 6%, average was 18%, worst was 132%
Compared to all devices tested
» 61% of all tested devices were better, 7% similar, 32% worse
» The best had a delta of 4%, average was 24%, worst was 134%
| Off / Standby | |
| Idle | |
| Load |
|
Key:
min: | |
| Acer Predator 15 G9-593-751X i7-7700HQ, GeForce GTX 1070 Mobile | Acer Predator 15 G9-593-765Q 6700HQ, GeForce GTX 1070 Mobile | Alienware 15 R3 i7-7700HQ, GeForce GTX 1070 Mobile | MSI GT62VR 7RE-223 i7-7700HQ, GeForce GTX 1070 Mobile | Asus Strix GL502VS-FY032T 6700HQ, GeForce GTX 1070 Mobile | |
|---|---|---|---|---|---|
| Power Consumption | 2% | 2% | 1% | 1% | |
| Idle Minimum * (Watt) | 18 | 18 -0% | 19 -6% | 20 -11% | 20 -11% |
| Idle Average * (Watt) | 23 | 24 -4% | 23 -0% | 24 -4% | 24 -4% |
| Idle Maximum * (Watt) | 30 | 29 3% | 29 3% | 29 3% | 29 3% |
| Load Average * (Watt) | 89 | 86 3% | 85 4% | 82 8% | 86 3% |
| Witcher 3 ultra * (Watt) | 168 | ||||
| Load Maximum * (Watt) | 213 | 201 6% | 192 10% | 193 9% | 183 14% |
* ... smaller is better
| Acer Predator 15 G9-593-751X i7-7700HQ, GeForce GTX 1070 Mobile, 90 Wh | Acer Predator 15 G9-593-765Q 6700HQ, GeForce GTX 1070 Mobile, Wh | Alienware 15 R3 i7-7700HQ, GeForce GTX 1070 Mobile, 99 Wh | MSI GT62VR 7RE-223 i7-7700HQ, GeForce GTX 1070 Mobile, 75 Wh | Asus Strix GL502VS-FY032T 6700HQ, GeForce GTX 1070 Mobile, 62 Wh | |
|---|---|---|---|---|---|
| Battery runtime | -5% | -17% | -21% | -47% | |
| Reader / Idle (h) | 8.4 | 6.4 -24% | 6.3 -25% | 4.1 -51% | |
| H.264 (h) | 4.9 | 5 2% | 4.4 -10% | 4.2 -14% | |
| WiFi v1.3 (h) | 5.5 | 4.8 -13% | 4.4 -20% | 4.1 -25% | 3.3 -40% |
| Load (h) | 2 | 1.9 -5% | 1.7 -15% | 1.6 -20% | 1 -50% |
Pros
Cons
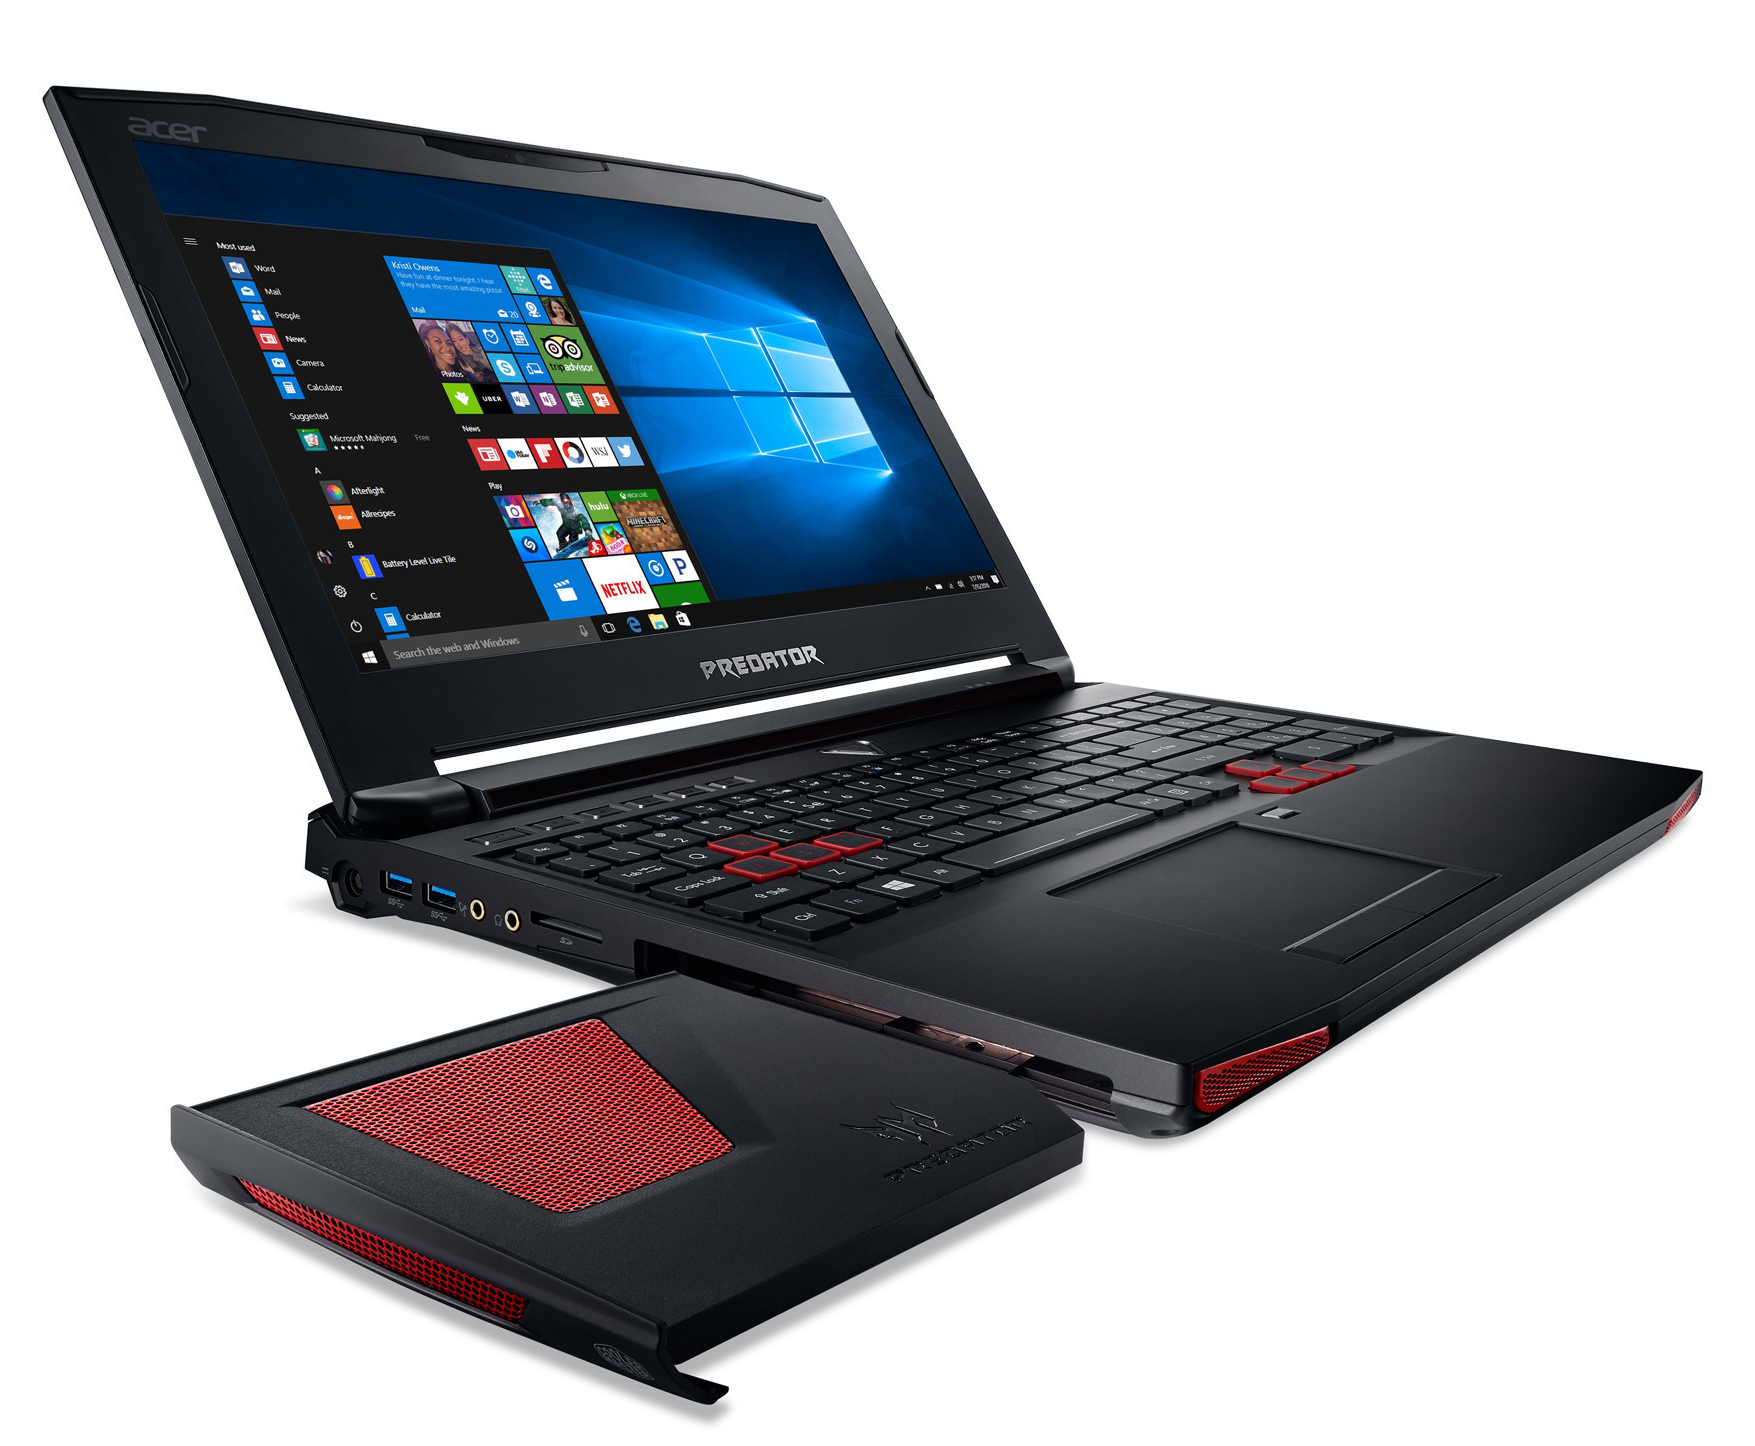
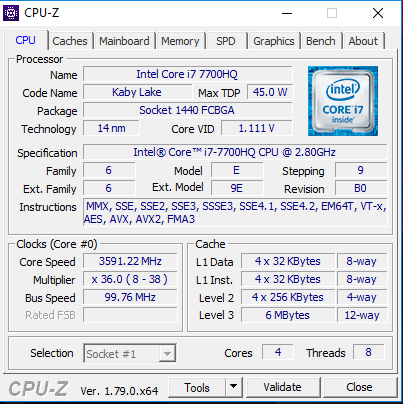
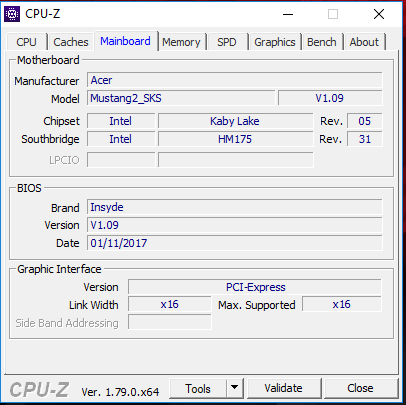
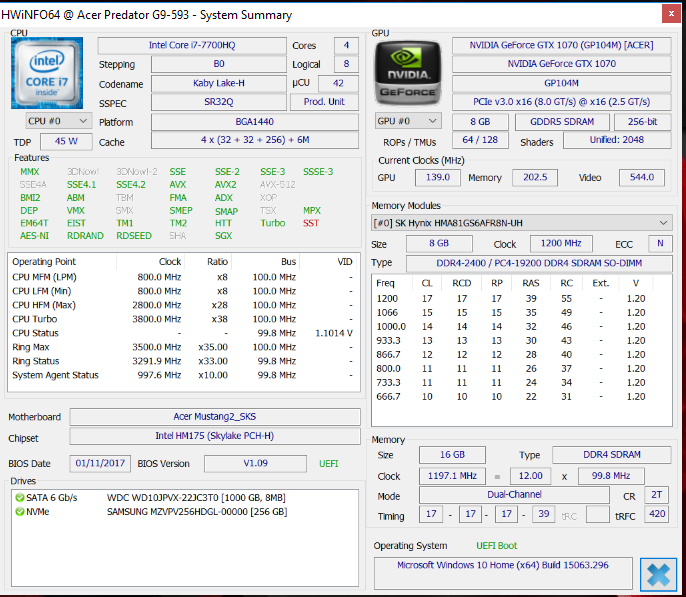
宏碁Predator 15 G9-593-751X机型的主要变化是Kaby Lake处理器更新。它搭配的酷睿-i7-7700HQ四核处理器相比Skylake前代机型只带来了极小的性能改进。它的硬件配置可以满足在高设定和全高清分辨率下流畅运行最新游戏。英伟达的G-Sync技术保证了60赫兹刷新率的顺畅显示效果。它的雾面IPS全高清屏幕提供了优秀的对比度和稳定的可视角度范围。尽管亮度属于可以接受的水平,但还有待提高。
Predator 15是宏碁带来的一台全面均衡的游戏笔记本电脑。
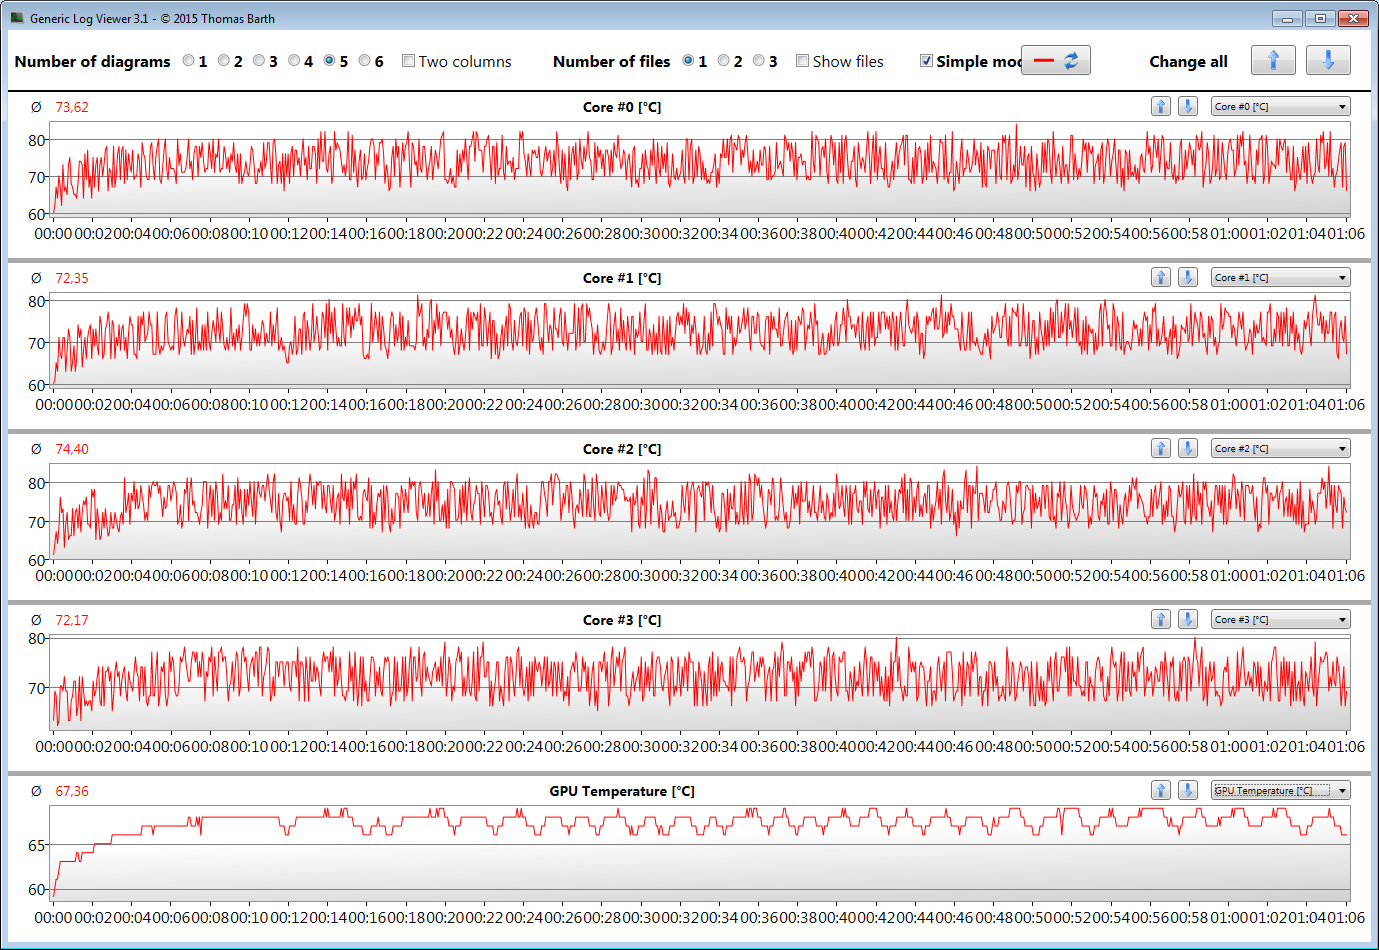
这台设备作为高端笔记本电脑噪音水平中规中矩。它的发热量则相对较低。一块高速NVMe固态硬盘保证了响应迅速的操作系统。一块2.5寸硬盘则提供了1TB的充足存储空间。由于这台设备底部设计有维护底盖,更换升级硬盘将十分容易。
注:本文是基于完整评测的缩减版本,阅读完整的英文评测,请点击这里。
Acer Predator 15 G9-593-751X
- 05/28/2017 v6 (old)
Sascha Mölck