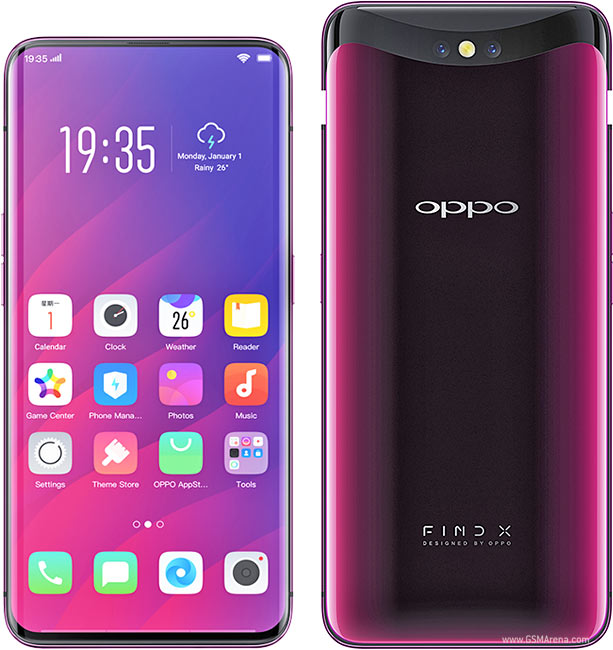
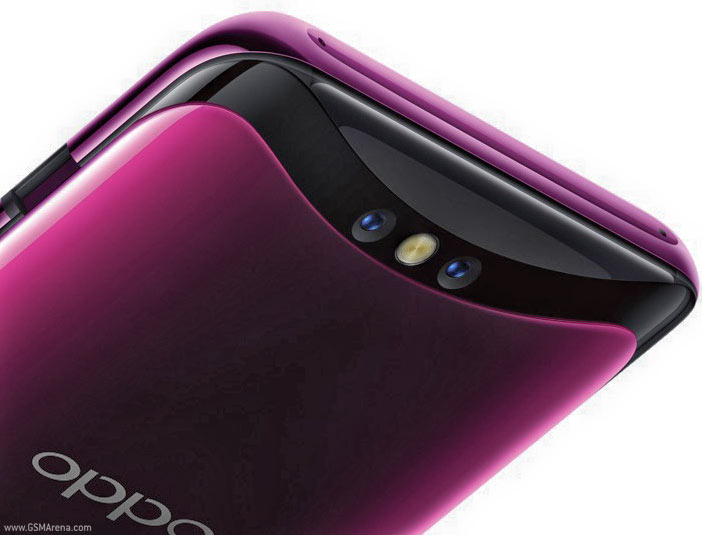
Oppo Find X智能手机评测
| Networking | |
| iperf3 transmit AX12 | |
| Xiaomi Mi 8 Explorer Edition | |
| Vivo Nex Ultimate | |
| Samsung Galaxy S9 Plus | |
| Oppo Find X | |
| Huawei P20 Pro | |
| iperf3 receive AX12 | |
| Samsung Galaxy S9 Plus | |
| Huawei P20 Pro | |
| Xiaomi Mi 8 Explorer Edition | |
| Oppo Find X | |
| Vivo Nex Ultimate | |


| |||||||||||||||||||||||||
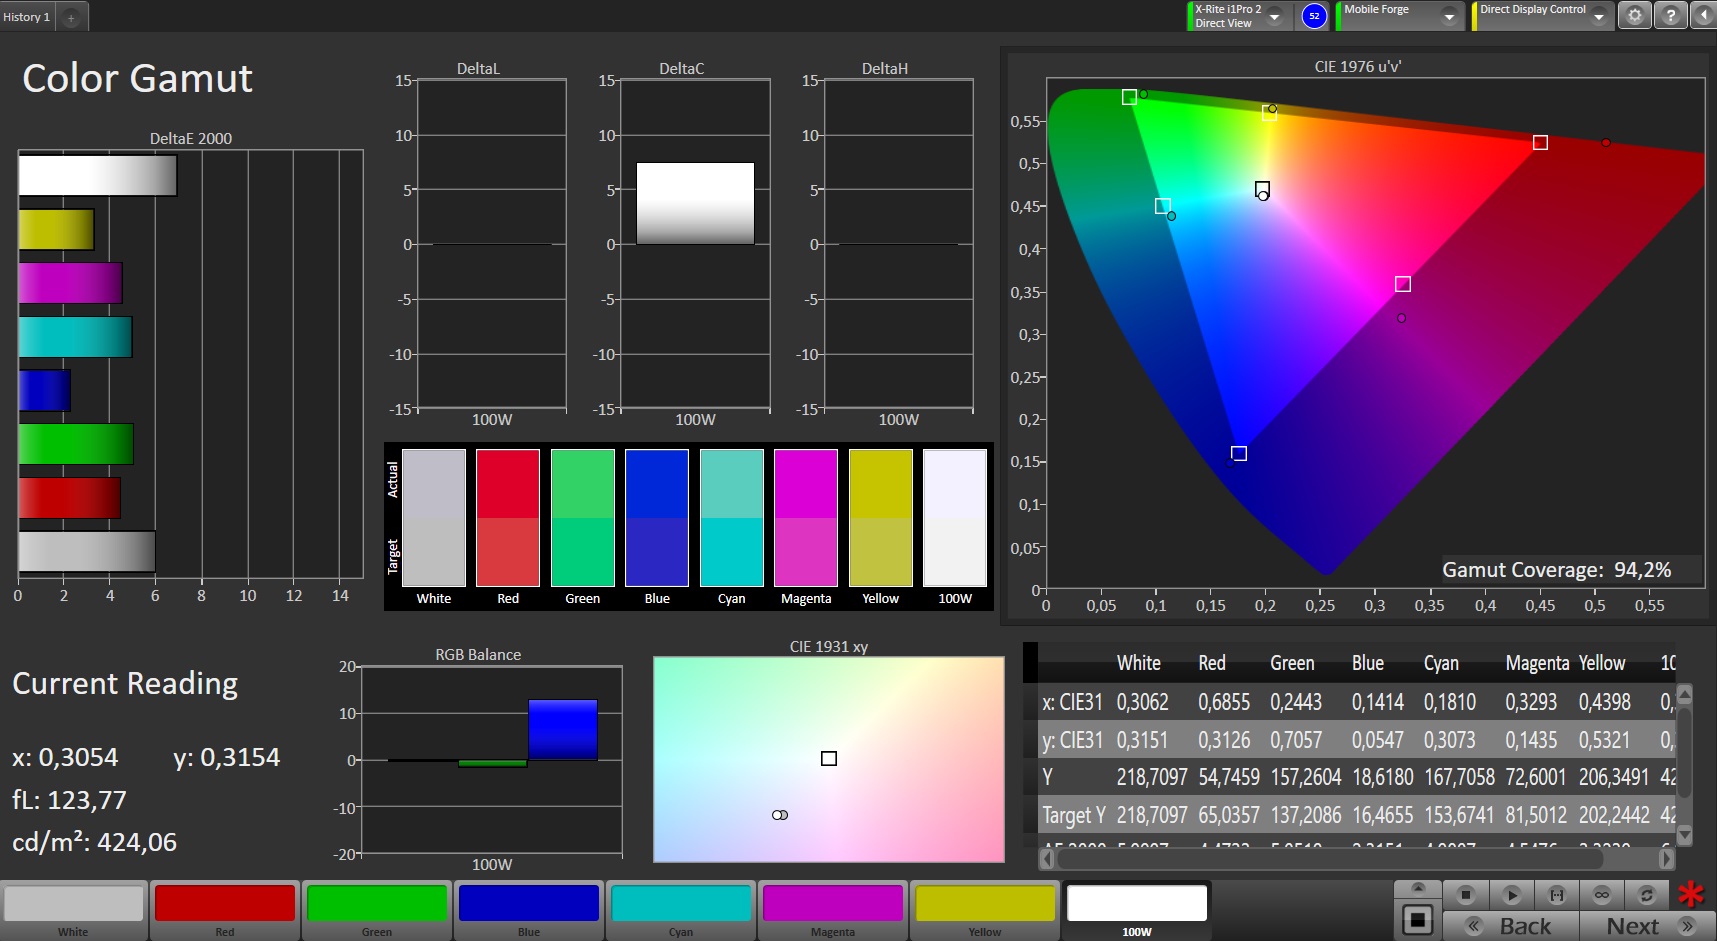
Brightness Distribution: 87 %
Center on Battery: 427 cd/m²
Contrast: ∞:1 (Black: 0 cd/m²)
ΔE ColorChecker Calman: 5.37 | ∀{0.5-29.43 Ø4.73}
ΔE Greyscale Calman: 4 | ∀{0.09-98 Ø4.97}
146.5% sRGB (Calman 2D)
Gamma: 2.243
CCT: 6851 K
| Oppo Find X AMOLED, 2340x1080, 6.4" | Vivo Nex Ultimate Super AMOLED, 2316x1080, 6.6" | Xiaomi Mi 8 Explorer Edition Super AMOLED, 2248x1080, 6.2" | Samsung Galaxy S9 Plus Super AMOLED, 2960x1440, 6.2" | Huawei P20 Pro OLED, 2240x1080, 6.1" | |
|---|---|---|---|---|---|
| Screen | -28% | 14% | 37% | 47% | |
| Brightness middle (cd/m²) | 427 | 356 -17% | 429 0% | 565 32% | 569 33% |
| Brightness (cd/m²) | 432 | 352 -19% | 432 0% | 571 32% | 578 34% |
| Brightness Distribution (%) | 87 | 95 9% | 88 1% | 96 10% | 95 9% |
| Black Level * (cd/m²) | |||||
| Colorchecker dE 2000 * | 5.37 | 7.08 -32% | 3.39 37% | 2.3 57% | 1.3 76% |
| Colorchecker dE 2000 max. * | 7.51 | 14.1 -88% | 5.25 30% | 4.8 36% | 2.1 72% |
| Greyscale dE 2000 * | 4 | 4.7 -18% | 3.3 17% | 1.9 52% | 1.6 60% |
| Gamma | 2.243 98% | 2.096 105% | 2.238 98% | 2.16 102% | 2.31 95% |
| CCT | 6851 95% | 7297 89% | 7135 91% | 6332 103% | 6401 102% |
* ... smaller is better
Screen Flickering / PWM (Pulse-Width Modulation)
| Screen flickering / PWM detected | 227 Hz | 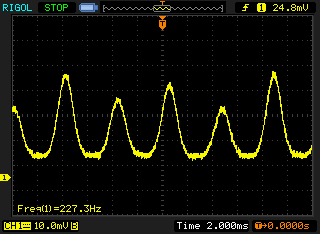 | |
The display backlight flickers at 227 Hz (worst case, e.g., utilizing PWM) . The frequency of 227 Hz is relatively low, so sensitive users will likely notice flickering and experience eyestrain at the stated brightness setting and below. In comparison: 52 % of all tested devices do not use PWM to dim the display. If PWM was detected, an average of 7798 (minimum: 5 - maximum: 343500) Hz was measured. | |||
Display Response Times
| ↔ Response Time Black to White | ||
|---|---|---|
| 6 ms ... rise ↗ and fall ↘ combined | ↗ 3 ms rise | 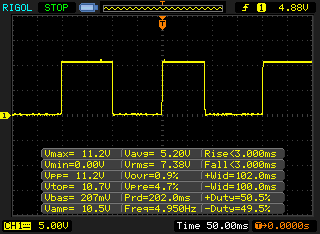 |
| ↘ 3 ms fall | ||
| The screen shows very fast response rates in our tests and should be very well suited for fast-paced gaming. In comparison, all tested devices range from 0.1 (minimum) to 240 (maximum) ms. » 18 % of all devices are better. This means that the measured response time is better than the average of all tested devices (19.9 ms). | ||
| ↔ Response Time 50% Grey to 80% Grey | ||
| 8 ms ... rise ↗ and fall ↘ combined | ↗ 5 ms rise | 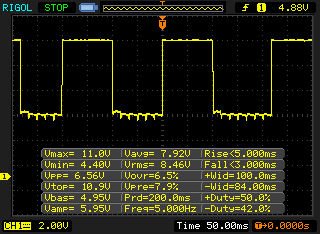 |
| ↘ 3 ms fall | ||
| The screen shows fast response rates in our tests and should be suited for gaming. In comparison, all tested devices range from 0.165 (minimum) to 636 (maximum) ms. » 20 % of all devices are better. This means that the measured response time is better than the average of all tested devices (31.1 ms). | ||
| AnTuTu v7 - Total Score (sort by value) | |
| Oppo Find X | |
| Vivo Nex Ultimate | |
| Xiaomi Mi 8 Explorer Edition | |
| Samsung Galaxy S9 Plus | |
| Huawei P20 Pro | |
| Average Qualcomm Snapdragon 845 (246366 - 299878, n=27) | |
| JetStream 1.1 - 1.1 Total | |
| Xiaomi Mi 8 Explorer Edition (Chrome 69) | |
| Average Qualcomm Snapdragon 845 (22.5 - 90.9, n=25) | |
| Samsung Galaxy S9 Plus (Samsung Browser 7.0) | |
| Oppo Find X (Chrome 69) | |
| Huawei P20 Pro (Chrome 65) | |
| Vivo Nex Ultimate (Chrome 67) | |
| Octane V2 - Total Score | |
| Average of class Smartphone (2800 - 126661, n=157, last 2 years) | |
| Average Qualcomm Snapdragon 845 (3991 - 18275, n=28) | |
| Samsung Galaxy S9 Plus (Samsung Browser 7.0) | |
| Xiaomi Mi 8 Explorer Edition (Chrome 69) | |
| Oppo Find X (Chrome 69) | |
| Huawei P20 Pro (Chrome 65) | |
| Vivo Nex Ultimate (Chrome 67) | |
| Mozilla Kraken 1.1 - Total | |
| Vivo Nex Ultimate (Chrome 67) | |
| Huawei P20 Pro (Chrome 65) | |
| Oppo Find X (Chrome 69) | |
| Average Qualcomm Snapdragon 845 (2154 - 11204, n=28) | |
| Xiaomi Mi 8 Explorer Edition (Chrome 69) | |
| Samsung Galaxy S9 Plus (Samsung Browser 7.0) | |
| Average of class Smartphone (257 - 28190, n=135, last 2 years) | |
* ... smaller is better
| Oppo Find X | Vivo Nex Ultimate | Xiaomi Mi 8 Explorer Edition | Samsung Galaxy S9 Plus | Huawei P20 Pro | Average 128 GB UFS 2.1 Flash | Average of class Smartphone | |
|---|---|---|---|---|---|---|---|
| AndroBench 3-5 | -8% | -8% | -5% | 125% | 109% | 596% | |
| Sequential Read 256KB (MB/s) | 761 | 687 -10% | 692 -9% | 819 8% | 832 9% | 762 ? 0% | 2251 ? 196% |
| Sequential Write 256KB (MB/s) | 206.9 | 228.4 10% | 205.2 -1% | 204.9 -1% | 196.7 -5% | 300 ? 45% | 1932 ? 834% |
| Random Read 4KB (MB/s) | 145.9 | 126.7 -13% | 135.2 -7% | 129.7 -11% | 144.3 -1% | 154.7 ? 6% | 310 ? 112% |
| Random Write 4KB (MB/s) | 26.98 | 22.1 -18% | 22.65 -16% | 22.74 -16% | 160.5 495% | 131.1 ? 386% | 362 ? 1242% |
| Sequential Read 256KB SDCard (MB/s) | 79.2 ? | 76 ? | |||||
| Sequential Write 256KB SDCard (MB/s) | 67.2 ? | 59.6 ? |
(±) The maximum temperature on the upper side is 41.6 °C / 107 F, compared to the average of 35.3 °C / 96 F, ranging from 21.9 to 247 °C for the class Smartphone.
(+) The bottom heats up to a maximum of 36.8 °C / 98 F, compared to the average of 34 °C / 93 F
(+) In idle usage, the average temperature for the upper side is 25 °C / 77 F, compared to the device average of 32.9 °C / 91 F.
Oppo Find X audio analysis
(±) | speaker loudness is average but good (81.5 dB)
Bass 100 - 315 Hz
(-) | nearly no bass - on average 63.3% lower than median
(+) | bass is linear (0% delta to prev. frequency)
Mids 400 - 2000 Hz
(-) | nearly no mids - on average 63.3% lower than median
(+) | mids are linear (0% delta to prev. frequency)
Highs 2 - 16 kHz
(-) | nearly no highs - on average 63.3% lower than median
(+) | highs are linear (0% delta to prev. frequency)
Overall 100 - 16.000 Hz
(-) | overall sound is not linear (116.9% difference to median)
Compared to same class
» 88% of all tested devices in this class were better, 6% similar, 6% worse
» The best had a delta of 11%, average was 34%, worst was 134%
Compared to all devices tested
» 96% of all tested devices were better, 2% similar, 2% worse
» The best had a delta of 4%, average was 24%, worst was 134%
Vivo Nex Ultimate audio analysis
(+) | speakers can play relatively loud (82.5 dB)
Bass 100 - 315 Hz
(-) | nearly no bass - on average 65.5% lower than median
(+) | bass is linear (0% delta to prev. frequency)
Mids 400 - 2000 Hz
(-) | nearly no mids - on average 65.5% lower than median
(+) | mids are linear (0% delta to prev. frequency)
Highs 2 - 16 kHz
(-) | nearly no highs - on average 65.5% lower than median
(+) | highs are linear (0% delta to prev. frequency)
Overall 100 - 16.000 Hz
(-) | overall sound is not linear (115% difference to median)
Compared to same class
» 88% of all tested devices in this class were better, 4% similar, 9% worse
» The best had a delta of 11%, average was 34%, worst was 134%
Compared to all devices tested
» 96% of all tested devices were better, 1% similar, 3% worse
» The best had a delta of 4%, average was 24%, worst was 134%
| Off / Standby | |
| Idle | |
| Load |
|
Key:
min: | |
| Oppo Find X 3730 mAh | Vivo Nex Ultimate 4000 mAh | Xiaomi Mi 8 Explorer Edition 3000 mAh | Samsung Galaxy S9 Plus 3500 mAh | Huawei P20 Pro 4000 mAh | Average Qualcomm Snapdragon 845 | Average of class Smartphone | |
|---|---|---|---|---|---|---|---|
| Power Consumption | 30% | -27% | 45% | 44% | 18% | 14% | |
| Idle Minimum * (Watt) | 0.9 | 0.9 -0% | 1.8 -100% | 0.68 24% | 0.84 7% | 0.862 ? 4% | 0.875 ? 3% |
| Idle Average * (Watt) | 1.9 | 1.5 21% | 2.9 -53% | 0.95 50% | 1.54 19% | 1.728 ? 9% | 1.47 ? 23% |
| Idle Maximum * (Watt) | 3.2 | 1.7 47% | 3.5 -9% | 1.09 66% | 1.57 51% | 2.07 ? 35% | 1.659 ? 48% |
| Load Average * (Watt) | 7.1 | 3.7 48% | 4.8 32% | 4.58 35% | 2.47 65% | 4.87 ? 31% | 6.8 ? 4% |
| Load Maximum * (Watt) | 10.7 | 7.2 33% | 11.2 -5% | 5.16 52% | 2.49 77% | 9.27 ? 13% | 11.3 ? -6% |
* ... smaller is better
| Oppo Find X 3730 mAh | Vivo Nex Ultimate 4000 mAh | Xiaomi Mi 8 Explorer Edition 3000 mAh | Samsung Galaxy S9 Plus 3500 mAh | Huawei P20 Pro 4000 mAh | |
|---|---|---|---|---|---|
| Battery runtime | |||||
| WiFi v1.3 (h) | 9.9 | 17.1 73% | 11.6 17% | 8.7 -12% | 12.4 25% |
Pros
Cons
总结-Oppo Find X拥有性能强劲的硬件,但软件需要一定的适应时间:
Oppo Find X是今年最漂亮的智能手机之一。滑盖技术将相机模块和传感器很好地隐藏了起来,使得机身变得干净整洁,同时拥有优秀的做工和手感。出色的摄像头,电池,和高通骁龙845的性能,让我们挑不出任何缺点。对于其5000-6000元的售价来说,硬件方面很少有令人不满的地方,唯一的遗憾就是NFC的缺失。
“虽然未来并不太可能属于电动滑盖,但它仍然很好地解决了刘海屏带来的困扰。”
Find X最大的问题在于它的软件。内置的ColorOS有着诸多限制,这在日常使用中很成问题。例如,在测试过程中我们总是不能及时收到通知和消息,而且,即使有着8 GB的内存,系统却最多只允许5个活跃的后台软件。
这些软件上的问题使得我们扣掉了一分整体分。
Oppo Find X
- 10/22/2018 v6 (old)
Marcus Herbrich
Price comparison
