一加6T智能手机评测
| Networking | |
| iperf3 transmit AX12 | |
| Sony Xperia XZ2 Premium | |
| OnePlus 6 | |
| Apple iPhone Xs Max | |
| Samsung Galaxy S9 Plus | |
| OnePlus 6T | |
| iperf3 receive AX12 | |
| Sony Xperia XZ2 Premium | |
| Samsung Galaxy S9 Plus | |
| OnePlus 6T | |
| Apple iPhone Xs Max | |
| OnePlus 6 | |


| |||||||||||||||||||||||||
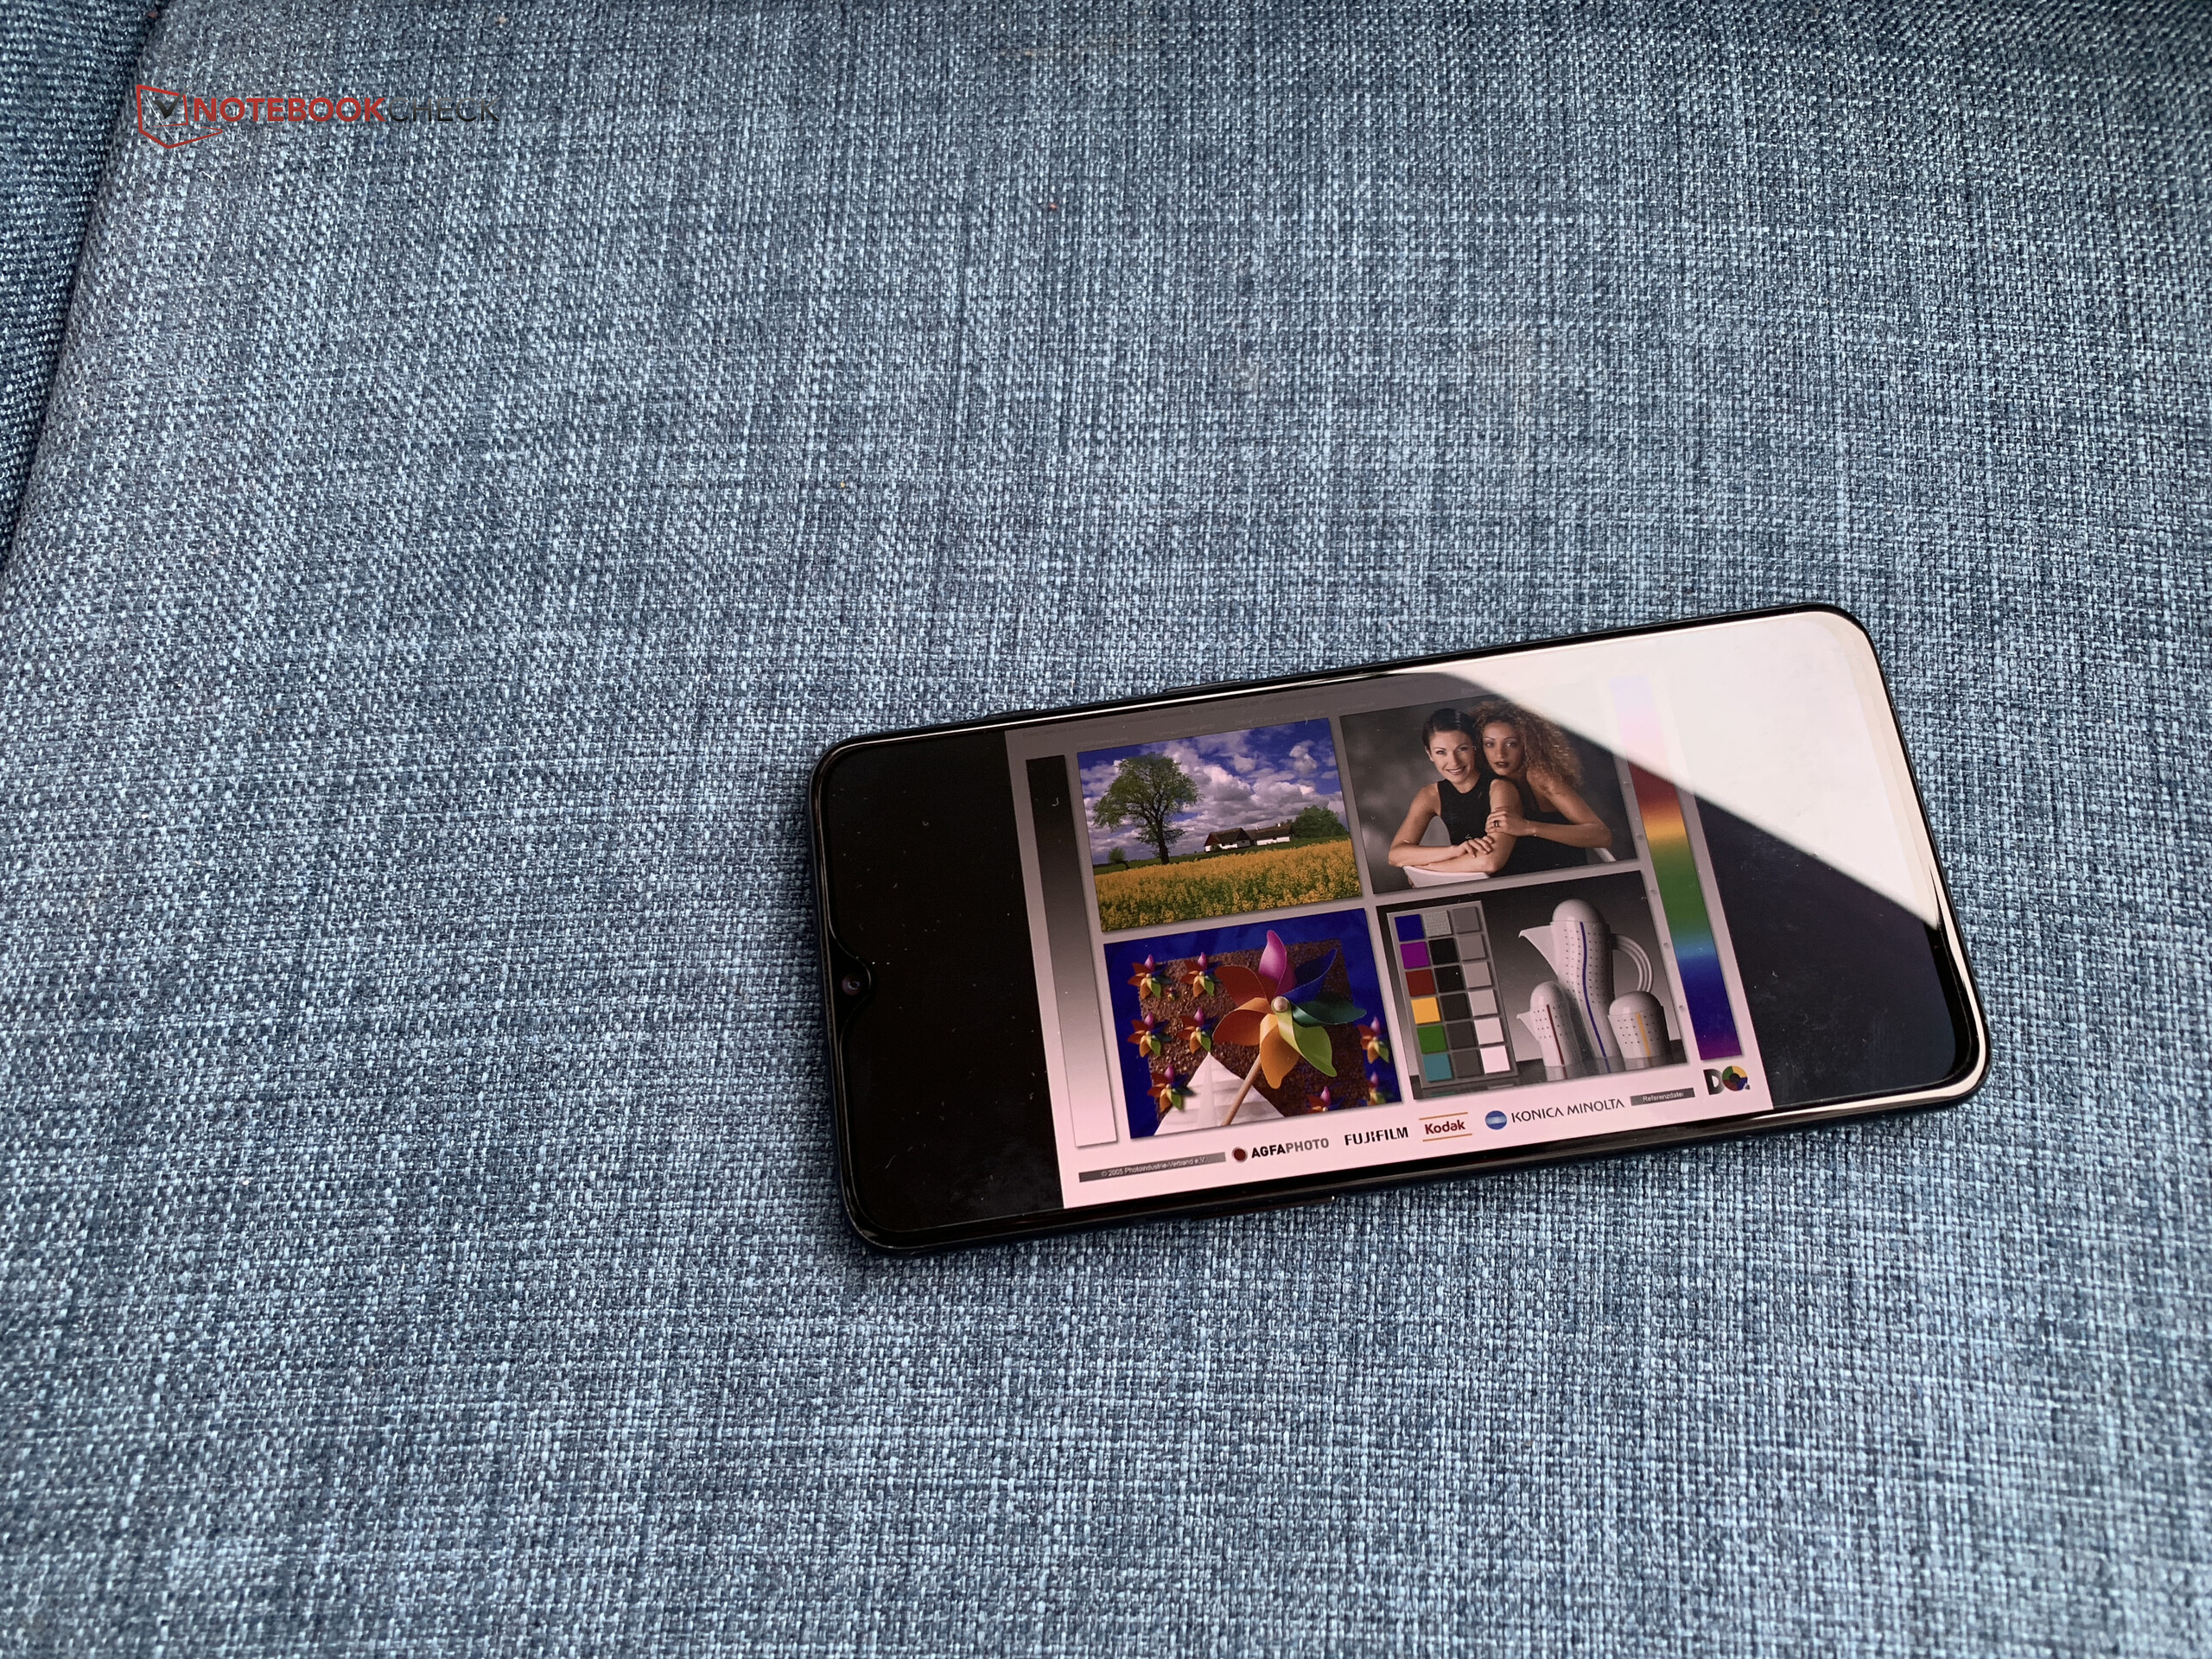
Brightness Distribution: 95 %
Center on Battery: 437 cd/m²
Contrast: ∞:1 (Black: 0 cd/m²)
ΔE ColorChecker Calman: 2.21 | ∀{0.5-29.43 Ø4.71}
ΔE Greyscale Calman: 2.1 | ∀{0.09-98 Ø4.96}
99.6% sRGB (Calman 2D)
Gamma: 2.307
CCT: 6353 K
| OnePlus 6T Optic AMOLED, 2340x1080, 6.4" | OnePlus 6 Optic AMOLED, 2280x1080, 6.3" | Samsung Galaxy S9 Plus Super AMOLED, 2960x1440, 6.2" | Sony Xperia XZ2 Premium LCD-IPS, 3840x2160, 5.8" | Apple iPhone Xs Max OLED, 2688x1242, 6.5" | Huawei P20 Pro OLED, 2240x1080, 6.1" | |
|---|---|---|---|---|---|---|
| Screen | -6% | 9% | -10% | 28% | 30% | |
| Brightness middle (cd/m²) | 437 | 430 -2% | 565 29% | 477 9% | 656 50% | 569 30% |
| Brightness (cd/m²) | 442 | 437 -1% | 571 29% | 453 2% | 659 49% | 578 31% |
| Brightness Distribution (%) | 95 | 87 -8% | 96 1% | 86 -9% | 88 -7% | 95 0% |
| Black Level * (cd/m²) | 0.33 | |||||
| Colorchecker dE 2000 * | 2.21 | 2.3 -4% | 2.3 -4% | 2.1 5% | 1.7 23% | 1.3 41% |
| Colorchecker dE 2000 max. * | 4.27 | 4.6 -8% | 4.8 -12% | 8.2 -92% | 2.8 34% | 2.1 51% |
| Greyscale dE 2000 * | 2.1 | 2.4 -14% | 1.9 10% | 1.6 24% | 1.7 19% | 1.6 24% |
| Gamma | 2.307 95% | 2.28 96% | 2.16 102% | 2.28 96% | 1.998 110% | 2.31 95% |
| CCT | 6353 102% | 6160 106% | 6332 103% | 6425 101% | 6487 100% | 6401 102% |
| Contrast (:1) | 1445 |
* ... smaller is better
Screen Flickering / PWM (Pulse-Width Modulation)
| Screen flickering / PWM detected | 240 Hz | ≤ 99 % brightness setting | 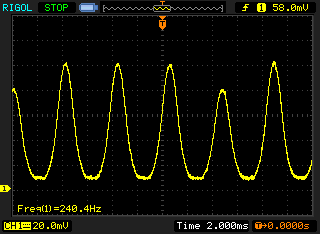 |
The display backlight flickers at 240 Hz (worst case, e.g., utilizing PWM) Flickering detected at a brightness setting of 99 % and below. There should be no flickering or PWM above this brightness setting. The frequency of 240 Hz is relatively low, so sensitive users will likely notice flickering and experience eyestrain at the stated brightness setting and below. In comparison: 52 % of all tested devices do not use PWM to dim the display. If PWM was detected, an average of 7754 (minimum: 5 - maximum: 343500) Hz was measured. | |||
Display Response Times
| ↔ Response Time Black to White | ||
|---|---|---|
| 6 ms ... rise ↗ and fall ↘ combined | ↗ 3 ms rise | 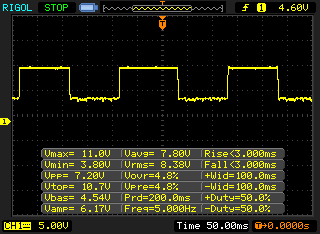 |
| ↘ 3 ms fall | ||
| The screen shows very fast response rates in our tests and should be very well suited for fast-paced gaming. In comparison, all tested devices range from 0.1 (minimum) to 240 (maximum) ms. » 19 % of all devices are better. This means that the measured response time is better than the average of all tested devices (19.8 ms). | ||
| ↔ Response Time 50% Grey to 80% Grey | ||
| 12 ms ... rise ↗ and fall ↘ combined | ↗ 6 ms rise | 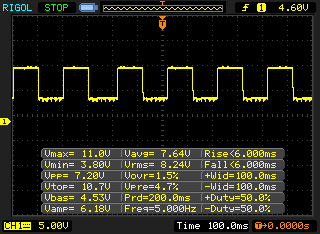 |
| ↘ 6 ms fall | ||
| The screen shows good response rates in our tests, but may be too slow for competitive gamers. In comparison, all tested devices range from 0.165 (minimum) to 636 (maximum) ms. » 25 % of all devices are better. This means that the measured response time is better than the average of all tested devices (31 ms). | ||
| PCMark for Android | |
| Work performance score (sort by value) | |
| OnePlus 6T | |
| OnePlus 6 | |
| Samsung Galaxy S9 Plus | |
| Sony Xperia XZ2 Premium | |
| Huawei P20 Pro | |
| Average Qualcomm Snapdragon 845 (7998 - 13211, n=26) | |
| Work 2.0 performance score (sort by value) | |
| OnePlus 6T | |
| OnePlus 6 | |
| Samsung Galaxy S9 Plus | |
| Sony Xperia XZ2 Premium | |
| Huawei P20 Pro | |
| Average Qualcomm Snapdragon 845 (7360 - 9868, n=27) | |
| Basemark GPU 1.1 | |
| 1920x1080 Vulkan Medium Offscreen (sort by value) | |
| OnePlus 6T | |
| OnePlus 6 | |
| Huawei P20 Pro | |
| Average Qualcomm Snapdragon 845 (21.3 - 32.9, n=5) | |
| Vulkan Medium Native (sort by value) | |
| OnePlus 6T | |
| OnePlus 6 | |
| Huawei P20 Pro | |
| Average Qualcomm Snapdragon 845 (15.8 - 29.7, n=5) | |
| 1920x1080 OpenGL Medium Offscreen (sort by value) | |
| OnePlus 6T | |
| OnePlus 6 | |
| Huawei P20 Pro | |
| Average Qualcomm Snapdragon 845 (24.5 - 35.3, n=5) | |
| AnTuTu v7 - Total Score (sort by value) | |
| OnePlus 6T | |
| OnePlus 6 | |
| Samsung Galaxy S9 Plus | |
| Sony Xperia XZ2 Premium | |
| Apple iPhone Xs Max | |
| Huawei P20 Pro | |
| Average Qualcomm Snapdragon 845 (246366 - 299878, n=27) | |
| AnTuTu v6 - Total Score (sort by value) | |
| OnePlus 6T | |
| OnePlus 6 | |
| Samsung Galaxy S9 Plus | |
| Sony Xperia XZ2 Premium | |
| Huawei P20 Pro | |
| Average Qualcomm Snapdragon 845 (162183 - 242953, n=23) | |
| VRMark - Amber Room (sort by value) | |
| OnePlus 6T | |
| OnePlus 6 | |
| Huawei P20 Pro | |
| Average Qualcomm Snapdragon 845 (4598 - 4731, n=4) | |
| Basemark ES 3.1 / Metal - offscreen Overall Score (sort by value) | |
| OnePlus 6T | |
| OnePlus 6 | |
| Samsung Galaxy S9 Plus | |
| Apple iPhone Xs Max | |
| Huawei P20 Pro | |
| Average Qualcomm Snapdragon 845 (1169 - 1201, n=5) | |
| Average of class Smartphone (544 - 7731, n=18, last 2 years) | |
| JetStream 1.1 - 1.1 Total | |
| Apple iPhone Xs Max (Safari 12) | |
| OnePlus 6 (Chrome 66) | |
| OnePlus 6T (Chrome 70) | |
| Average Qualcomm Snapdragon 845 (22.5 - 90.9, n=25) | |
| Sony Xperia XZ2 Premium (Chrome 68) | |
| Samsung Galaxy S9 Plus (Samsung Browser 7.0) | |
| Huawei P20 Pro (Chrome 65) | |
| Octane V2 - Total Score | |
| Average of class Smartphone (2800 - 126661, n=142, last 2 years) | |
| Apple iPhone Xs Max (Safari 12) | |
| OnePlus 6 (Chrome 66) | |
| OnePlus 6T (Chrome 70) | |
| Average Qualcomm Snapdragon 845 (3991 - 18275, n=28) | |
| Samsung Galaxy S9 Plus (Samsung Browser 7.0) | |
| Sony Xperia XZ2 Premium (Chrome 68) | |
| Huawei P20 Pro (Chrome 65) | |
| Mozilla Kraken 1.1 - Total | |
| Huawei P20 Pro (Chrome 65) | |
| Sony Xperia XZ2 Premium (Chrome 68) | |
| Average Qualcomm Snapdragon 845 (2154 - 11204, n=28) | |
| OnePlus 6 (Chrome 66) | |
| OnePlus 6T (Chrome 70) | |
| Samsung Galaxy S9 Plus (Samsung Browser 7.0) | |
| Average of class Smartphone (257 - 28190, n=121, last 2 years) | |
| Apple iPhone Xs Max (Safari 12) | |
| WebXPRT 3 - Overall | |
| Average of class Smartphone (104 - 380, n=12, last 2 years) | |
| Apple iPhone Xs Max (Safari 12) | |
| OnePlus 6 (Chrome 66) | |
| Average Qualcomm Snapdragon 845 (19 - 103, n=17) | |
| Sony Xperia XZ2 Premium (Chrome 68) | |
| Huawei P20 Pro (Chrome 65) | |
| Samsung Galaxy S9 Plus | |
| WebXPRT 2015 - Overall | |
| Apple iPhone Xs Max (Safari 12) | |
| OnePlus 6T (Chrome 70) | |
| OnePlus 6 (Chrome 66) | |
| Average Qualcomm Snapdragon 845 (96 - 291, n=23) | |
| Sony Xperia XZ2 Premium (Chrome 68) | |
| Huawei P20 Pro (Chrome 65) | |
| Samsung Galaxy S9 Plus (Samsung Browser 7.0) | |
* ... smaller is better
| OnePlus 6T | OnePlus 6 | Samsung Galaxy S9 Plus | Sony Xperia XZ2 Premium | Huawei P20 Pro | Average 128 GB UFS 2.1 Flash | Average of class Smartphone | |
|---|---|---|---|---|---|---|---|
| AndroBench 3-5 | -1% | 2% | -4% | 161% | 140% | 672% | |
| Sequential Read 256KB (MB/s) | 735 | 726 -1% | 819 11% | 749 2% | 832 13% | 762 ? 4% | 2225 ? 203% |
| Sequential Write 256KB (MB/s) | 204.4 | 201.4 -1% | 204.9 0% | 171 -16% | 196.7 -4% | 300 ? 47% | 1903 ? 831% |
| Random Read 4KB (MB/s) | 138.5 | 137 -1% | 129.7 -6% | 136 -2% | 144.3 4% | 154.7 ? 12% | 311 ? 125% |
| Random Write 4KB (MB/s) | 22 | 21.8 -1% | 22.74 3% | 21.75 -1% | 160.5 630% | 131.1 ? 496% | 358 ? 1527% |
| Sequential Read 256KB SDCard (MB/s) | 79.2 ? | 34.18 ? | 76 ? | ||||
| Sequential Write 256KB SDCard (MB/s) | 67.2 ? | 30.23 ? | 59.6 ? |
| Shadow Fight 3 | |||
| Settings | Value | ||
| high | 60 fps | ||
| minimal | 60 fps | ||
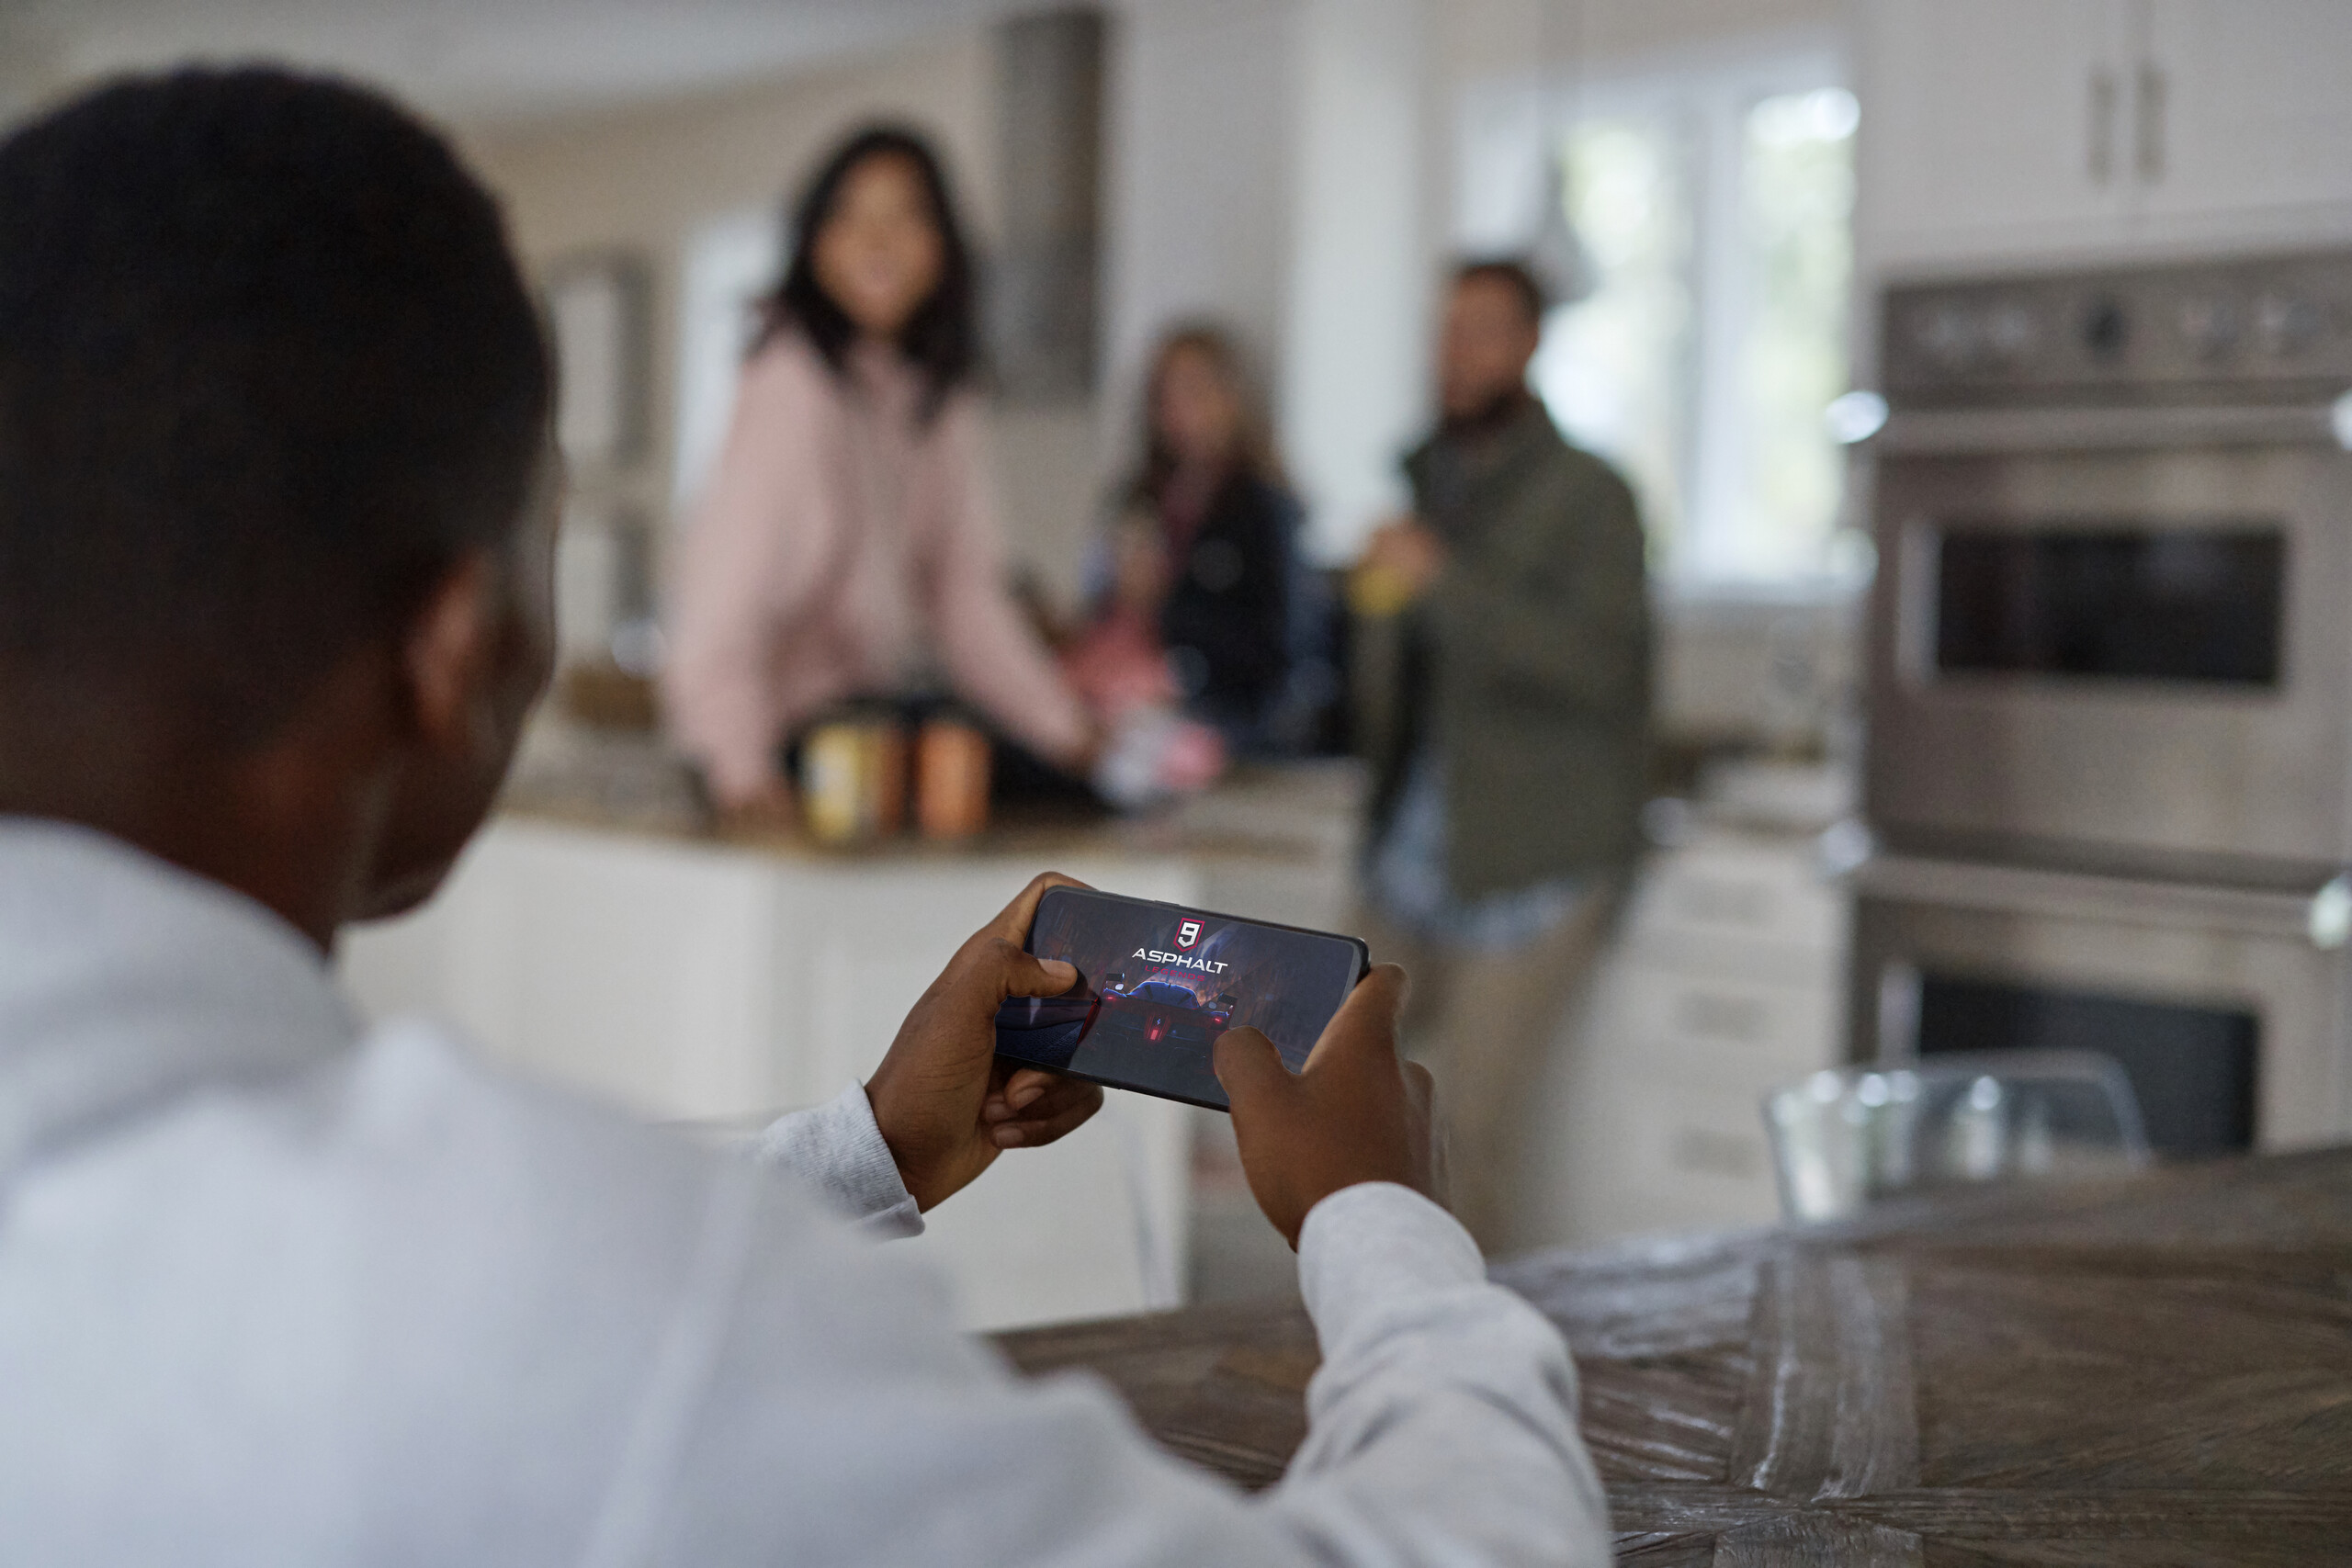
| Asphalt 9: Legends | |||
| Settings | Value | ||
| High Quality | 30 fps | ||
| Standard / low | 30 fps | ||
| Arena of Valor | |||
| Settings | Value | ||
| min | 60 fps | ||
| high HD | 60 fps | ||
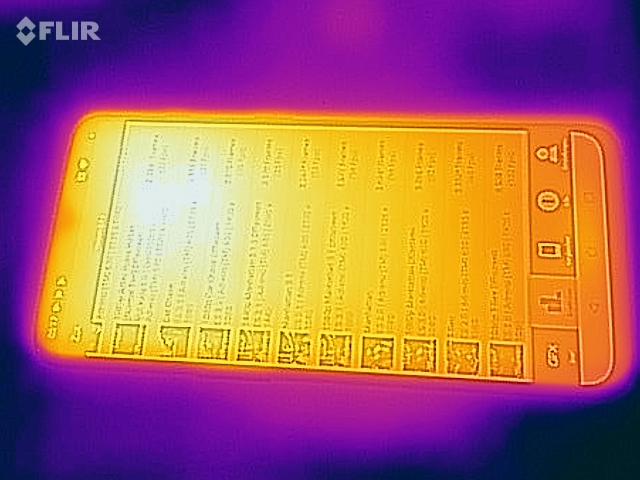
(-) The maximum temperature on the upper side is 48.6 °C / 119 F, compared to the average of 35.3 °C / 96 F, ranging from 21.9 to 247 °C for the class Smartphone.
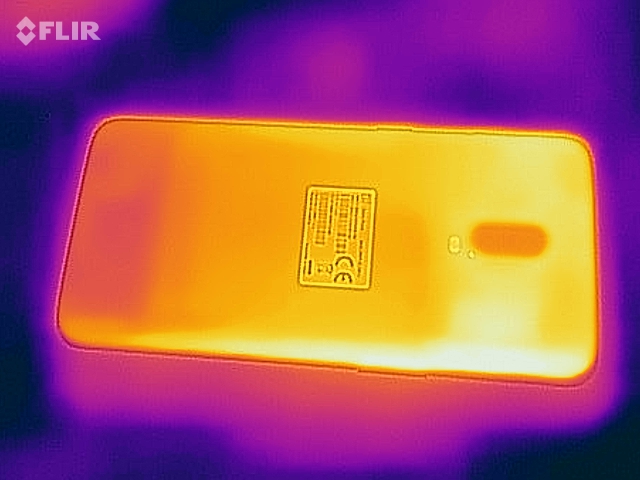
(±) The bottom heats up to a maximum of 42 °C / 108 F, compared to the average of 34 °C / 93 F
(+) In idle usage, the average temperature for the upper side is 29.3 °C / 85 F, compared to the device average of 33 °C / 91 F.
OnePlus 6T audio analysis
(±) | speaker loudness is average but good (80.5 dB)
Bass 100 - 315 Hz
(-) | nearly no bass - on average 62.9% lower than median
(+) | bass is linear (0% delta to prev. frequency)
Mids 400 - 2000 Hz
(-) | nearly no mids - on average 62.9% lower than median
(+) | mids are linear (0% delta to prev. frequency)
Highs 2 - 16 kHz
(-) | nearly no highs - on average 62.9% lower than median
(+) | highs are linear (0% delta to prev. frequency)
Overall 100 - 16.000 Hz
(-) | overall sound is not linear (116.1% difference to median)
Compared to same class
» 88% of all tested devices in this class were better, 4% similar, 8% worse
» The best had a delta of 11%, average was 34%, worst was 134%
Compared to all devices tested
» 96% of all tested devices were better, 1% similar, 2% worse
» The best had a delta of 4%, average was 23%, worst was 134%
OnePlus 6 audio analysis
(±) | speaker loudness is average but good (81.6 dB)
Bass 100 - 315 Hz
(-) | nearly no bass - on average 62.6% lower than median
(+) | bass is linear (0% delta to prev. frequency)
Mids 400 - 2000 Hz
(-) | nearly no mids - on average 62.6% lower than median
(+) | mids are linear (0% delta to prev. frequency)
Highs 2 - 16 kHz
(-) | nearly no highs - on average 62.6% lower than median
(+) | highs are linear (0% delta to prev. frequency)
Overall 100 - 16.000 Hz
(-) | overall sound is not linear (108.7% difference to median)
Compared to same class
» 88% of all tested devices in this class were better, 0% similar, 12% worse
» The best had a delta of 11%, average was 34%, worst was 134%
Compared to all devices tested
» 96% of all tested devices were better, 0% similar, 4% worse
» The best had a delta of 4%, average was 23%, worst was 134%
| Off / Standby | |
| Idle | |
| Load |
|
Key:
min: | |
| OnePlus 6T 3700 mAh | OnePlus 6 3300 mAh | Samsung Galaxy S9 Plus 3500 mAh | Sony Xperia XZ2 Premium 3540 mAh | Apple iPhone Xs Max 3174 mAh | Huawei P20 Pro 4000 mAh | Average Qualcomm Snapdragon 845 | Average of class Smartphone | |
|---|---|---|---|---|---|---|---|---|
| Power Consumption | 8% | 19% | -26% | -8% | 15% | -21% | -28% | |
| Idle Minimum * (Watt) | 0.7 | 0.6 14% | 0.68 3% | 0.67 4% | 1 -43% | 0.84 -20% | 0.862 ? -23% | 0.887 ? -27% |
| Idle Average * (Watt) | 1.1 | 1 9% | 0.95 14% | 2.5 -127% | 1.4 -27% | 1.54 -40% | 1.728 ? -57% | 1.485 ? -35% |
| Idle Maximum * (Watt) | 2.1 | 1.6 24% | 1.09 48% | 2.51 -20% | 1.7 19% | 1.57 25% | 2.07 ? 1% | 1.672 ? 20% |
| Load Average * (Watt) | 4.2 | 4.3 -2% | 4.58 -9% | 4.3 -2% | 4.6 -10% | 2.47 41% | 4.87 ? -16% | 6.76 ? -61% |
| Load Maximum * (Watt) | 8.3 | 8.6 -4% | 5.16 38% | 6.87 17% | 6.7 19% | 2.49 70% | 9.27 ? -12% | 11.2 ? -35% |
* ... smaller is better
| OnePlus 6T 3700 mAh | OnePlus 6 3300 mAh | Samsung Galaxy S9 Plus 3500 mAh | Sony Xperia XZ2 Premium 3540 mAh | Apple iPhone Xs Max 3174 mAh | Huawei P20 Pro 4000 mAh | |
|---|---|---|---|---|---|---|
| Battery runtime | -10% | -27% | -30% | -19% | -2% | |
| Reader / Idle (h) | 32.3 | 30.1 -7% | 22.4 -31% | 22.5 -30% | 21.8 -33% | 28.8 -11% |
| H.264 (h) | 15.1 | 13.2 -13% | 11.2 -26% | 8.7 -42% | 13.4 -11% | 13.1 -13% |
| WiFi v1.3 (h) | 14.4 | 12.7 -12% | 8.7 -40% | 9.1 -37% | 12.4 -14% | 12.4 -14% |
| Load (h) | 4.4 | 4.1 -7% | 4 -9% | 3.9 -11% | 3.7 -16% | 5.8 32% |
Pros
Cons
总结
没错,一加6T是一款真正的旗舰级杀手,它既有着一切你需要的配置,又具有超强的续航。起售价的确高于前代,但这换来了存储大小的翻倍。不幸的是,与一加6的后置指纹相比,6T的屏下指纹识别速度较慢而且准确度低。
我们之前解释过了6T最重要的一些功能,但是还有许多关于这台手机的信息未被透露。例如,6T保留了流畅的操作系统,内置了暗色主题和与前代相同的简约UI设计。同时,得益于更大的电池,续航变得更加出色,而快充则与前代同样优秀。
“一加6T是一款优雅且可靠的旗舰手机,它有着卓越的性能和领先同级的续航。然而,反应迟钝的屏下指纹和耳机接口的缺失让我们觉得6T并不比它的前代更值得购买。”
对于一加6用户来说,升级到6T并不值得,特别是6T的新功能没有比6更加便利。我们估计屏下指纹技术会在未来的8-12个月内成熟很多,但就现在来看,屏下指纹所提供的便利并不能遮盖住它的缺点。6T的大部分硬件与6相同,所以你应该只能感受到软件上的不同,更有可能这种所谓的不同只是一剂安慰剂。
更小的刘海也不能成为你的换机理由,特别是考虑到6T移除了耳机接口。简而言之,6T是一款出色的旗舰智能手机,它的存在使得其他更加昂贵的手机有些尴尬。但是,如果你已经拥有了一加6,升级的意义并不大。
OnePlus 6T
- 01/03/2019 v6 (old)
Florian Schmitt
Price comparison

