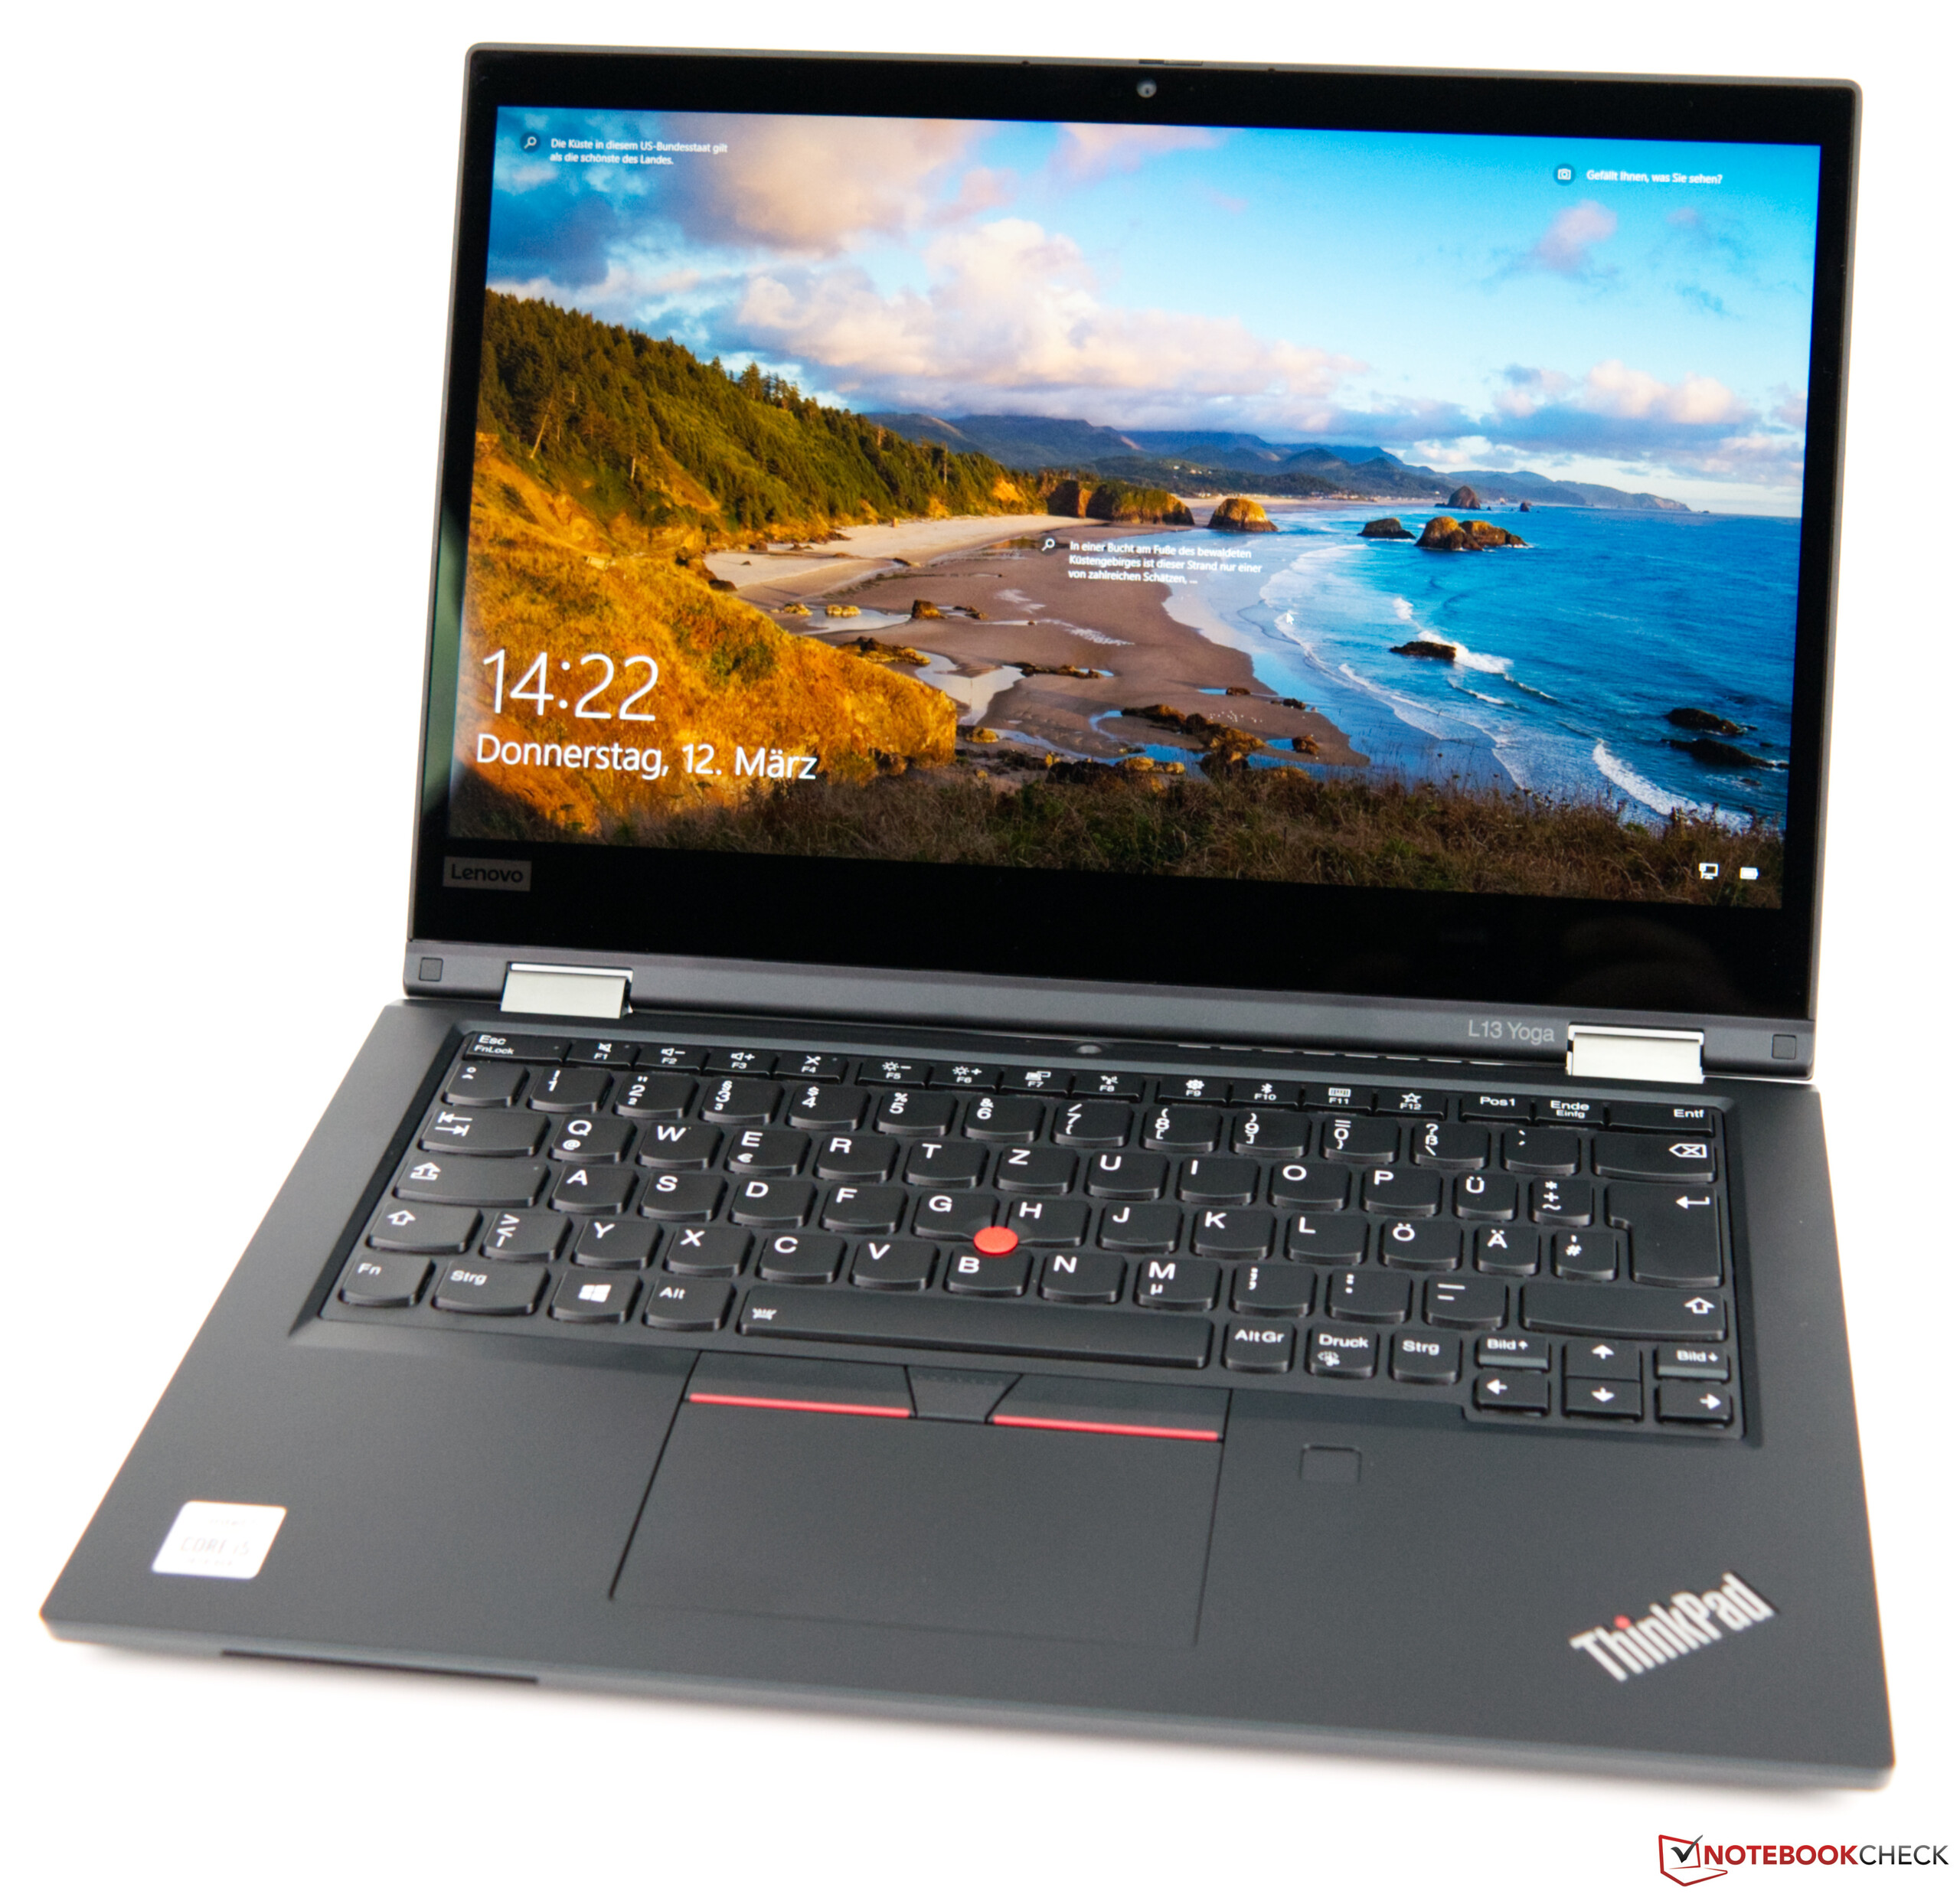
联想ThinkPad L13 Yoga笔记本电脑评测:配置优良的商务翻转本
Rating | Date | Model | Weight | Height | Size | Resolution | Price |
|---|---|---|---|---|---|---|---|
| 88.2 % v7 (old) | 06 / 2020 | Lenovo ThinkPad L13 Yoga 20R6S00800 i5-10210U, UHD Graphics 620 | 1.4 kg | 17.6 mm | 13.30" | 1920x1080 | |
| 86.3 % v6 (old) | 03 / 2019 | Lenovo ThinkPad L390 Yoga-20NT000XGE i5-8265U, UHD Graphics 620 | 1.5 kg | 18.8 mm | 13.30" | 1920x1080 | |
| 84.3 % v6 (old) | 08 / 2019 | HP Envy x360 13-ar0601ng R7 3700U, Vega 10 | 1.3 kg | 14.7 mm | 13.30" | 1920x1080 | |
| 81 % v7 (old) | 07 / 2020 | HP Pavilion x360 14-dh1153ng i5-10210U, UHD Graphics 620 | 1.6 kg | 20.5 mm | 14.00" | 1920x1080 | |
| 84.3 % v7 (old) | 04 / 2020 | Lenovo Yoga C740-14IML i5-10210U, UHD Graphics 620 | 1.4 kg | 16.9 mm | 14.00" | 1920x1080 |

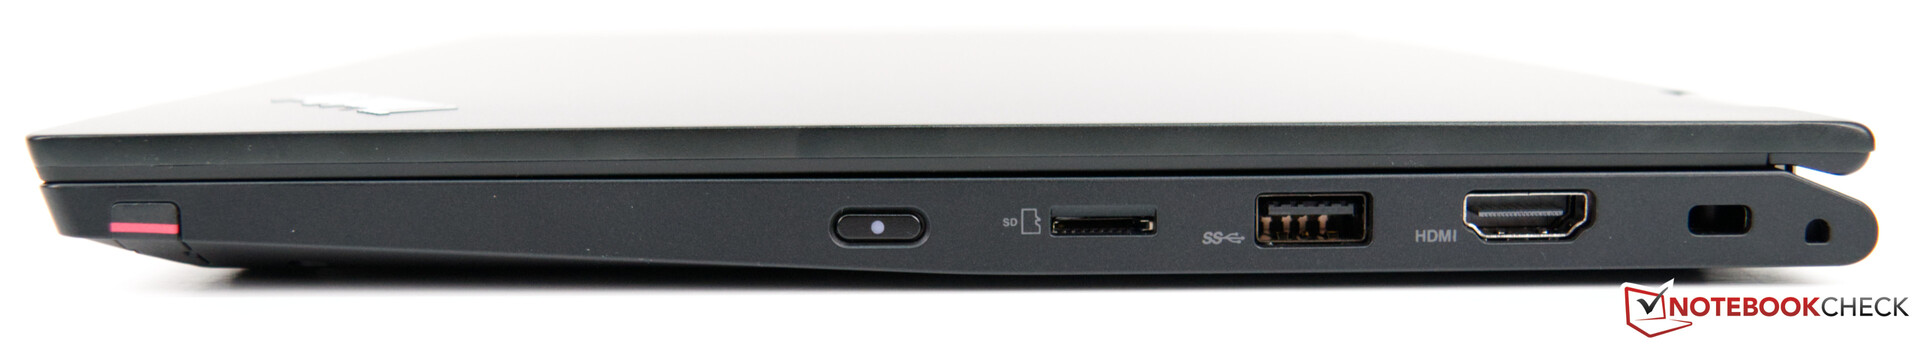
| SD Card Reader | |
| average JPG Copy Test (av. of 3 runs) | |
| HP Envy x360 13-ar0601ng (Toshiba Exceria Pro M501 microSDXC 64GB) | |
| HP Pavilion x360 14-dh1153ng (Toshiba Exceria Pro SDXC 64 GB UHS-II) | |
| Lenovo ThinkPad L13 Yoga 20R6S00800 | |
| Lenovo ThinkPad L390 Yoga-20NT000XGE (Toshiba Exceria Pro M501 UHS-II) | |
| Average of class Convertible (28.1 - 197, n=23, last 2 years) | |
| maximum AS SSD Seq Read Test (1GB) | |
| Average of class Convertible (28.9 - 254, n=22, last 2 years) | |
| HP Envy x360 13-ar0601ng (Toshiba Exceria Pro M501 microSDXC 64GB) | |
| Lenovo ThinkPad L13 Yoga 20R6S00800 (Toshiba Exceria Pro M501 64 GB UHS-II) | |
| HP Pavilion x360 14-dh1153ng (Toshiba Exceria Pro SDXC 64 GB UHS-II) | |
| Lenovo ThinkPad L390 Yoga-20NT000XGE (Toshiba Exceria Pro M501 UHS-II) | |
| |||||||||||||||||||||||||
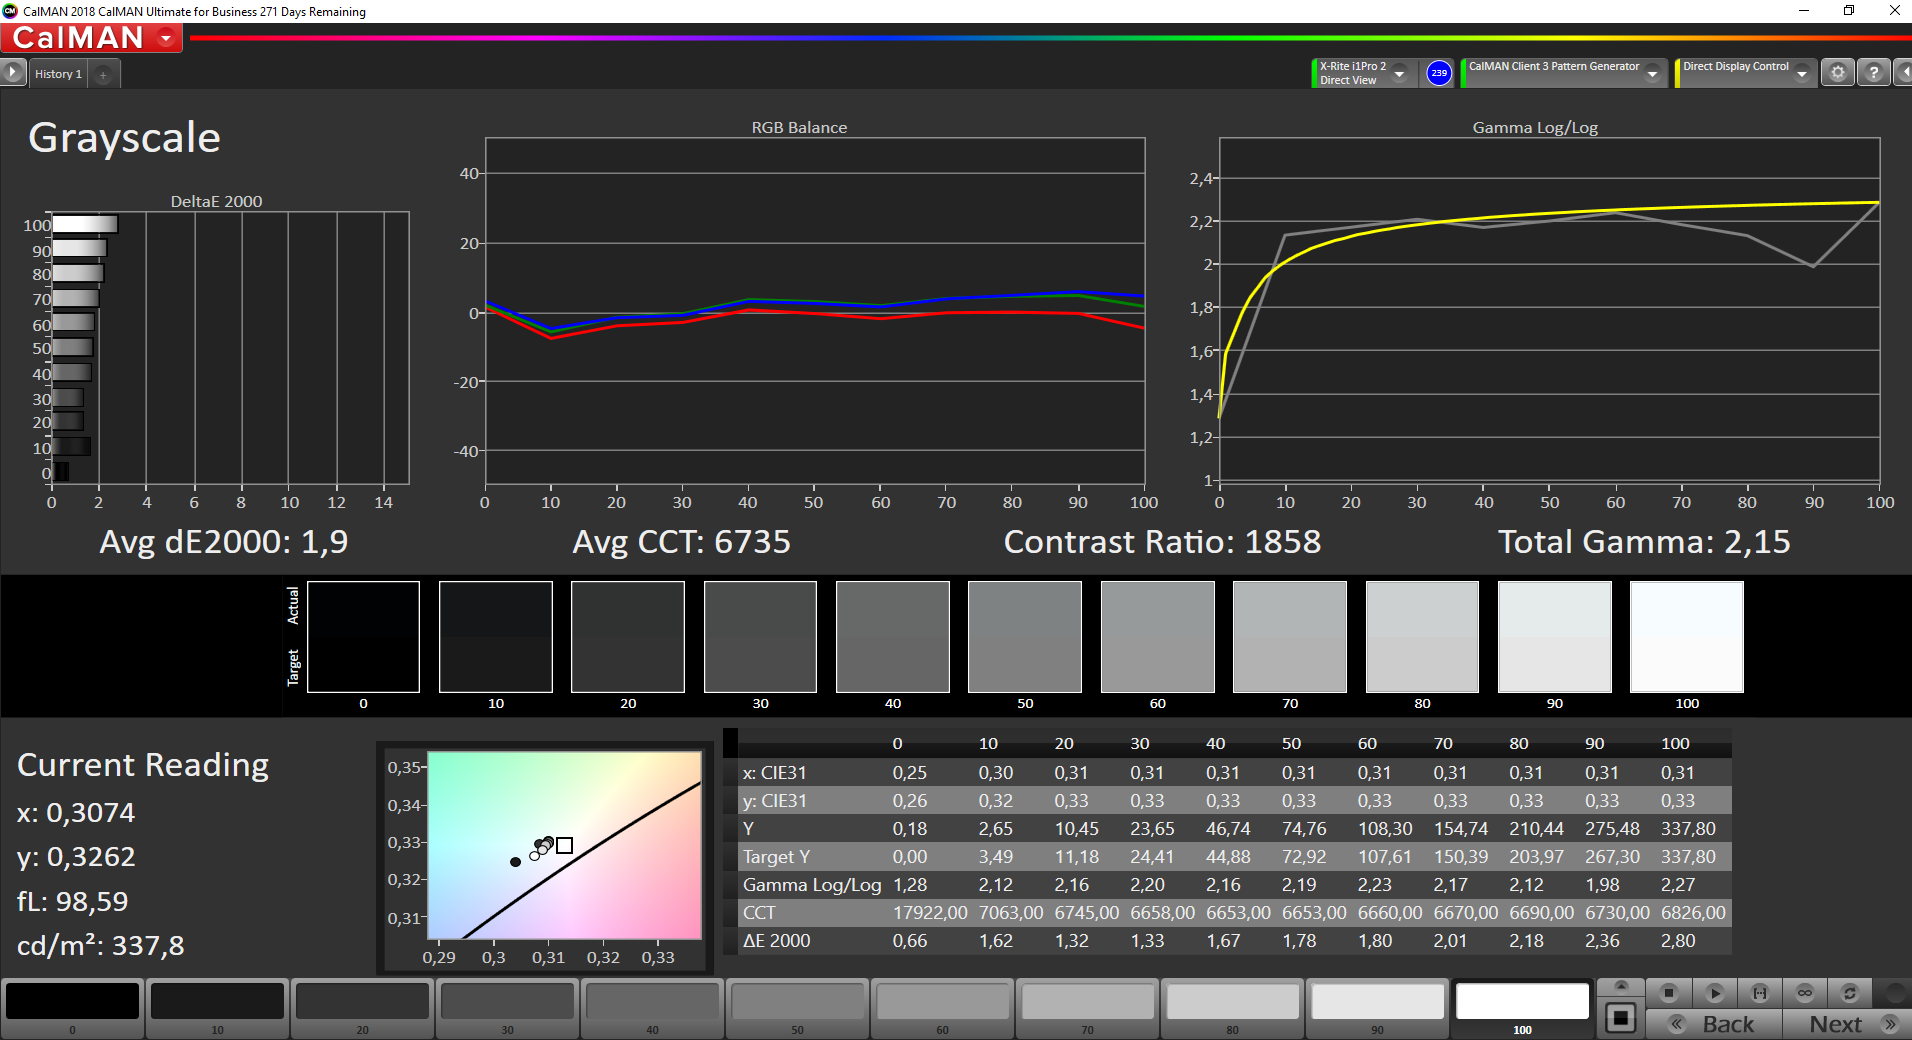
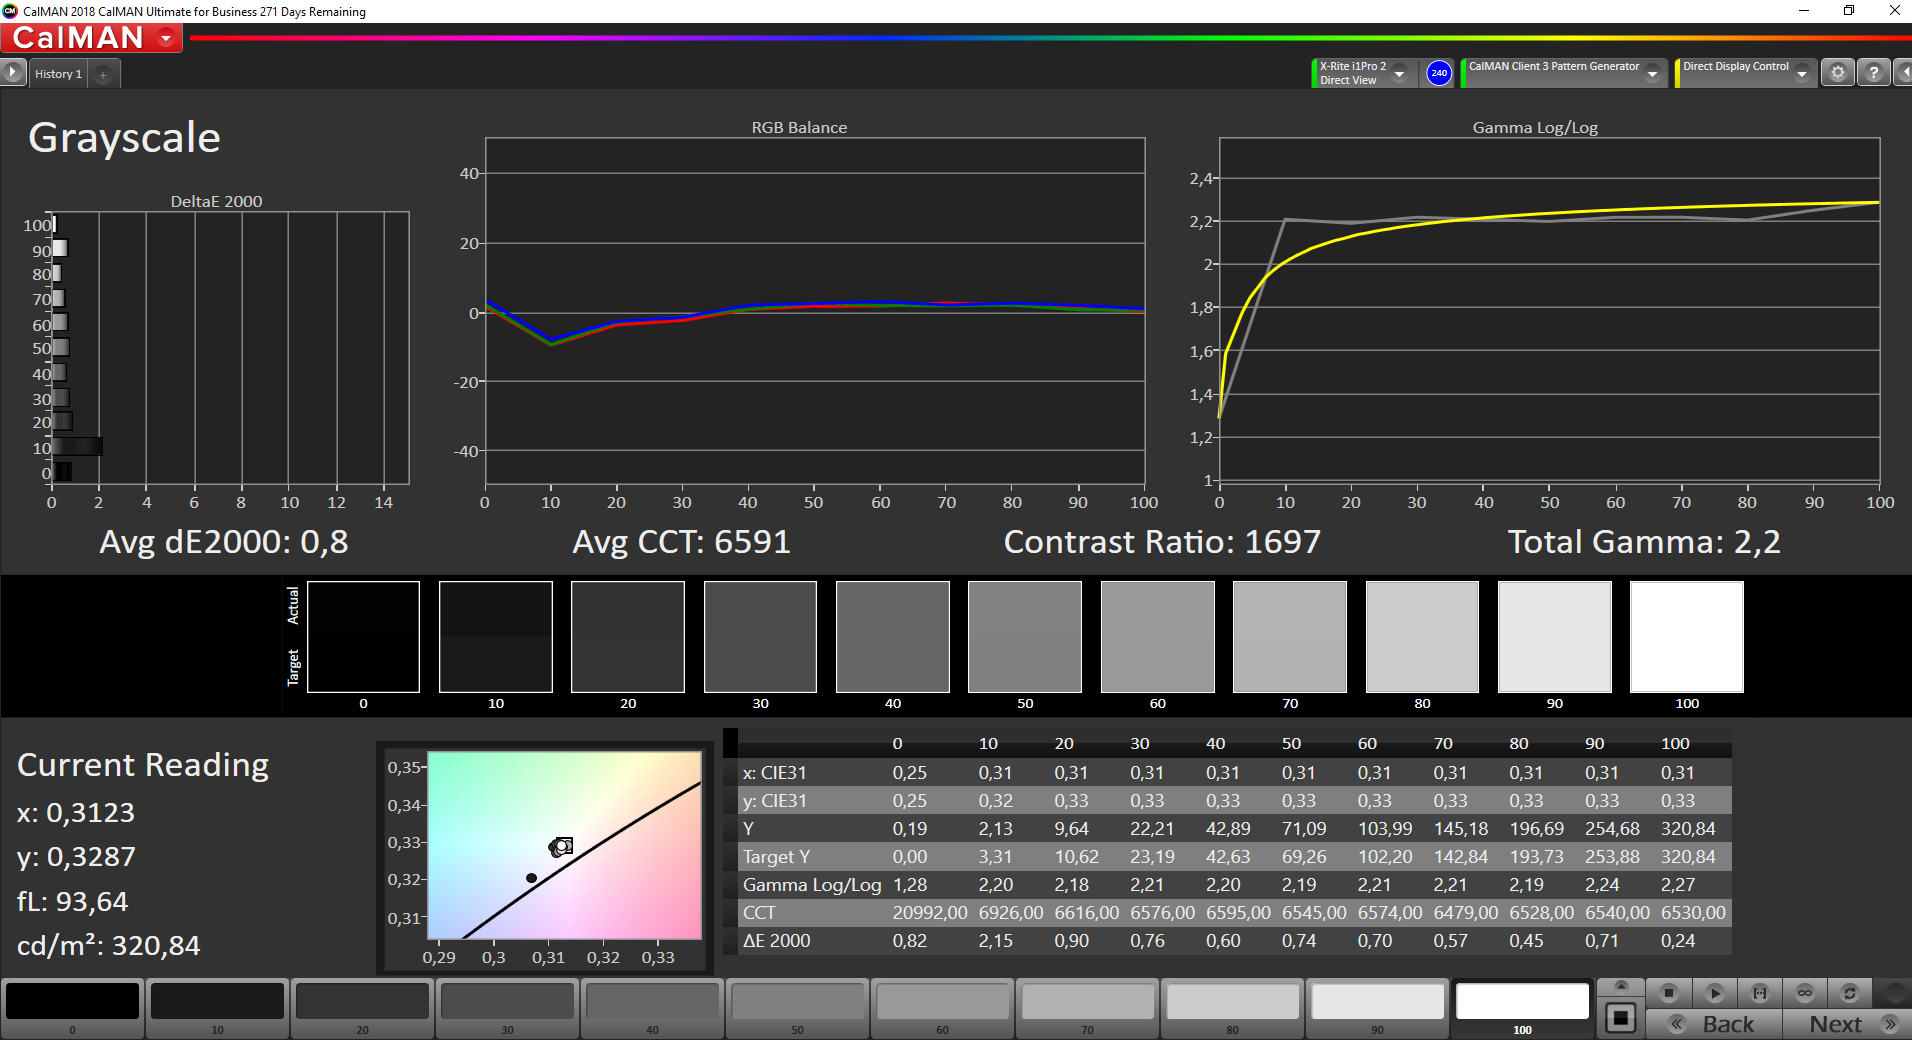
Brightness Distribution: 90 %
Center on Battery: 338 cd/m²
Contrast: 1889:1 (Black: 0.18 cd/m²)
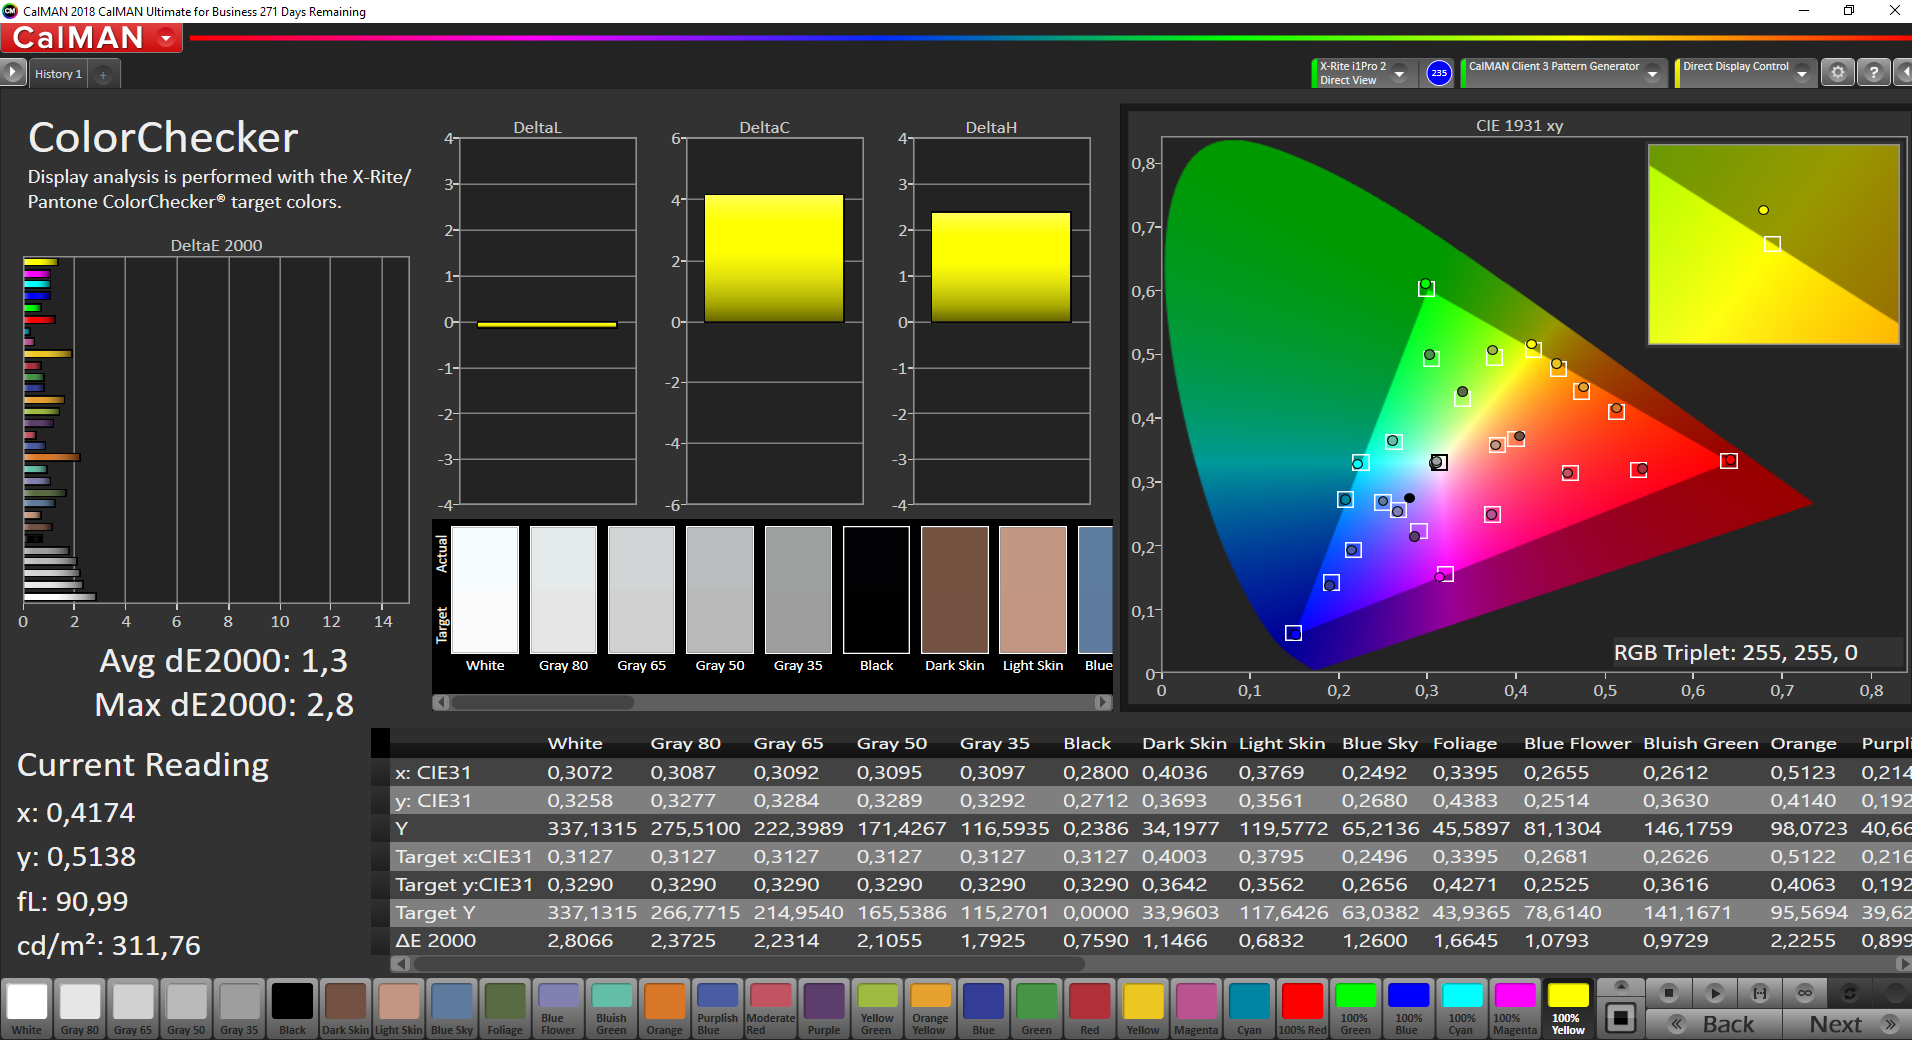
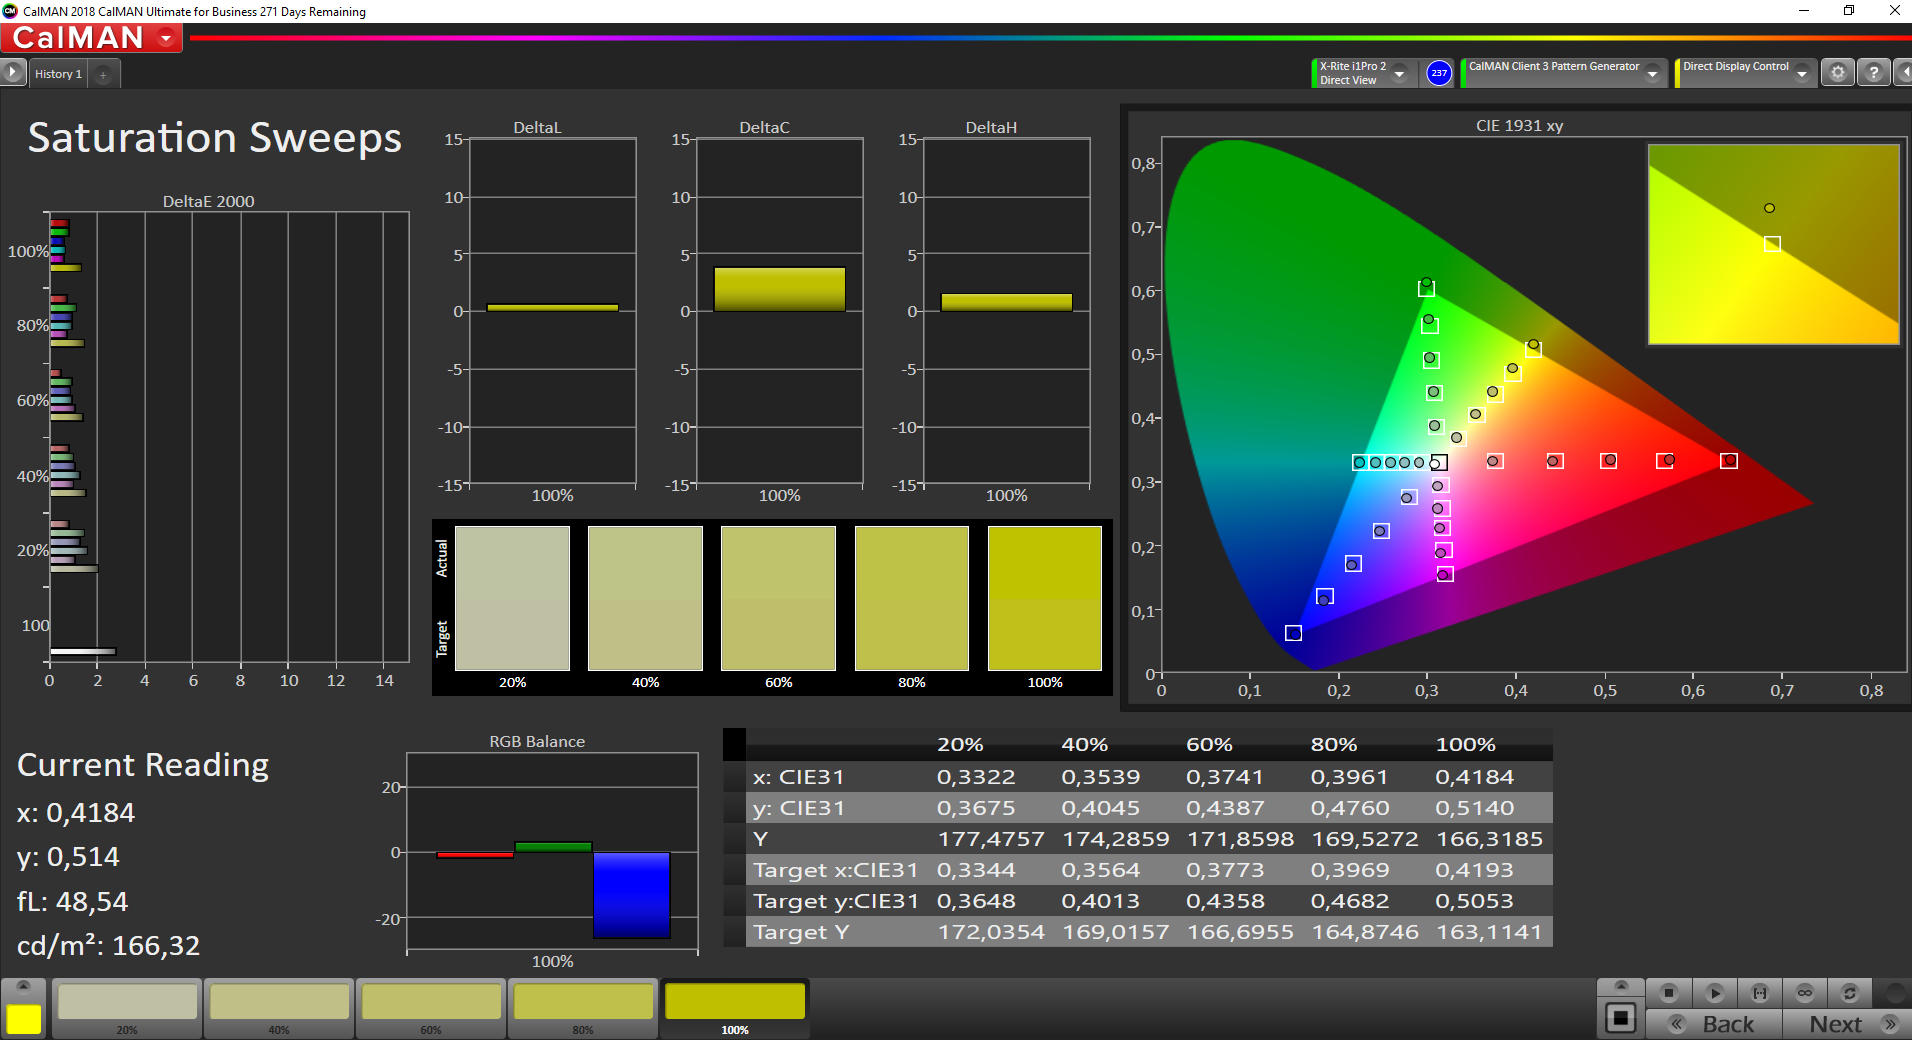
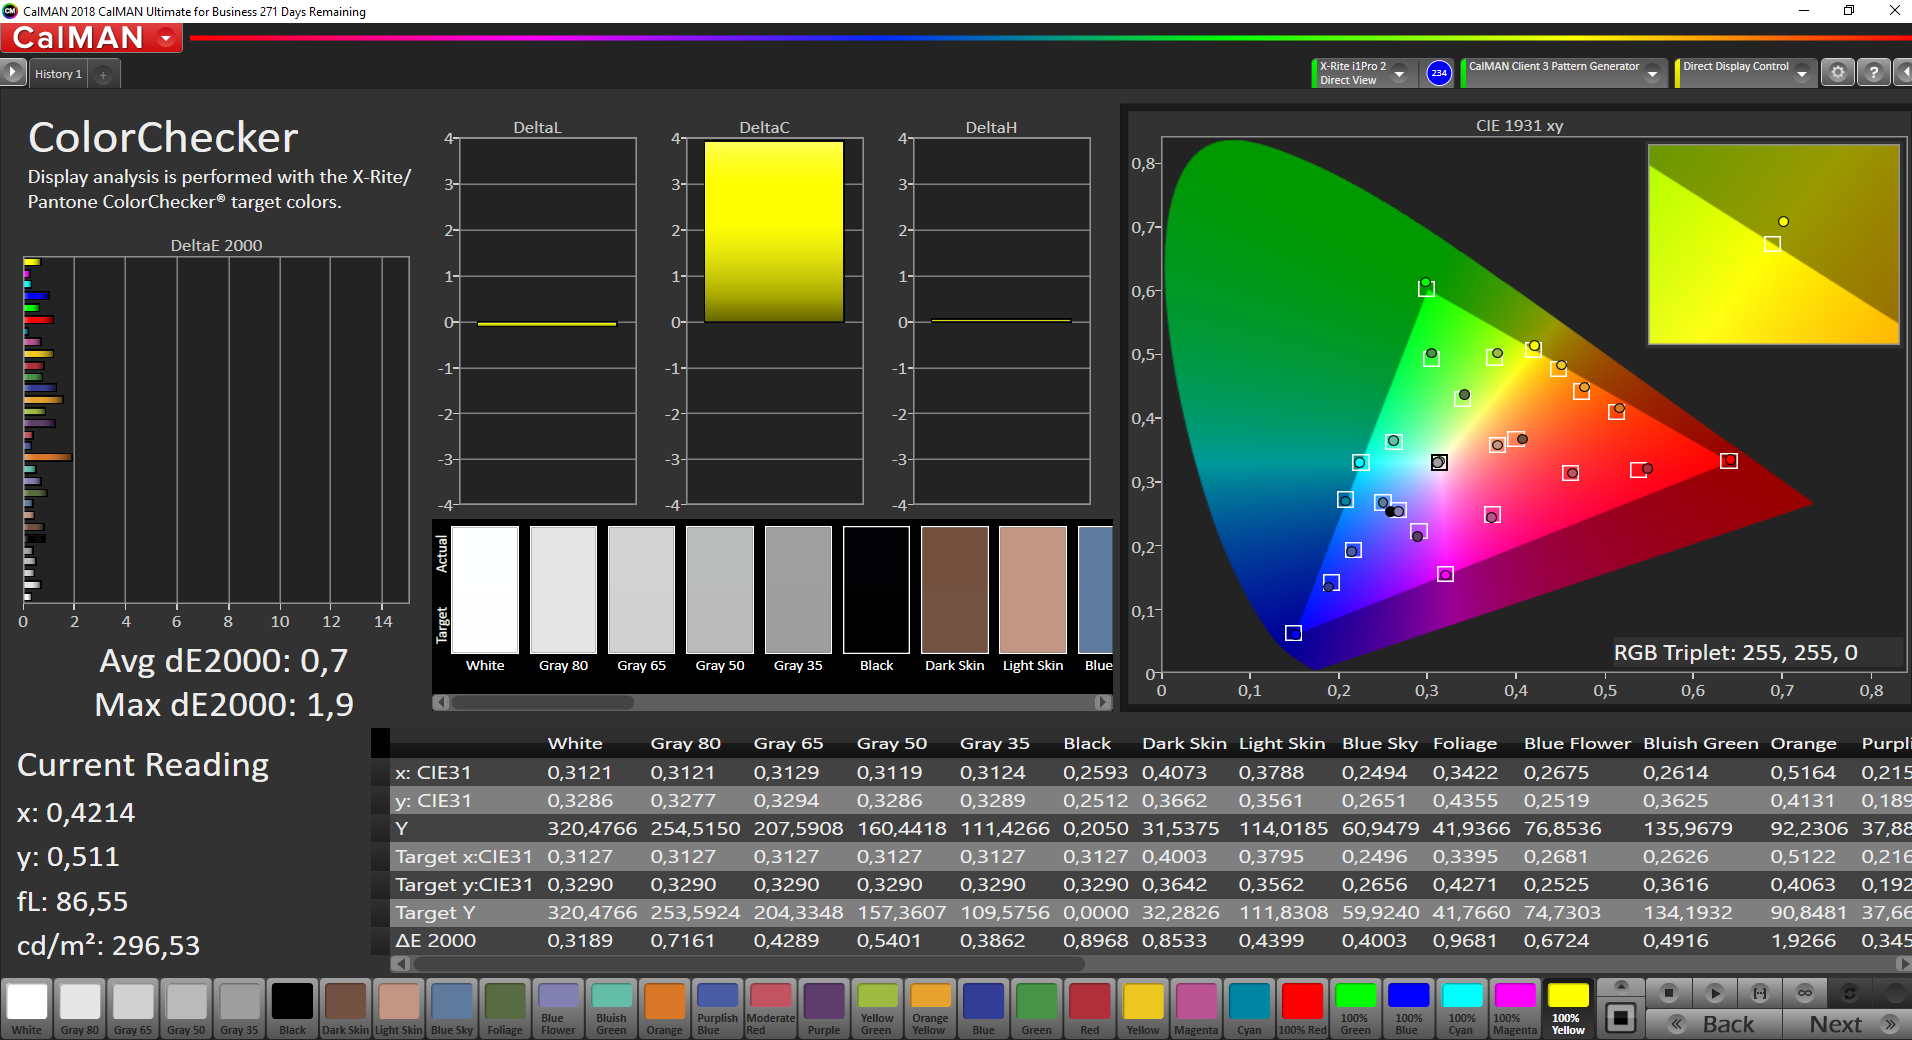
ΔE ColorChecker Calman: 1.3 | ∀{0.5-29.43 Ø4.72}
calibrated: 0.7
ΔE Greyscale Calman: 1.9 | ∀{0.09-98 Ø4.97}
99.6% sRGB (Argyll 1.6.3 3D)
64.1% AdobeRGB 1998 (Argyll 1.6.3 3D)
70.2% AdobeRGB 1998 (Argyll 3D)
94.7% sRGB (Argyll 3D)
68.1% Display P3 (Argyll 3D)
Gamma: 2.15
CCT: 6735 K
| Lenovo ThinkPad L13 Yoga 20R6S00800 N133HCE-EP2, IPS, 1920x1080, 13.3" | Lenovo ThinkPad L390 Yoga-20NT000XGE LEN4094, NV133FHM-N5A, IPS LED, 1920x1080, 13.3" | HP Envy x360 13-ar0601ng InfoVision, M133NVF3 R2, IPS, 120 Hz, 1920x1080, 13.3" | HP Pavilion x360 14-dh1153ng BOE NV140FHM-N4K, IPS, 1920x1080, 14" | Lenovo Yoga C740-14IML CMN N140HCE-ET2, IPS, 1920x1080, 14" | |
|---|---|---|---|---|---|
| Display | -3% | -7% | -41% | 1% | |
| Display P3 Coverage (%) | 68.1 | 69.2 2% | 63 -7% | 39.35 -42% | 67.9 0% |
| sRGB Coverage (%) | 94.7 | 90.6 -4% | 90.8 -4% | 58.8 -38% | 98.3 4% |
| AdobeRGB 1998 Coverage (%) | 70.2 | 66.3 -6% | 63.8 -9% | 40.65 -42% | 70.1 0% |
| Response Times | -30% | 17% | -14% | -10% | |
| Response Time Grey 50% / Grey 80% * (ms) | 40 ? | 51.2 ? -28% | 35 ? 12% | 44 ? -10% | 35.6 ? 11% |
| Response Time Black / White * (ms) | 28 ? | 36.8 ? -31% | 22 ? 21% | 33 ? -18% | 36.8 ? -31% |
| PWM Frequency (Hz) | 25000 ? | 1000 ? | 4065 ? | 192 ? | 27030 ? |
| Screen | -120% | -57% | -170% | -72% | |
| Brightness middle (cd/m²) | 340 | 313 -8% | 633 86% | 248 -27% | 329.9 -3% |
| Brightness (cd/m²) | 336 | 295 -12% | 675 101% | 238 -29% | 315 -6% |
| Brightness Distribution (%) | 90 | 90 0% | 75 -17% | 74 -18% | 90 0% |
| Black Level * (cd/m²) | 0.18 | 0.22 -22% | 0.55 -206% | 0.235 -31% | 0.29 -61% |
| Contrast (:1) | 1889 | 1423 -25% | 1151 -39% | 1055 -44% | 1138 -40% |
| Colorchecker dE 2000 * | 1.3 | 6.2 -377% | 3.12 -140% | 5.43 -318% | 3.68 -183% |
| Colorchecker dE 2000 max. * | 2.8 | 10.7 -282% | 6.37 -128% | 17.96 -541% | 8.64 -209% |
| Colorchecker dE 2000 calibrated * | 0.7 | 2.5 -257% | 1.83 -161% | 5.7 -714% | 1.03 -47% |
| Greyscale dE 2000 * | 1.9 | 8 -321% | 3.89 -105% | 3.18 -67% | 6.4 -237% |
| Gamma | 2.15 102% | 2.38 92% | 2.39 92% | 2.56 86% | 2.17 101% |
| CCT | 6735 97% | 7100 92% | 6476 100% | 6642 98% | 6195 105% |
| Color Space (Percent of AdobeRGB 1998) (%) | 64.1 | 59.1 -8% | 59 -8% | 37.3 -42% | 63.6 -1% |
| Color Space (Percent of sRGB) (%) | 99.6 | 90.6 -9% | 91 -9% | 58.4 -41% | 98.4 -1% |
| Total Average (Program / Settings) | -51% /
-87% | -16% /
-38% | -75% /
-126% | -27% /
-50% |
* ... smaller is better
Display Response Times
| ↔ Response Time Black to White | ||
|---|---|---|
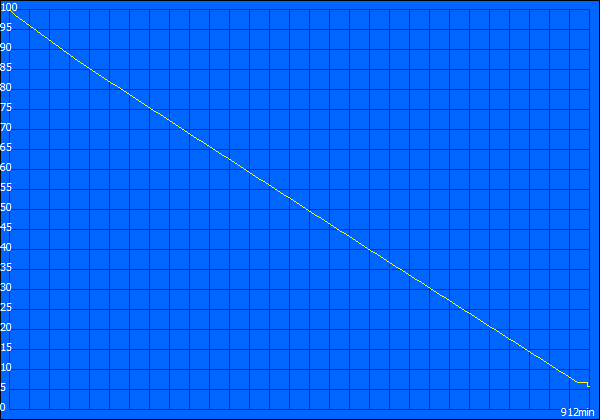
| 28 ms ... rise ↗ and fall ↘ combined | ↗ 15.6 ms rise | 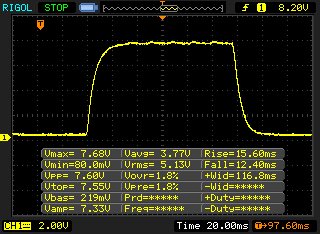 |
| ↘ 12.4 ms fall | ||
| The screen shows relatively slow response rates in our tests and may be too slow for gamers. In comparison, all tested devices range from 0.1 (minimum) to 240 (maximum) ms. » 71 % of all devices are better. This means that the measured response time is worse than the average of all tested devices (19.8 ms). | ||
| ↔ Response Time 50% Grey to 80% Grey | ||
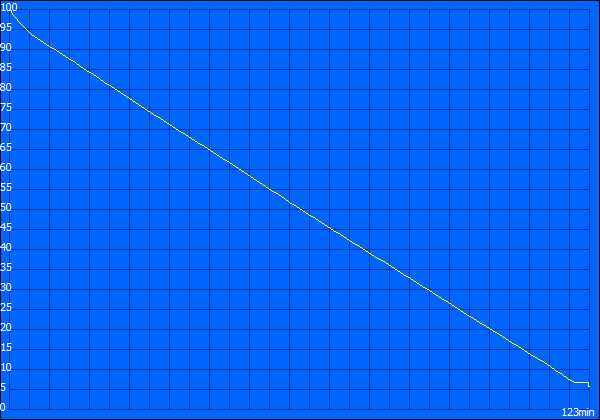
| 40 ms ... rise ↗ and fall ↘ combined | ↗ 21.6 ms rise | 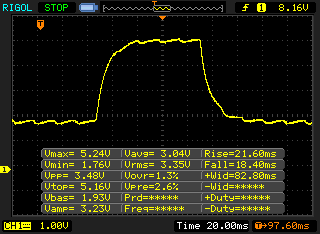 |
| ↘ 18.4 ms fall | ||
| The screen shows slow response rates in our tests and will be unsatisfactory for gamers. In comparison, all tested devices range from 0.165 (minimum) to 636 (maximum) ms. » 61 % of all devices are better. This means that the measured response time is worse than the average of all tested devices (31 ms). | ||
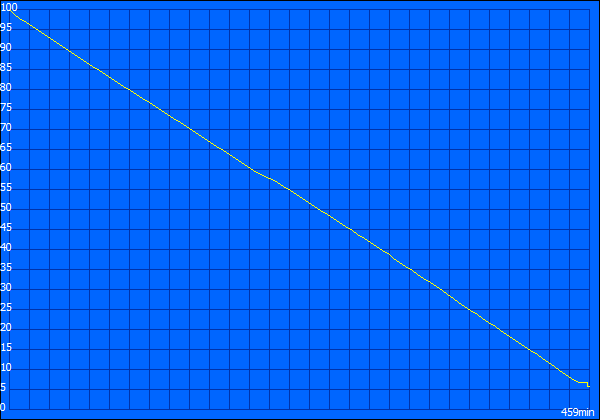
Screen Flickering / PWM (Pulse-Width Modulation)
| Screen flickering / PWM detected | 25000 Hz | ≤ 50 % brightness setting | 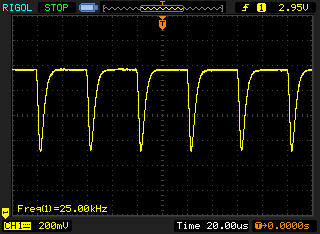 |
The display backlight flickers at 25000 Hz (worst case, e.g., utilizing PWM) Flickering detected at a brightness setting of 50 % and below. There should be no flickering or PWM above this brightness setting. The frequency of 25000 Hz is quite high, so most users sensitive to PWM should not notice any flickering. In comparison: 52 % of all tested devices do not use PWM to dim the display. If PWM was detected, an average of 7772 (minimum: 5 - maximum: 343500) Hz was measured. | |||
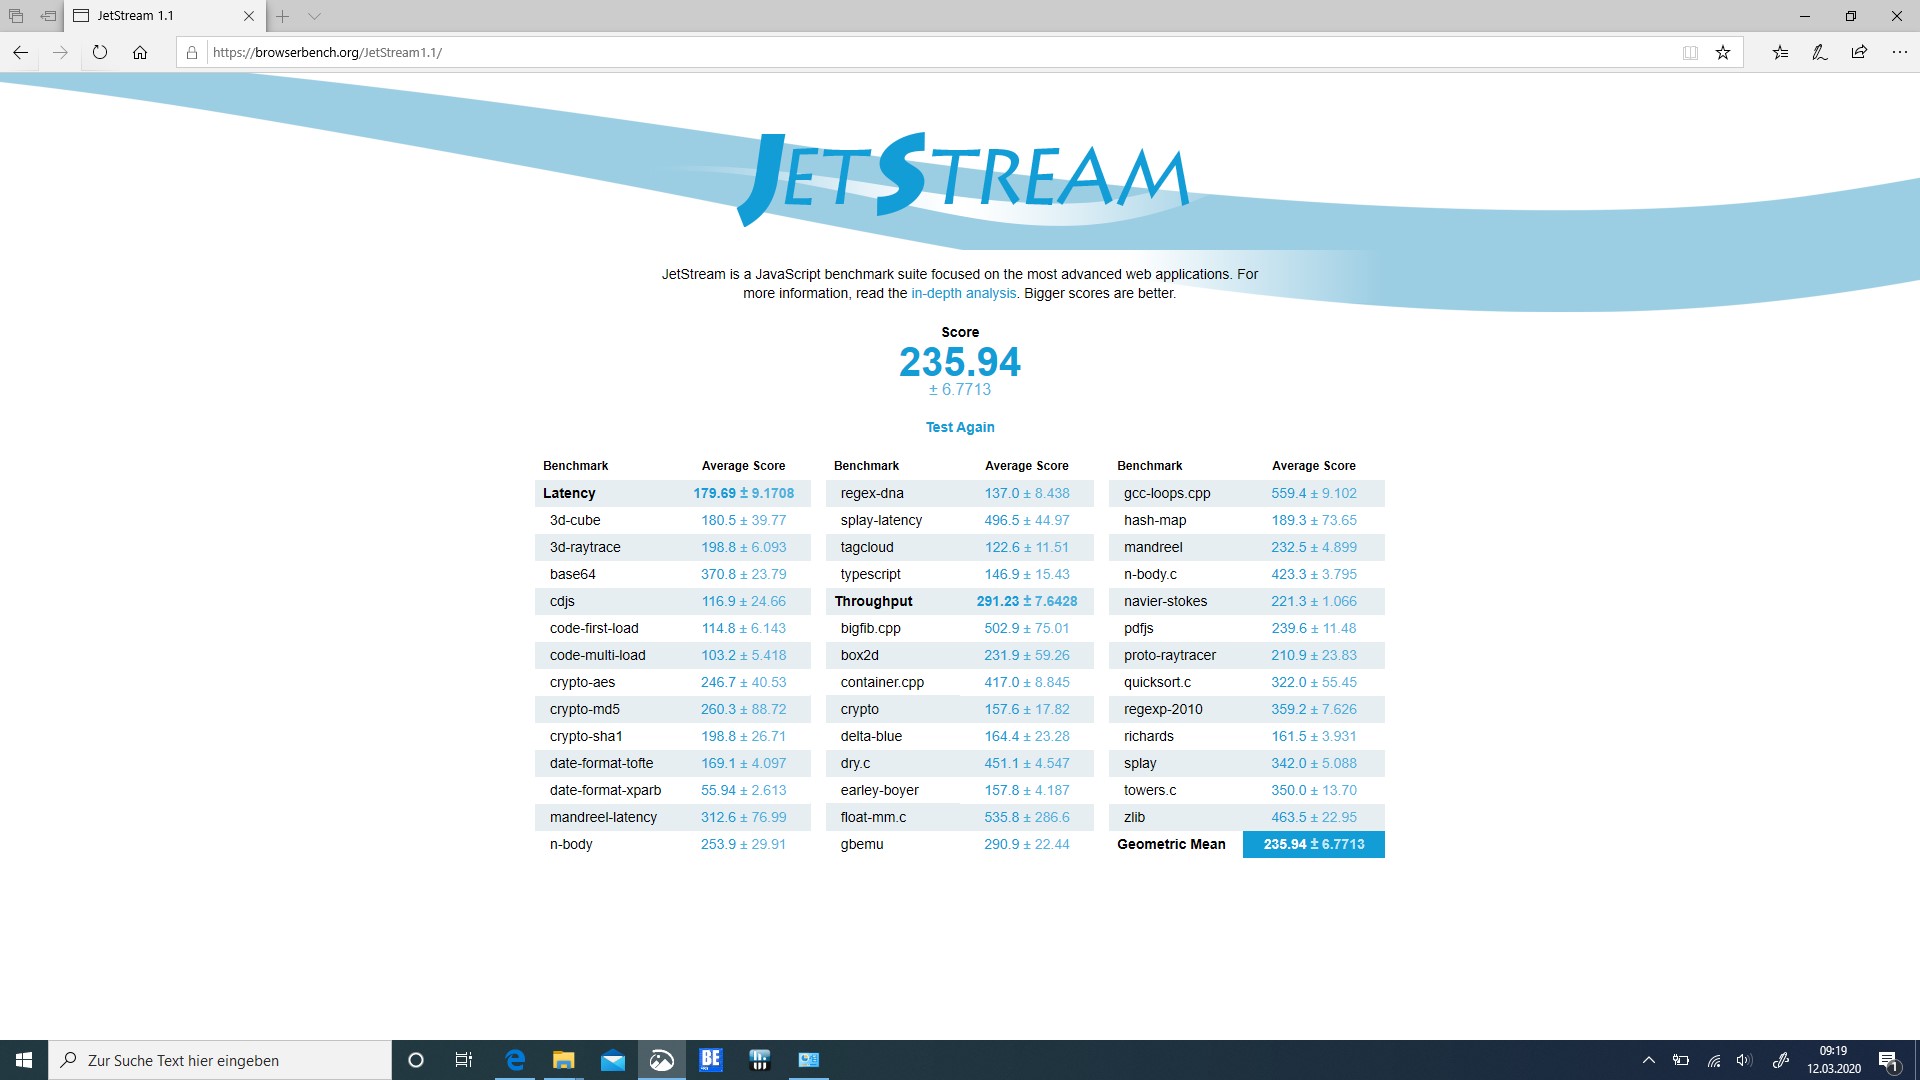
| JetStream 1.1 - 1.1 Total | |
| Lenovo Yoga C740-14IML | |
| Average Intel Core i5-10210U (191.3 - 252, n=14) | |
| Lenovo ThinkPad L13 Yoga 20R6S00800 | |
| Lenovo ThinkPad L390 Yoga-20NT000XGE | |
| HP Pavilion x360 14-dh1153ng | |
* ... smaller is better
| PCMark 8 Home Score Accelerated v2 | 4284 points | |
| PCMark 8 Creative Score Accelerated v2 | 5440 points | |
| PCMark 8 Work Score Accelerated v2 | 5063 points | |
| PCMark 10 Score | 4353 points | |
Help | ||
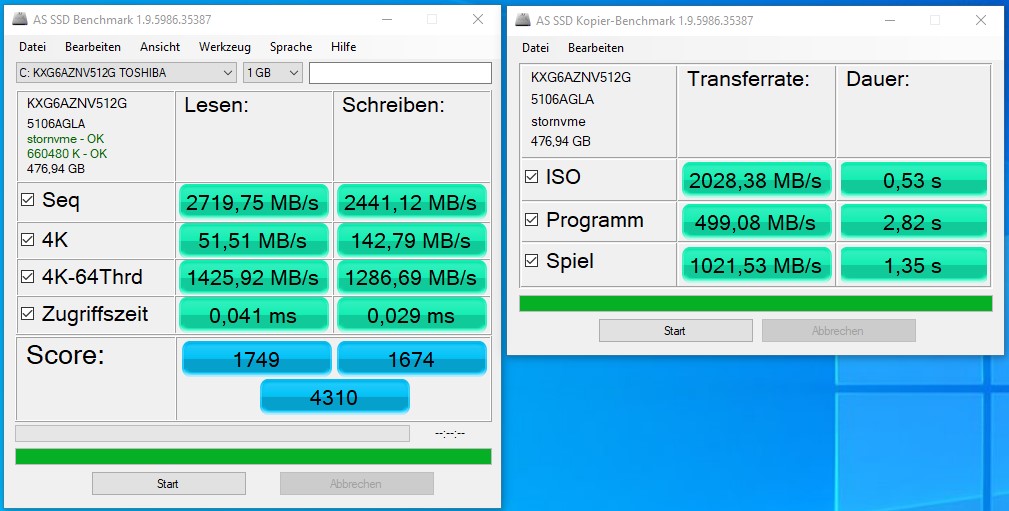
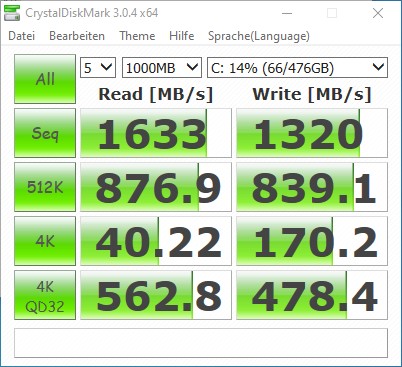
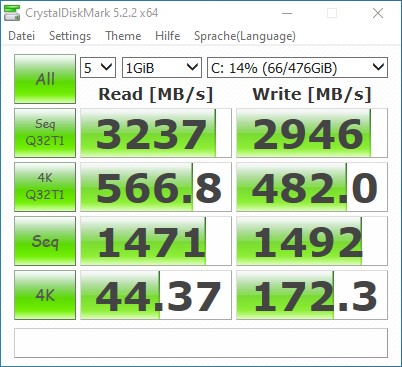
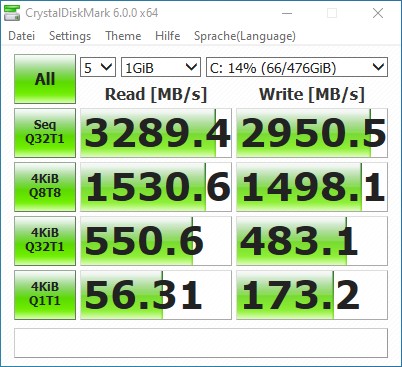
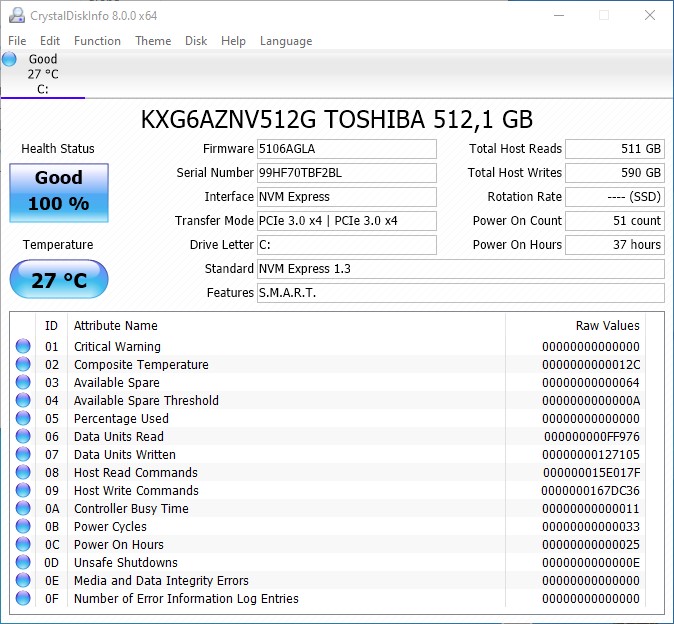
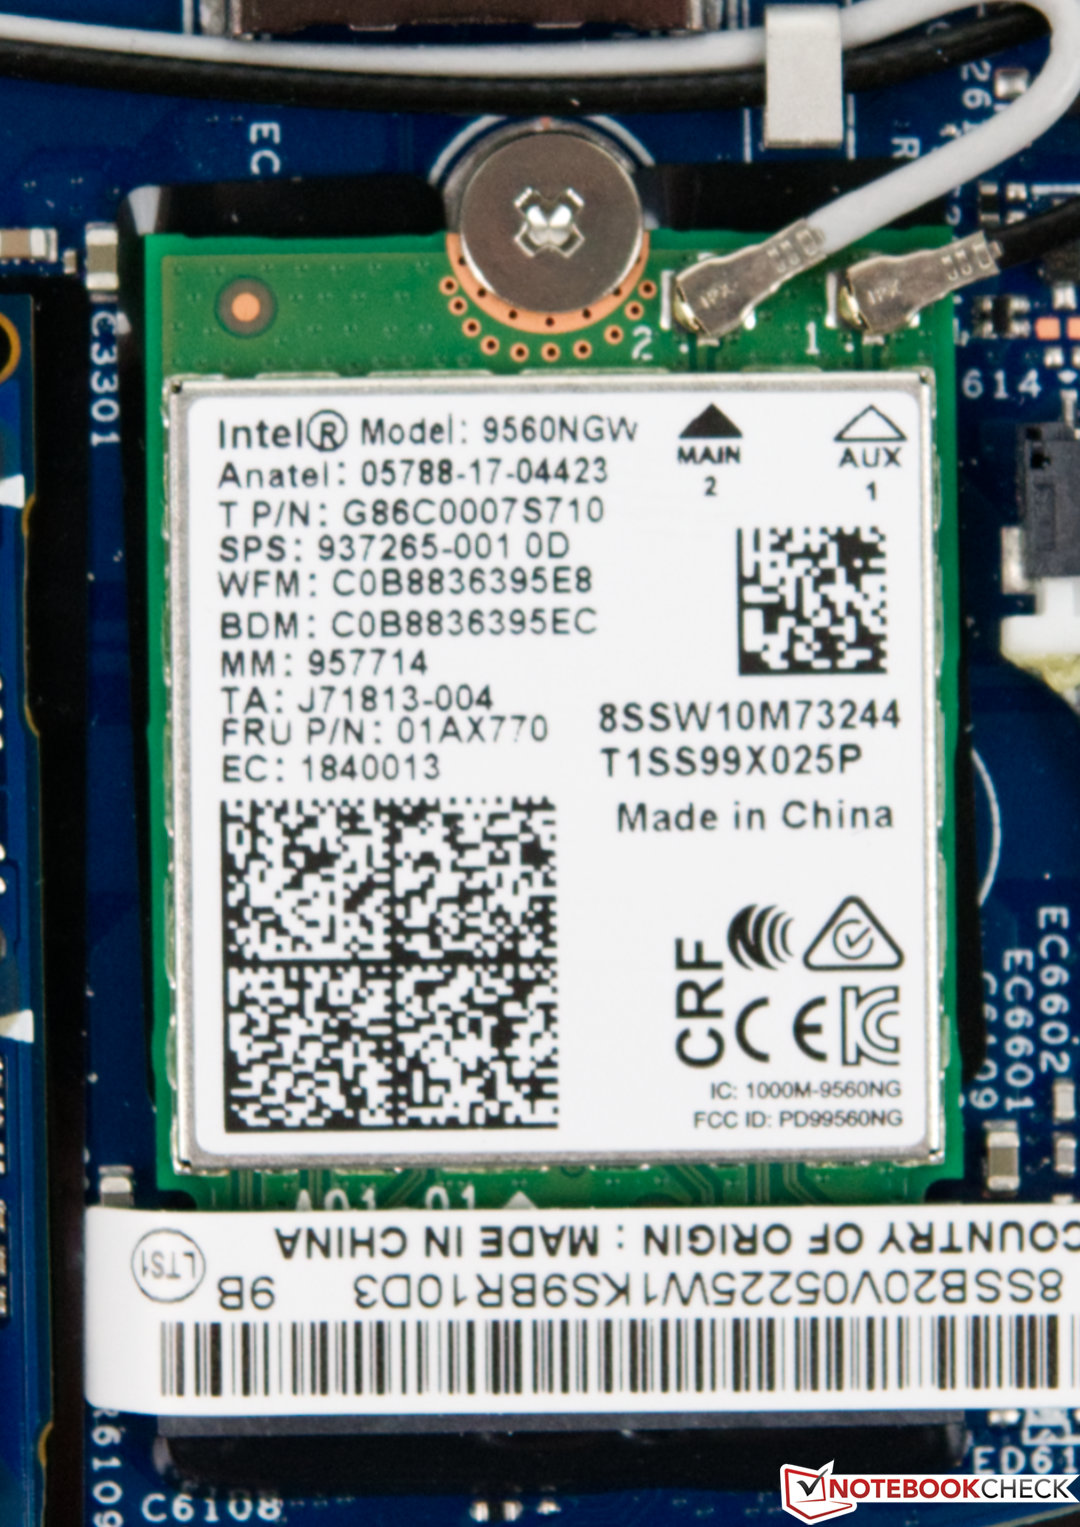
| Lenovo ThinkPad L13 Yoga 20R6S00800 Toshiba XG6 KXG6AZNV512G | Lenovo ThinkPad L390 Yoga-20NT000XGE Samsung SSD PM981 MZVLB256HAHQ | HP Envy x360 13-ar0601ng SK Hynix BC501 HFM512GDJTNG | HP Pavilion x360 14-dh1153ng Intel Optane Memory H10 with Solid State Storage 32GB + 512GB HBRPEKNX0202A(L/H) | Lenovo Yoga C740-14IML Samsung SSD PM981a MZVLB256HBHQ | Average Toshiba XG6 KXG6AZNV512G | |
|---|---|---|---|---|---|---|
| CrystalDiskMark 5.2 / 6 | -15% | -50% | 13% | -4% | -7% | |
| Write 4K (MB/s) | 172.3 | 126.3 -27% | 88.3 -49% | 162.7 -6% | 125.6 -27% | 139 ? -19% |
| Read 4K (MB/s) | 44.37 | 41.58 -6% | 34.84 -21% | 190.5 329% | 43.46 -2% | 45.8 ? 3% |
| Write Seq (MB/s) | 1492 | 1383 -7% | 740 -50% | 450.1 -70% | 2011 35% | 1628 ? 9% |
| Read Seq (MB/s) | 1471 | 2012 37% | 985 -33% | 1624 10% | 2046 39% | 1647 ? 12% |
| Write 4K Q32T1 (MB/s) | 483.1 | 543 12% | 313.7 -35% | 353.5 -27% | 375.8 -22% | 547 ? 13% |
| Read 4K Q32T1 (MB/s) | 551 | 411 -25% | 243.1 -56% | 397.7 -28% | 338.1 -39% | 436 ? -21% |
| Write Seq Q32T1 (MB/s) | 2951 | 1712 -42% | 846 -71% | 937 -68% | 2346 -21% | 2522 ? -15% |
| Read Seq Q32T1 (MB/s) | 3289 | 3423 4% | 1783 -46% | 2145 -35% | 3562 8% | 2739 ? -17% |
| Write 4K Q8T8 (MB/s) | 1498 | 1031 -31% | 305.7 -80% | 1266 ? -15% | ||
| Read 4K Q8T8 (MB/s) | 1531 | 572 -63% | 698 -54% | 1212 ? -21% | ||
| AS SSD | -26% | -54% | -60% | -36% | -19% | |
| Seq Read (MB/s) | 2719 | 1724 -37% | 1412 -48% | 1241 -54% | 1719 -37% | 2383 ? -12% |
| Seq Write (MB/s) | 2441 | 1123 -54% | 540 -78% | 372.5 -85% | 1211 -50% | 1459 ? -40% |
| 4K Read (MB/s) | 51.5 | 51.8 1% | 32.24 -37% | 65.4 27% | 53.1 3% | 46.8 ? -9% |
| 4K Write (MB/s) | 142.8 | 133.8 -6% | 74.7 -48% | 114.8 -20% | 131.4 -8% | 125.1 ? -12% |
| 4K-64 Read (MB/s) | 1426 | 745 -48% | 567 -60% | 416.9 -71% | 508 -64% | 1294 ? -9% |
| 4K-64 Write (MB/s) | 1287 | 1193 -7% | 700 -46% | 516 -60% | 883 -31% | 1276 ? -1% |
| Access Time Read * (ms) | 0.041 | 0.041 -0% | 0.049 -20% | 0.097 -137% | 0.05 -22% | 0.0825 ? -101% |
| Access Time Write * (ms) | 0.029 | 0.028 3% | 0.048 -66% | 0.045 -55% | 0.085 -193% | 0.0335 ? -16% |
| Score Read (Points) | 1749 | 969 -45% | 741 -58% | 606 -65% | 733 -58% | 1580 ? -10% |
| Score Write (Points) | 1674 | 1440 -14% | 829 -50% | 668 -60% | 1135 -32% | 1547 ? -8% |
| Score Total (Points) | 4310 | 2889 -33% | 1913 -56% | 1567 -64% | 2235 -48% | 3893 ? -10% |
| Copy ISO MB/s (MB/s) | 2028 | 1025 -49% | 521 -74% | 504 -75% | 1636 -19% | 1645 ? -19% |
| Copy Program MB/s (MB/s) | 499.1 | 322.1 -35% | 253.1 -49% | 222.6 -55% | 698 40% | 425 ? -15% |
| Copy Game MB/s (MB/s) | 1022 | 637 -38% | 392.9 -62% | 421.2 -59% | 1246 22% | 933 ? -9% |
| Total Average (Program / Settings) | -21% /
-21% | -52% /
-52% | -24% /
-33% | -20% /
-24% | -13% /
-14% |
* ... smaller is better

| 3DMark 11 Performance | 2073 points | |
| 3DMark Ice Storm Standard Score | 64237 points | |
| 3DMark Cloud Gate Standard Score | 8834 points | |
| 3DMark Fire Strike Score | 1206 points | |
| 3DMark Fire Strike Extreme Score | 588 points | |
| 3DMark Time Spy Score | 472 points | |
Help | ||
| low | med. | high | ultra | |
|---|---|---|---|---|
| BioShock Infinite (2013) | 73 | 40 | 35 | 11 |
| Dota 2 Reborn (2015) | 82 | 52.5 | 20.4 | 17.8 |
| Rise of the Tomb Raider (2016) | 22.8 | 14.6 | 7.48 | |
| X-Plane 11.11 (2018) | 23.6 | 14.8 | 13.5 |
Noise level
| Idle |
| 29.3 / 29.3 / 29.3 dB(A) |
| Load |
| 32.7 / 32.7 dB(A) |
 | ||
30 dB silent 40 dB(A) audible 50 dB(A) loud |
||
min: | ||
(-) The maximum temperature on the upper side is 49.3 °C / 121 F, compared to the average of 35.4 °C / 96 F, ranging from 19.6 to 60 °C for the class Convertible.
(-) The bottom heats up to a maximum of 62.9 °C / 145 F, compared to the average of 36.9 °C / 98 F
(+) In idle usage, the average temperature for the upper side is 23.4 °C / 74 F, compared to the device average of 30.3 °C / 87 F.
(+) The palmrests and touchpad are cooler than skin temperature with a maximum of 24.3 °C / 75.7 F and are therefore cool to the touch.
(+) The average temperature of the palmrest area of similar devices was 28 °C / 82.4 F (+3.7 °C / 6.7 F).
Lenovo ThinkPad L13 Yoga 20R6S00800 audio analysis
(±) | speaker loudness is average but good (75.8 dB)
Bass 100 - 315 Hz
(-) | nearly no bass - on average 21.2% lower than median
(±) | linearity of bass is average (14.7% delta to prev. frequency)
Mids 400 - 2000 Hz
(±) | higher mids - on average 5.1% higher than median
(+) | mids are linear (5.7% delta to prev. frequency)
Highs 2 - 16 kHz
(±) | reduced highs - on average 8.1% lower than median
(±) | linearity of highs is average (8.6% delta to prev. frequency)
Overall 100 - 16.000 Hz
(±) | linearity of overall sound is average (29.1% difference to median)
Compared to same class
» 87% of all tested devices in this class were better, 3% similar, 10% worse
» The best had a delta of 6%, average was 20%, worst was 57%
Compared to all devices tested
» 87% of all tested devices were better, 2% similar, 11% worse
» The best had a delta of 4%, average was 24%, worst was 134%
Lenovo ThinkPad L390 Yoga-20NT000XGE audio analysis
(±) | speaker loudness is average but good (76.3 dB)
Bass 100 - 315 Hz
(-) | nearly no bass - on average 17.9% lower than median
(±) | linearity of bass is average (12.9% delta to prev. frequency)
Mids 400 - 2000 Hz
(+) | balanced mids - only 2.1% away from median
(+) | mids are linear (6.1% delta to prev. frequency)
Highs 2 - 16 kHz
(±) | higher highs - on average 7.5% higher than median
(±) | linearity of highs is average (9.1% delta to prev. frequency)
Overall 100 - 16.000 Hz
(±) | linearity of overall sound is average (23% difference to median)
Compared to same class
» 69% of all tested devices in this class were better, 5% similar, 26% worse
» The best had a delta of 6%, average was 20%, worst was 57%
Compared to all devices tested
» 69% of all tested devices were better, 5% similar, 26% worse
» The best had a delta of 4%, average was 24%, worst was 134%
| Off / Standby | |
| Idle | |
| Load |
|
Key:
min: | |
| Lenovo ThinkPad L13 Yoga 20R6S00800 i5-10210U, UHD Graphics 620, Toshiba XG6 KXG6AZNV512G, IPS, 1920x1080, 13.3" | Lenovo ThinkPad L390 Yoga-20NT000XGE i5-8265U, UHD Graphics 620, Samsung SSD PM981 MZVLB256HAHQ, IPS LED, 1920x1080, 13.3" | HP Envy x360 13-ar0601ng R7 3700U, Vega 10, SK Hynix BC501 HFM512GDJTNG, IPS, 120 Hz, 1920x1080, 13.3" | HP Pavilion x360 14-dh1153ng i5-10210U, UHD Graphics 620, Intel Optane Memory H10 with Solid State Storage 32GB + 512GB HBRPEKNX0202A(L/H), IPS, 1920x1080, 14" | Lenovo Yoga C740-14IML i5-10210U, UHD Graphics 620, Samsung SSD PM981a MZVLB256HBHQ, IPS, 1920x1080, 14" | Average Intel UHD Graphics 620 | Average of class Convertible | |
|---|---|---|---|---|---|---|---|
| Power Consumption | 6% | 25% | 26% | 19% | 11% | -1% | |
| Idle Minimum * (Watt) | 3.7 | 4 -8% | 3.2 14% | 3.3 11% | 3 19% | 3.81 ? -3% | 4.22 ? -14% |
| Idle Average * (Watt) | 6.2 | 7.1 -15% | 2.8 55% | 5.8 6% | 3.9 37% | 6.94 ? -12% | 6.97 ? -12% |
| Idle Maximum * (Watt) | 11.2 | 10.7 4% | 12.4 -11% | 7.9 29% | 7.3 35% | 8.75 ? 22% | 8.63 ? 23% |
| Load Average * (Watt) | 44.3 | 33.8 24% | 24.2 45% | 27 39% | 42.5 4% | 35 ? 21% | 43.9 ? 1% |
| Load Maximum * (Watt) | 65 | 48.8 25% | 50 23% | 37 43% | 65.5 -1% | 47.5 ? 27% | 67.1 ? -3% |
* ... smaller is better
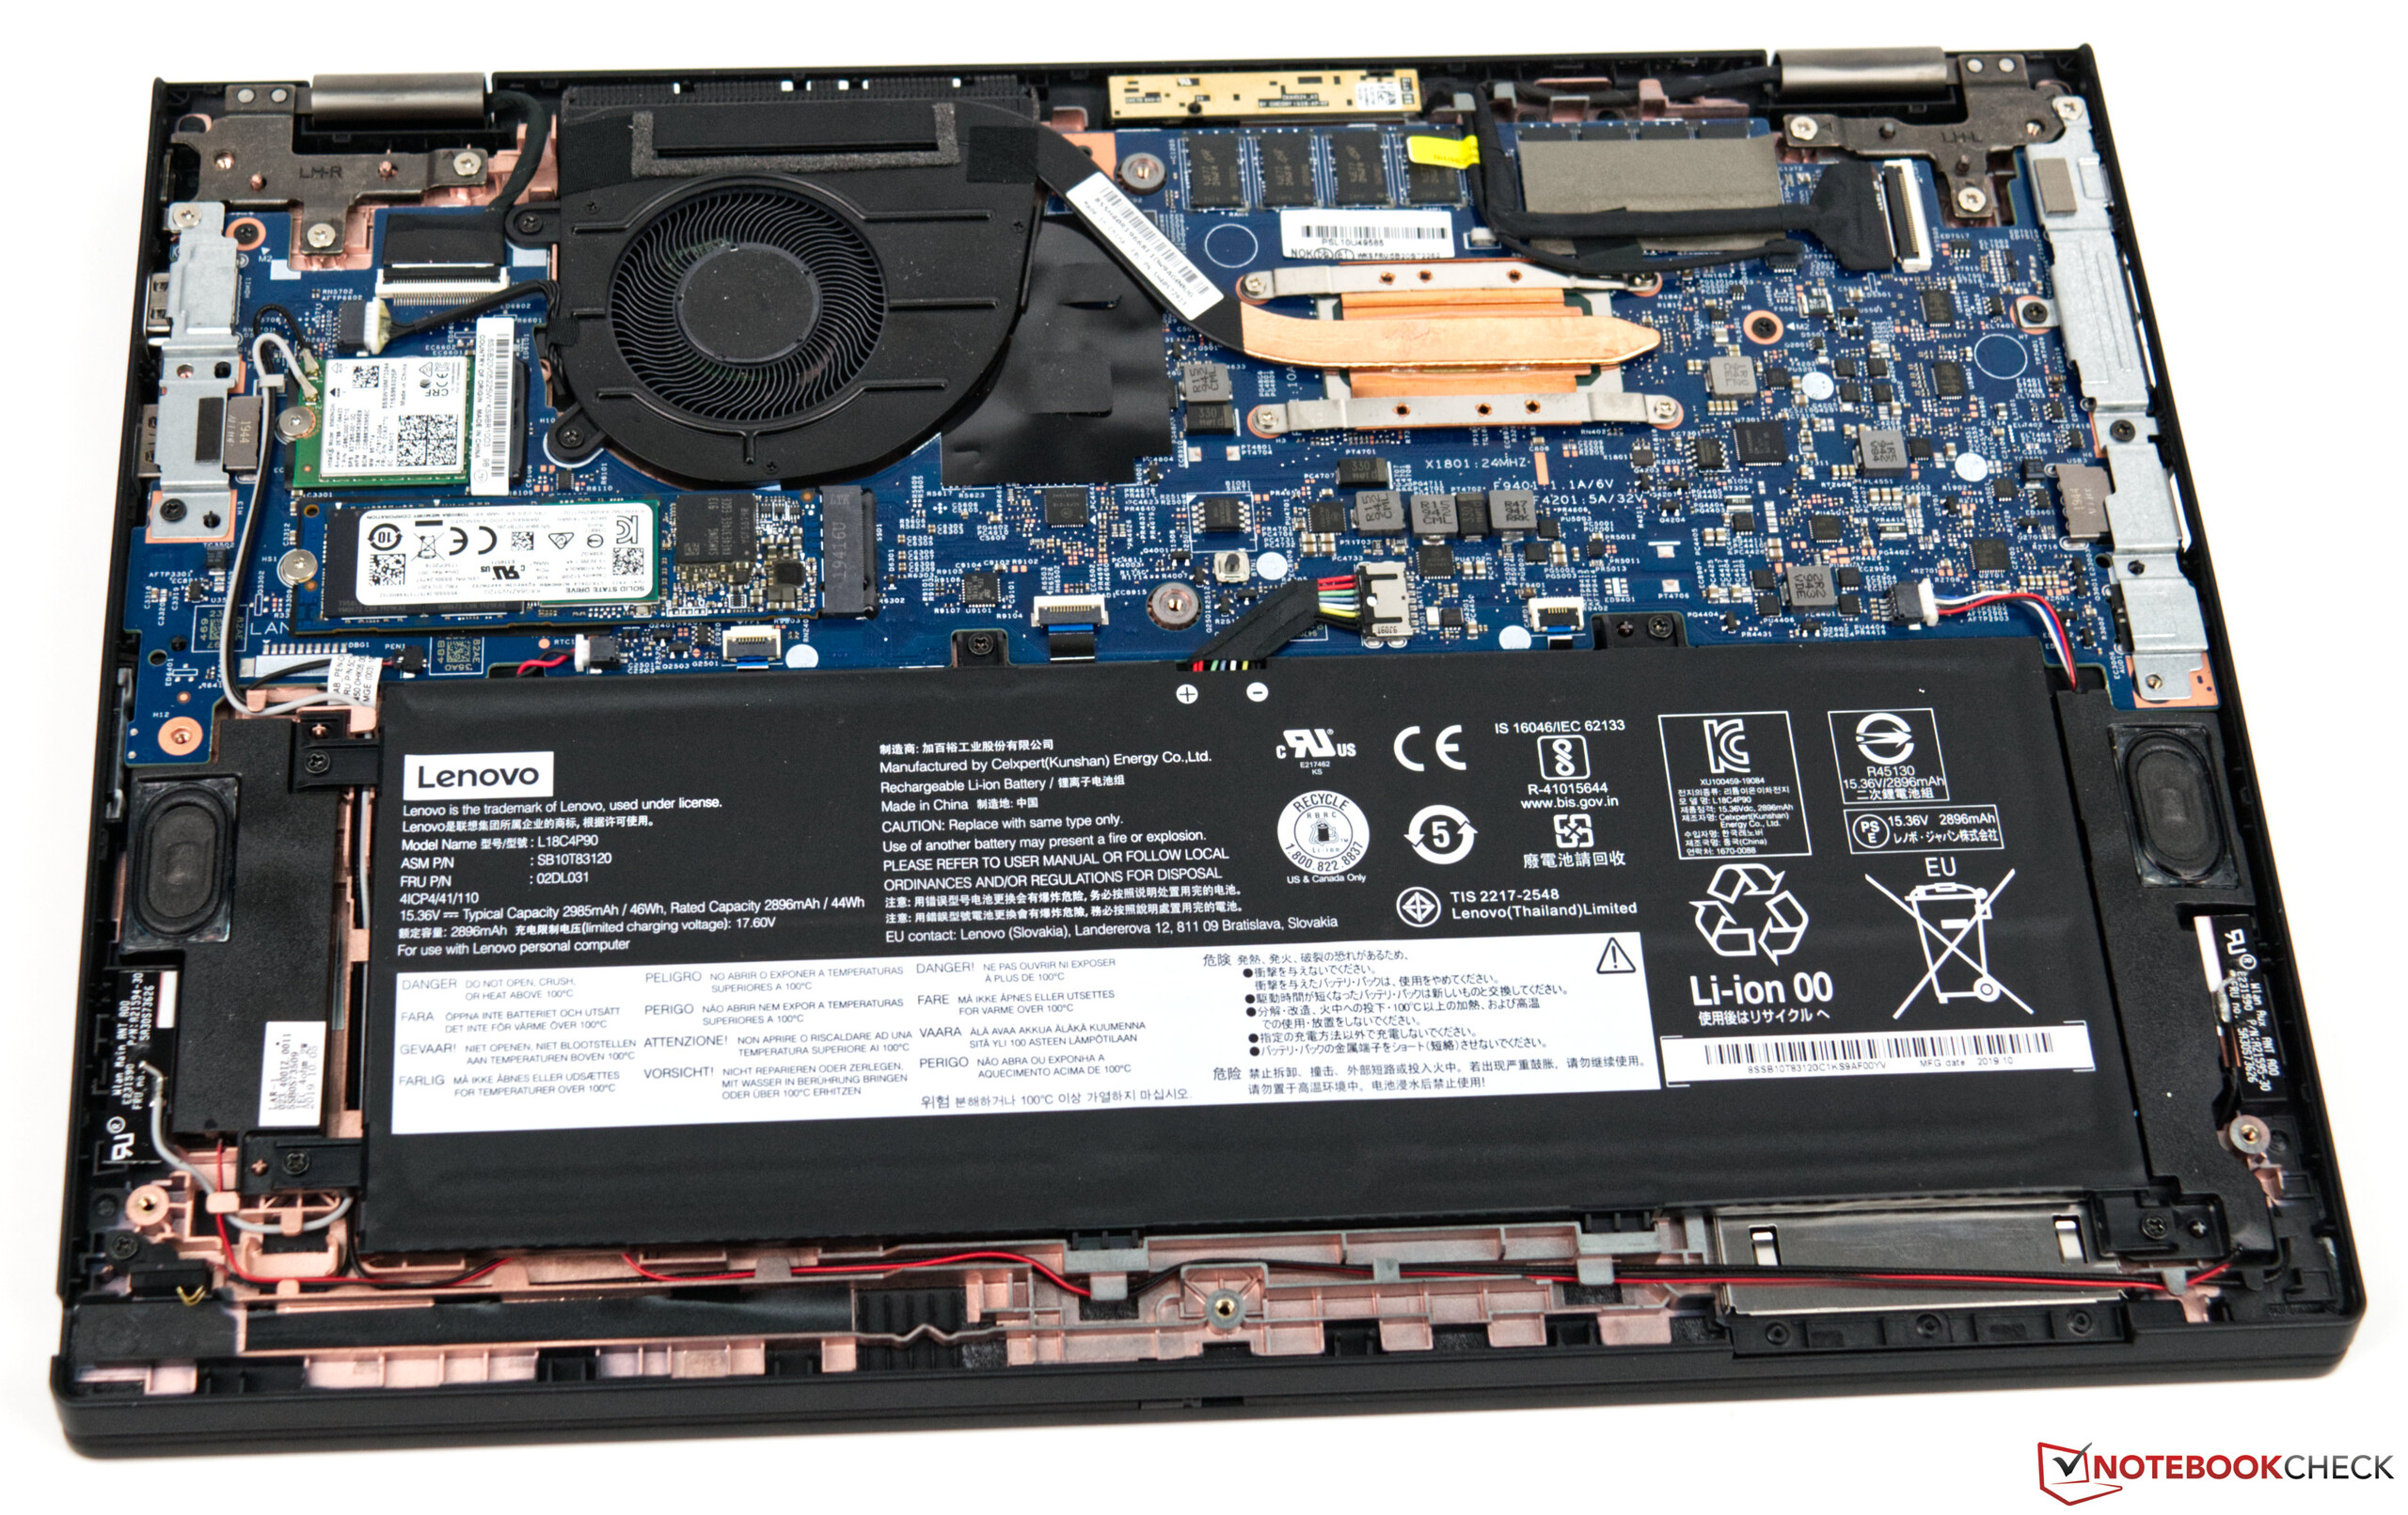
| Lenovo ThinkPad L13 Yoga 20R6S00800 i5-10210U, UHD Graphics 620, 46 Wh | Lenovo ThinkPad L390 Yoga-20NT000XGE i5-8265U, UHD Graphics 620, 45 Wh | HP Envy x360 13-ar0601ng R7 3700U, Vega 10, 53 Wh | HP Pavilion x360 14-dh1153ng i5-10210U, UHD Graphics 620, 41 Wh | Lenovo Yoga C740-14IML i5-10210U, UHD Graphics 620, 51 Wh | Average of class Convertible | |
|---|---|---|---|---|---|---|
| Battery runtime | -5% | -8% | -5% | 7% | 64% | |
| Reader / Idle (h) | 15.2 | 15.8 4% | 10.5 -31% | 14.3 -6% | 18.6 22% | 27.7 ? 82% |
| H.264 (h) | 6.6 | 7.4 12% | 6.5 -2% | 8.8 33% | 15.3 ? 132% | |
| WiFi v1.3 (h) | 7.7 | 7.2 -6% | 7.3 -5% | 6.3 -18% | 9.2 19% | 12.1 ? 57% |
| Load (h) | 2.1 | 1.5 -29% | 2.2 5% | 1.5 -29% | 1.7 -19% | 1.779 ? -15% |


Pros
Cons
Verdict - Good value for money


Lenovo ThinkPad L13 Yoga继承了Lenovo ThinkPad L390的特征。但是,新的Comet Lake SoC无法在测试中实现任何显著的性能提升。但是,即使电池电量的增加仅为百分之几,新设备仍具有续航方面的优势。
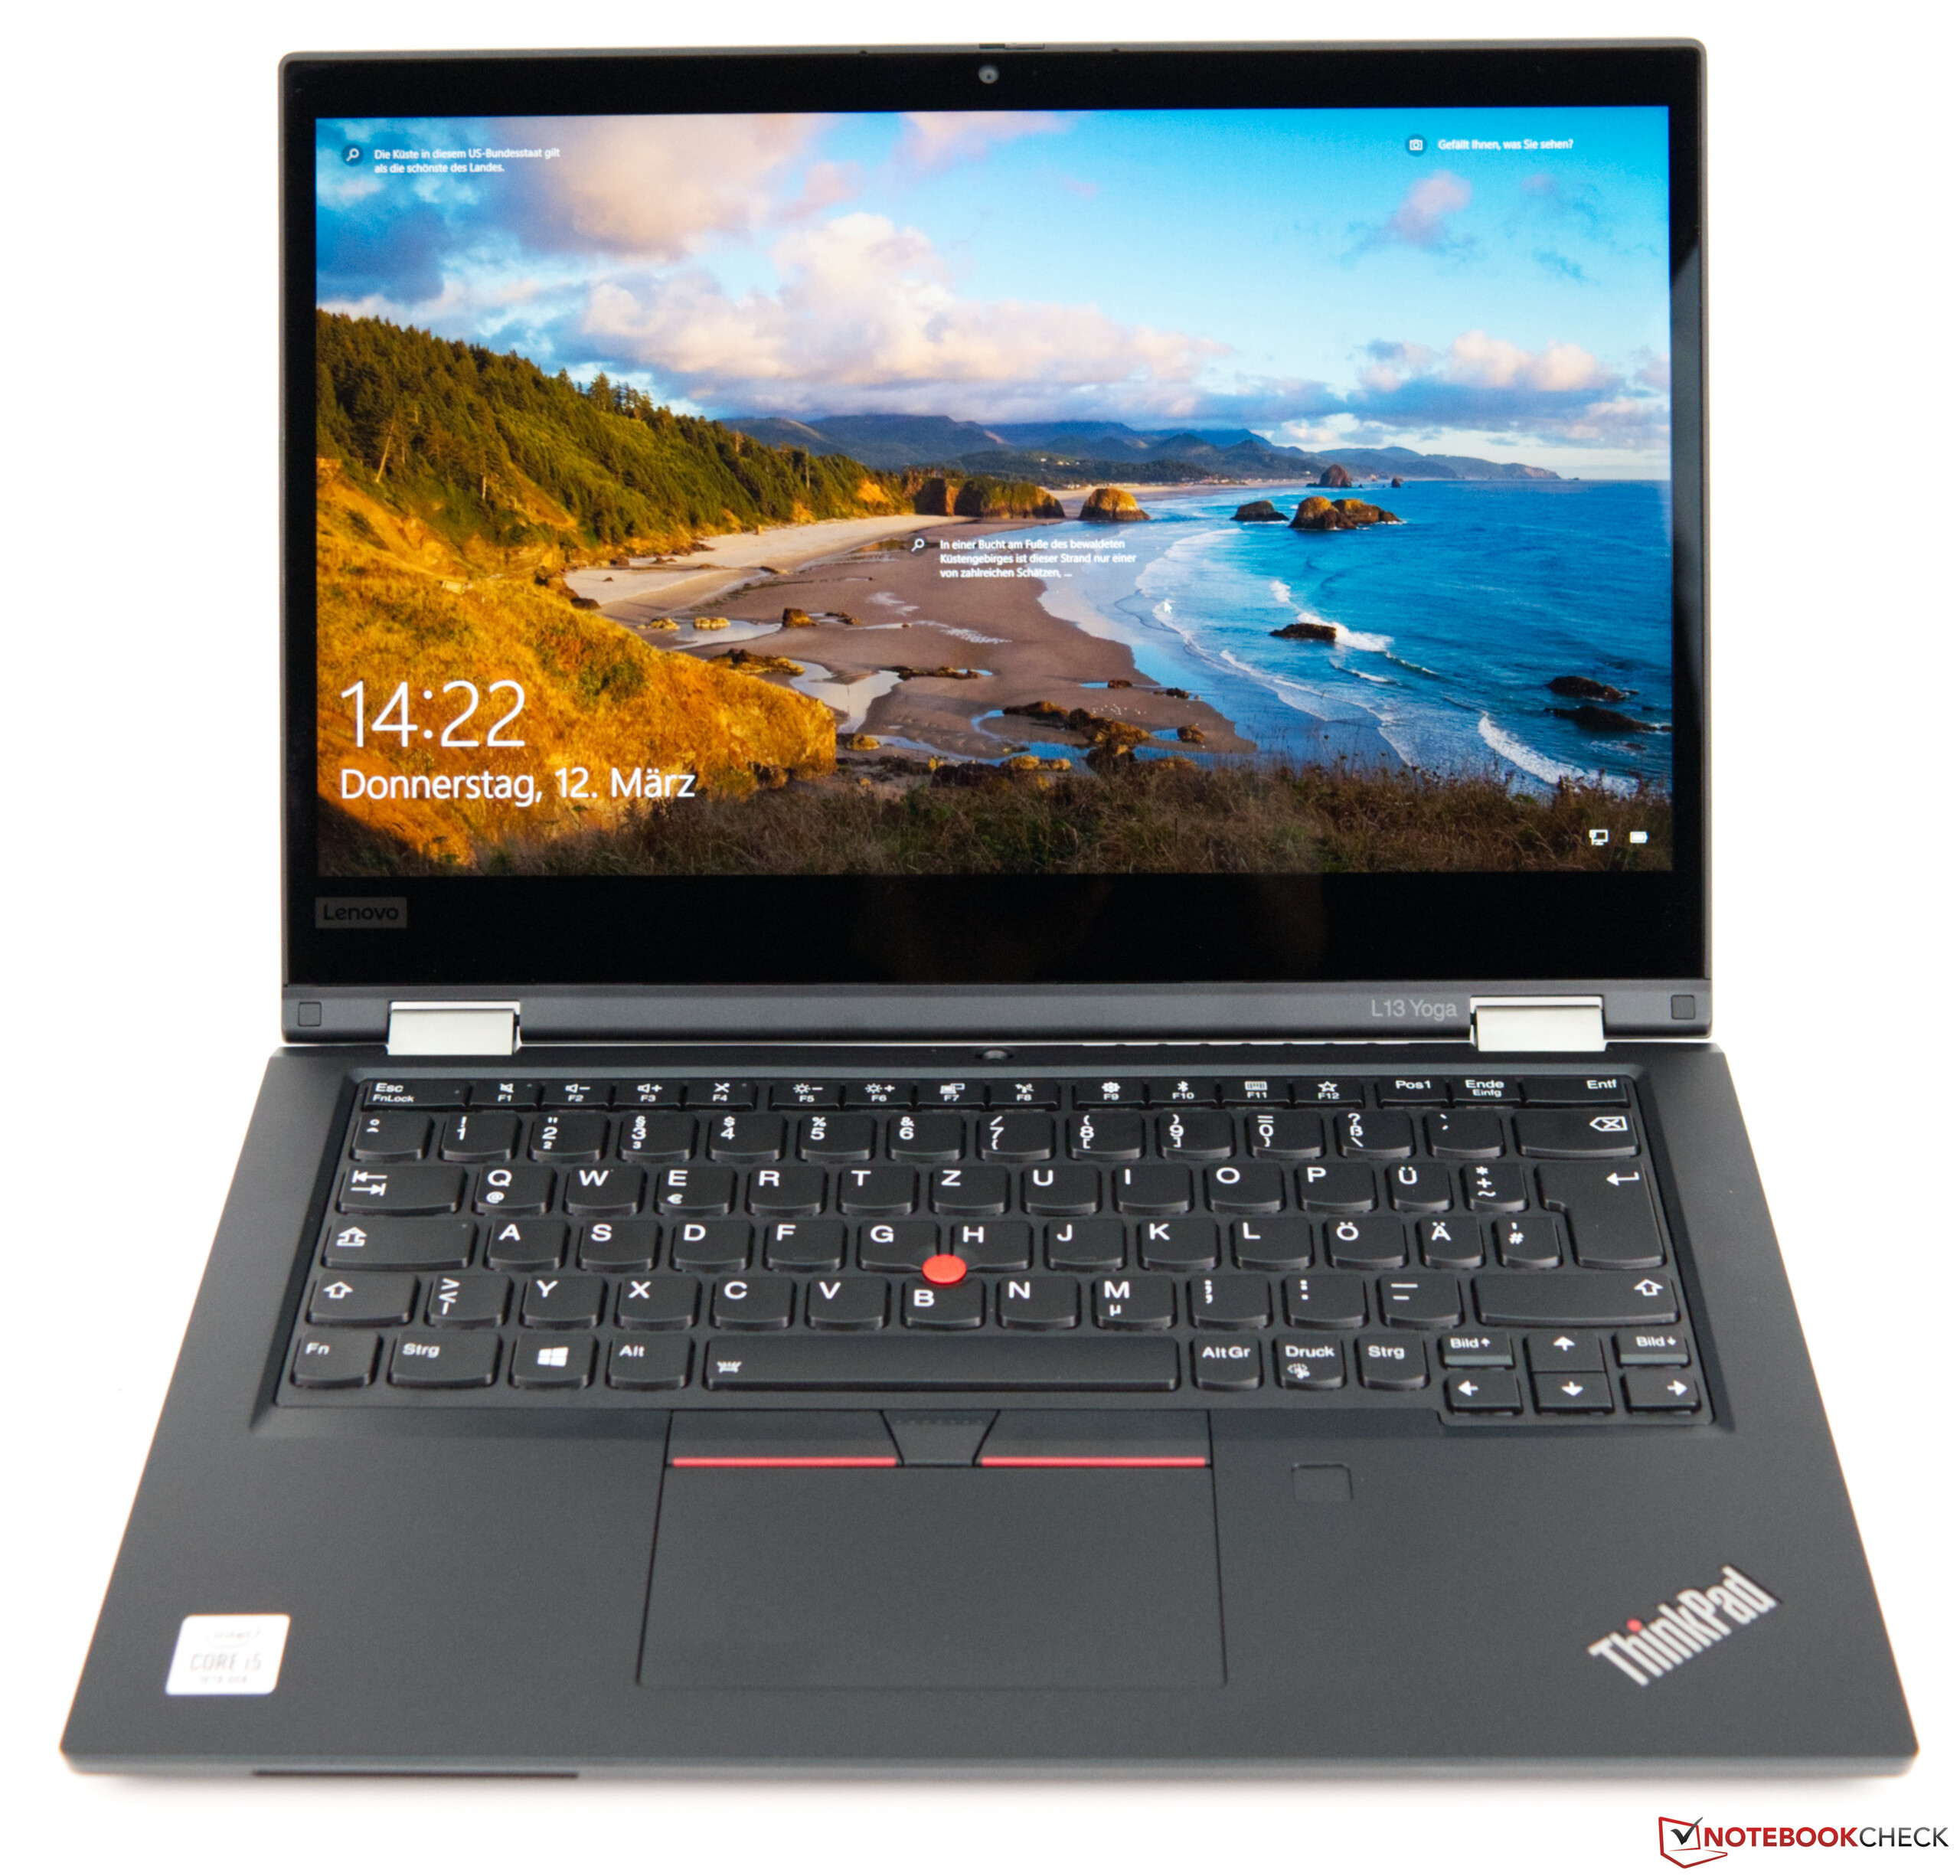
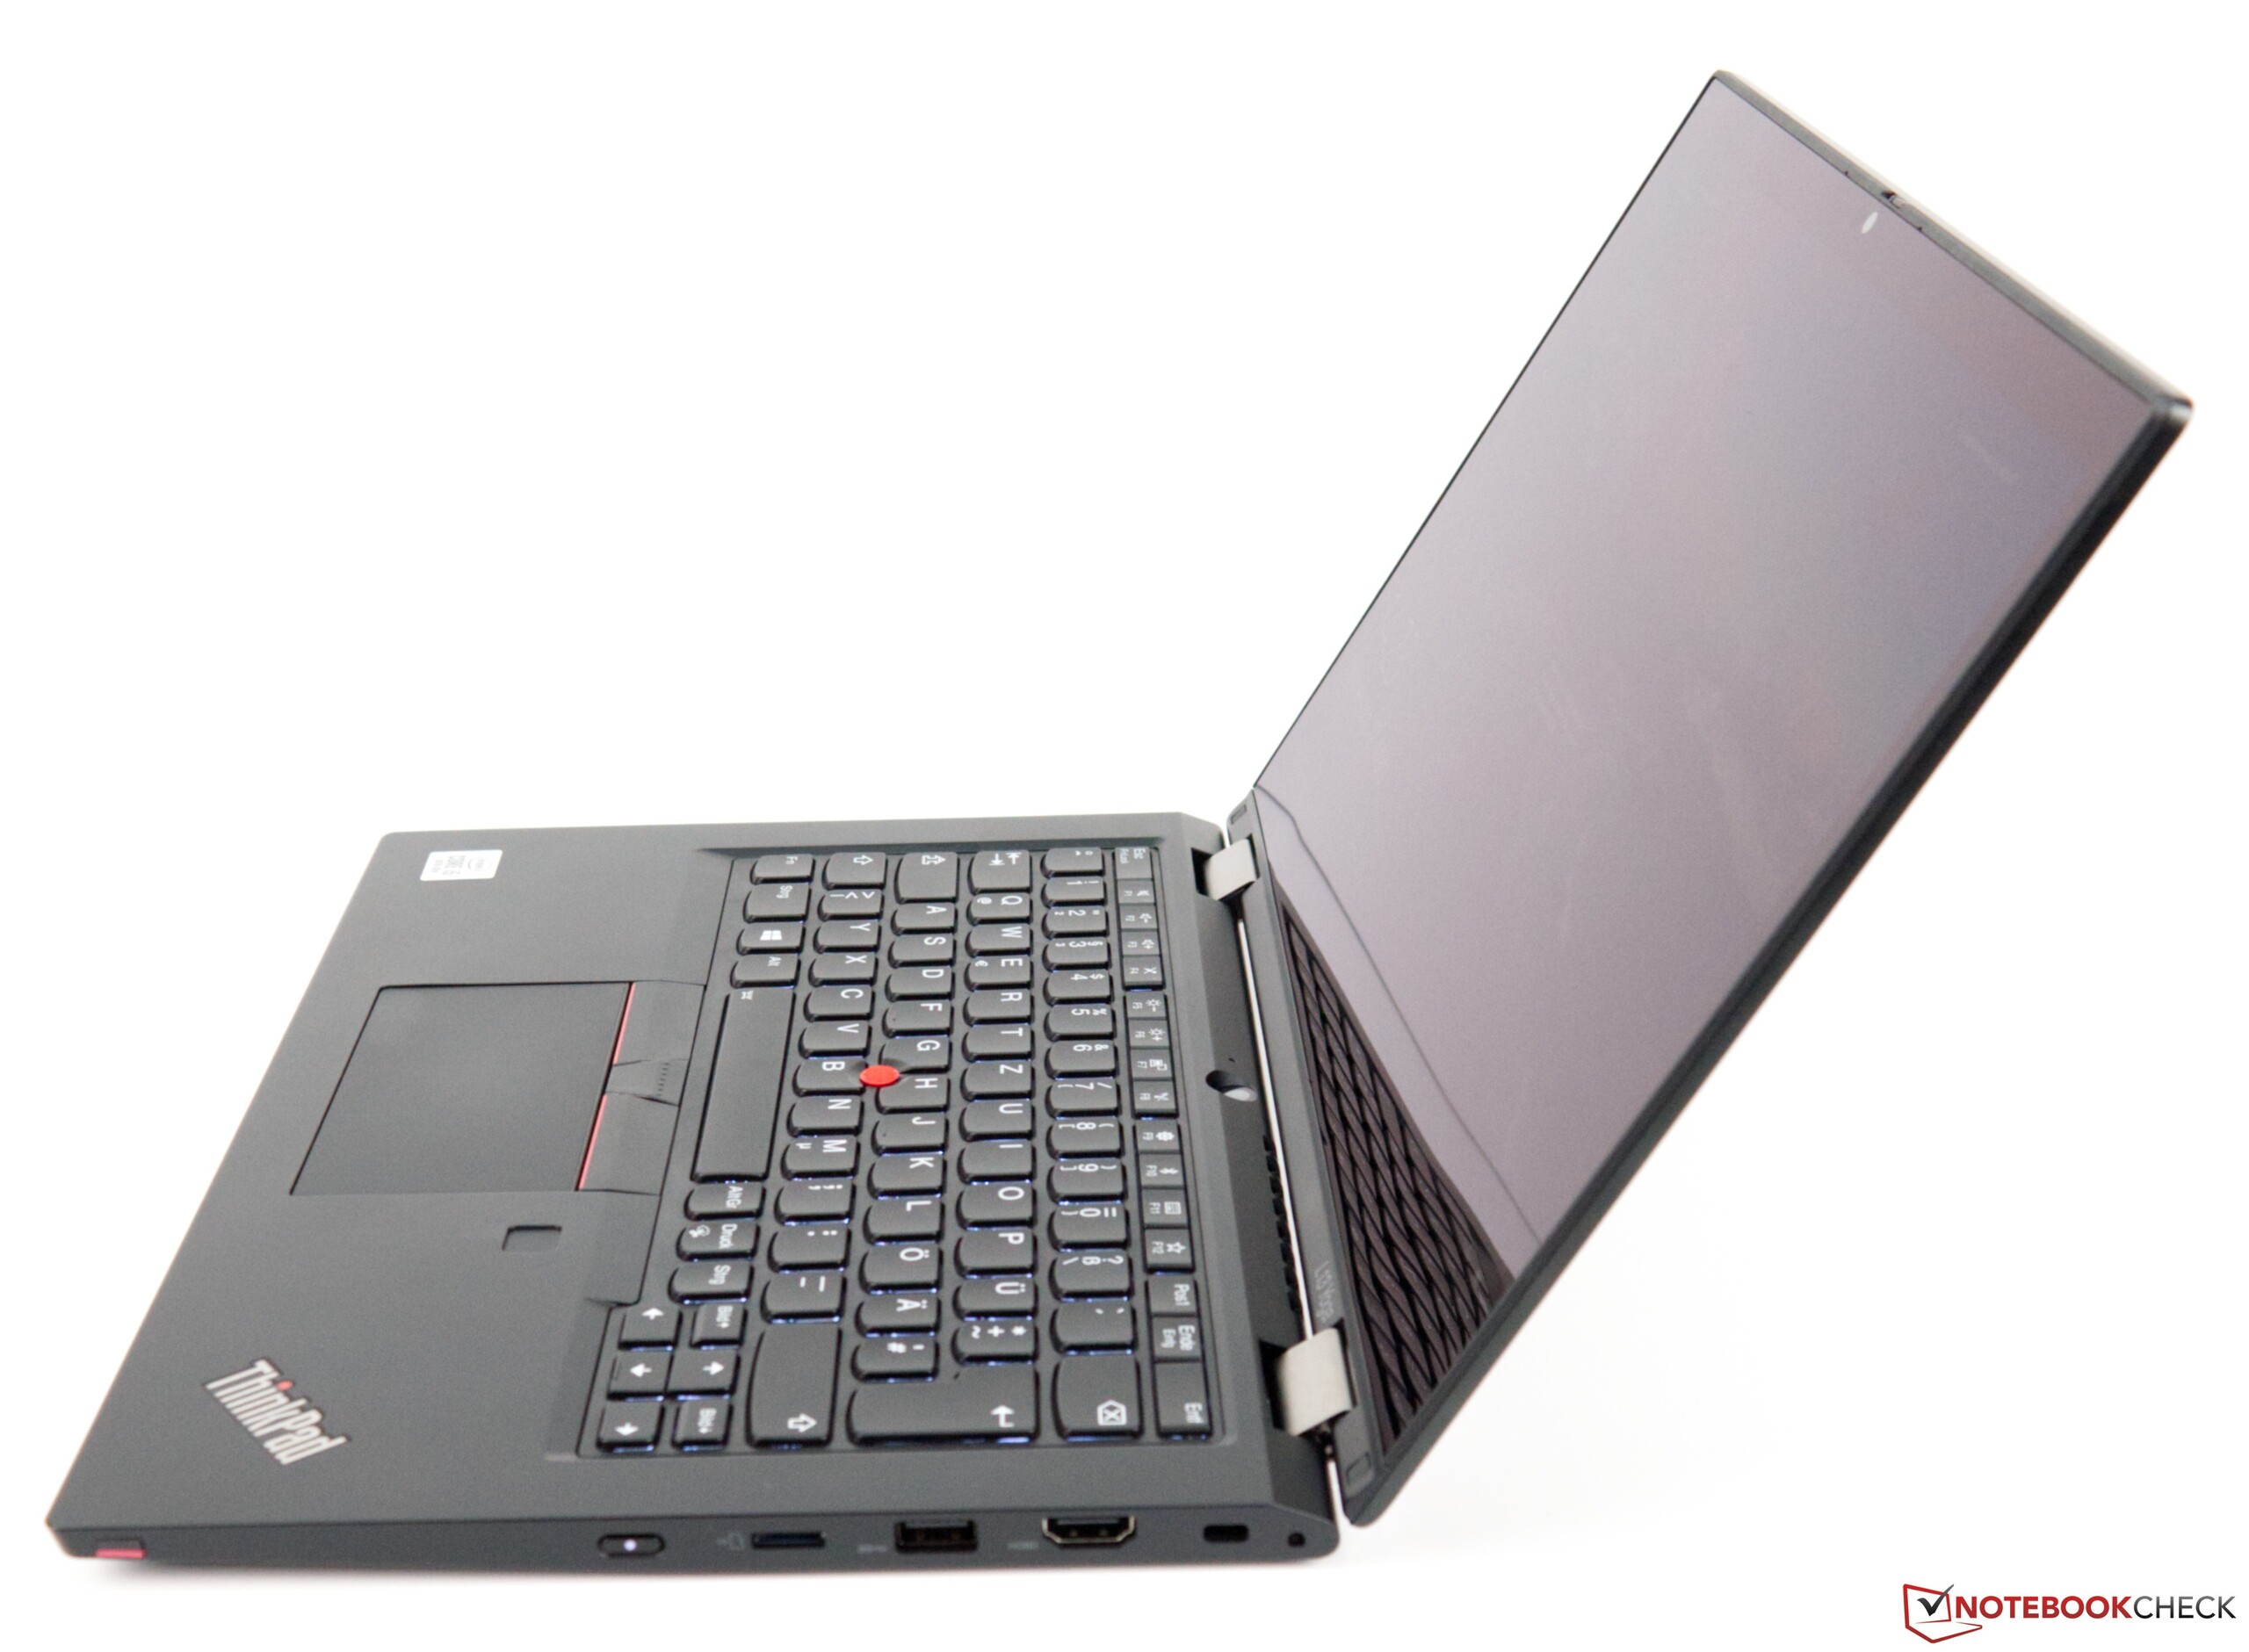
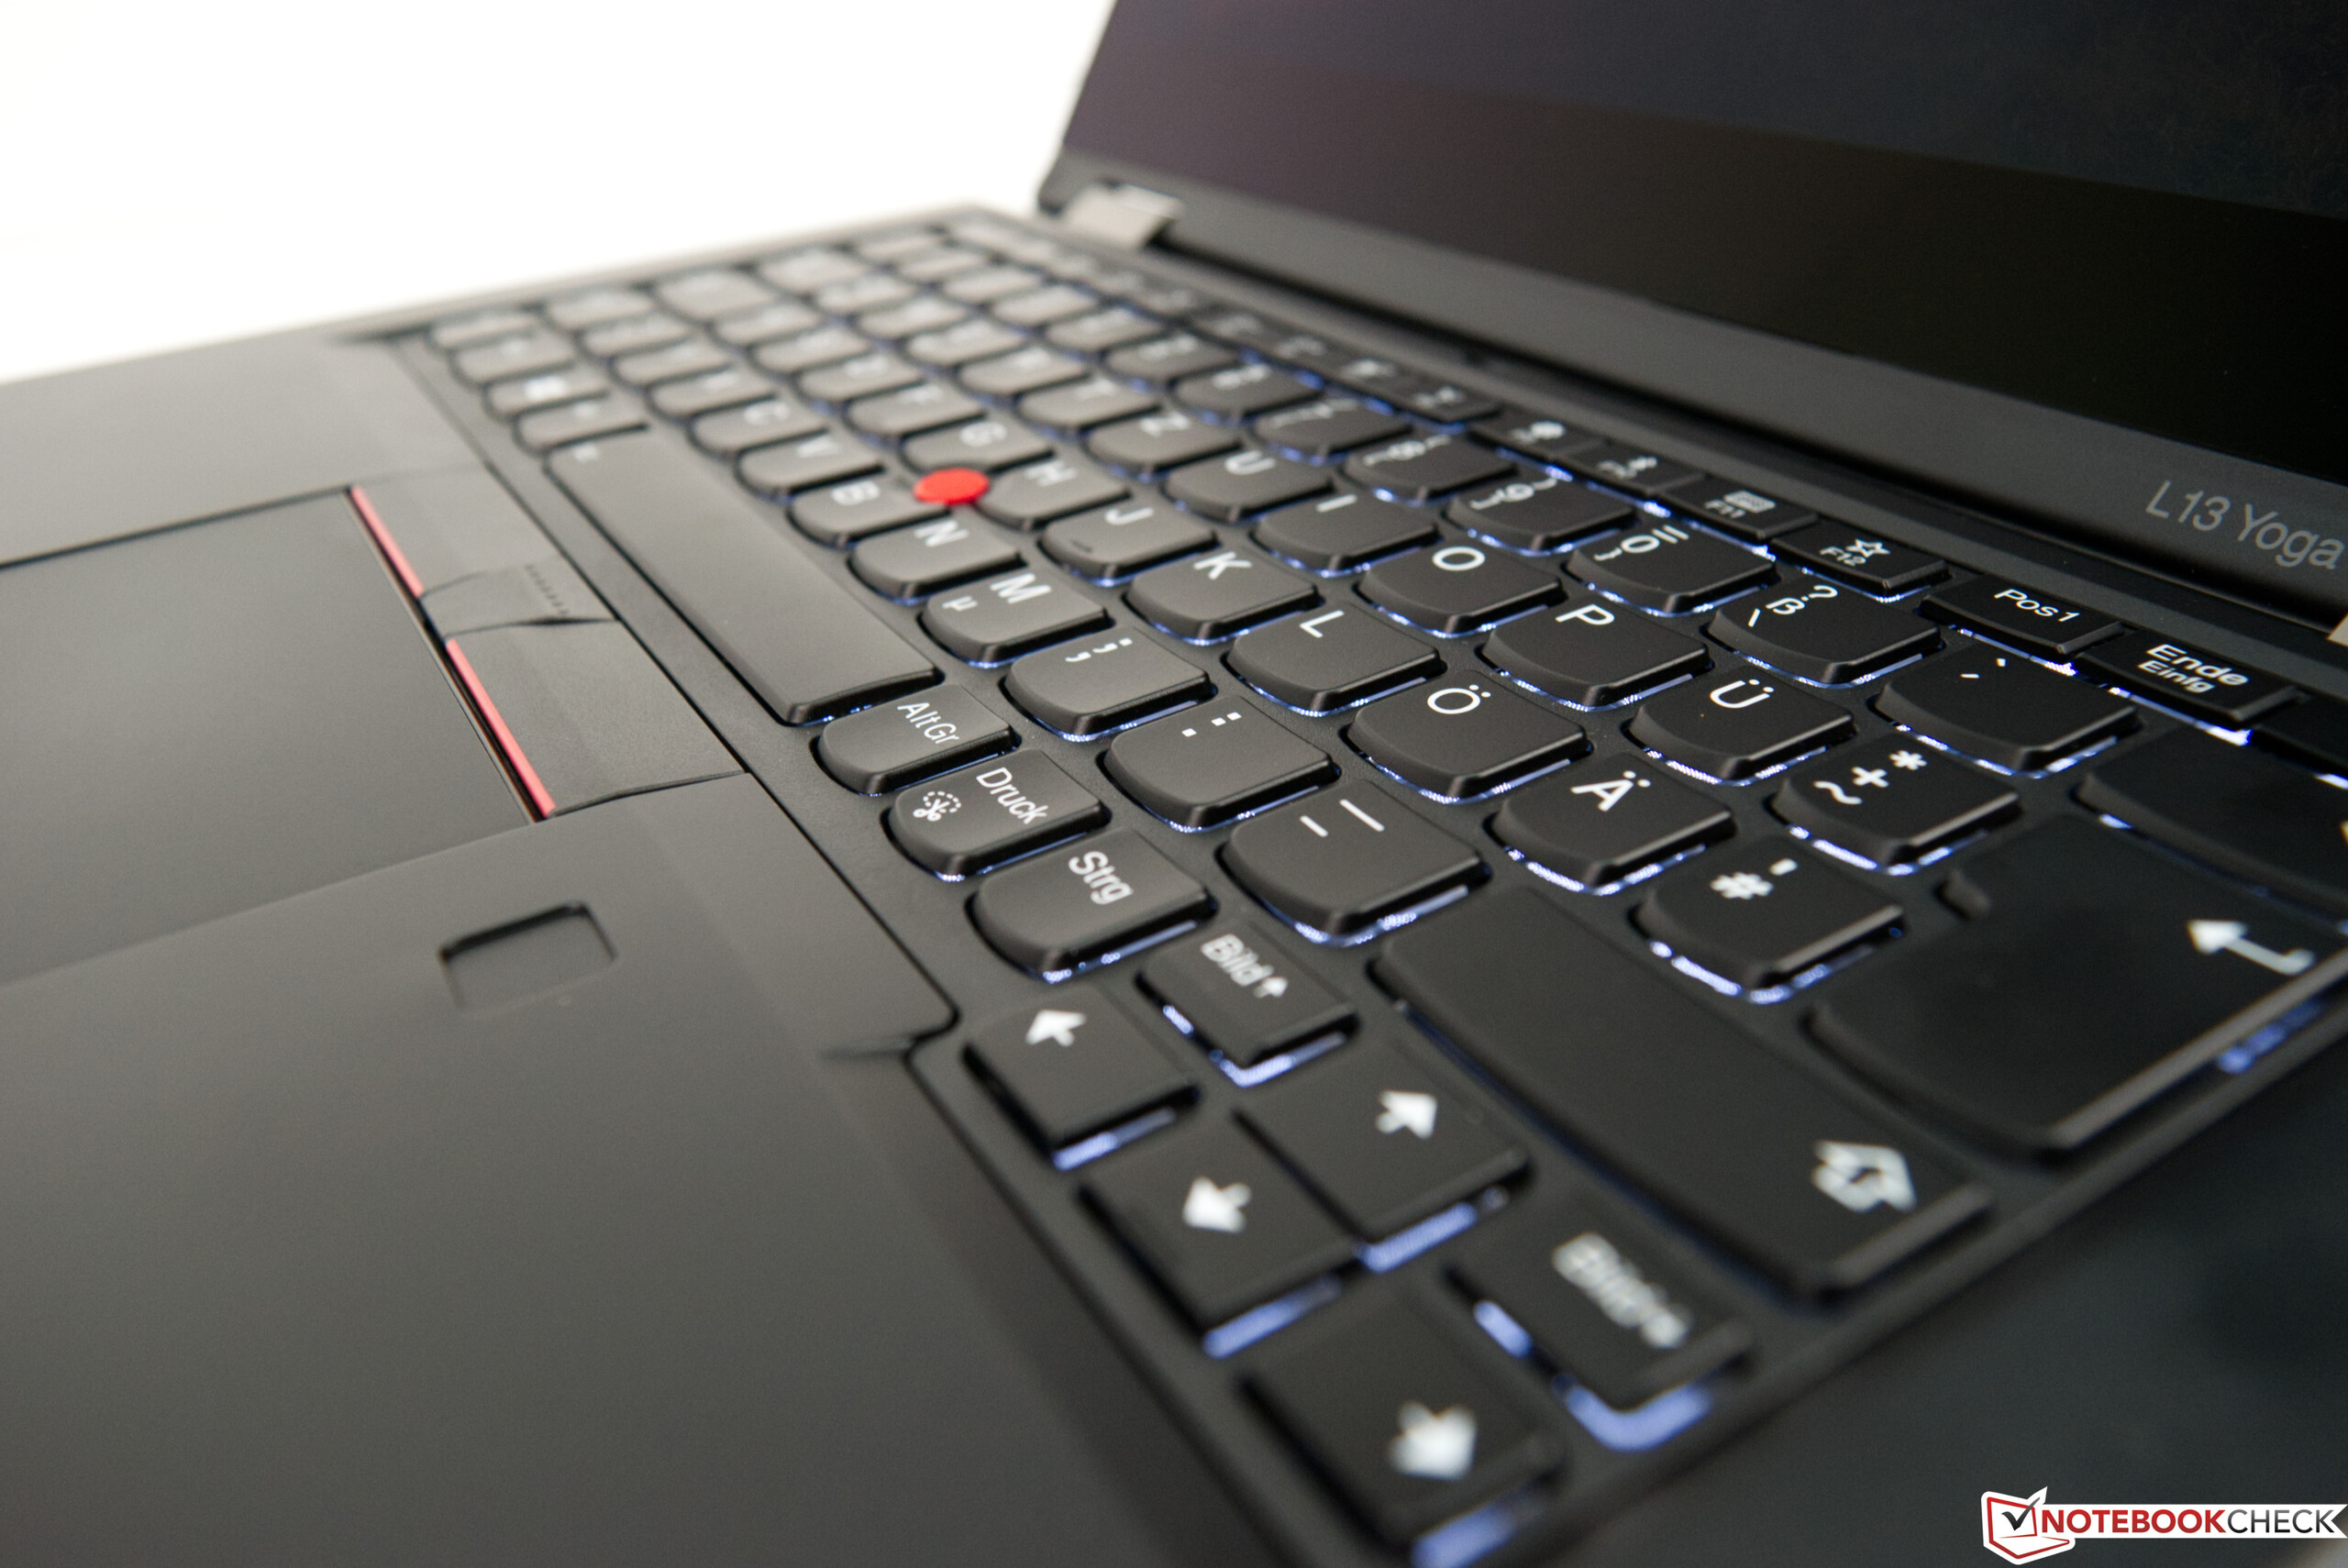
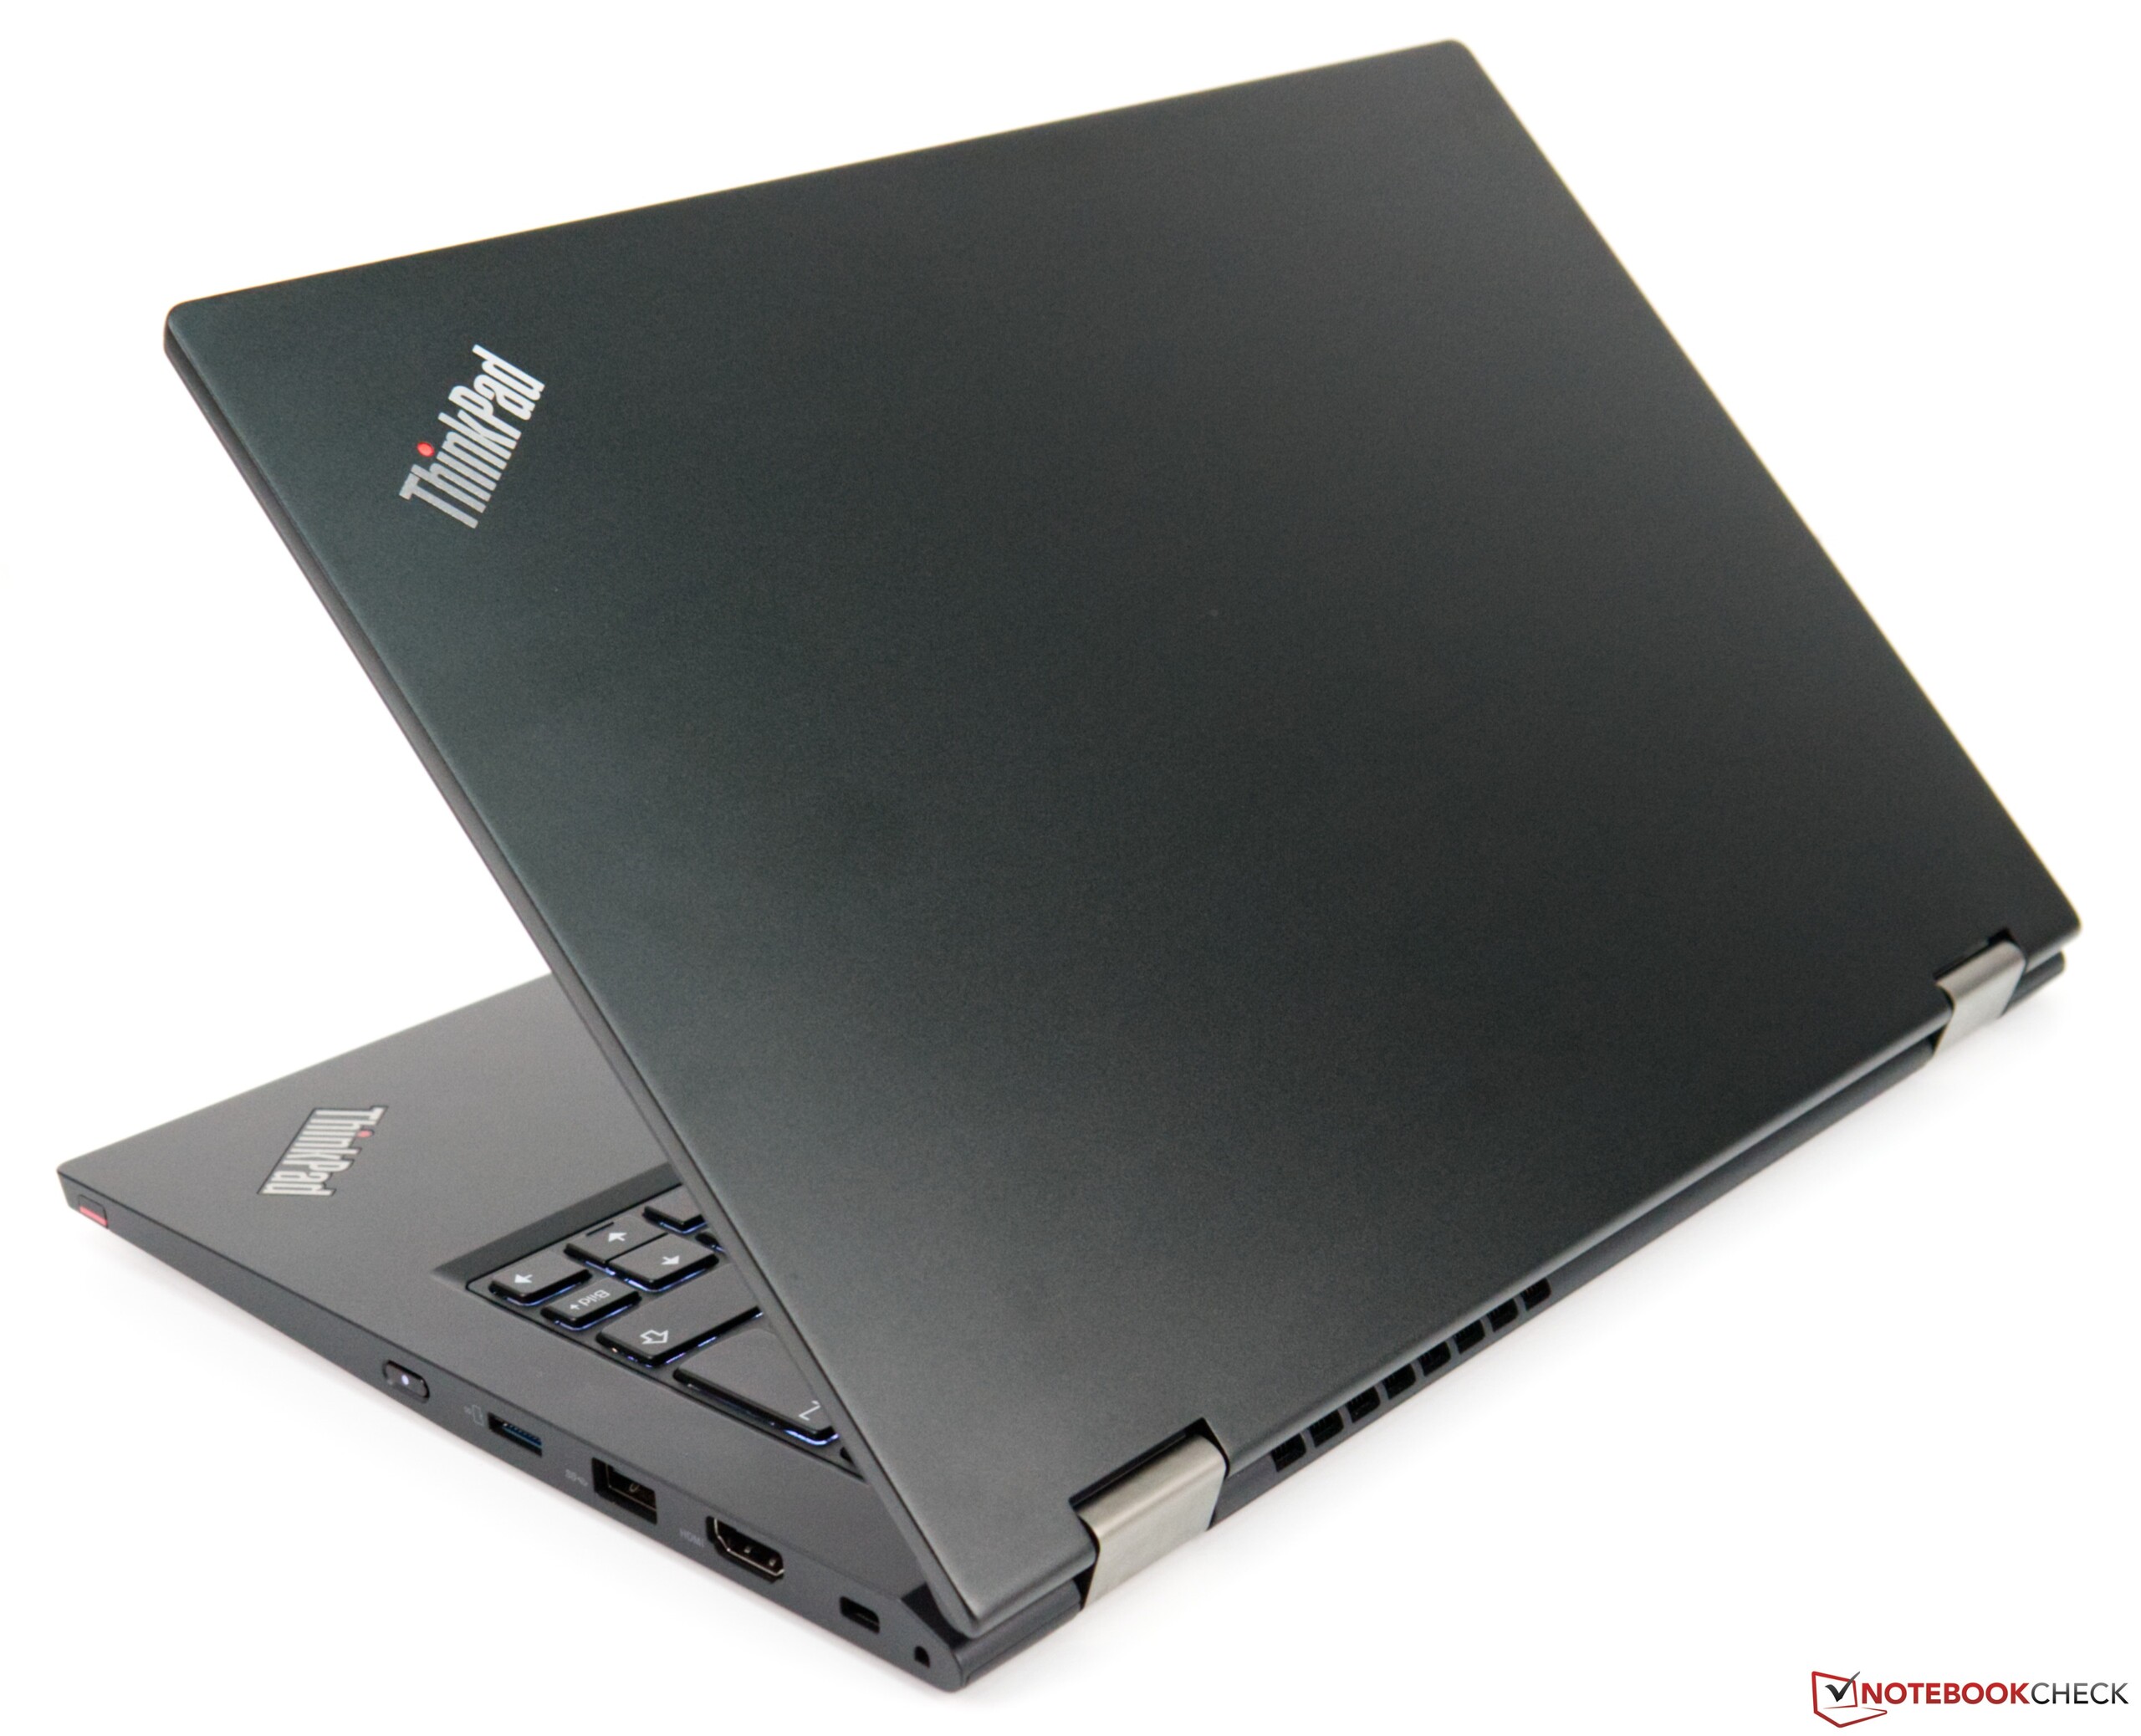
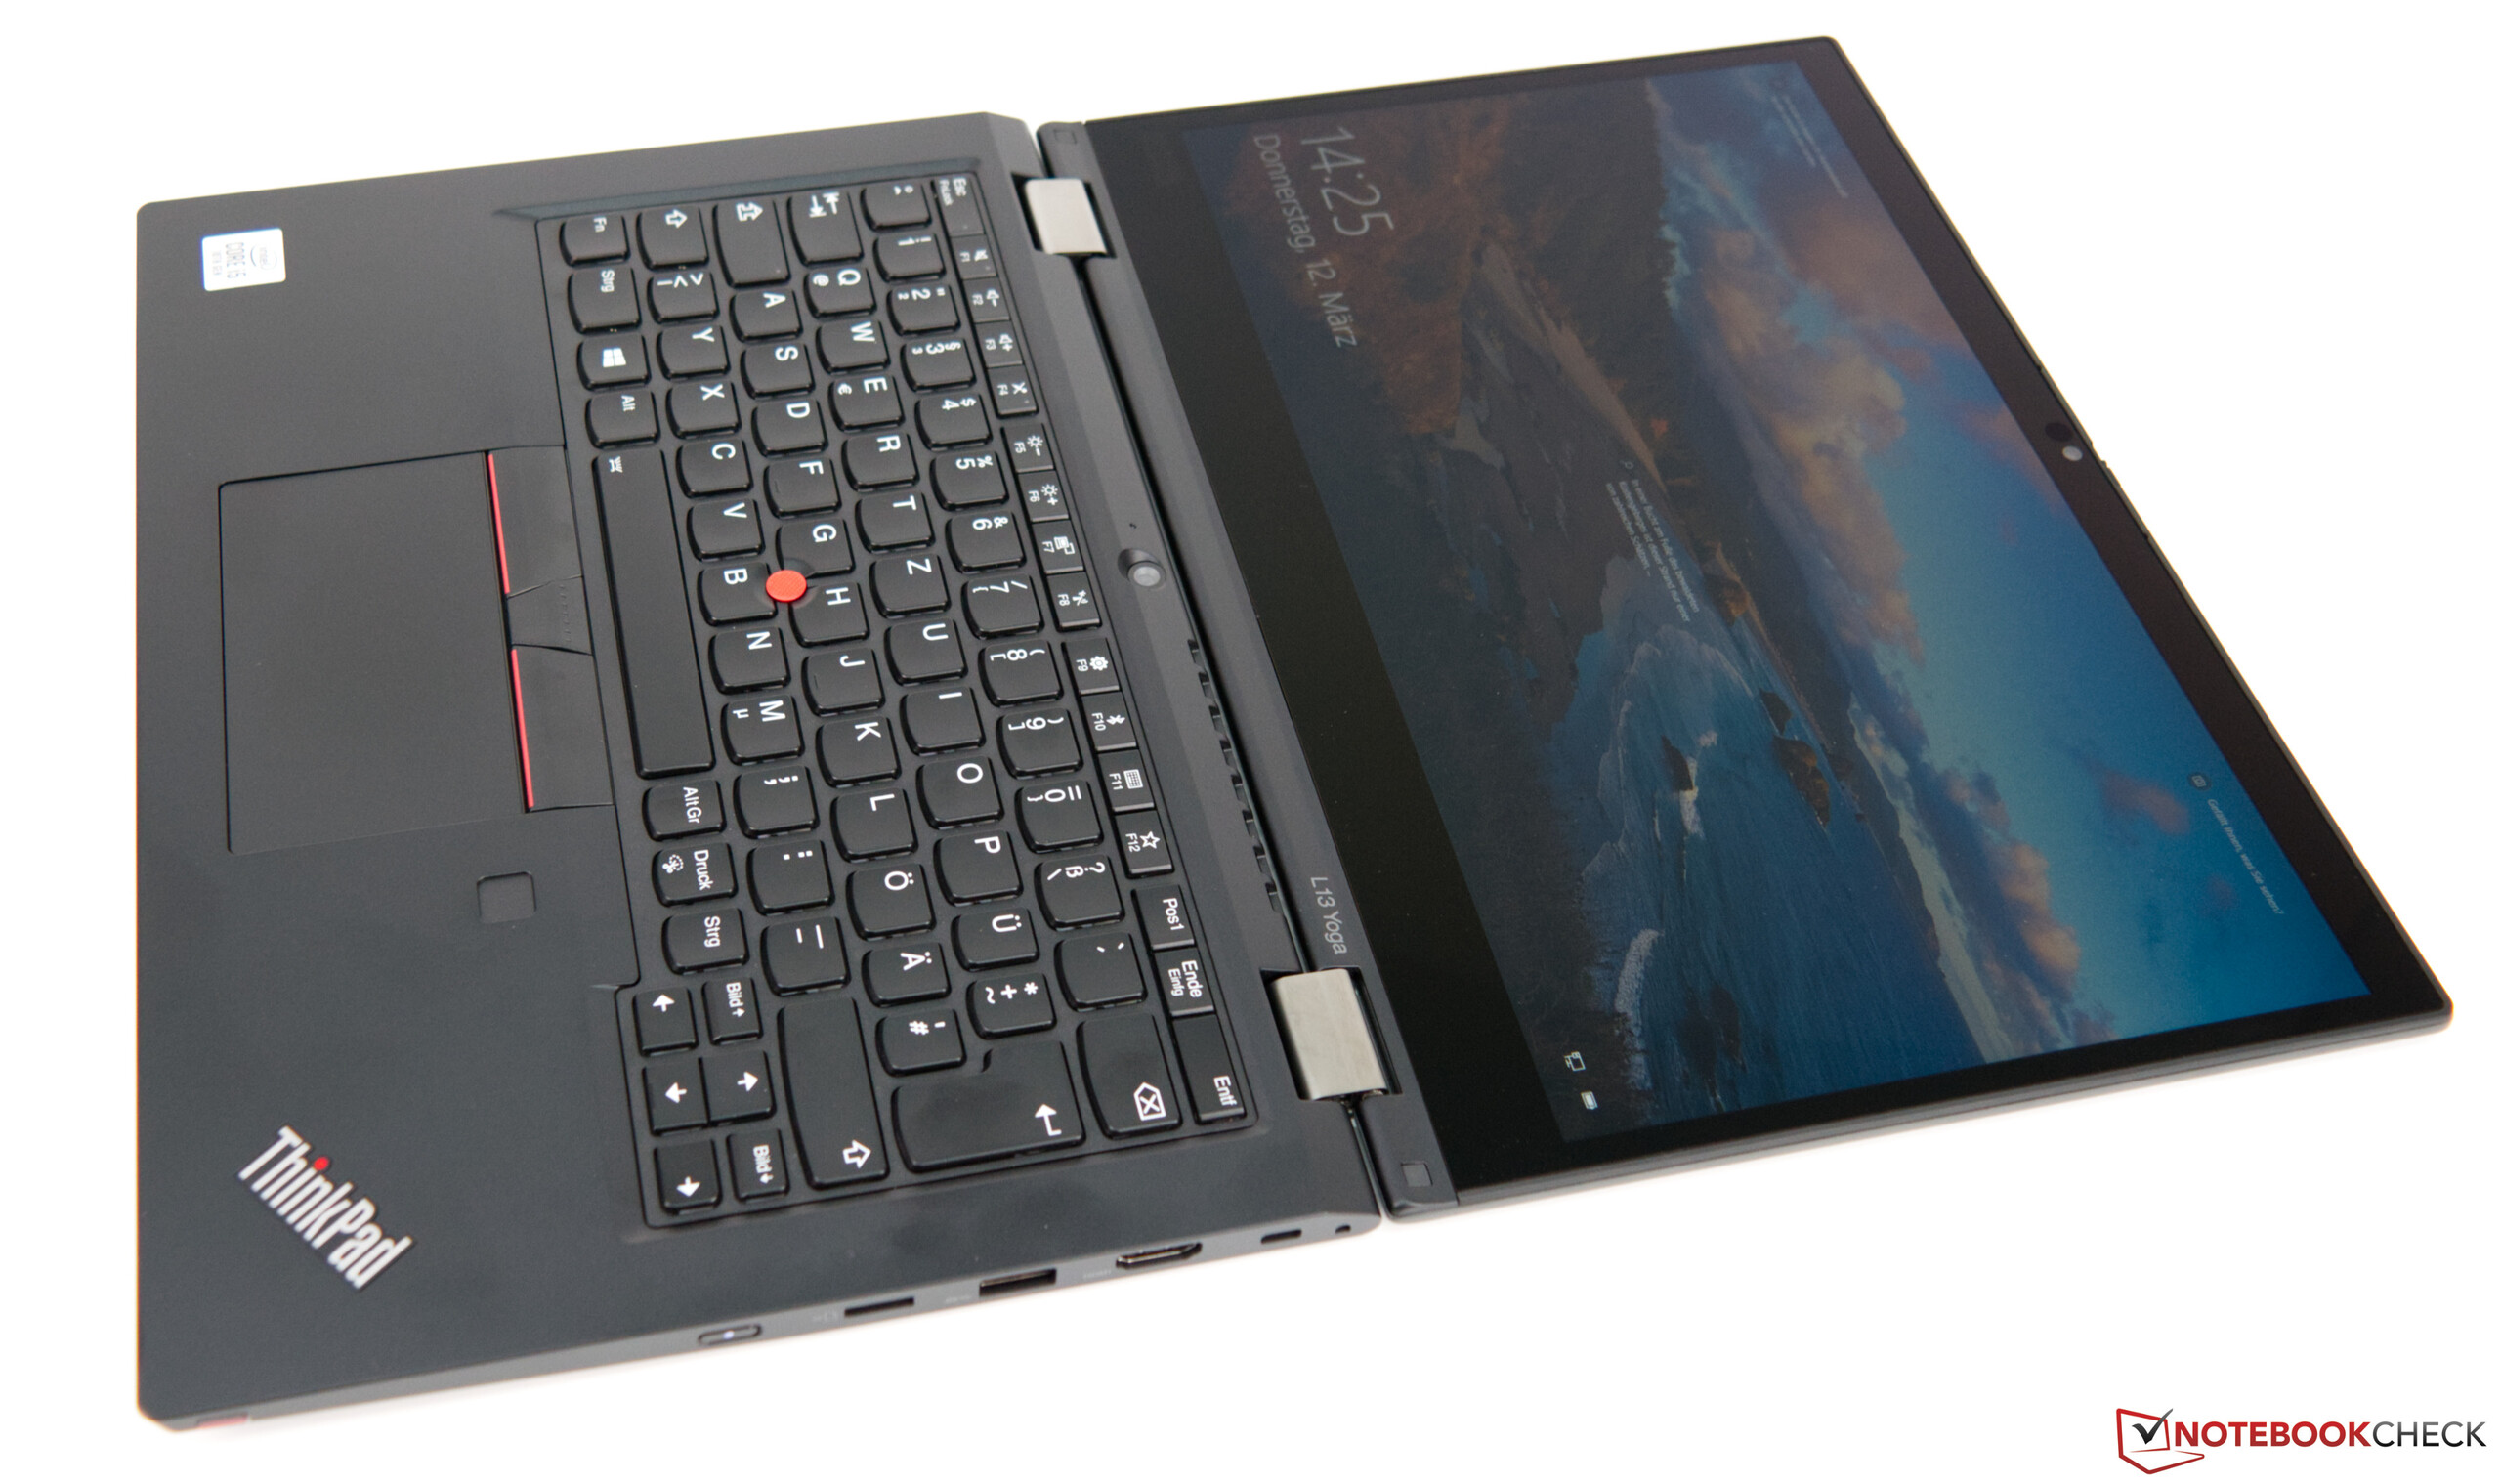
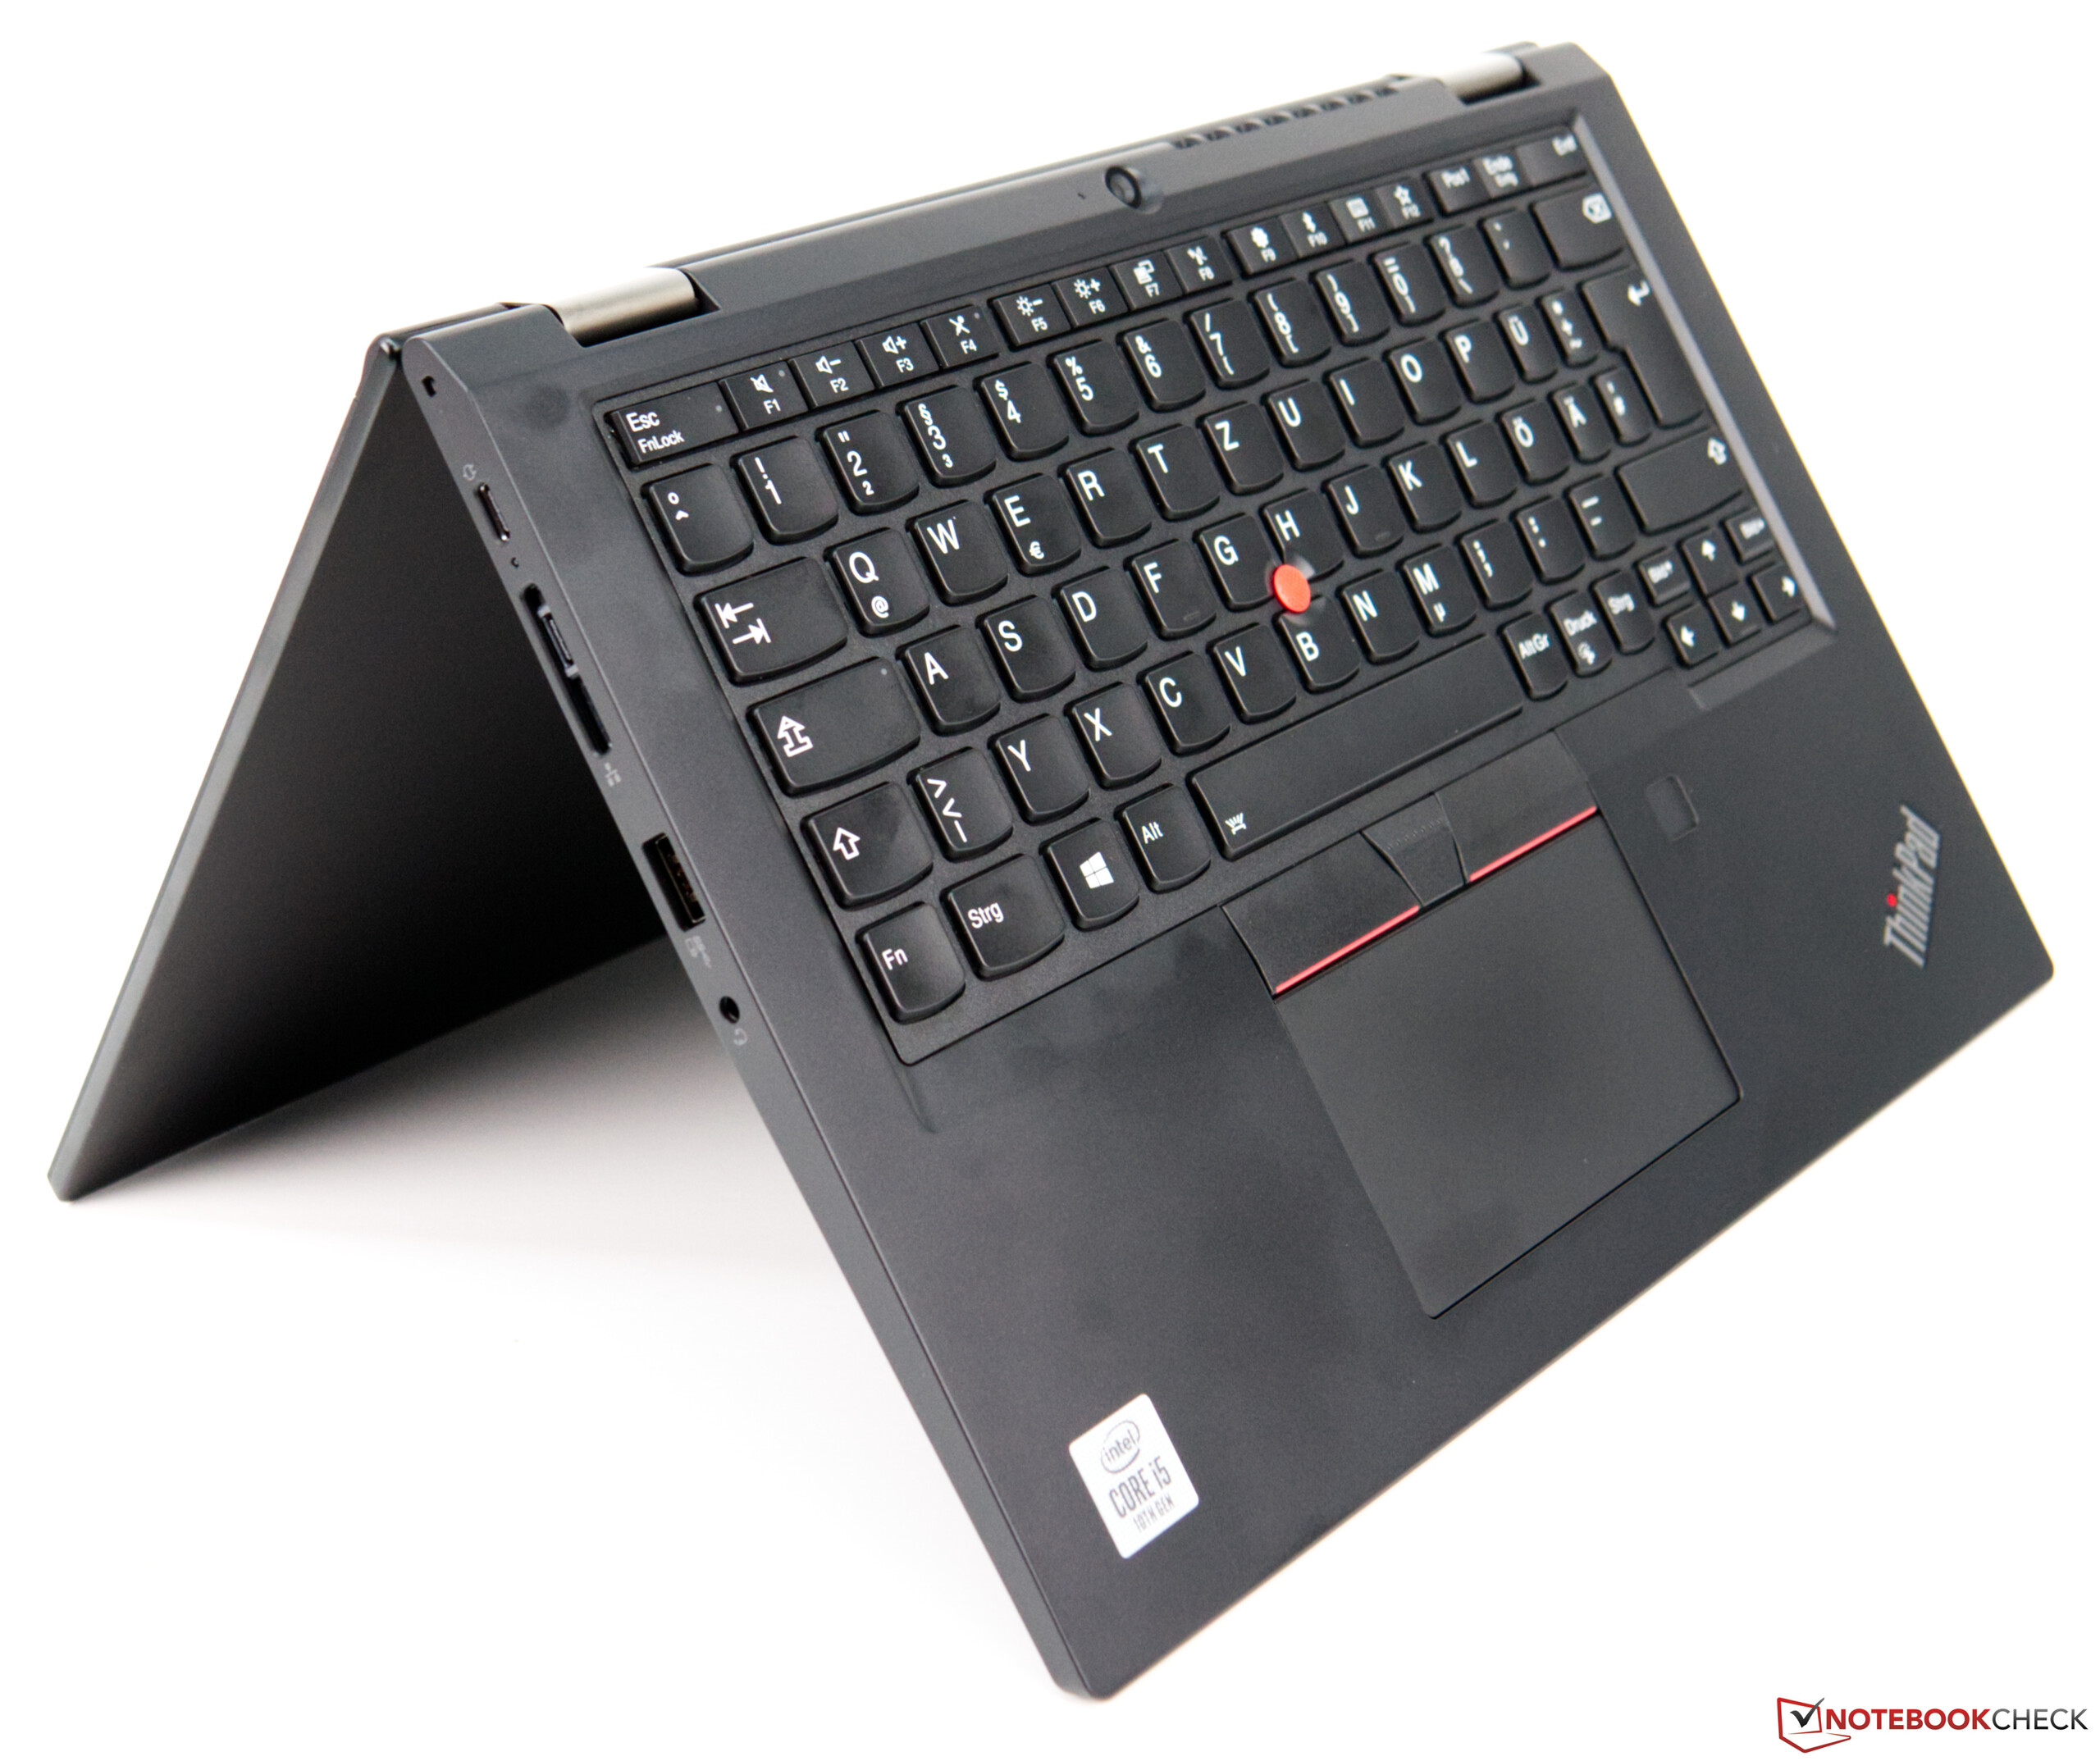
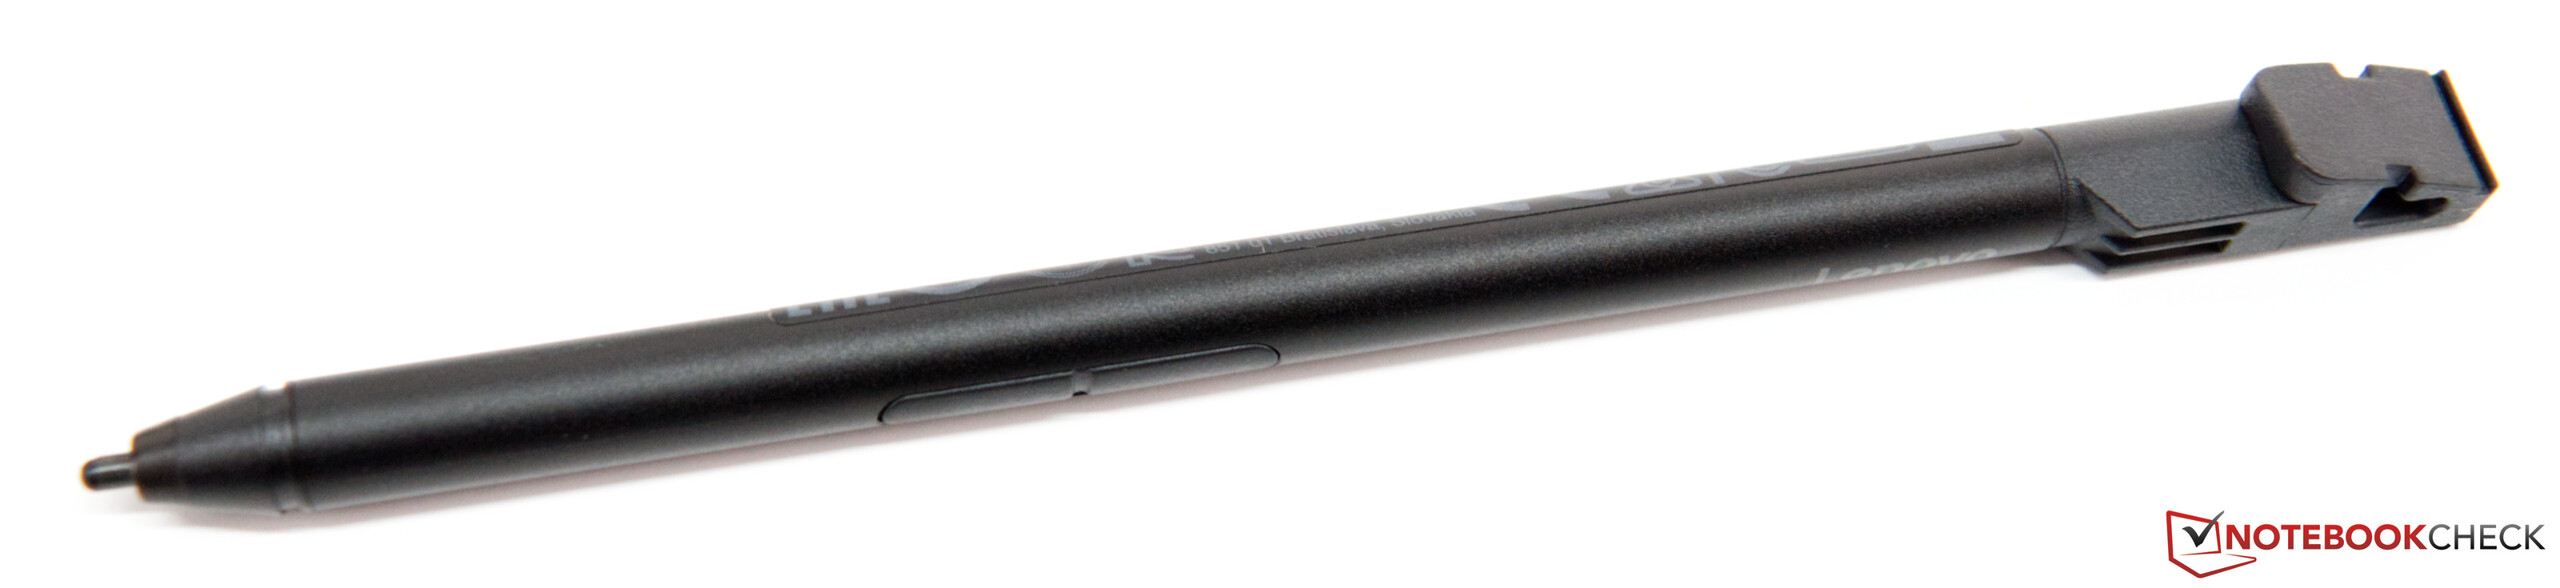
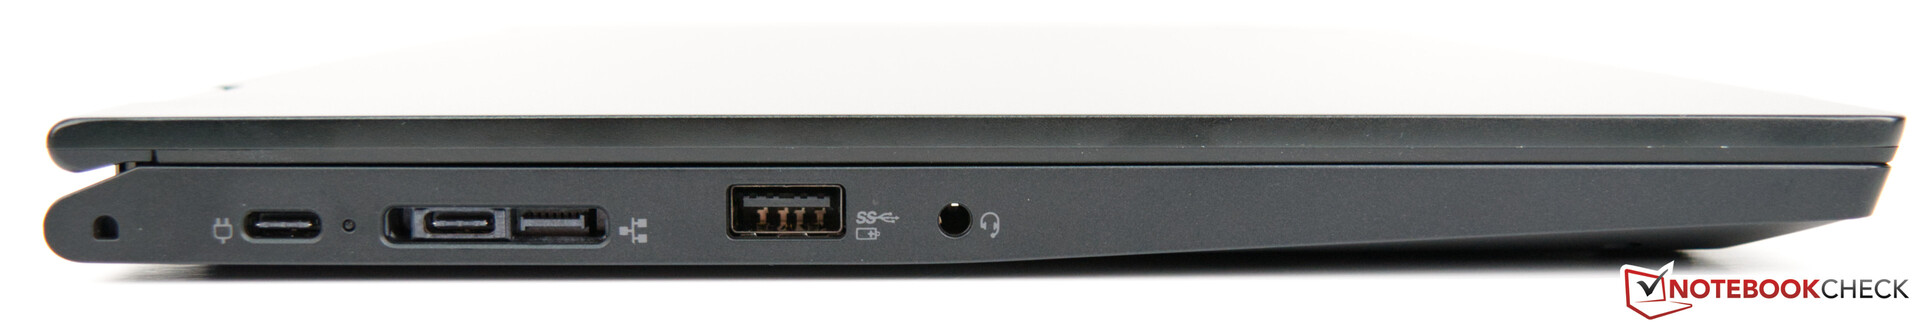
基本上,联想ThinkPad L13 Yoga是一款非常精良的商务翻转本,具有许多功能。对于商务设备来说,红外人脸识别,指纹扫描仪或智能卡读卡器是重要的选择。 ThinkPad L13 Yoga带来了所有这些优点,并将其组合在紧凑稳定的机身中。众所周知,L13 Yoga还提供了非常不错的键盘。ThinkPad Pen Pro也包含在内,更不要忘记36个月的保修期。
联想ThinkPad L13 Yoga以可接受的价格提供了不错的规格。
尽管有着优秀的测试成绩,但较低的PWM频率可能会使某些用户失望,因此有关屏幕的意见可能仍然两极分化。如果您对此没有任何问题,Lenovo ThinkPad L13 Yoga为用户提供了一台现代的翻转本,还可用于照片编辑。
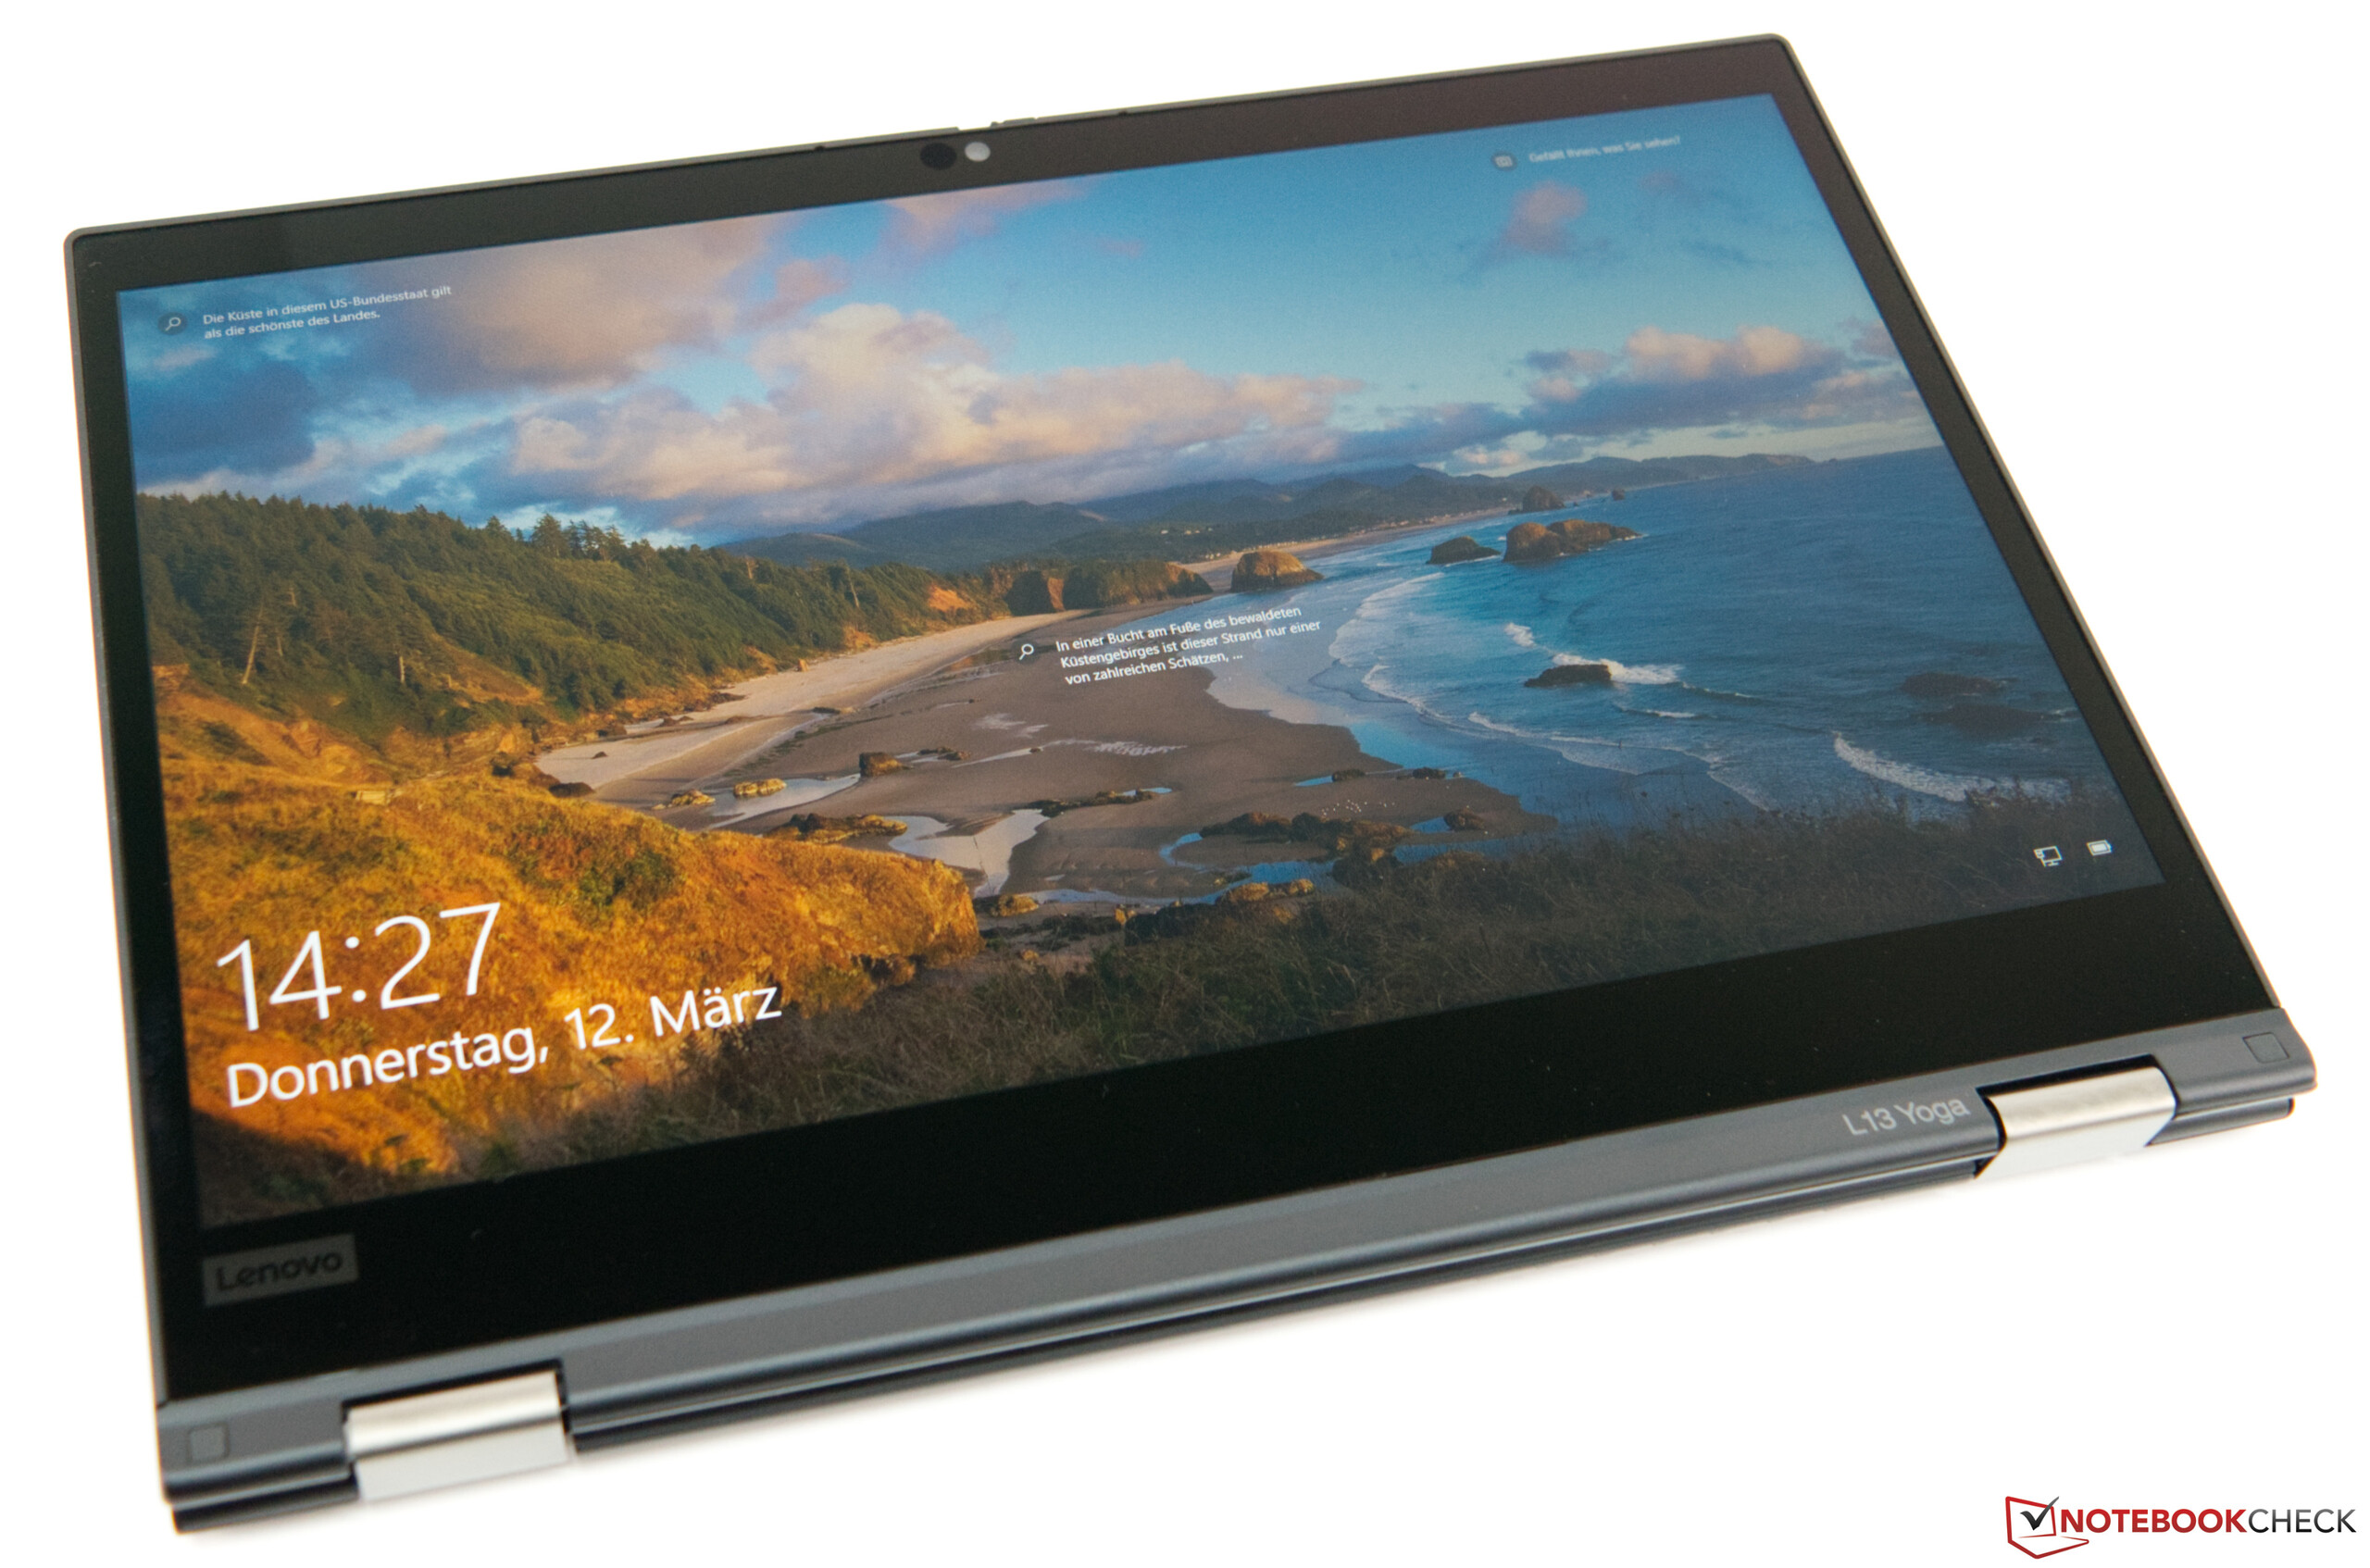
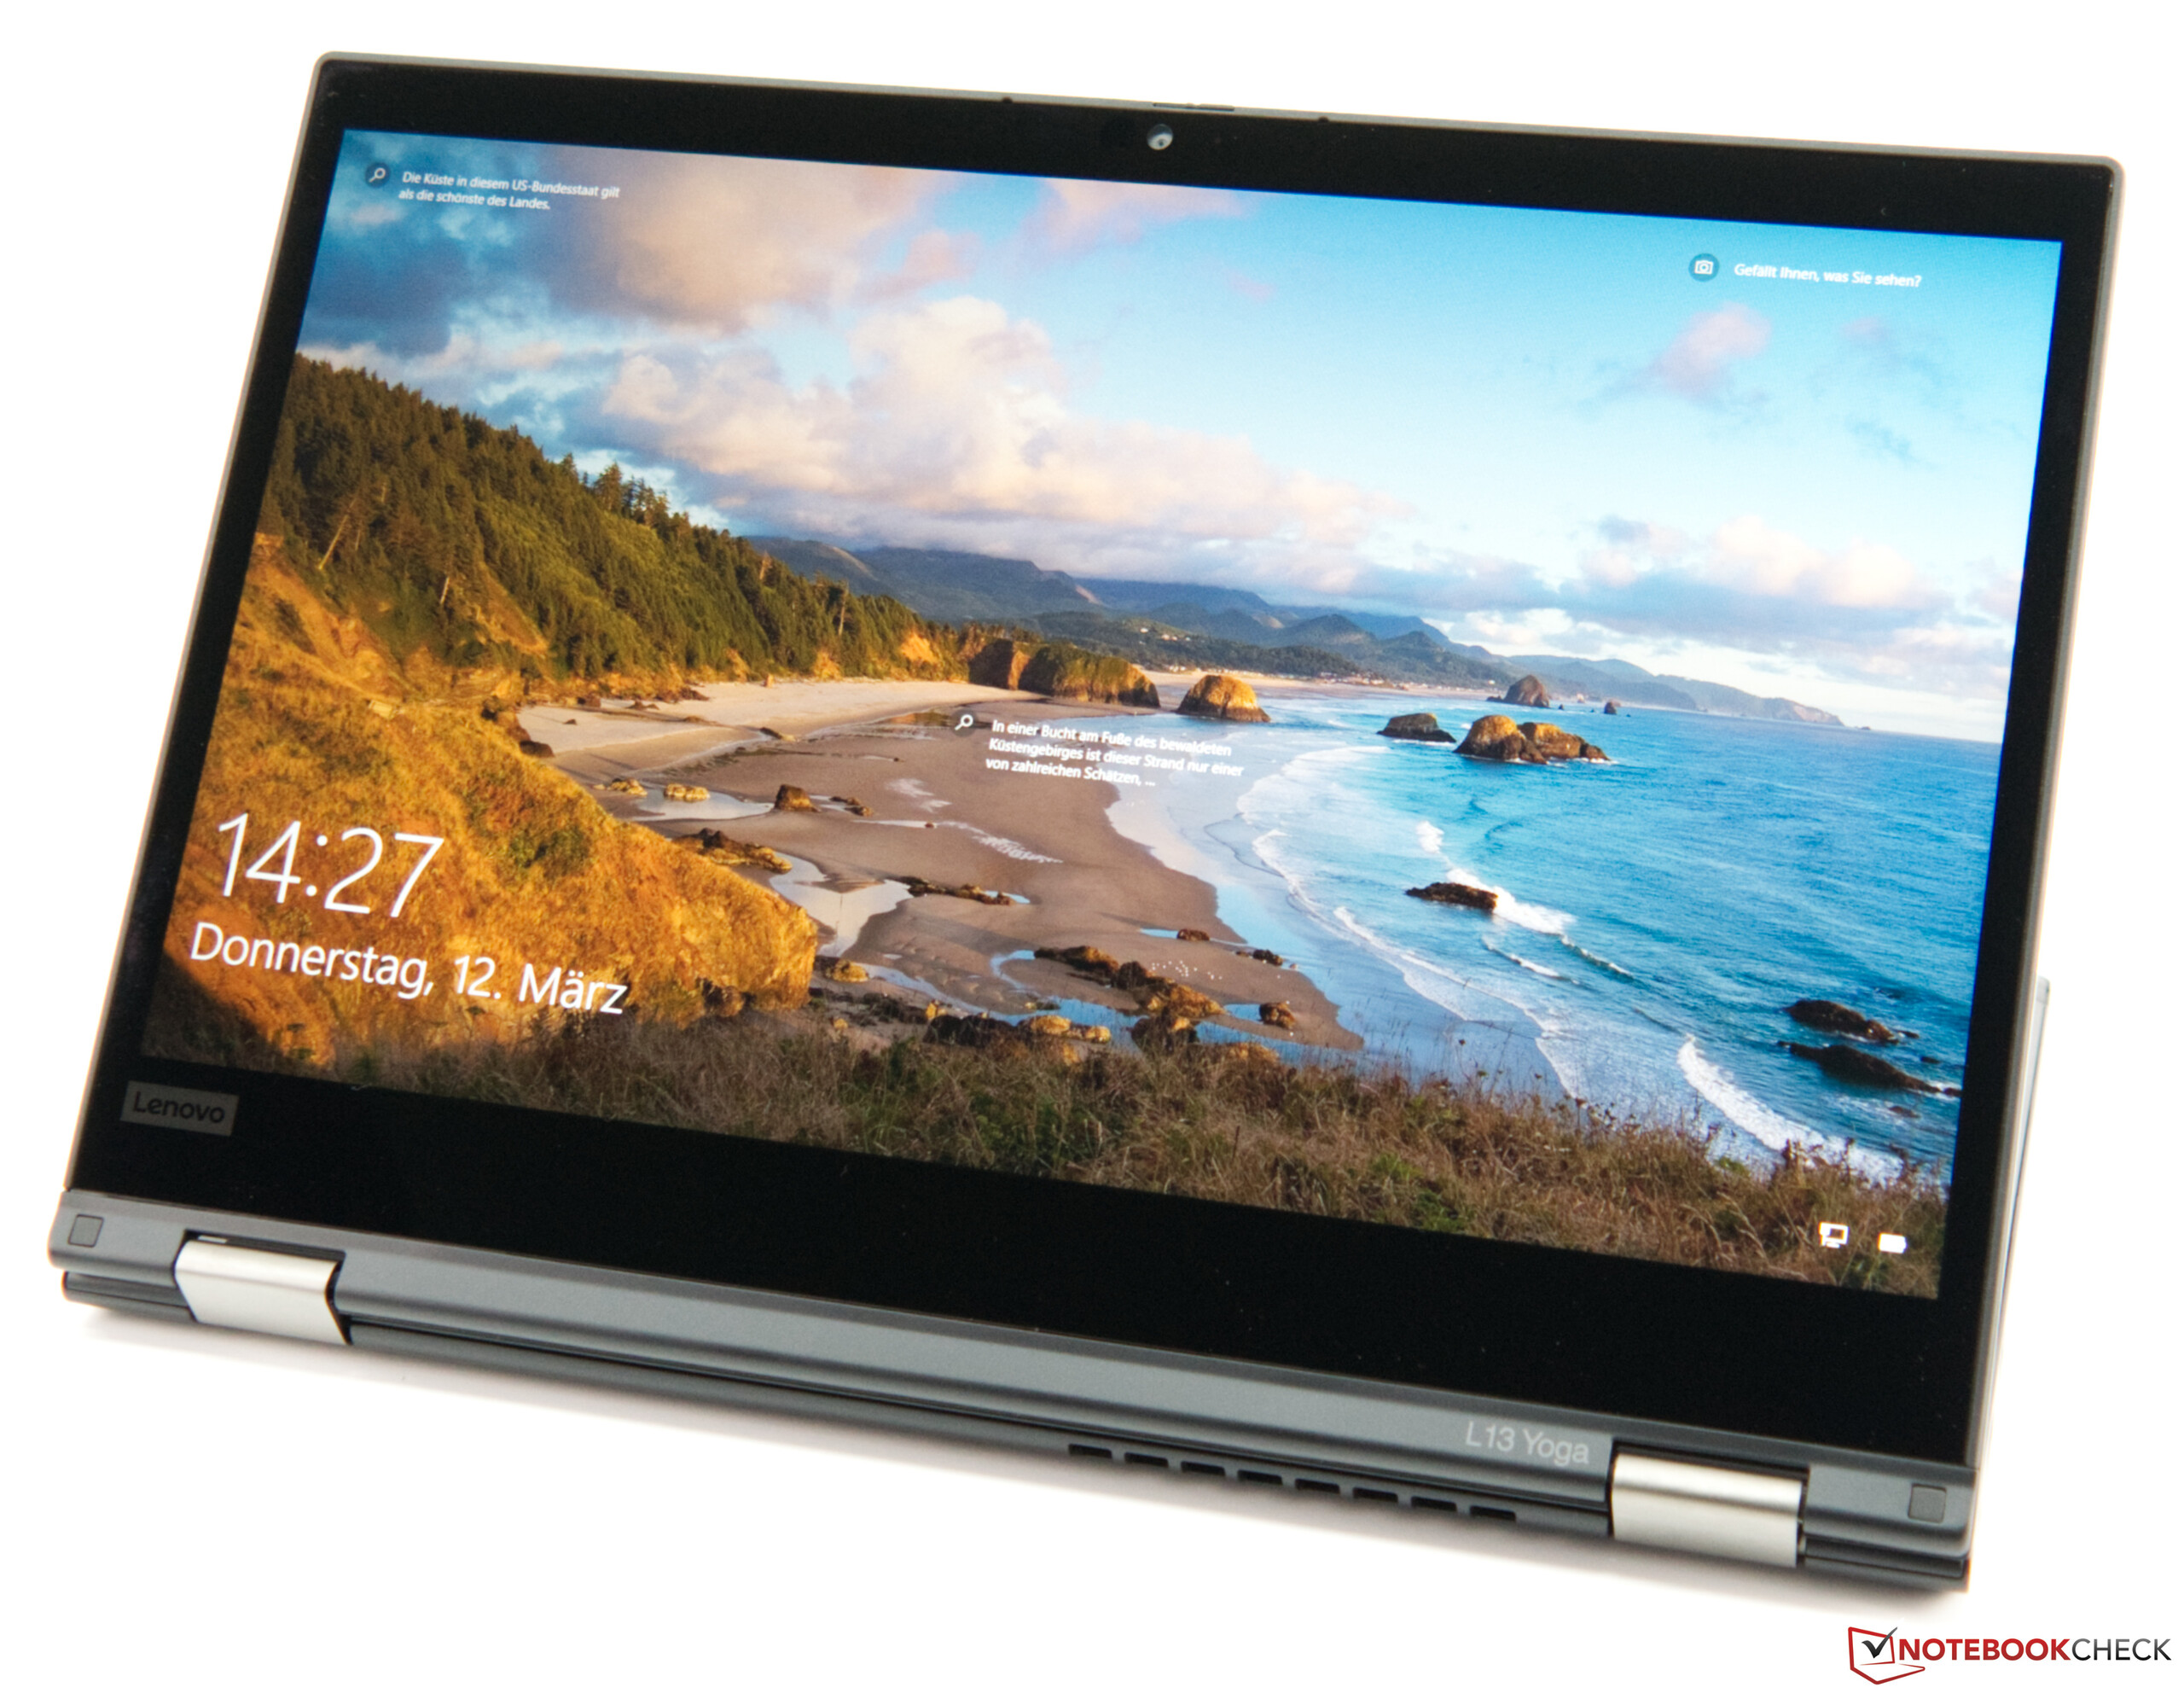
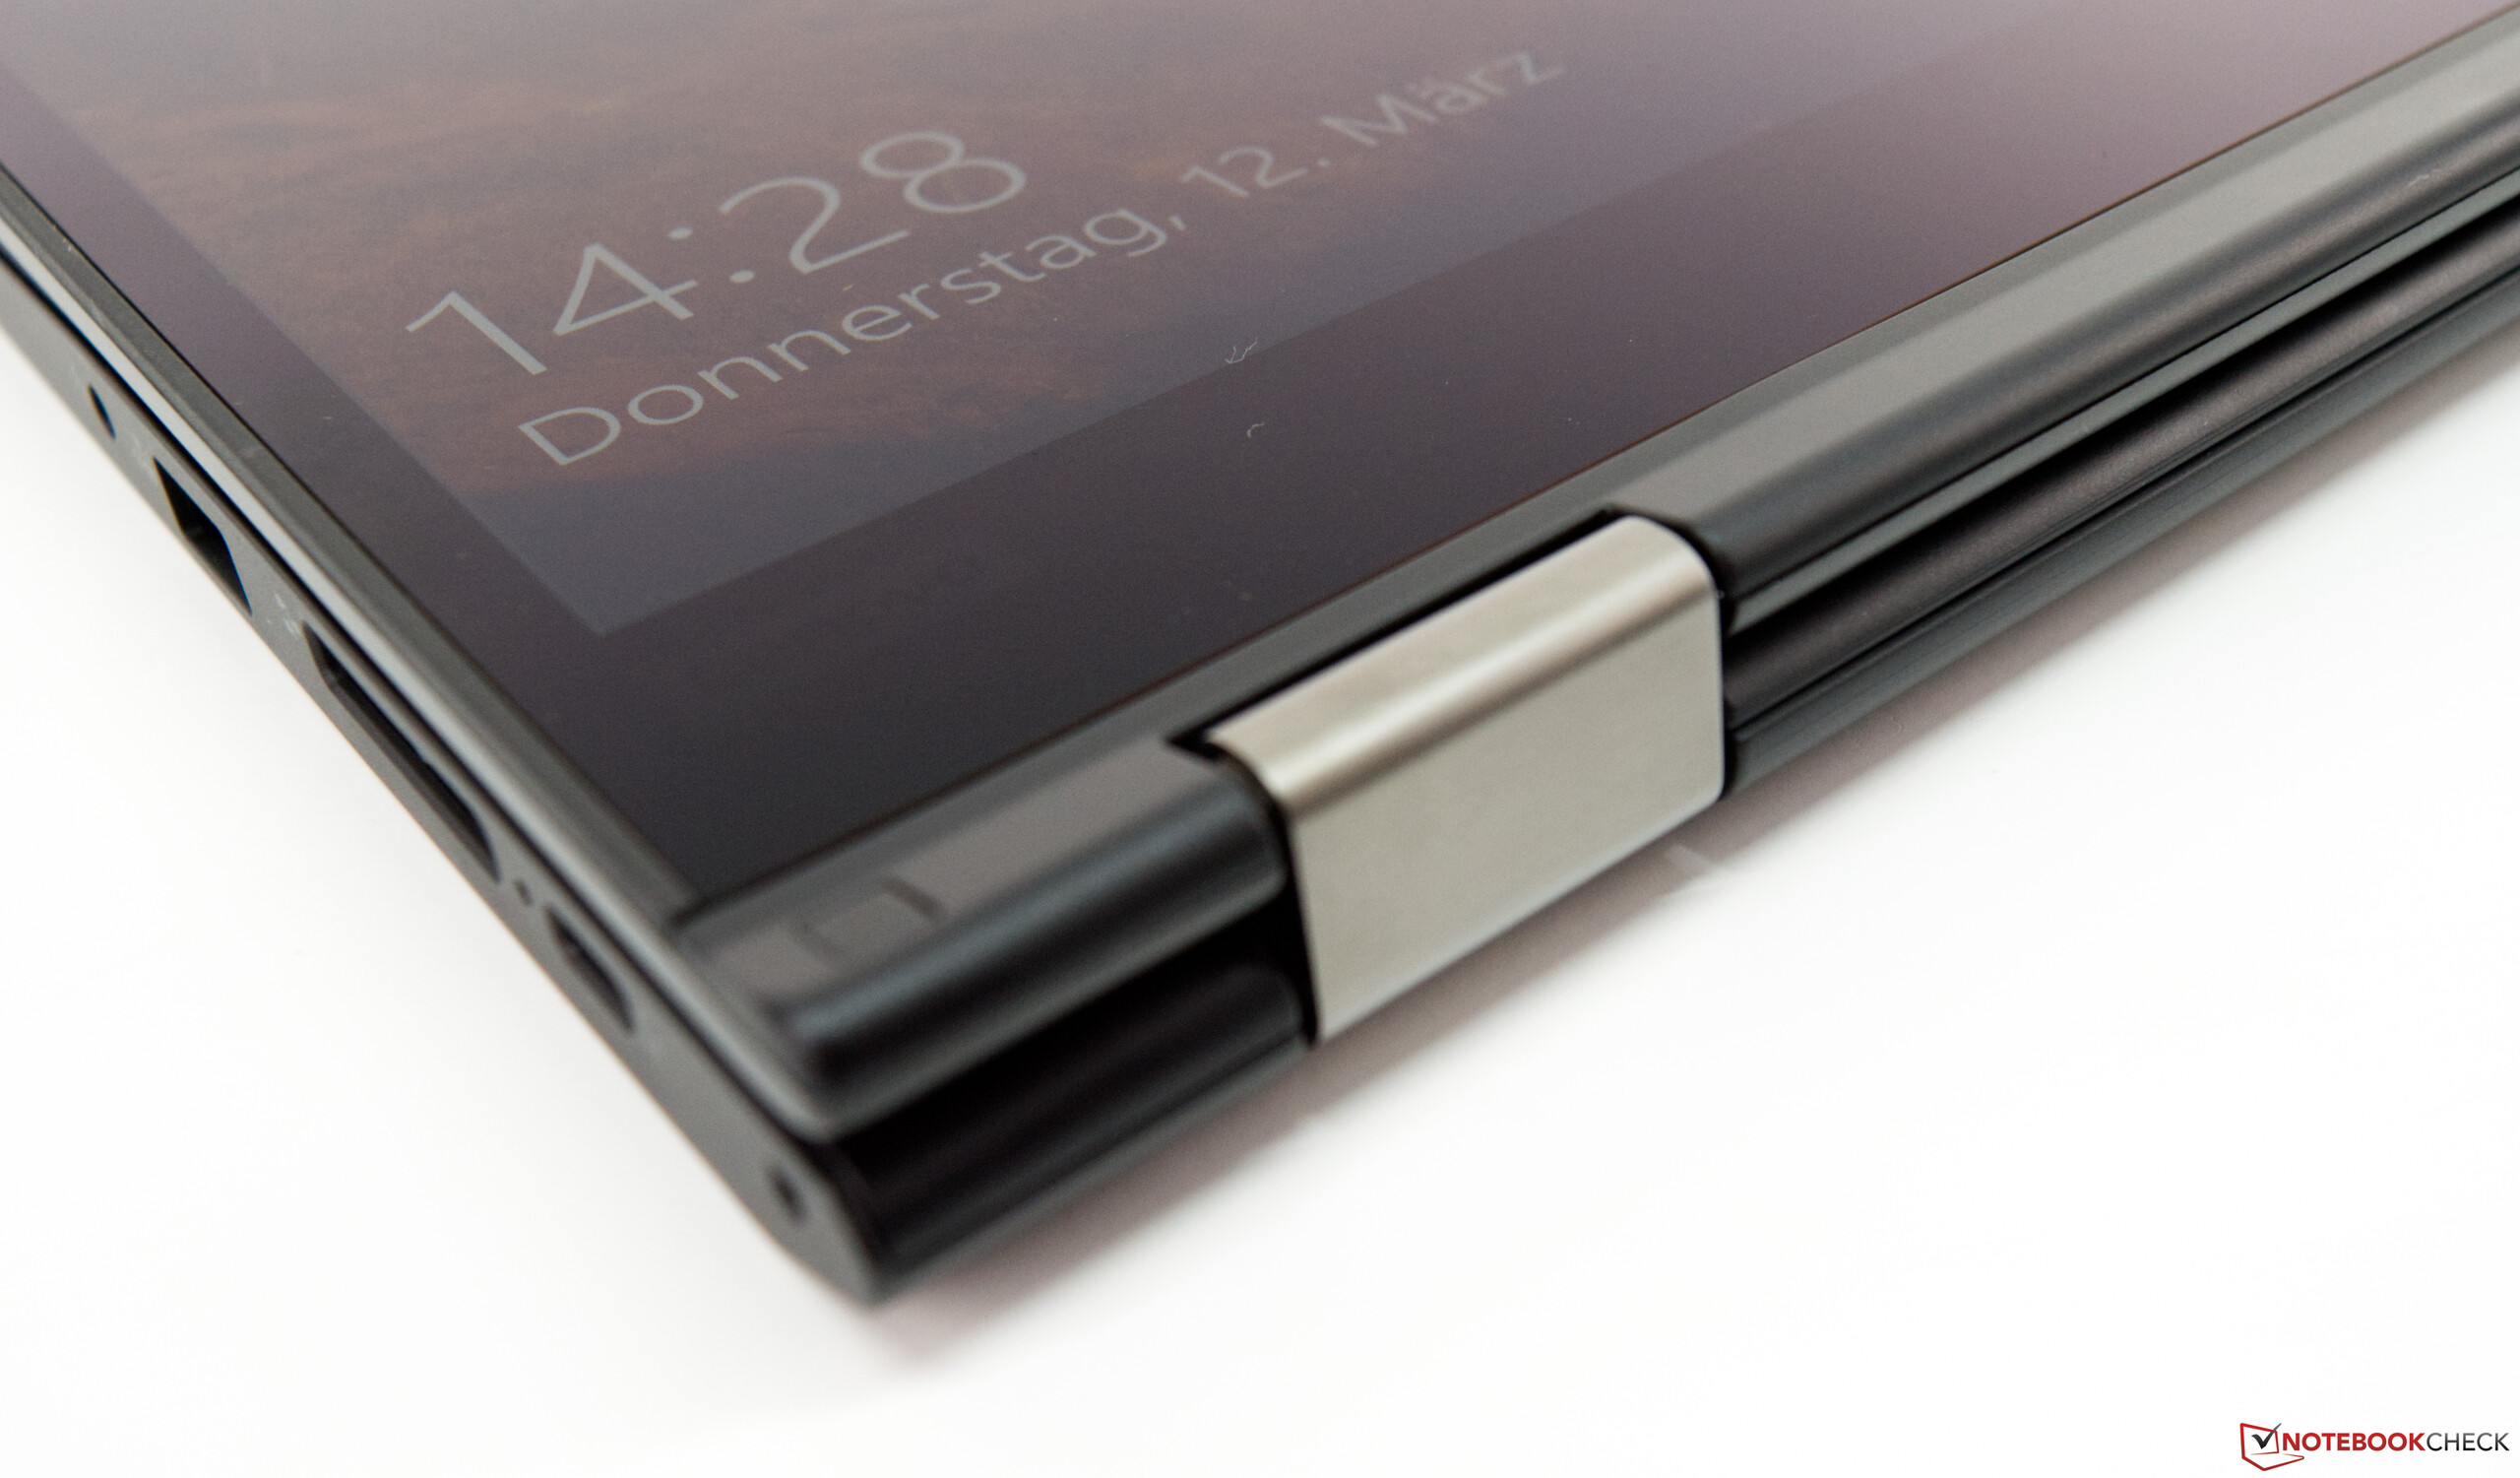
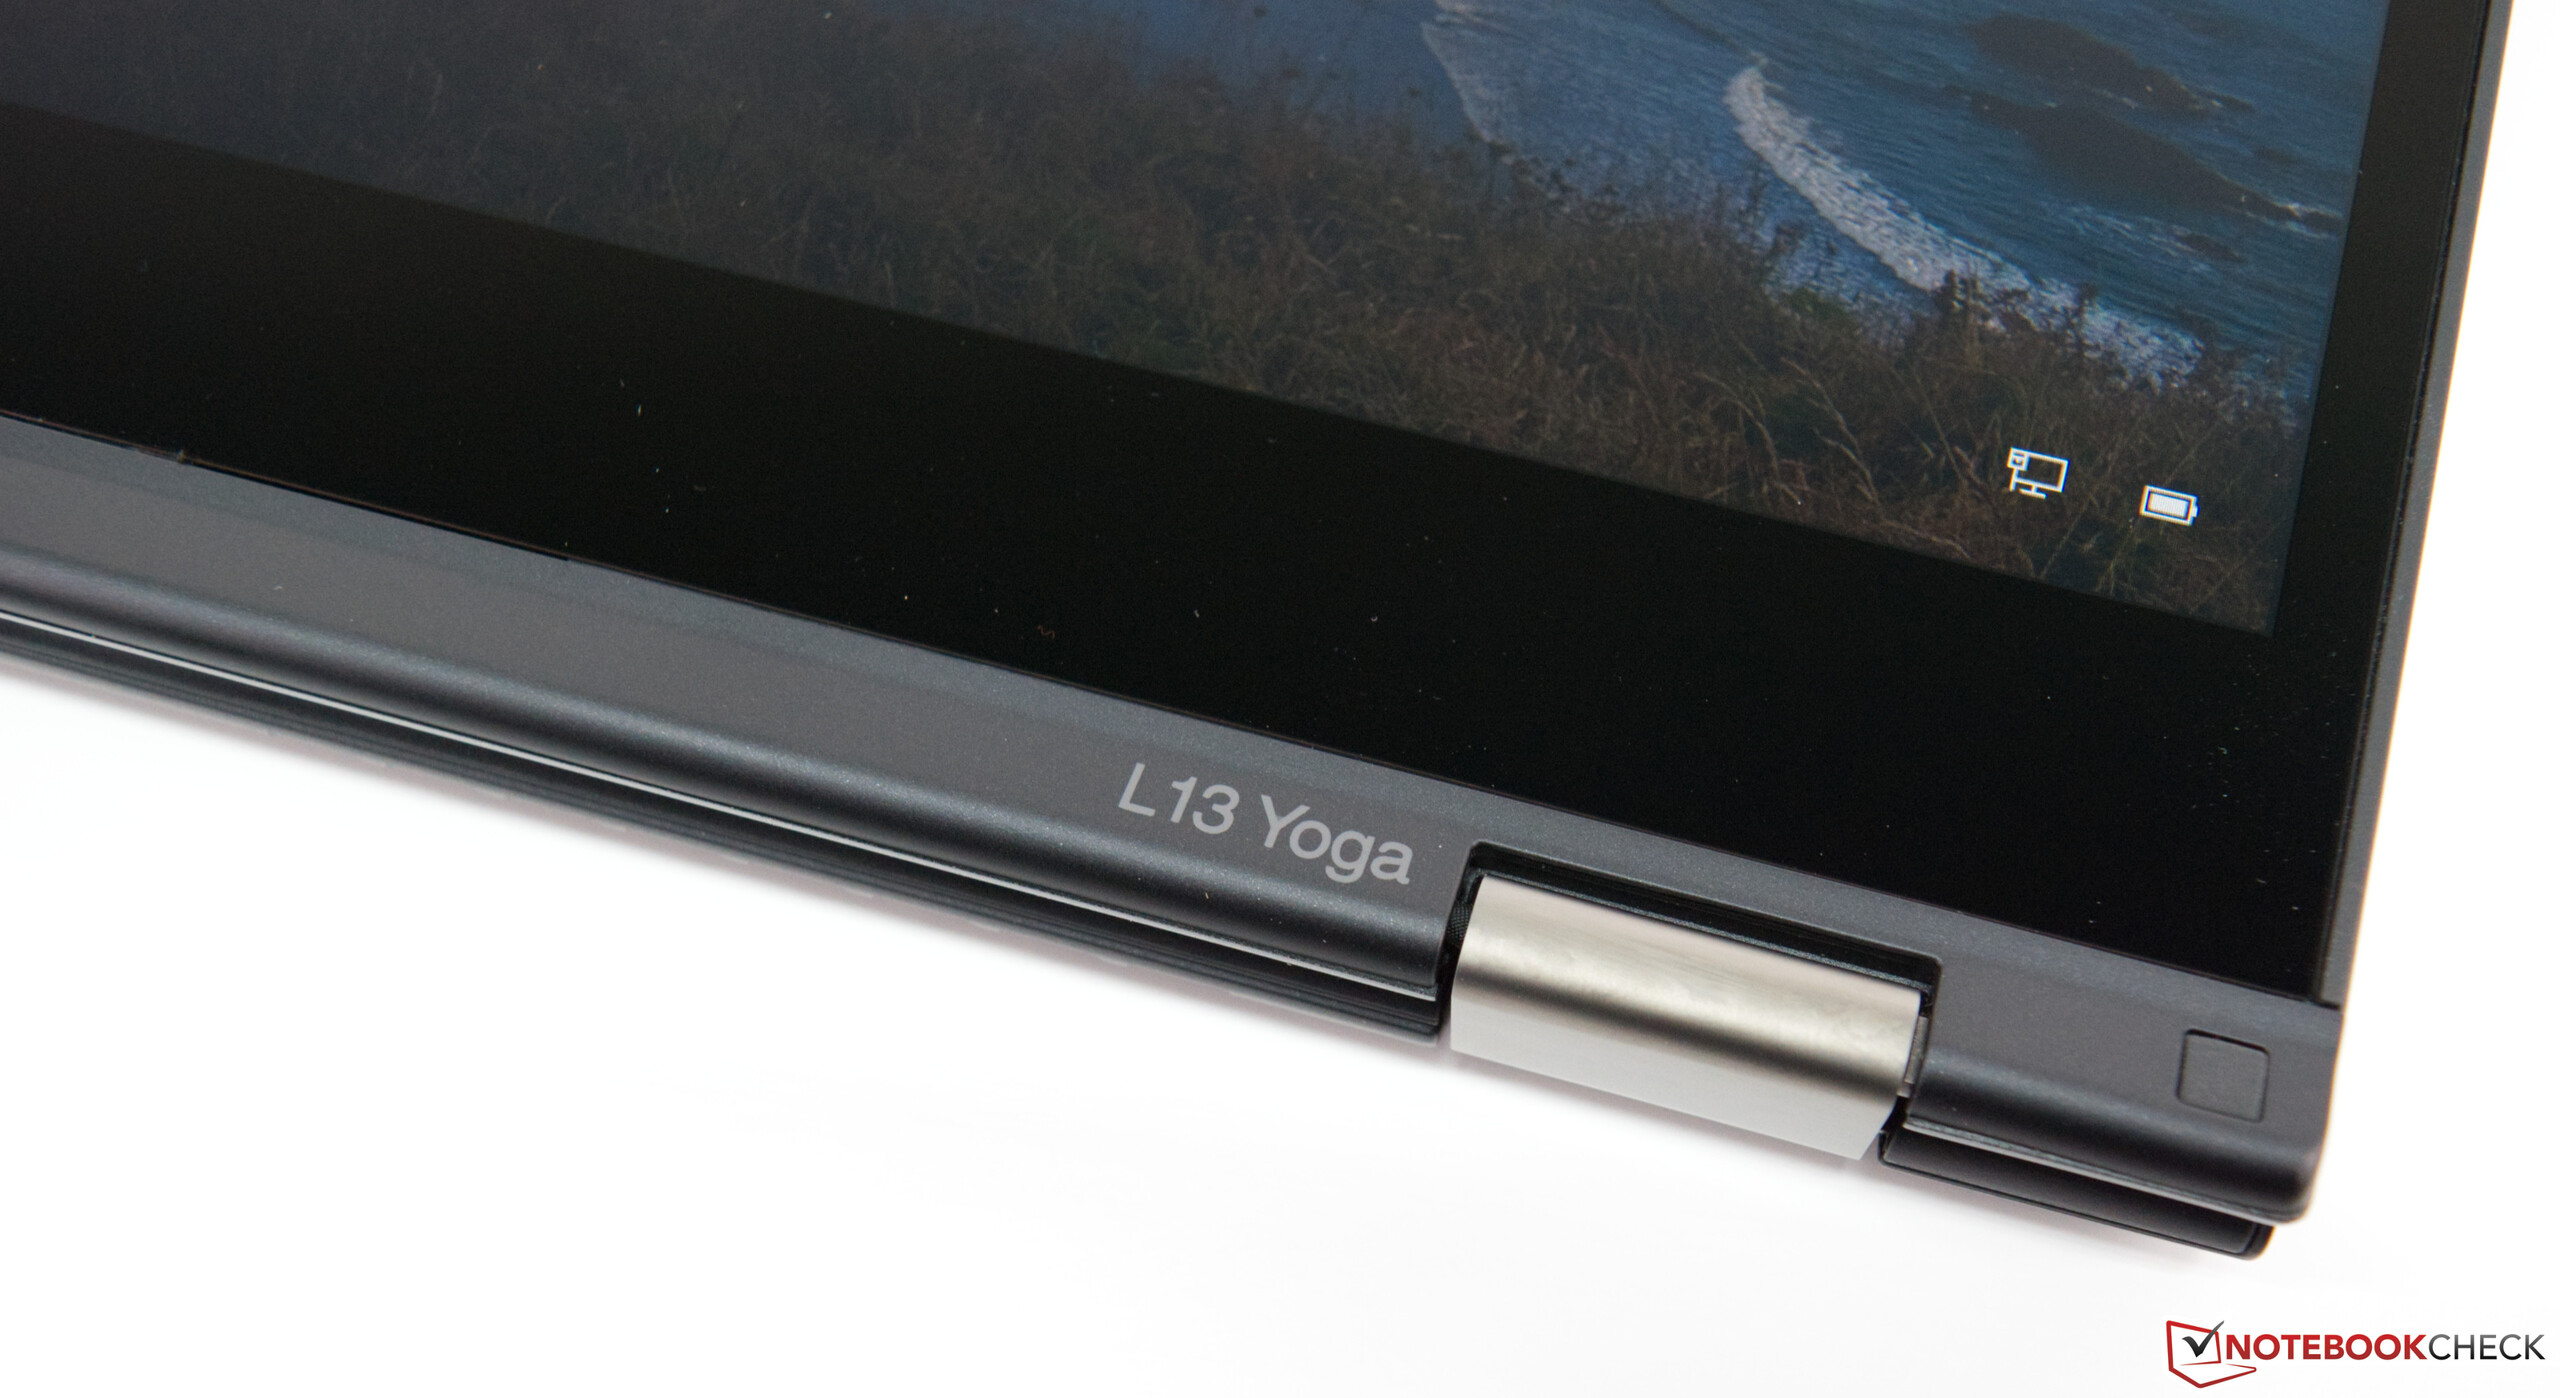
Lenovo ThinkPad L13 Yoga 20R6S00800
- 03/19/2020 v7 (old)
Sebastian Bade
Price comparison

