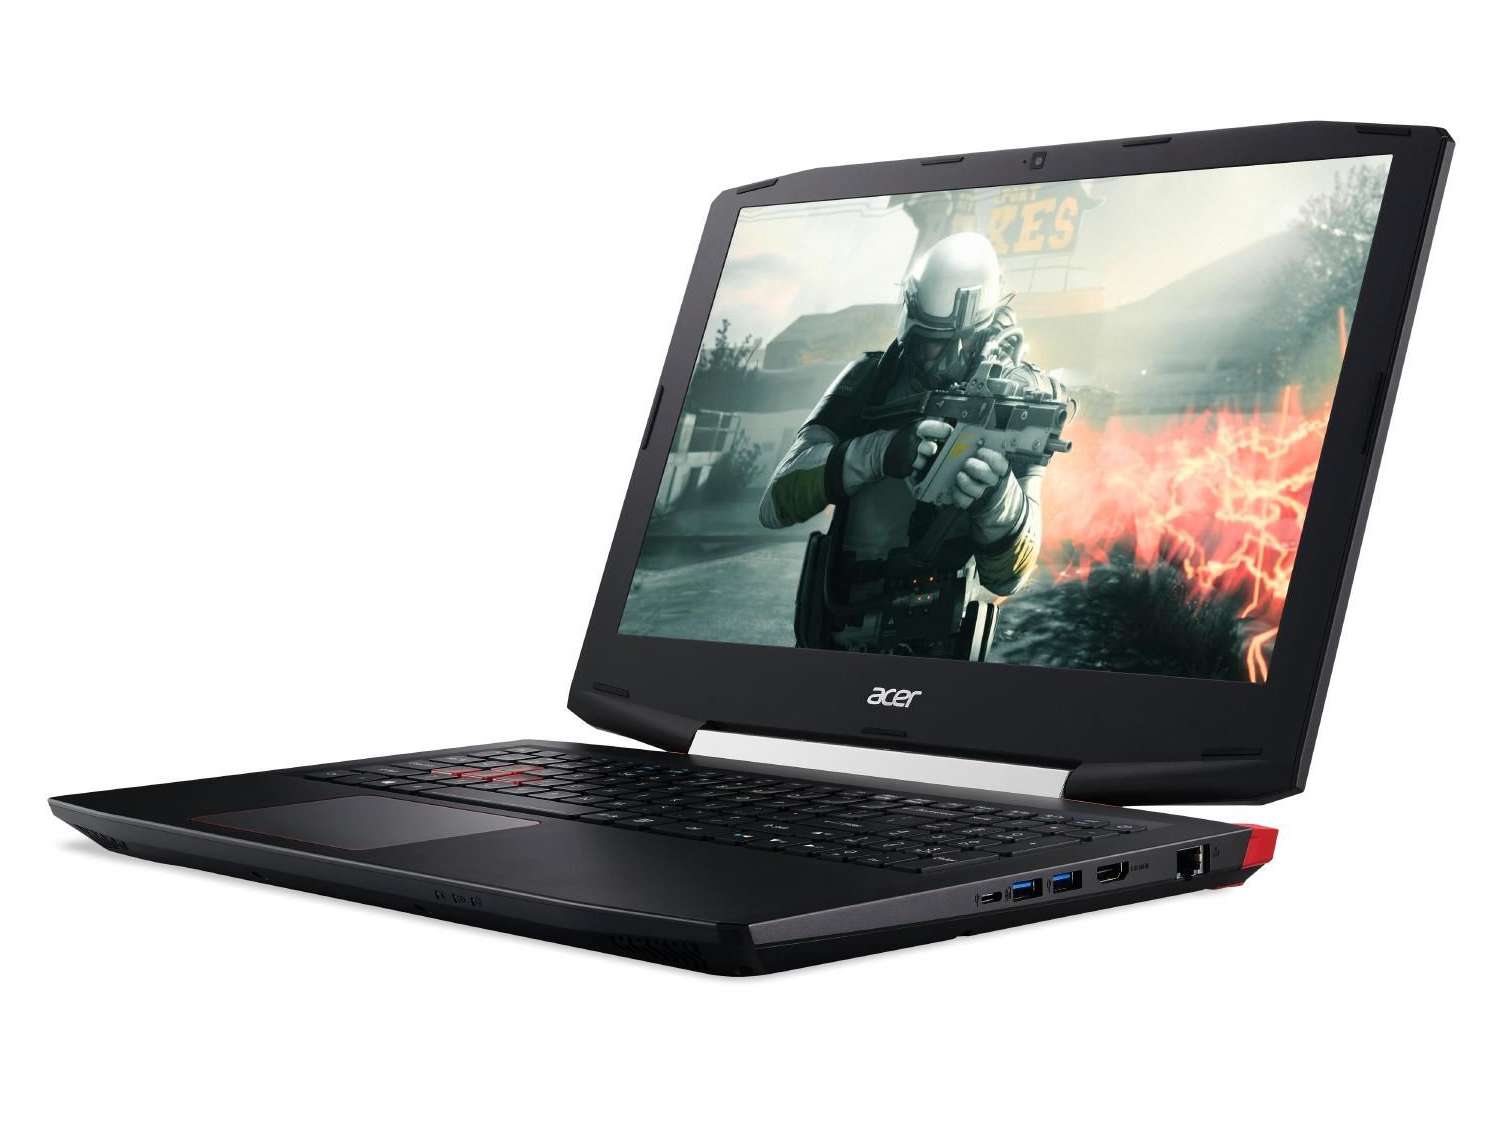
宏碁 Aspire VX 15 VX5-591G (7300HQ, GTX 1050, 全高清) 笔记本电脑简短评测
| SD Card Reader | |
| average JPG Copy Test (av. of 3 runs) | |
| Asus FX553VD-DM249T | |
| HP Omen 15-ax007ng | |
| HP Pavilion 15t-X7P42AV | |
| Acer Aspire VX15 VX5-591G-589S | |
| Acer Aspire VX5-591G-75C4 VX15 | |
| Dell Inspiron 15 7000 7567 | |
| maximum AS SSD Seq Read Test (1GB) | |
| HP Pavilion 15t-X7P42AV | |
| Asus FX553VD-DM249T | |
| HP Omen 15-ax007ng | |
| Acer Aspire VX5-591G-75C4 VX15 | |
| Dell Inspiron 15 7000 7567 | |
| Acer Aspire VX15 VX5-591G-589S | |
| Networking | |
| iperf3 transmit AX12 | |
| Asus FX553VD-DM249T | |
| Acer Aspire VX5-591G-75C4 VX15 | |
| Acer Aspire VX15 VX5-591G-589S | |
| HP Pavilion 15t-X7P42AV | |
| Dell Inspiron 15 7000 7567 (jseb) | |
| iperf3 receive AX12 | |
| Acer Aspire VX15 VX5-591G-589S | |
| HP Pavilion 15t-X7P42AV | |
| Acer Aspire VX5-591G-75C4 VX15 | |
| Asus FX553VD-DM249T | |
| Dell Inspiron 15 7000 7567 (jseb) | |
| |||||||||||||||||||||||||
Brightness Distribution: 91 %
Center on Battery: 281 cd/m²
Contrast: 1065:1 (Black: 0.26 cd/m²)
ΔE ColorChecker Calman: 5.05 | ∀{0.5-29.43 Ø4.73}
ΔE Greyscale Calman: 2.97 | ∀{0.09-98 Ø4.97}
59% sRGB (Argyll 1.6.3 3D)
38% AdobeRGB 1998 (Argyll 1.6.3 3D)
41.9% AdobeRGB 1998 (Argyll 3D)
59.4% sRGB (Argyll 3D)
40.56% Display P3 (Argyll 3D)
Gamma: 2.39
CCT: 6466 K
| Acer Aspire VX15 VX5-591G-589S IPS, 1920x1080, 15.6" | Acer Aspire VX5-591G-75C4 VX15 IPS, 1920x1080, 15.6" | Asus FX553VD-DM249T TN, 1920x1080, 15.6" | Dell Inspiron 15 7000 7567 TN, 1920x1080, 15.6" | HP Omen 15-ax007ng IPS, 1920x1080, 15.6" | HP Pavilion 15t-X7P42AV IPS, 1920x1080, 15.6" | |
|---|---|---|---|---|---|---|
| Display | -3% | -5% | -9% | 24% | -6% | |
| Display P3 Coverage (%) | 40.56 | 38.88 -4% | 37.98 -6% | 36.42 -10% | 59.9 48% 40.34 -1% | 38.03 -6% |
| sRGB Coverage (%) | 59.4 | 58.2 -2% | 57.1 -4% | 54.9 -8% | 85.9 45% 60.3 2% | 56.5 -5% |
| AdobeRGB 1998 Coverage (%) | 41.9 | 40.2 -4% | 39.24 -6% | 37.62 -10% | 61.6 47% 41.73 0% | 39.29 -6% |
| Response Times | 42% | 38% | 8% | -6% | 12% | |
| Response Time Grey 50% / Grey 80% * (ms) | 46 ? | 22 ? 52% | 43 ? 7% | 36 ? 22% | 55 ? -20% | 44.4 ? 3% |
| Response Time Black / White * (ms) | 34 ? | 23 ? 32% | 11 ? 68% | 36 ? -6% | 31 ? 9% | 27.2 ? 20% |
| PWM Frequency (Hz) | 20000 ? | |||||
| Screen | -11% | -12% | -80% | -25% | -41% | |
| Brightness middle (cd/m²) | 277 | 281 1% | 225 -19% | 246 -11% | 214 -23% | 209.7 -24% |
| Brightness (cd/m²) | 268 | 257 -4% | 215 -20% | 235 -12% | 203 -24% | 193 -28% |
| Brightness Distribution (%) | 91 | 85 -7% | 91 0% | 75 -18% | 79 -13% | 75 -18% |
| Black Level * (cd/m²) | 0.26 | 0.32 -23% | 0.46 -77% | 0.55 -112% | 0.28 -8% | 0.19 27% |
| Contrast (:1) | 1065 | 878 -18% | 489 -54% | 447 -58% | 764 -28% | 1104 4% |
| Colorchecker dE 2000 * | 5.05 | 5.16 -2% | 3.94 22% | 10.97 -117% | 6.04 -20% | 7.8 -54% |
| Colorchecker dE 2000 max. * | 8.93 | 9.09 -2% | 6.83 24% | 12 -34% | 24.1 -170% | |
| Greyscale dE 2000 * | 2.97 | 4.57 -54% | 2.68 10% | 14.25 -380% | 5.91 -99% | 7.3 -146% |
| Gamma | 2.39 92% | 2.59 85% | 2.35 94% | 1.83 120% | 2.44 90% | 2.39 92% |
| CCT | 6466 101% | 6931 94% | 6709 97% | 11200 58% | 7362 88% | 5771 113% |
| Color Space (Percent of AdobeRGB 1998) (%) | 38 | 37 -3% | 36 -5% | 35 -8% | 38 0% | 39.3 3% |
| Color Space (Percent of sRGB) (%) | 59 | 58 -2% | 57 -3% | 55 -7% | 60 2% | 56.5 -4% |
| Total Average (Program / Settings) | 9% /
-3% | 7% /
-4% | -27% /
-53% | -2% /
-7% | -12% /
-27% |
* ... smaller is better
Screen Flickering / PWM (Pulse-Width Modulation)
| Screen flickering / PWM detected | 20000 Hz | ≤ 90 % brightness setting | 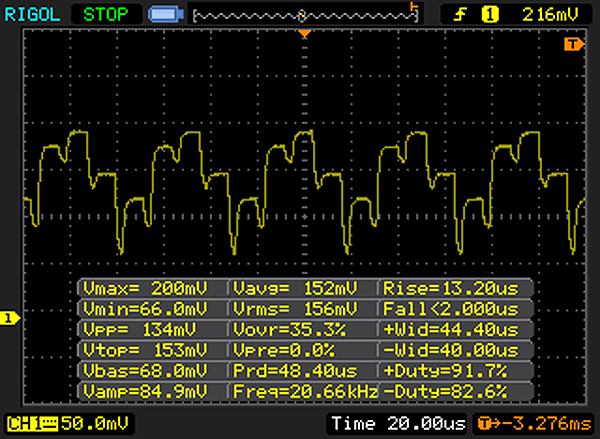 |
The display backlight flickers at 20000 Hz (worst case, e.g., utilizing PWM) Flickering detected at a brightness setting of 90 % and below. There should be no flickering or PWM above this brightness setting. The frequency of 20000 Hz is quite high, so most users sensitive to PWM should not notice any flickering. In comparison: 52 % of all tested devices do not use PWM to dim the display. If PWM was detected, an average of 7784 (minimum: 5 - maximum: 343500) Hz was measured. | |||
Display Response Times
| ↔ Response Time Black to White | ||
|---|---|---|
| 34 ms ... rise ↗ and fall ↘ combined | ↗ 20 ms rise |  |
| ↘ 14 ms fall | ||
| The screen shows slow response rates in our tests and will be unsatisfactory for gamers. In comparison, all tested devices range from 0.1 (minimum) to 240 (maximum) ms. » 91 % of all devices are better. This means that the measured response time is worse than the average of all tested devices (19.9 ms). | ||
| ↔ Response Time 50% Grey to 80% Grey | ||
| 46 ms ... rise ↗ and fall ↘ combined | ↗ 25 ms rise | 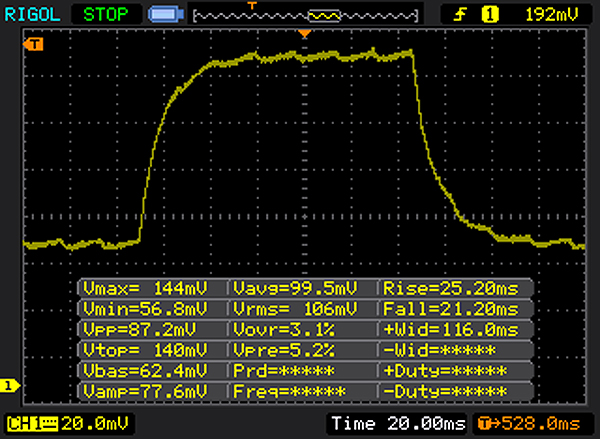 |
| ↘ 21 ms fall | ||
| The screen shows slow response rates in our tests and will be unsatisfactory for gamers. In comparison, all tested devices range from 0.165 (minimum) to 636 (maximum) ms. » 79 % of all devices are better. This means that the measured response time is worse than the average of all tested devices (31.1 ms). | ||
| Cinebench R10 | |
| Rendering Multiple CPUs 32Bit | |
| Asus FX553VD-DM249T | |
| HP Pavilion 15t-X7P42AV | |
| Acer Aspire VX15 VX5-591G-589S | |
| Rendering Single 32Bit | |
| Asus FX553VD-DM249T | |
| HP Pavilion 15t-X7P42AV | |
| Acer Aspire VX15 VX5-591G-589S | |
| Geekbench 3 | |
| 32 Bit Multi-Core Score | |
| Acer Aspire VX15 VX5-591G-589S | |
| 32 Bit Single-Core Score | |
| Acer Aspire VX15 VX5-591G-589S | |
| Geekbench 4.0 | |
| 64 Bit Multi-Core Score | |
| Acer Aspire VX15 VX5-591G-589S | |
| 64 Bit Single-Core Score | |
| Acer Aspire VX15 VX5-591G-589S | |
| Geekbench 4.4 | |
| 64 Bit Multi-Core Score | |
| Acer Aspire VX15 VX5-591G-589S | |
| 64 Bit Single-Core Score | |
| Acer Aspire VX15 VX5-591G-589S | |
| JetStream 1.1 - 1.1 Total | |
| HP Pavilion 15t-X7P42AV | |
| Dell Inspiron 15 7000 7567 | |
| Acer Aspire VX15 VX5-591G-589S | |
| PCMark 8 Home Score Accelerated v2 | 3661 points | |
Help | ||
| PCMark 8 - Home Score Accelerated v2 | |
| HP Pavilion 15t-X7P42AV | |
| HP Omen 15-ax007ng | |
| Dell Inspiron 15 7000 7567 | |
| Asus FX553VD-DM249T | |
| Acer Aspire VX15 VX5-591G-589S | |
| Dell XPS 15 2017 9560 (7300HQ, Full-HD) | |
| Acer Aspire VX5-591G-75C4 VX15 | |

| Acer Aspire VX15 VX5-591G-589S Hynix HFS128G39TND | Acer Aspire VX5-591G-75C4 VX15 Toshiba MQ01ABD100 | Asus FX553VD-DM249T Hynix HFS128G39TND | Dell Inspiron 15 7000 7567 Intel SSDSCKKF256H6 | HP Omen 15-ax007ng Adata IM2S3138E-128GM-B | HP Pavilion 15t-X7P42AV Samsung CM871a MZNTY128HDHP | |
|---|---|---|---|---|---|---|
| CrystalDiskMark 3.0 | -84% | -7% | 42% | -0% | 35% | |
| Read Seq (MB/s) | 510 | 101.5 -80% | 504 -1% | 485.8 -5% | 475.7 -7% | 522 2% |
| Write Seq (MB/s) | 137.6 | 100.6 -27% | 136.2 -1% | 422.8 207% | 169.2 23% | 476.6 246% |
| Read 512 (MB/s) | 362.1 | 28.33 -92% | 340.9 -6% | 338.9 -6% | 327.6 -10% | 399.7 10% |
| Write 512 (MB/s) | 137.2 | 28.31 -79% | 136.9 0% | 304 122% | 169.6 24% | 185.4 35% |
| Read 4k (MB/s) | 35.18 | 0.327 -99% | 29.74 -15% | 27.11 -23% | 33.14 -6% | 33.12 -6% |
| Write 4k (MB/s) | 104.8 | 0.846 -99% | 76.8 -27% | 85.4 -19% | 81.4 -22% | 89.8 -14% |
| Read 4k QD32 (MB/s) | 375.8 | 0.718 -100% | 348.2 -7% | 279.6 -26% | 276.8 -26% | 400.9 7% |
| Write 4k QD32 (MB/s) | 138.1 | 0.893 -99% | 136.4 -1% | 255.1 85% | 168 22% | 140.2 2% |
| 3DMark 11 Performance | 7226 points | |
Help | ||
| low | med. | high | ultra | |
|---|---|---|---|---|
| BioShock Infinite (2013) | 206.5 | 160 | 147.5 | 63.6 |
| Mad Max (2015) | 140.4 | 70.1 | 64.3 | |
| Rainbow Six Siege (2015) | 185.2 | 139.7 | 76.4 | 63.6 |
| Just Cause 3 (2015) | 78.6 | 67.1 | 48.3 | 32.2 |
| XCOM 2 (2016) | 78.9 | 42.6 | 28.9 | 13.8 |
| Far Cry Primal (2016) | 90 | 49 | 43 | 31 |
| Resident Evil 7 (2017) | 216.5 | 100.3 | 56.6 | 21.4 |
| For Honor (2017) | 146.8 | 60.1 | 57 | 40.6 |
| Ghost Recon Wildlands (2017) | 81.8 | 36 | 34.4 | 18.5 |
| Mass Effect Andromeda (2017) | 75.7 | 41.5 | 26.4 | 24 |
| Warhammer 40.000: Dawn of War III (2017) | 81 | 36.5 | 23.2 | 20.2 |
| Prey (2017) | 125.2 | 82.5 | 68.1 | 53 |
| BioShock Infinite - 1920x1080 Ultra Preset, DX11 (DDOF) | |
| Dell Inspiron 15 7000 7567 | |
| HP Pavilion 15t-X7P42AV | |
| Acer Aspire VX15 VX5-591G-589S | |
| Lenovo Ideapad Y700 15ISK 80NV | |
Noise level
| Idle |
| 30 / 30 / 31.1 dB(A) |
| HDD |
| 31.2 dB(A) |
| Load |
| 31.3 / 38.9 dB(A) |
 | ||
30 dB silent 40 dB(A) audible 50 dB(A) loud |
||
min: | ||
(-) The maximum temperature on the upper side is 47.2 °C / 117 F, compared to the average of 40.4 °C / 105 F, ranging from 21.2 to 68.8 °C for the class Gaming.
(±) The bottom heats up to a maximum of 42.2 °C / 108 F, compared to the average of 43.2 °C / 110 F
(+) In idle usage, the average temperature for the upper side is 27.2 °C / 81 F, compared to the device average of 33.9 °C / 93 F.
(+) The palmrests and touchpad are reaching skin temperature as a maximum (32.2 °C / 90 F) and are therefore not hot.
(-) The average temperature of the palmrest area of similar devices was 28.8 °C / 83.8 F (-3.4 °C / -6.2 F).
Acer Aspire VX15 VX5-591G-589S audio analysis
(-) | not very loud speakers (69 dB)
Bass 100 - 315 Hz
(±) | reduced bass - on average 8.1% lower than median
(+) | bass is linear (6.6% delta to prev. frequency)
Mids 400 - 2000 Hz
(+) | balanced mids - only 2.1% away from median
(+) | mids are linear (3.2% delta to prev. frequency)
Highs 2 - 16 kHz
(+) | balanced highs - only 3.8% away from median
(+) | highs are linear (6.5% delta to prev. frequency)
Overall 100 - 16.000 Hz
(+) | overall sound is linear (12.6% difference to median)
Compared to same class
» 16% of all tested devices in this class were better, 3% similar, 81% worse
» The best had a delta of 6%, average was 18%, worst was 132%
Compared to all devices tested
» 11% of all tested devices were better, 2% similar, 86% worse
» The best had a delta of 4%, average was 24%, worst was 134%
Apple MacBook 12 (Early 2016) 1.1 GHz audio analysis
(+) | speakers can play relatively loud (83.6 dB)
Bass 100 - 315 Hz
(±) | reduced bass - on average 11.3% lower than median
(±) | linearity of bass is average (14.2% delta to prev. frequency)
Mids 400 - 2000 Hz
(+) | balanced mids - only 2.4% away from median
(+) | mids are linear (5.5% delta to prev. frequency)
Highs 2 - 16 kHz
(+) | balanced highs - only 2% away from median
(+) | highs are linear (4.5% delta to prev. frequency)
Overall 100 - 16.000 Hz
(+) | overall sound is linear (10.2% difference to median)
Compared to same class
» 7% of all tested devices in this class were better, 2% similar, 91% worse
» The best had a delta of 5%, average was 18%, worst was 53%
Compared to all devices tested
» 5% of all tested devices were better, 1% similar, 94% worse
» The best had a delta of 4%, average was 24%, worst was 134%
| Off / Standby | |
| Idle | |
| Load |
|
Key:
min: | |
| Battery Runtime - WiFi Websurfing | |
| Dell Inspiron 15 7000 7567 | |
| HP Pavilion 15t-X7P42AV | |
| Asus FX553VD-DM249T | |
| Dell XPS 15 2017 9560 (7300HQ, Full-HD) | |
| Acer Aspire VX15 VX5-591G-589S | |
| Acer Aspire VX5-591G-75C4 VX15 | |
| HP Omen 15-ax007ng | |
Pros
Cons
宏碁这台入门级游戏本价格为799.99英镑(约合1035美元)。为此,您将获得一台15.6英寸的笔记本电脑,它配有强大的Kaby Lake四核处理器和GeForce GTX 1050图形处理器。配置足以在高分辨率和中高质量的设置下,顺利运行所有最新的电脑游戏。在一些(或少数)情况下,可能需要减少分辨率和/或质量设置。该设备在空转时安静,不发烫。即使在负荷下,温度也不会太高。
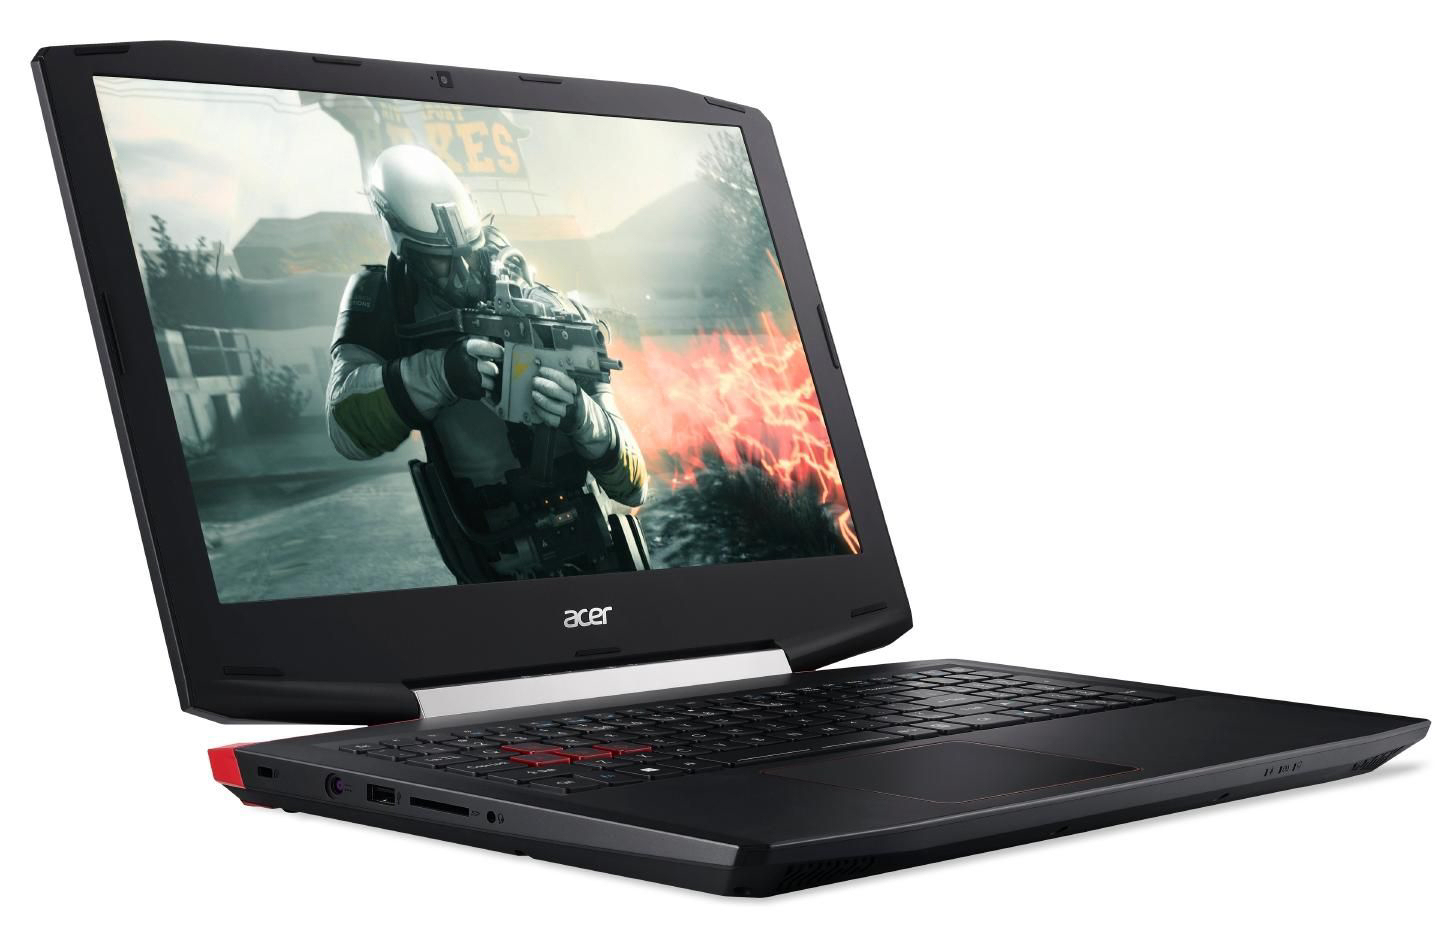
Aspire没有明显的缺点。以800英镑(约1035美元)的价格,获取一个配备精良的入门级设备 。它将为你打开游戏世界的大门。
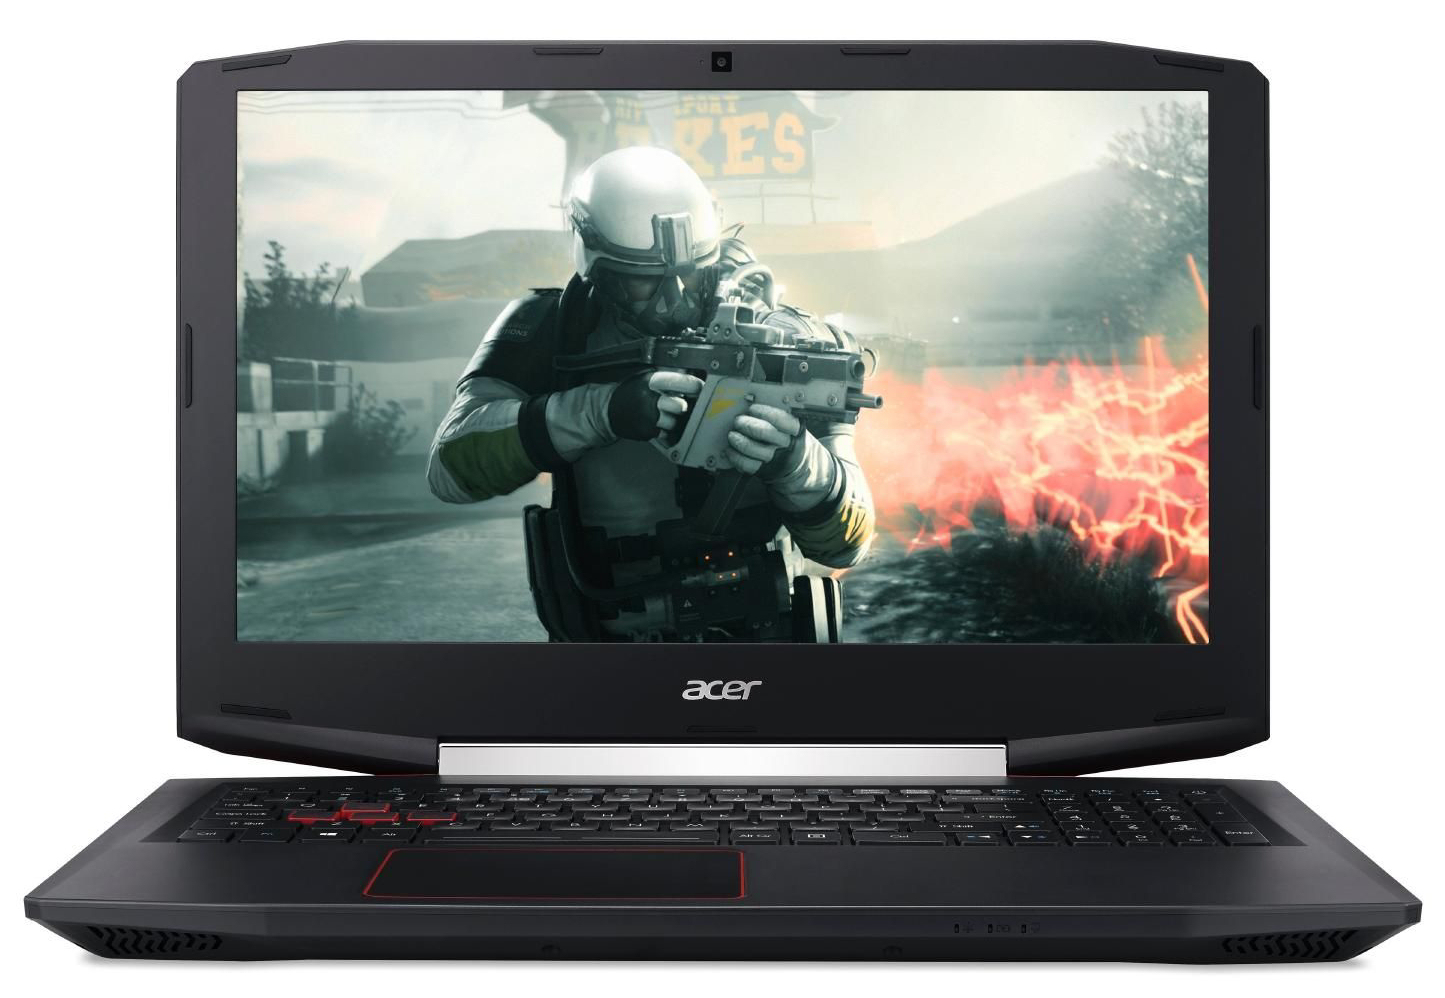
固态硬盘确保系统的快速运行。该设备同时提供了2.5英寸机械硬盘作为所需的存储空间。两块硬盘都是可更换的,得打开底盖 ——一个不太复杂的操作。哑光IPS显示屏具有稳定的视角和良好的对比度。亮度不错,但可以更好。
这台机器的德版没有Windows操作系统。通过升级Windows 7 / 8.1来获得Windows 10操作系统是便宜的方式。如果您使用旧版许可证(5到10英镑,约6到12美元)安装了两个早期的Windows版本的其中之一,那么您可以在 Microsoft's Media Creation Tool 的帮助下,升级到Windows 10。
注:本文是基于完整评测的缩减版本,阅读完整的英文评测,请点击这里。
Acer Aspire VX15 VX5-591G-589S
- 05/22/2017 v6 (old)
Sascha Mölck