华硕 FX553VD (7700HQ, GTX 1050) 笔记本简短评测
| SD Card Reader | |
| average JPG Copy Test (av. of 3 runs) | |
| Asus FX553VD-DM249T | |
| Asus FX502VM-AS73 | |
| HP Pavilion 15t-X7P42AV | |
| MSI GL62M 7RD-077 | |
| Acer Aspire VX5-591G-75C4 VX15 | |
| Dell Inspiron 15 7000 7567 | |
| maximum AS SSD Seq Read Test (1GB) | |
| HP Pavilion 15t-X7P42AV | |
| Asus FX553VD-DM249T | |
| Asus FX502VM-AS73 | |
| MSI GL62M 7RD-077 | |
| Acer Aspire VX5-591G-75C4 VX15 | |
| Dell Inspiron 15 7000 7567 | |
| Networking | |
| iperf3 transmit AX12 | |
| Asus FX553VD-DM249T | |
| Acer Aspire VX5-591G-75C4 VX15 | |
| HP Pavilion 15t-X7P42AV | |
| Asus FX502VM-AS73 | |
| MSI GL62M 7RD-077 (jseb) | |
| Dell Inspiron 15 7000 7567 (jseb) | |
| iperf3 receive AX12 | |
| HP Pavilion 15t-X7P42AV | |
| Asus FX502VM-AS73 | |
| Acer Aspire VX5-591G-75C4 VX15 | |
| Asus FX553VD-DM249T | |
| MSI GL62M 7RD-077 (jseb) | |
| Dell Inspiron 15 7000 7567 (jseb) | |
| |||||||||||||||||||||||||
Brightness Distribution: 91 %
Center on Battery: 227 cd/m²
Contrast: 489:1 (Black: 0.46 cd/m²)
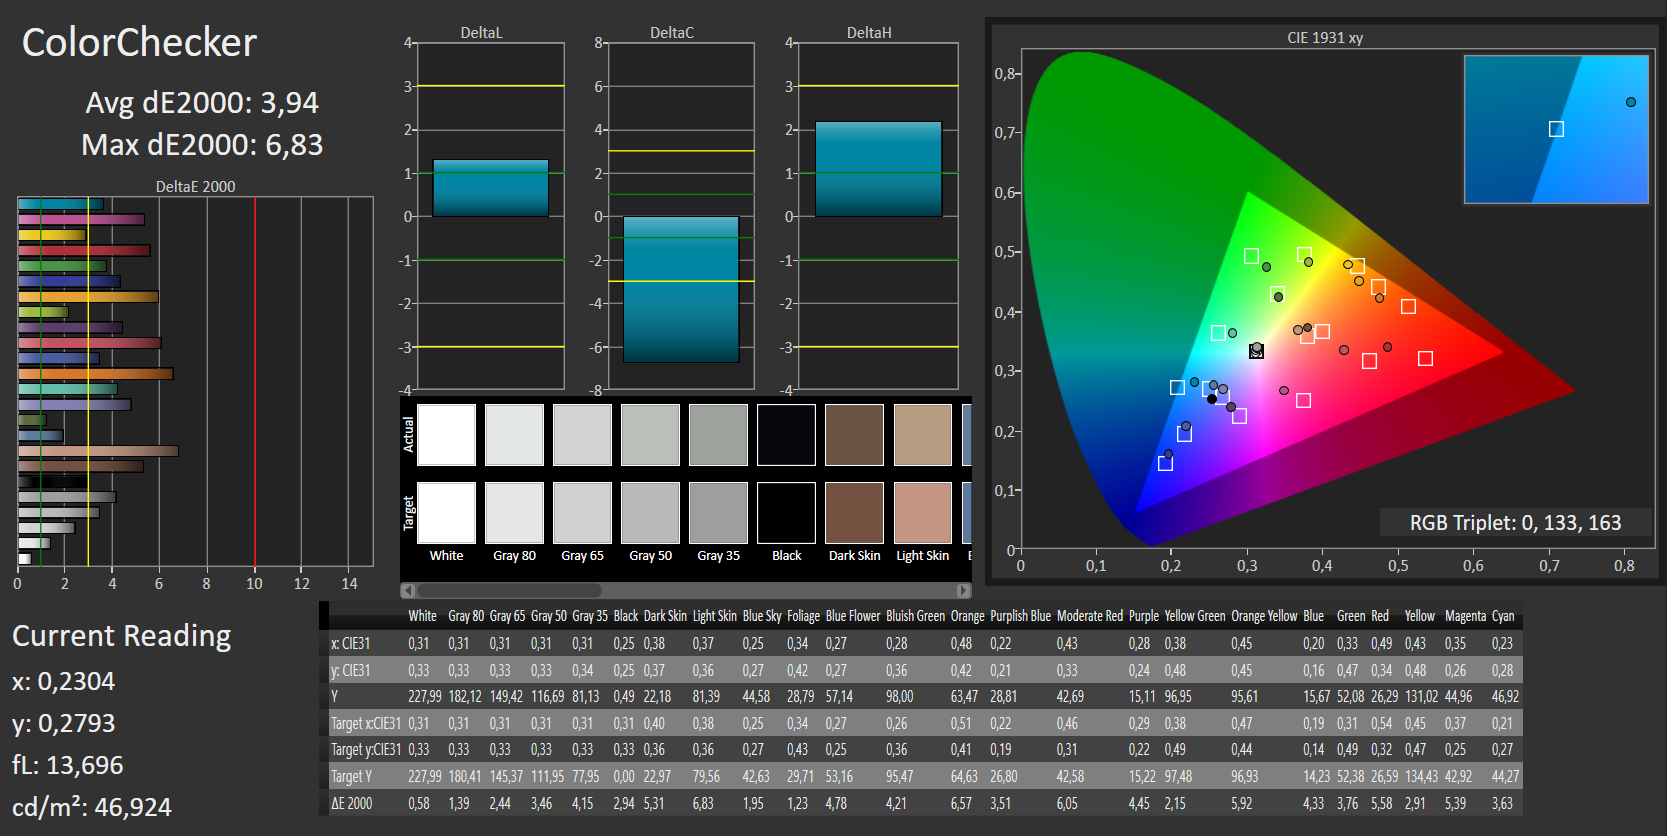
ΔE ColorChecker Calman: 3.94 | ∀{0.5-29.43 Ø4.71}
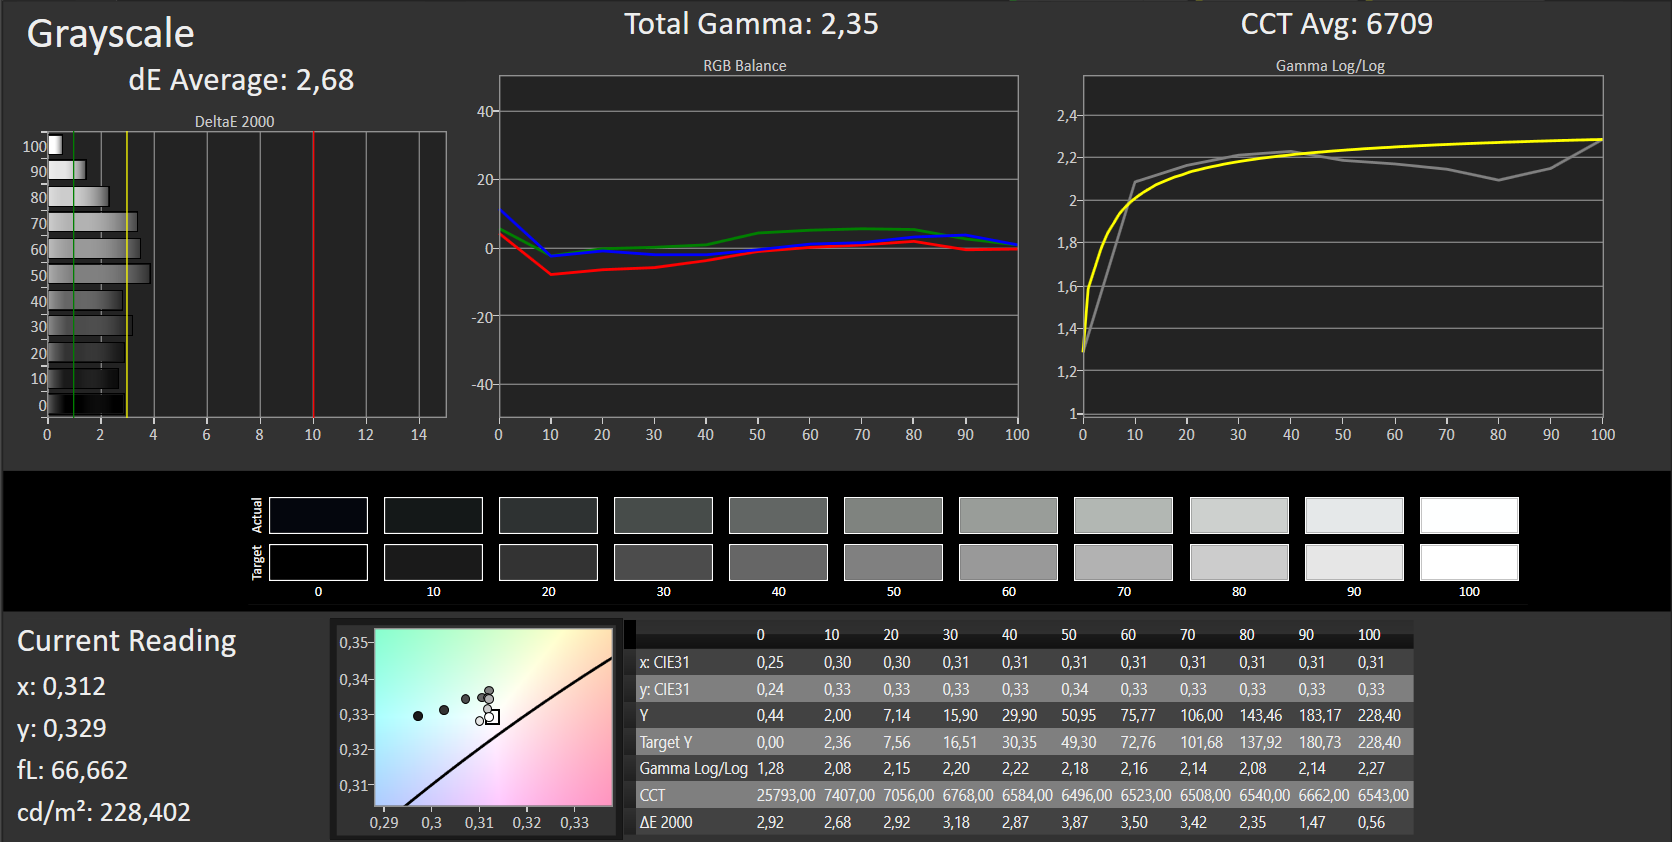
ΔE Greyscale Calman: 2.68 | ∀{0.09-98 Ø4.96}
57% sRGB (Argyll 1.6.3 3D)
36% AdobeRGB 1998 (Argyll 1.6.3 3D)
39.24% AdobeRGB 1998 (Argyll 3D)
57.1% sRGB (Argyll 3D)
37.98% Display P3 (Argyll 3D)
Gamma: 2.35
CCT: 6709 K
| Asus FX553VD-DM249T BOE, , 1920x1080, 15.6" | MSI GL62M 7RD-077 Chi Mei N156HGE-EAL, , 1920x1080, 15.6" | HP Pavilion 15t-X7P42AV AU Optronics AUO41ED, , 1920x1080, 15.6" | Acer Aspire VX5-591G-75C4 VX15 LG Philips LGD0550 / LP156WF6-SPK4, , 1920x1080, 15.6" | Dell Inspiron 15 7000 7567 AU Optronics AUO38ED B156HTN 28H80, , 1920x1080, 15.6" | Asus FX502VM-AS73 1920x1080, 15.6" | |
|---|---|---|---|---|---|---|
| Display | 105% | -0% | 2% | -4% | 1% | |
| Display P3 Coverage (%) | 37.98 | 85.4 125% | 38.03 0% | 38.88 2% | 36.42 -4% | 38.28 1% |
| sRGB Coverage (%) | 57.1 | 100 75% | 56.5 -1% | 58.2 2% | 54.9 -4% | 56.9 0% |
| AdobeRGB 1998 Coverage (%) | 39.24 | 83.8 114% | 39.29 0% | 40.2 2% | 37.62 -4% | 39.47 1% |
| Response Times | -83% | -75% | -30% | -106% | -35% | |
| Response Time Grey 50% / Grey 80% * (ms) | 43 ? | 44 ? -2% | 44.4 ? -3% | 22 ? 49% | 36 ? 16% | 28.4 ? 34% |
| Response Time Black / White * (ms) | 11 ? | 29 ? -164% | 27.2 ? -147% | 23 ? -109% | 36 ? -227% | 22.4 ? -104% |
| PWM Frequency (Hz) | 198 ? | |||||
| Screen | -42% | -37% | 2% | -72% | -27% | |
| Brightness middle (cd/m²) | 225 | 258 15% | 209.7 -7% | 281 25% | 246 9% | 209.5 -7% |
| Brightness (cd/m²) | 215 | 234 9% | 193 -10% | 257 20% | 235 9% | 205 -5% |
| Brightness Distribution (%) | 91 | 79 -13% | 75 -18% | 85 -7% | 75 -18% | 92 1% |
| Black Level * (cd/m²) | 0.46 | 0.54 -17% | 0.19 59% | 0.32 30% | 0.55 -20% | 0.69 -50% |
| Contrast (:1) | 489 | 478 -2% | 1104 126% | 878 80% | 447 -9% | 304 -38% |
| Colorchecker dE 2000 * | 3.94 | 9.74 -147% | 7.8 -98% | 5.16 -31% | 10.97 -178% | 4.7 -19% |
| Colorchecker dE 2000 max. * | 6.83 | 14.6 -114% | 24.1 -253% | 9.09 -33% | 19.7 -188% | |
| Greyscale dE 2000 * | 2.68 | 11.59 -332% | 7.3 -172% | 4.57 -71% | 14.25 -432% | 1.8 33% |
| Gamma | 2.35 94% | 2.19 100% | 2.39 92% | 2.59 85% | 1.83 120% | 2.23 99% |
| CCT | 6709 97% | 11851 55% | 5771 113% | 6931 94% | 11200 58% | 6975 93% |
| Color Space (Percent of AdobeRGB 1998) (%) | 36 | 76 111% | 39.3 9% | 37 3% | 35 -3% | 36.2 1% |
| Color Space (Percent of sRGB) (%) | 57 | 100 75% | 56.5 -1% | 58 2% | 55 -4% | 56.6 -1% |
| Total Average (Program / Settings) | -7% /
-18% | -37% /
-34% | -9% /
-2% | -61% /
-62% | -20% /
-23% |
* ... smaller is better
Display Response Times
| ↔ Response Time Black to White | ||
|---|---|---|
| 11 ms ... rise ↗ and fall ↘ combined | ↗ 7 ms rise | 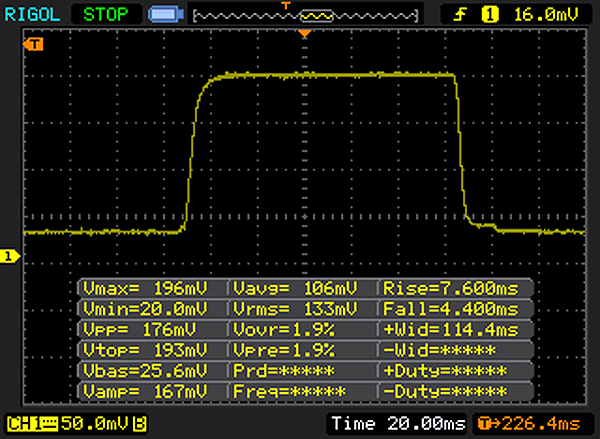 |
| ↘ 4 ms fall | ||
| The screen shows good response rates in our tests, but may be too slow for competitive gamers. In comparison, all tested devices range from 0.1 (minimum) to 240 (maximum) ms. » 30 % of all devices are better. This means that the measured response time is better than the average of all tested devices (19.8 ms). | ||
| ↔ Response Time 50% Grey to 80% Grey | ||
| 43 ms ... rise ↗ and fall ↘ combined | ↗ 24 ms rise | 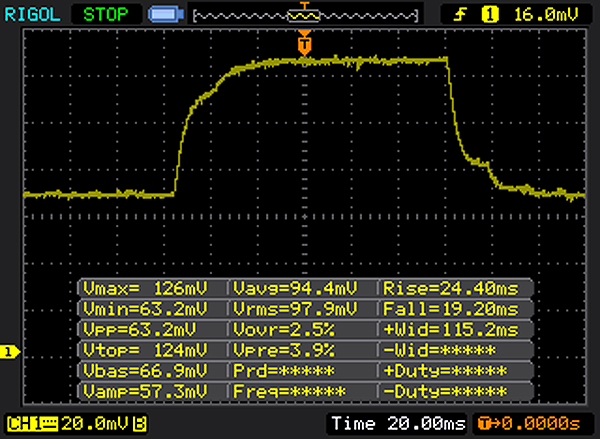 |
| ↘ 19 ms fall | ||
| The screen shows slow response rates in our tests and will be unsatisfactory for gamers. In comparison, all tested devices range from 0.165 (minimum) to 636 (maximum) ms. » 71 % of all devices are better. This means that the measured response time is worse than the average of all tested devices (31 ms). | ||
Screen Flickering / PWM (Pulse-Width Modulation)
| Screen flickering / PWM not detected | ≤ 90 % brightness setting | 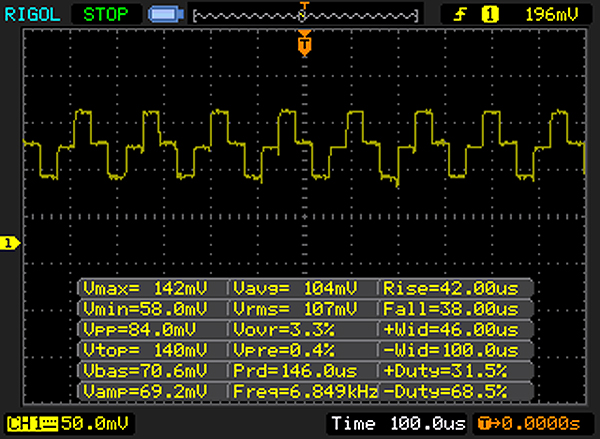 | |
In comparison: 52 % of all tested devices do not use PWM to dim the display. If PWM was detected, an average of 7754 (minimum: 5 - maximum: 343500) Hz was measured. | |||
| Cinebench R11.5 | |
| CPU Single 64Bit | |
| HP Pavilion 15t-X7P42AV | |
| Asus FX502VM-AS73 | |
| Asus FX553VD-DM249T | |
| MSI GL62M 7RD-077 | |
| CPU Multi 64Bit | |
| MSI GL62M 7RD-077 | |
| Asus FX553VD-DM249T | |
| Asus FX502VM-AS73 | |
| HP Pavilion 15t-X7P42AV | |
| PCMark 8 Home Score Accelerated v2 | 3832 points | |
| PCMark 8 Work Score Accelerated v2 | 5040 points | |
Help | ||
| Asus FX553VD-DM249T Hynix HFS128G39TND | MSI GL62M 7RD-077 HGST Travelstar 7K1000 HTS721010A9E630 | HP Pavilion 15t-X7P42AV Samsung CM871a MZNTY128HDHP | Acer Aspire VX5-591G-75C4 VX15 Toshiba MQ01ABD100 | Dell Inspiron 15 7000 7567 Intel SSDSCKKF256H6 | Asus FX502VM-AS73 SK Hynix HFS256G39TND-N210A | |
|---|---|---|---|---|---|---|
| CrystalDiskMark 3.0 | -80% | 44% | -84% | 50% | -3% | |
| Write 4k QD32 (MB/s) | 136.4 | 1.234 -99% | 140.2 3% | 0.893 -99% | 255.1 87% | 99.7 -27% |
| Read 4k QD32 (MB/s) | 348.2 | 1.088 -100% | 400.9 15% | 0.718 -100% | 279.6 -20% | 369.9 6% |
| Write 4k (MB/s) | 76.8 | 1.122 -99% | 89.8 17% | 0.846 -99% | 85.4 11% | 70.9 -8% |
| Read 4k (MB/s) | 29.74 | 0.494 -98% | 33.12 11% | 0.327 -99% | 27.11 -9% | 29.36 -1% |
| Write 512 (MB/s) | 136.9 | 57 -58% | 185.4 35% | 28.31 -79% | 304 122% | 137.8 1% |
| Read 512 (MB/s) | 340.9 | 43.19 -87% | 399.7 17% | 28.33 -92% | 338.9 -1% | 343.5 1% |
| Write Seq (MB/s) | 136.2 | 107.3 -21% | 476.6 250% | 100.6 -26% | 422.8 210% | 138.2 1% |
| Read Seq (MB/s) | 504 | 112.4 -78% | 522 4% | 101.5 -80% | 485.8 -4% | 503 0% |
| 3DMark 11 - 1280x720 Performance GPU | |
| Asus FX502VM-AS73 | |
| Acer Aspire VX5-591G-75C4 VX15 | |
| Dell Inspiron 15 7000 7567 | |
| MSI GL62M 7RD-077 | |
| Asus FX553VD-DM249T | |
| HP Pavilion 15t-X7P42AV | |
| 3DMark | |
| 1280x720 Cloud Gate Standard Score | |
| Asus FX502VM-AS73 | |
| Dell Inspiron 15 7000 7567 | |
| Acer Aspire VX5-591G-75C4 VX15 | |
| HP Pavilion 15t-X7P42AV | |
| MSI GL62M 7RD-077 | |
| Asus FX553VD-DM249T | |
| 1280x720 Cloud Gate Standard Graphics | |
| Asus FX502VM-AS73 | |
| Dell Inspiron 15 7000 7567 | |
| Acer Aspire VX5-591G-75C4 VX15 | |
| MSI GL62M 7RD-077 | |
| HP Pavilion 15t-X7P42AV | |
| Asus FX553VD-DM249T | |
| 1920x1080 Fire Strike Score | |
| Asus FX502VM-AS73 | |
| Acer Aspire VX5-591G-75C4 VX15 | |
| Dell Inspiron 15 7000 7567 | |
| MSI GL62M 7RD-077 | |
| HP Pavilion 15t-X7P42AV | |
| Asus FX553VD-DM249T | |
| 1920x1080 Fire Strike Graphics | |
| Asus FX502VM-AS73 | |
| Acer Aspire VX5-591G-75C4 VX15 | |
| Dell Inspiron 15 7000 7567 | |
| MSI GL62M 7RD-077 | |
| HP Pavilion 15t-X7P42AV | |
| Asus FX553VD-DM249T | |
| 3DMark 11 Performance | 7471 points | |
| 3DMark Cloud Gate Standard Score | 19501 points | |
| 3DMark Fire Strike Score | 5508 points | |
Help | ||
| The Witcher 3 | |
| 1920x1080 Ultra Graphics & Postprocessing (HBAO+) | |
| Acer Aspire VX5-591G-75C4 VX15 | |
| Asus FX553VD-DM249T | |
| HP Pavilion 15t-X7P42AV | |
| 1920x1080 High Graphics & Postprocessing (Nvidia HairWorks Off) | |
| Acer Aspire VX5-591G-75C4 VX15 | |
| HP Pavilion 15t-X7P42AV | |
| Asus FX553VD-DM249T | |
| 1366x768 Medium Graphics & Postprocessing | |
| HP Pavilion 15t-X7P42AV | |
| Asus FX553VD-DM249T | |
| 1024x768 Low Graphics & Postprocessing | |
| HP Pavilion 15t-X7P42AV | |
| Asus FX553VD-DM249T | |
| Rise of the Tomb Raider | |
| 1920x1080 Very High Preset AA:FX AF:16x | |
| Asus FX502VM-AS73 | |
| Dell Inspiron 15 7000 7567 | |
| MSI GL62M 7RD-077 | |
| Asus FX553VD-DM249T | |
| 1920x1080 High Preset AA:FX AF:4x | |
| Dell Inspiron 15 7000 7567 | |
| MSI GL62M 7RD-077 | |
| Asus FX553VD-DM249T | |
| 1366x768 Medium Preset AF:2x | |
| Dell Inspiron 15 7000 7567 | |
| MSI GL62M 7RD-077 | |
| Asus FX553VD-DM249T | |
| 1024x768 Lowest Preset | |
| Asus FX553VD-DM249T | |
| Dell Inspiron 15 7000 7567 | |
| MSI GL62M 7RD-077 | |
| Doom | |
| 1920x1080 Ultra Preset AA:SM | |
| Asus FX502VM-AS73 | |
| Dell Inspiron 15 7000 7567 | |
| Asus FX553VD-DM249T | |
| 1920x1080 High Preset AA:FX | |
| Dell Inspiron 15 7000 7567 | |
| Asus FX553VD-DM249T | |
| 1920x1080 Medium Preset | |
| Dell Inspiron 15 7000 7567 | |
| Asus FX553VD-DM249T | |
| 1366x768 Medium Preset | |
| Dell Inspiron 15 7000 7567 | |
| Asus FX553VD-DM249T | |
| 1280x720 Low Preset | |
| Dell Inspiron 15 7000 7567 | |
| Asus FX553VD-DM249T | |
| low | med. | high | ultra | |
|---|---|---|---|---|
| The Witcher 3 (2015) | 91 | 62.7 | 35.6 | 23 |
| Rise of the Tomb Raider (2016) | 120 | 66 | 38 | 32 |
| Doom (2016) | 103 | 72 | 44 | 43 |
Noise level
| Idle |
| 32.9 / 32.9 / 33.5 dB(A) |
| HDD |
| 32.9 dB(A) |
| Load |
| 43.7 / 47 dB(A) |
 | ||
30 dB silent 40 dB(A) audible 50 dB(A) loud |
||
min: | ||
(±) The maximum temperature on the upper side is 44.2 °C / 112 F, compared to the average of 36.8 °C / 98 F, ranging from 21 to 71 °C for the class Multimedia.
(±) The bottom heats up to a maximum of 40 °C / 104 F, compared to the average of 39.1 °C / 102 F
(+) In idle usage, the average temperature for the upper side is 23.8 °C / 75 F, compared to the device average of 31.3 °C / 88 F.
(+) Playing The Witcher 3, the average temperature for the upper side is 31.8 °C / 89 F, compared to the device average of 31.3 °C / 88 F.
(-) The palmrests and touchpad can get very hot to the touch with a maximum of 41.4 °C / 106.5 F.
(-) The average temperature of the palmrest area of similar devices was 28.7 °C / 83.7 F (-12.7 °C / -22.8 F).
| Off / Standby | |
| Idle | |
| Load |
|
Key:
min: | |
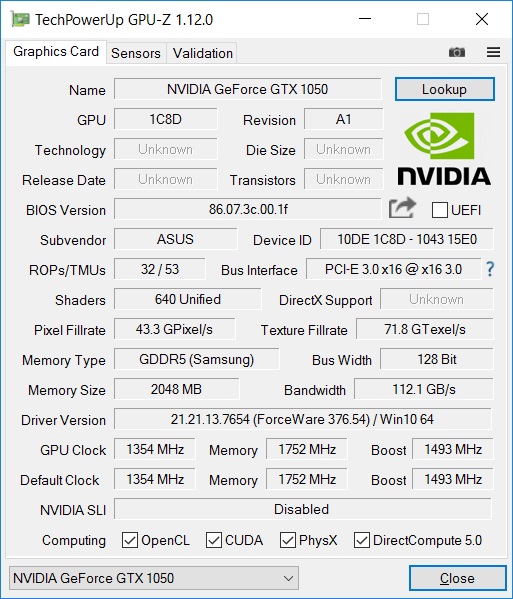
| Asus FX553VD-DM249T i7-7700HQ, GeForce GTX 1050 Mobile, Hynix HFS128G39TND, TN, 1920x1080, 15.6" | MSI GL62M 7RD-077 i7-7700HQ, GeForce GTX 1050 Mobile, HGST Travelstar 7K1000 HTS721010A9E630, TN LED, 1920x1080, 15.6" | HP Pavilion 15t-X7P42AV i7-7700HQ, GeForce GTX 1050 Mobile, Samsung CM871a MZNTY128HDHP, IPS, 1920x1080, 15.6" | Acer Aspire VX5-591G-75C4 VX15 i7-7700HQ, GeForce GTX 1050 Ti Mobile, Toshiba MQ01ABD100, IPS, 1920x1080, 15.6" | Dell Inspiron 15 7000 7567 i7-7700HQ, GeForce GTX 1050 Ti Mobile, Intel SSDSCKKF256H6, TN, 1920x1080, 15.6" | Asus FX502VM-AS73 i7-7700HQ, GeForce GTX 1060 Mobile, SK Hynix HFS256G39TND-N210A, TN LED, 1920x1080, 15.6" | |
|---|---|---|---|---|---|---|
| Power Consumption | -75% | -34% | -38% | -3% | -105% | |
| Idle Minimum * (Watt) | 4 | 10.6 -165% | 8.29 -107% | 7 -75% | 4.4 -10% | 14.9 -273% |
| Idle Average * (Watt) | 6.7 | 14.5 -116% | 8.9 -33% | 10.2 -52% | 6.8 -1% | 15.1 -125% |
| Idle Maximum * (Watt) | 9.6 | 15 -56% | 10.2 -6% | 14 -46% | 8.3 14% | 15.2 -58% |
| Load Average * (Watt) | 81 | 90 -11% | 77.1 5% | 78 4% | 81 -0% | 105.8 -31% |
| Witcher 3 ultra * (Watt) | 90 | |||||
| Load Maximum * (Watt) | 107 | 135 -26% | 136.6 -28% | 127 -19% | 127 -19% | 148.8 -39% |
* ... smaller is better
| Asus FX553VD-DM249T i7-7700HQ, GeForce GTX 1050 Mobile, 48 Wh | MSI GL62M 7RD-077 i7-7700HQ, GeForce GTX 1050 Mobile, 41 Wh | HP Pavilion 15t-X7P42AV i7-7700HQ, GeForce GTX 1050 Mobile, 63.3 Wh | Acer Aspire VX5-591G-75C4 VX15 i7-7700HQ, GeForce GTX 1050 Ti Mobile, 52.5 Wh | Dell Inspiron 15 7000 7567 i7-7700HQ, GeForce GTX 1050 Ti Mobile, 74 Wh | Asus FX502VM-AS73 i7-7700HQ, GeForce GTX 1060 Mobile, 64 Wh | |
|---|---|---|---|---|---|---|
| Battery runtime | -31% | 61% | -2% | 76% | -13% | |
| Reader / Idle (h) | 9.8 | 6.5 -34% | 16 63% | 5.4 -45% | 19.6 100% | 6.1 -38% |
| WiFi v1.3 (h) | 6 | 3.8 -37% | 6.5 8% | 5 -17% | 10.4 73% | 4.6 -23% |
| Load (h) | 0.9 | 0.7 -22% | 1.9 111% | 1.4 56% | 1.4 56% | 1.1 22% |
| H.264 (h) | 3.6 | 7.6 |
Pros
Cons
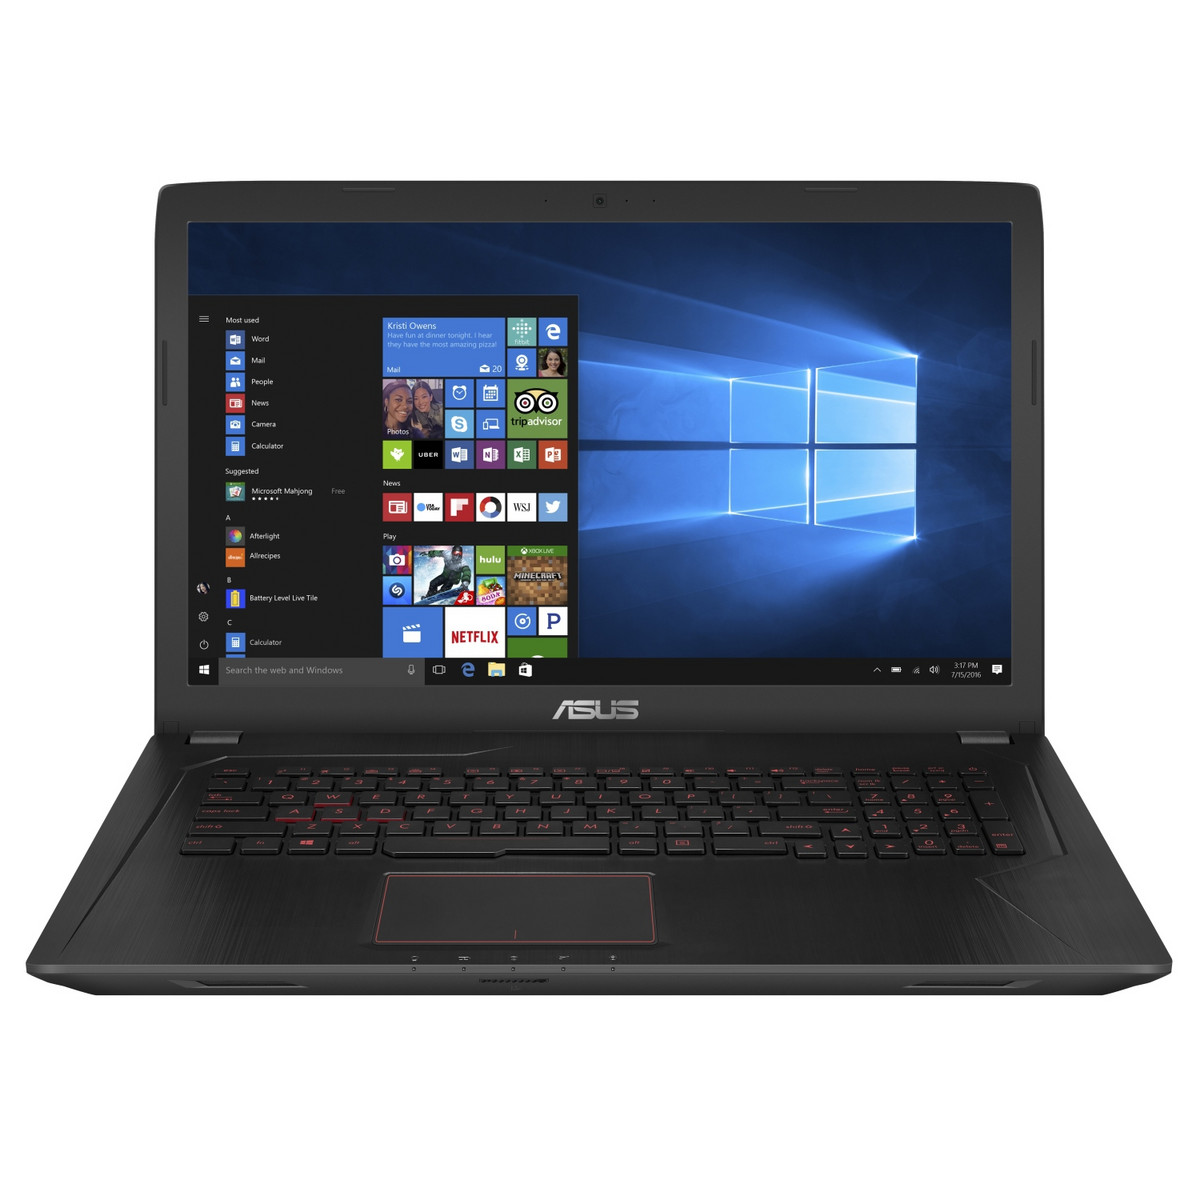
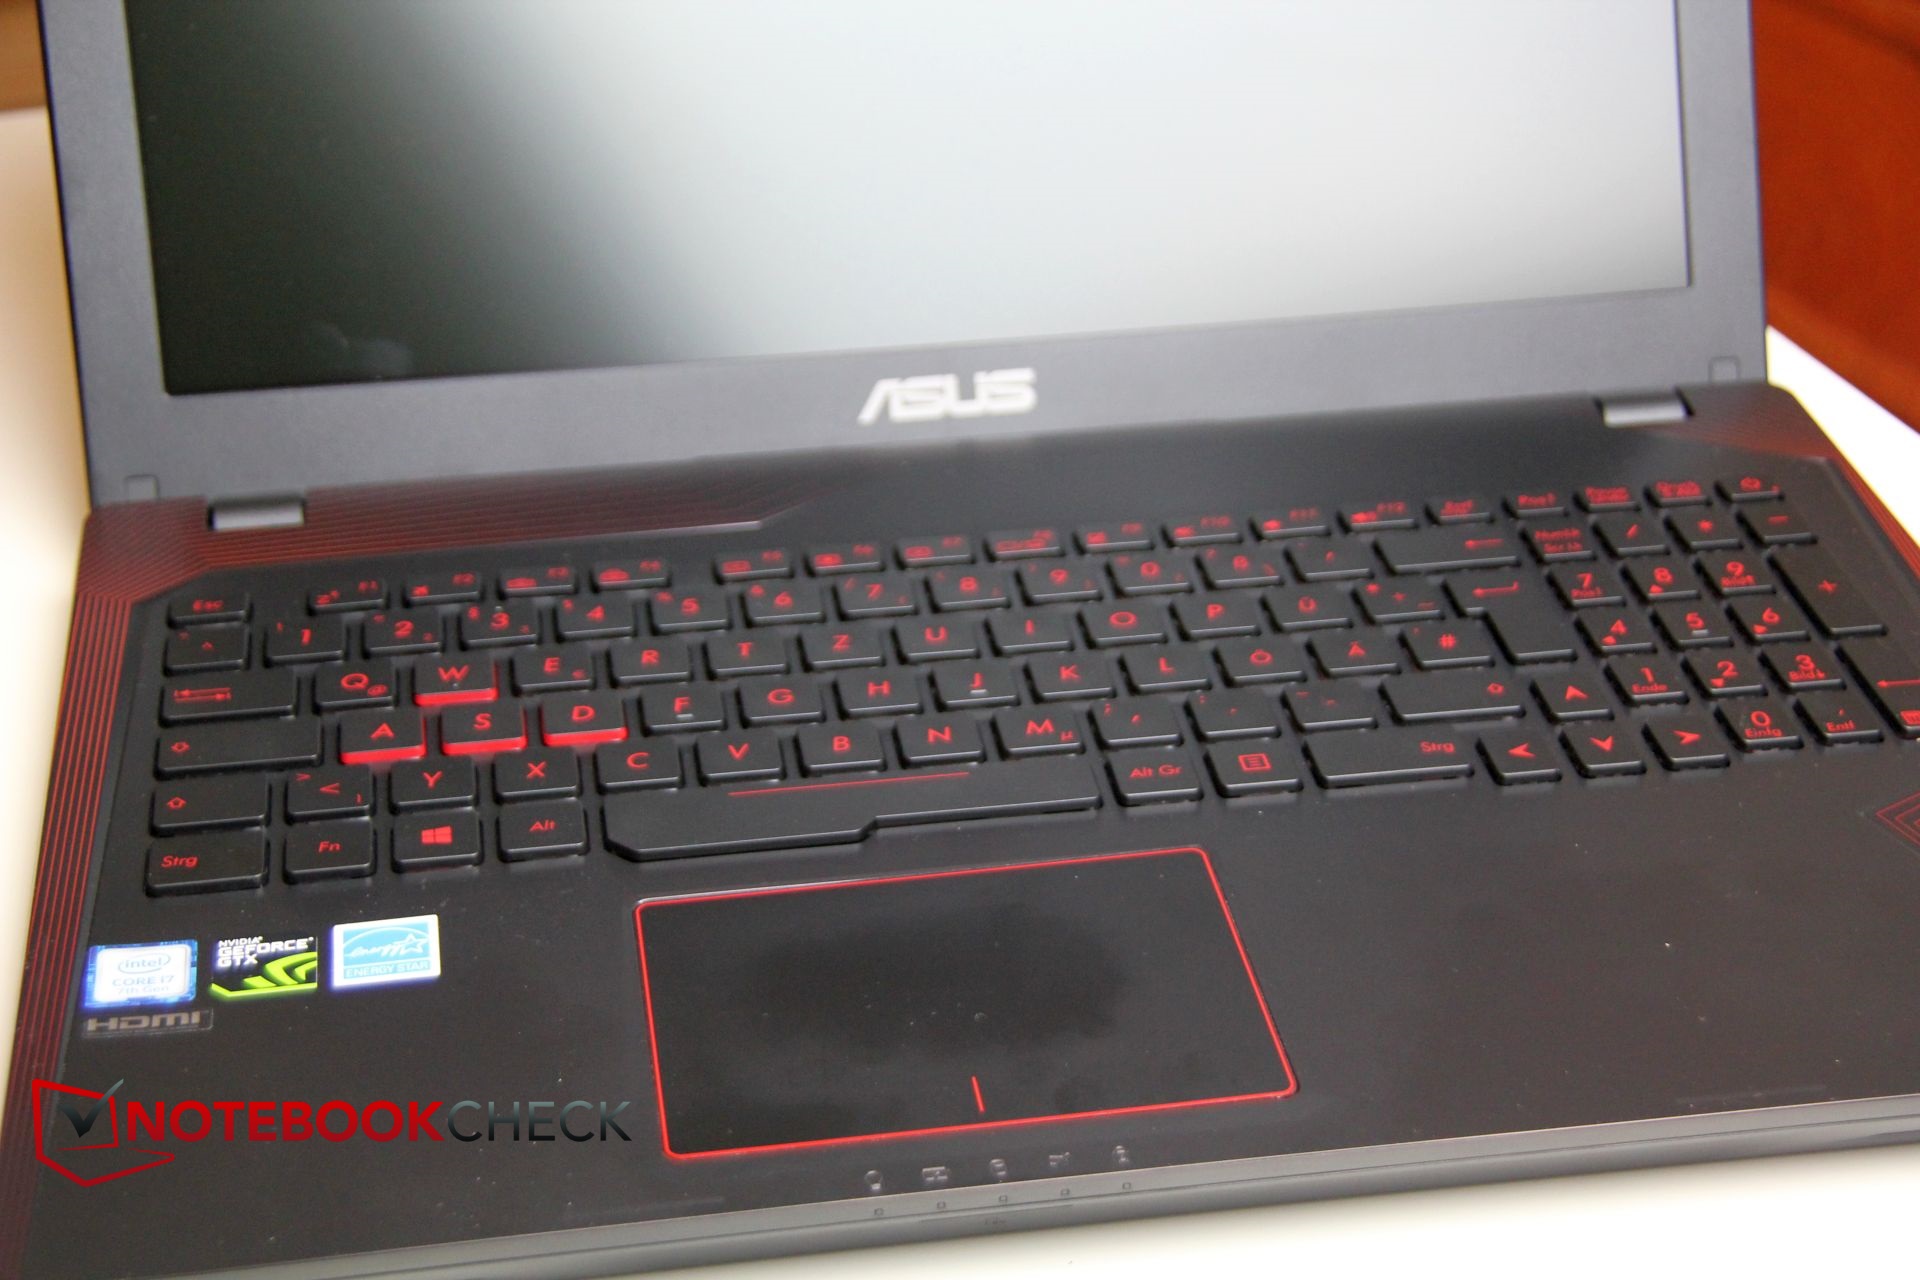
华硕 FX553实际上是一台中高端多媒体笔记本,但它也是一台入门级游戏设备。将FX553当作一台多媒体笔记本来看的话它能得到更好的分数,所以我们将它列入这个分类当中。在这个分类下,FX553的评分将会上升两分,是它成为一台表现较为全面的设备。单单从性能来说,FX553并不弱,其搭载的硬件很好的兑现了它自身的承诺。但其他部分大多就仅仅是平均水平而已。
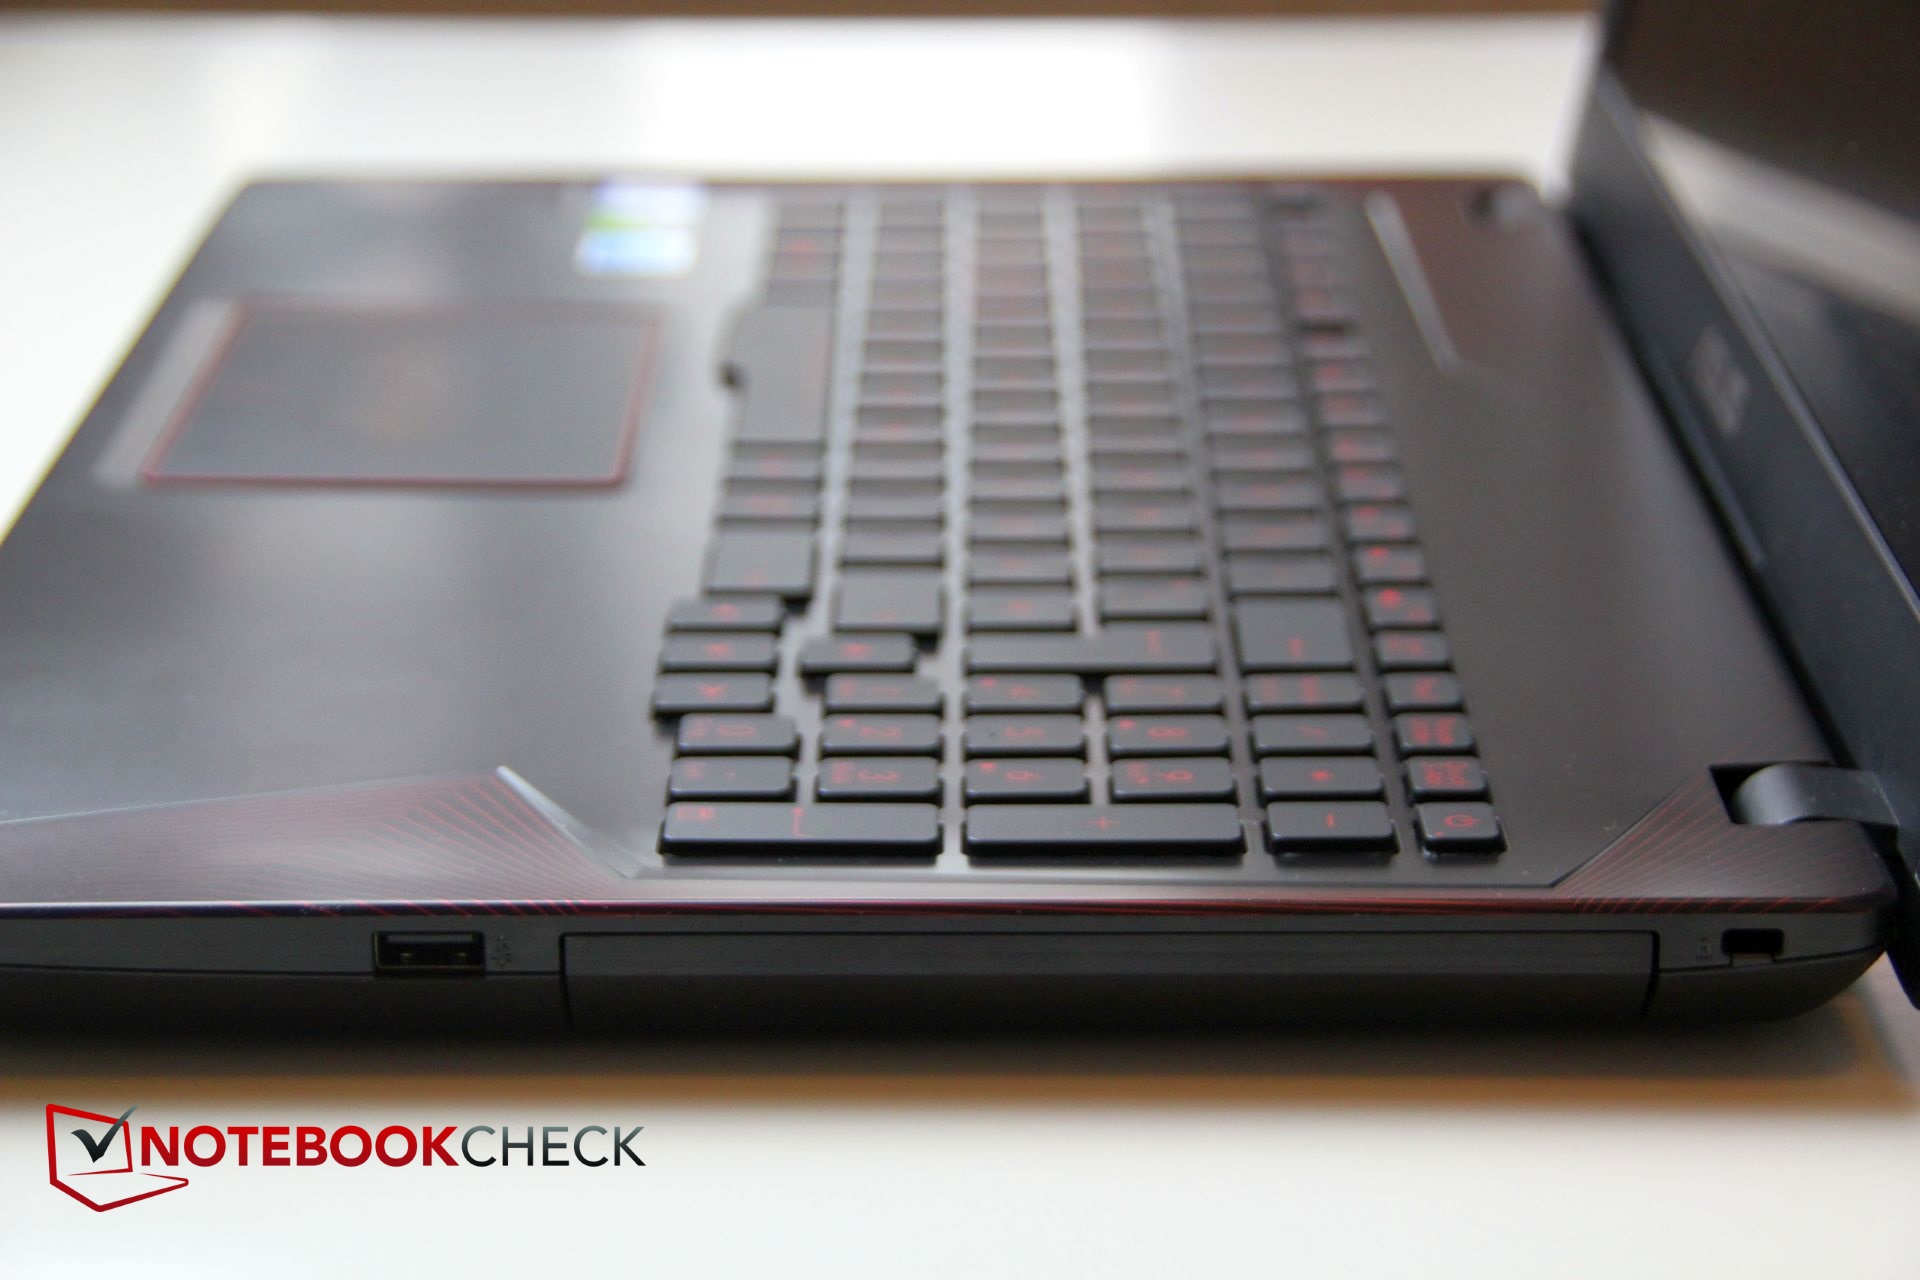
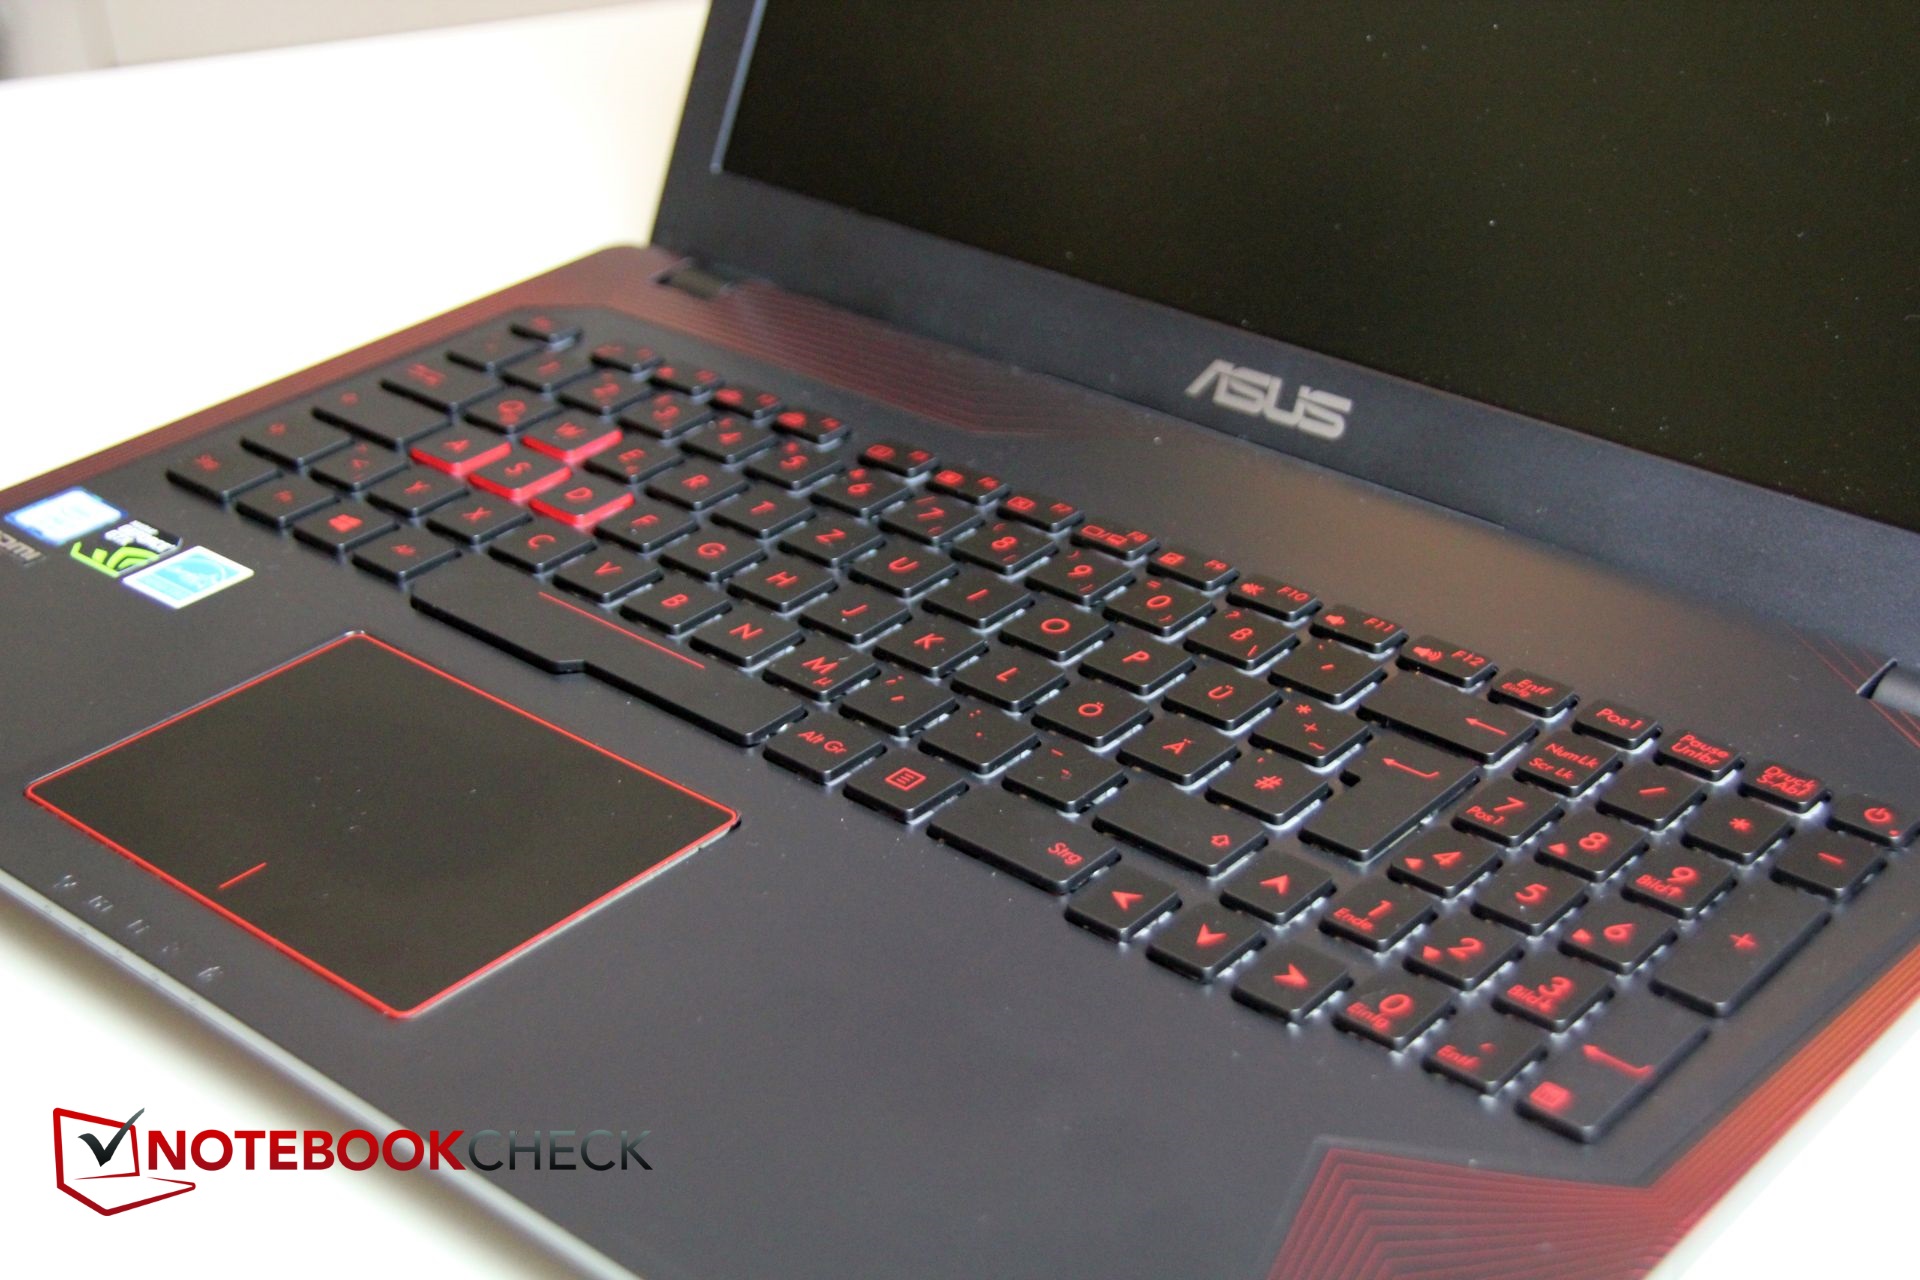
我们认为FX53最糟糕的地方在于它的外壳强度不足过于柔软,键盘触发压力欠佳,再者就是亮度及对比度都不足的屏幕,最后是在左侧表面上过高的发热。
从另一方面来说,选择购买它并不是一个太错误的选择。你会得到一台实惠的游戏及多媒体应用笔记本,它能够流畅的运行当下所有的游戏且发热及噪音尚可接受。当然你需要衡量一下是否选择购买稍贵一点搭载 GTX 1060 的“真正”的游戏本FX502。FX502在游戏中的表现几乎是FX553的两倍,但同时也更热噪音也更大。所以这是一个需要做出妥协的决定,一边是性能,另一边是温度/噪音/重量。
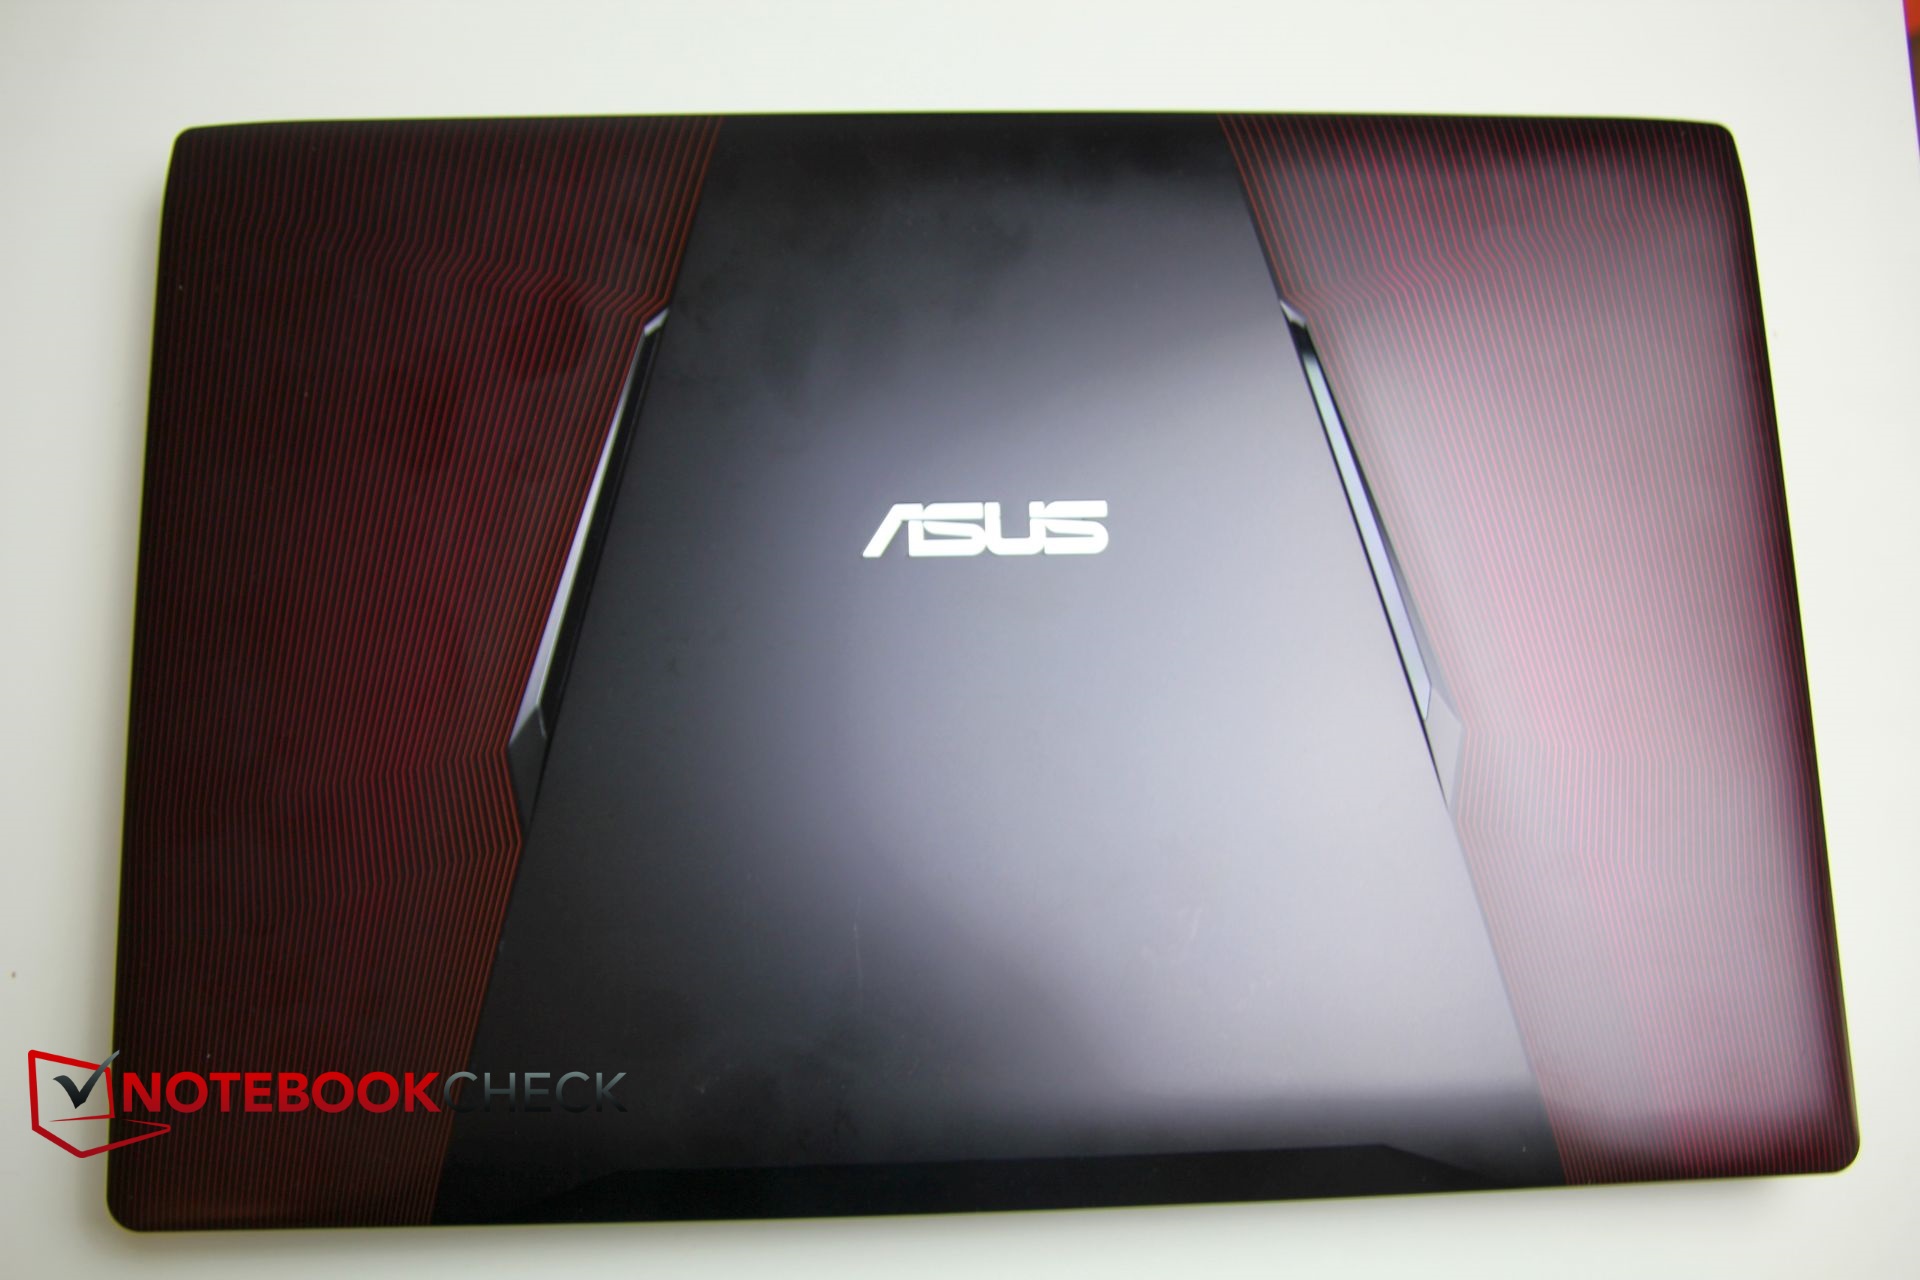
华硕 FX553VD 性能强大,外观上附有吸引力,但从技术角度来说也仅是一台不显眼的全能型设备。
相比于其他配置相近的竞品,FX553处于中下水平。它和MSI的产品几乎相同,其他例如来自惠普和戴尔的设备会更好一点。考虑到其所提供的配置,我们认为1100欧元(约合1177美元)的价格几乎是太高了。有些竞品在略低于1000欧元(约合1070美元)的价位上,而且并不比FX553差。即便是来自同一家厂商的FX502,仅仅贵了100到200欧元(约合107到214美元),便搭载有16G内存以及GTX1060.
当真正的设备摆在眼前时,“追寻超凡”变得十分困难。整体设计及低功耗也许最“超凡”的,但其余部分却仅是不出众的平均水平。其目标用户应该是那些想要一台有着相对较强性能的多媒体笔记本但不是很在乎制造工艺及细节的用户。华硕 FX553 不是太贵,不是太重,不是太吵,也不是太热。它运行速度很快,但并不是一台高端设备。
注:本文是基于完整评测的缩减版本,阅读完整的英文评测,请点击这里。
Asus FX553VD-DM249T
- 04/19/2017 v6 (old)
Christian Hintze