华硕(ASUS) 灵耀U 2代 (i5-8265U,SSD,FHD) 笔记本电脑评测

| SD Card Reader | |
| average JPG Copy Test (av. of 3 runs) | |
| Average of class Subnotebook (23.7 - 188, n=9, last 2 years) | |
| Asus Zenbook 14 UX433FA-A6018T (Toshiba Exceria Pro M501 microSDXC 64GB) | |
| Asus ZenBook 14 UX433FA (Toshiba Exceria Pro M501 microSDXC) | |
| Acer Swift 3 SF314-55-31N8 (Toshiba Exceria Pro SDXC 64 GB UHS-II) | |
| maximum AS SSD Seq Read Test (1GB) | |
| Average of class Subnotebook (24.9 - 195, n=8, last 2 years) | |
| Asus ZenBook 14 UX433FA (Toshiba Exceria Pro M501 microSDXC) | |
| Acer Swift 3 SF314-55-31N8 (Toshiba Exceria Pro SDXC 64 GB UHS-II) | |
| Asus Zenbook 14 UX433FA-A6018T (Toshiba Exceria Pro M501 microSDXC 64GB) | |
| |||||||||||||||||||||||||
Brightness Distribution: 77 %
Center on Battery: 323 cd/m²
Contrast: 1605:1 (Black: 0.2 cd/m²)
ΔE ColorChecker Calman: 6.35 | ∀{0.5-29.43 Ø4.72}
calibrated: 1.88
ΔE Greyscale Calman: 8.35 | ∀{0.09-98 Ø4.97}
91% sRGB (Argyll 1.6.3 3D)
59% AdobeRGB 1998 (Argyll 1.6.3 3D)
64.6% AdobeRGB 1998 (Argyll 3D)
90.9% sRGB (Argyll 3D)
63.5% Display P3 (Argyll 3D)
Gamma: 2.51
CCT: 8227 K
| Asus Zenbook 14 UX433FA-A6018T IPS, 1920x1080, 14" | Asus ZenBook 14 UX433FA IPS, 1920x1080, 14" | Acer Swift 3 SF314-55-31N8 IPS, 1920x1080, 14" | Huawei MateBook D 14 W50F IPS, 1920x1080, 14" | |
|---|---|---|---|---|
| Display | 0% | 6% | -31% | |
| Display P3 Coverage (%) | 63.5 | 64.3 1% | 66.2 4% | 43.19 -32% |
| sRGB Coverage (%) | 90.9 | 89.7 -1% | 98.3 8% | 64 -30% |
| AdobeRGB 1998 Coverage (%) | 64.6 | 65.1 1% | 67.8 5% | 44.62 -31% |
| Response Times | 10% | -3% | -15% | |
| Response Time Grey 50% / Grey 80% * (ms) | 42 ? | 39.6 ? 6% | 41 ? 2% | 41 ? 2% |
| Response Time Black / White * (ms) | 28 ? | 24 ? 14% | 30 ? -7% | 37 ? -32% |
| PWM Frequency (Hz) | 25000 ? | 200 ? | ||
| Screen | -11% | 6% | -20% | |
| Brightness middle (cd/m²) | 321 | 332.8 4% | 291 -9% | 291 -9% |
| Brightness (cd/m²) | 282 | 310 10% | 276 -2% | 276 -2% |
| Brightness Distribution (%) | 77 | 87 13% | 90 17% | 85 10% |
| Black Level * (cd/m²) | 0.2 | 0.29 -45% | 0.27 -35% | 0.46 -130% |
| Contrast (:1) | 1605 | 1148 -28% | 1078 -33% | 633 -61% |
| Colorchecker dE 2000 * | 6.35 | 5.14 19% | 3.86 39% | 4.3 32% |
| Colorchecker dE 2000 max. * | 12.2 | 11.88 3% | 8.26 32% | 10.01 18% |
| Colorchecker dE 2000 calibrated * | 1.88 | 3.61 -92% | 3.18 -69% | |
| Greyscale dE 2000 * | 8.35 | 8.8 -5% | 5.33 36% | 4.21 50% |
| Gamma | 2.51 88% | 2.33 94% | 2.25 98% | 2.46 89% |
| CCT | 8227 79% | 8227 79% | 7426 88% | 6867 95% |
| Color Space (Percent of AdobeRGB 1998) (%) | 59 | 58.1 -2% | 62 5% | 41 -31% |
| Color Space (Percent of sRGB) (%) | 91 | 89.2 -2% | 98 8% | 64 -30% |
| Total Average (Program / Settings) | -0% /
-7% | 3% /
5% | -22% /
-22% |
* ... smaller is better
Screen Flickering / PWM (Pulse-Width Modulation)
| Screen flickering / PWM not detected | 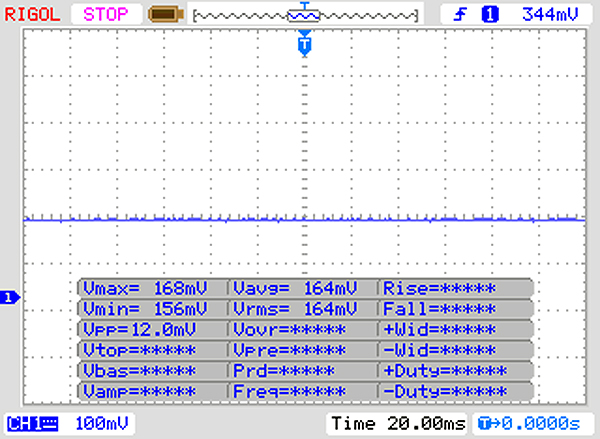 | ||
In comparison: 52 % of all tested devices do not use PWM to dim the display. If PWM was detected, an average of 7772 (minimum: 5 - maximum: 343500) Hz was measured. | |||
Display Response Times
| ↔ Response Time Black to White | ||
|---|---|---|
| 28 ms ... rise ↗ and fall ↘ combined | ↗ 16 ms rise | 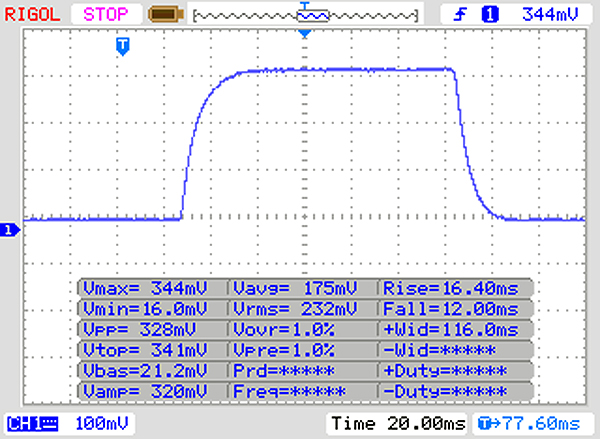 |
| ↘ 12 ms fall | ||
| The screen shows relatively slow response rates in our tests and may be too slow for gamers. In comparison, all tested devices range from 0.1 (minimum) to 240 (maximum) ms. » 71 % of all devices are better. This means that the measured response time is worse than the average of all tested devices (19.8 ms). | ||
| ↔ Response Time 50% Grey to 80% Grey | ||
| 42 ms ... rise ↗ and fall ↘ combined | ↗ 21 ms rise | 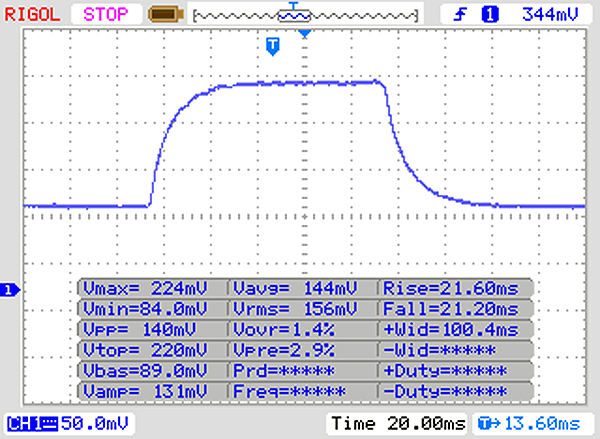 |
| ↘ 21 ms fall | ||
| The screen shows slow response rates in our tests and will be unsatisfactory for gamers. In comparison, all tested devices range from 0.165 (minimum) to 636 (maximum) ms. » 67 % of all devices are better. This means that the measured response time is worse than the average of all tested devices (31 ms). | ||
| Cinebench R15 | |
| CPU Single 64Bit | |
| Average of class Subnotebook (72.4 - 322, n=57, last 2 years) | |
| Tuxedo InfinityBook Pro 14 (Windows 10) | |
| Asus ZenBook 14 UX433FA | |
| Average Intel Core i5-8265U (111 - 164, n=35) | |
| Acer Swift 3 SF314-55-31N8 | |
| Asus Zenbook 14 UX433FA-A6018T | |
| Huawei MateBook D 14 W50F | |
| CPU Multi 64Bit | |
| Average of class Subnotebook (327 - 3345, n=57, last 2 years) | |
| Asus Zenbook 14 UX433FA-A6018T | |
| Asus Zenbook 14 UX433FA-A6018T (BIOS 204) | |
| Asus ZenBook 14 UX433FA | |
| Average Intel Core i5-8265U (457 - 750, n=38) | |
| Tuxedo InfinityBook Pro 14 (Windows 10) | |
| Huawei MateBook D 14 W50F | |
| Acer Swift 3 SF314-55-31N8 | |
| Cinebench R10 | |
| Rendering Single 32Bit | |
| Average of class Subnotebook (2299 - 10697, n=13, last 2 years) | |
| Tuxedo InfinityBook Pro 14 (Windows 10) | |
| Asus ZenBook 14 UX433FA | |
| Average Intel Core i5-8265U (5841 - 6209, n=9) | |
| Acer Swift 3 SF314-55-31N8 | |
| Asus Zenbook 14 UX433FA-A6018T | |
| Rendering Multiple CPUs 32Bit | |
| Average of class Subnotebook (14395 - 51868, n=13, last 2 years) | |
| Asus Zenbook 14 UX433FA-A6018T | |
| Asus ZenBook 14 UX433FA | |
| Average Intel Core i5-8265U (16318 - 22962, n=9) | |
| Tuxedo InfinityBook Pro 14 (Windows 10) | |
| Acer Swift 3 SF314-55-31N8 | |
| Geekbench 3 | |
| 32 Bit Multi-Core Score | |
| Average of class Subnotebook (n=1last 2 years) | |
| Average Intel Core i5-8265U (12198 - 14499, n=6) | |
| Asus Zenbook 14 UX433FA-A6018T | |
| Tuxedo InfinityBook Pro 14 (Windows 10) | |
| Acer Swift 3 SF314-55-31N8 | |
| 32 Bit Single-Core Score | |
| Average of class Subnotebook (n=1last 2 years) | |
| Tuxedo InfinityBook Pro 14 (Windows 10) | |
| Average Intel Core i5-8265U (3470 - 3842, n=6) | |
| Asus Zenbook 14 UX433FA-A6018T | |
| Acer Swift 3 SF314-55-31N8 | |
| Geekbench 4.0 | |
| 64 Bit Multi-Core Score | |
| Average of class Subnotebook (n=1last 2 years) | |
| Average Intel Core i5-8265U (13168 - 14390, n=3) | |
| Asus Zenbook 14 UX433FA-A6018T | |
| Acer Swift 3 SF314-55-31N8 | |
| 64 Bit Single-Core Score | |
| Average of class Subnotebook (n=1last 2 years) | |
| Average Intel Core i5-8265U (4229 - 4605, n=3) | |
| Asus Zenbook 14 UX433FA-A6018T | |
| Acer Swift 3 SF314-55-31N8 | |
| Geekbench 4.4 | |
| 64 Bit Multi-Core Score | |
| Average of class Subnotebook (27854 - 45023, n=7, last 2 years) | |
| Asus Zenbook 14 UX433FA-A6018T | |
| Tuxedo InfinityBook Pro 14 (Windows 10) | |
| Average Intel Core i5-8265U (7144 - 16249, n=19) | |
| Asus ZenBook 14 UX433FA | |
| Acer Swift 3 SF314-55-31N8 | |
| 64 Bit Single-Core Score | |
| Average of class Subnotebook (5976 - 8929, n=7, last 2 years) | |
| Tuxedo InfinityBook Pro 14 (Windows 10) | |
| Asus ZenBook 14 UX433FA | |
| Asus Zenbook 14 UX433FA-A6018T | |
| Average Intel Core i5-8265U (2106 - 4830, n=19) | |
| Acer Swift 3 SF314-55-31N8 | |
| JetStream 1.1 - 1.1 Total | |
| Average of class Subnotebook (215 - 476, n=2, last 2 years) | |
| Asus ZenBook 14 UX433FA (Edge 42.17134.1.0) | |
| Tuxedo InfinityBook Pro 14 (Chromium 71.0.3578.98 - Windows 10) | |
| Average Intel Core i5-8265U (193.7 - 244, n=19) | |
| Asus Zenbook 14 UX433FA-A6018T (Edge 44) | |
| Acer Swift 3 SF314-55-31N8 (Edge 42) | |
| PCMark 7 Score | 5946 points | |
| PCMark 8 Home Score Accelerated v2 | 3733 points | |
| PCMark 8 Creative Score Accelerated v2 | 4690 points | |
| PCMark 8 Work Score Accelerated v2 | 4715 points | |
| PCMark 10 Score | 3643 points | |
Help | ||
| PCMark 8 - Home Score Accelerated v2 | |
| Tuxedo InfinityBook Pro 14 | |
| Asus Zenbook 14 UX433FA-A6018T | |
| Average Intel Core i5-8265U, Intel UHD Graphics 620 (2747 - 4244, n=24) | |
| Asus ZenBook 14 UX433FA | |
| Acer Swift 3 SF314-55-31N8 | |
| Average of class Subnotebook (1739 - 1828, n=2, last 2 years) | |

| Asus Zenbook 14 UX433FA-A6018T WDC PC SN520 SDAPNUW-256G | Asus ZenBook 14 UX433FA WDC PC SN520 SDAPNUW-512G | Tuxedo InfinityBook Pro 14 Samsung SSD 970 EVO 500GB | Acer Swift 3 SF314-55-31N8 Kingston RBUSNS8154P3128GJ | Huawei MateBook D 14 W50F SanDisk SD9SN8W256G1027 | Average WDC PC SN520 SDAPNUW-256G | Average of class Subnotebook | |
|---|---|---|---|---|---|---|---|
| CrystalDiskMark 5.2 / 6 | 12% | 37% | -20% | -45% | 4% | 138% | |
| Write 4K (MB/s) | 99.9 | 123 23% | 130.9 31% | 96.8 -3% | 60.5 -39% | 118.5 ? 19% | 155.4 ? 56% |
| Read 4K (MB/s) | 40.03 | 43.28 8% | 44.66 12% | 36.99 -8% | 21.63 -46% | 42 ? 5% | 64.3 ? 61% |
| Write Seq (MB/s) | 973 | 753 -23% | 1187 22% | 463.1 -52% | 450.9 -54% | 1123 ? 15% | 2846 ? 192% |
| Read Seq (MB/s) | 1111 | 1336 20% | 1190 7% | 794 -29% | 482.3 -57% | 1208 ? 9% | 3299 ? 197% |
| Write 4K Q32T1 (MB/s) | 424.6 | 510 20% | 317.4 -25% | 291.7 -31% | 248.9 -41% | 324 ? -24% | 431 ? 2% |
| Read 4K Q32T1 (MB/s) | 255.9 | 339.2 33% | 386.1 51% | 352 38% | 267.6 5% | 322 ? 26% | 504 ? 97% |
| Write Seq Q32T1 (MB/s) | 1300 | 1455 12% | 2510 93% | 468.1 -64% | 534 -59% | 1091 ? -16% | 4671 ? 259% |
| Read Seq Q32T1 (MB/s) | 1723 | 1727 0% | 3560 107% | 1489 -14% | 563 -67% | 1729 ? 0% | 5833 ? 239% |
| 3DMark 06 Standard Score | 11338 points | |
| 3DMark 11 Performance | 2074 points | |
| 3DMark Cloud Gate Standard Score | 9534 points | |
| 3DMark Fire Strike Score | 1168 points | |
Help | ||
| 3DMark 11 - 1280x720 Performance GPU | |
| Average of class Subnotebook (995 - 18489, n=55, last 2 years) | |
| Asus ZenBook 14 UX433FA | |
| Tuxedo InfinityBook Pro 14 | |
| Asus Zenbook 14 UX433FA-A6018T | |
| Huawei MateBook D 14 W50F | |
| Average Intel UHD Graphics 620 (1144 - 3432, n=244) | |
| Acer Swift 3 SF314-55-31N8 | |
| 3DMark | |
| 1920x1080 Fire Strike Graphics | |
| Average of class Subnotebook (832 - 16347, n=56, last 2 years) | |
| Tuxedo InfinityBook Pro 14 | |
| Asus Zenbook 14 UX433FA-A6018T | |
| Huawei MateBook D 14 W50F | |
| Average Intel UHD Graphics 620 (557 - 2608, n=213) | |
| Acer Swift 3 SF314-55-31N8 | |
| 1280x720 Cloud Gate Standard Graphics | |
| Average of class Subnotebook (5577 - 61591, n=28, last 2 years) | |
| Asus ZenBook 14 UX433FA | |
| Tuxedo InfinityBook Pro 14 | |
| Asus Zenbook 14 UX433FA-A6018T | |
| Huawei MateBook D 14 W50F | |
| Average Intel UHD Graphics 620 (6205 - 16400, n=225) | |
| Acer Swift 3 SF314-55-31N8 | |
| 2560x1440 Time Spy Graphics | |
| Average of class Subnotebook (804 - 6288, n=55, last 2 years) | |
| Asus ZenBook 14 UX433FA | |
| Average Intel UHD Graphics 620 (299 - 797, n=88) | |
| low | med. | high | ultra | |
|---|---|---|---|---|
| BioShock Infinite (2013) | 67.4 | 36.7 | 31 | 9.9 |
Noise level
| Idle |
| 30.5 / 30.5 / 30.9 dB(A) |
| Load |
| 32.7 / 31.5 dB(A) |
 | ||
30 dB silent 40 dB(A) audible 50 dB(A) loud |
||
min: | ||
(±) The maximum temperature on the upper side is 41 °C / 106 F, compared to the average of 35.9 °C / 97 F, ranging from 21.4 to 59 °C for the class Subnotebook.
(±) The bottom heats up to a maximum of 41.4 °C / 107 F, compared to the average of 39.2 °C / 103 F
(+) In idle usage, the average temperature for the upper side is 25 °C / 77 F, compared to the device average of 30.8 °C / 87 F.
(+) The palmrests and touchpad are cooler than skin temperature with a maximum of 30.4 °C / 86.7 F and are therefore cool to the touch.
(-) The average temperature of the palmrest area of similar devices was 28.2 °C / 82.8 F (-2.2 °C / -3.9 F).
Asus Zenbook 14 UX433FA-A6018T audio analysis
(±) | speaker loudness is average but good (75.1 dB)
Bass 100 - 315 Hz
(-) | nearly no bass - on average 18% lower than median
(±) | linearity of bass is average (9.9% delta to prev. frequency)
Mids 400 - 2000 Hz
(+) | balanced mids - only 3.7% away from median
(+) | mids are linear (5.3% delta to prev. frequency)
Highs 2 - 16 kHz
(+) | balanced highs - only 4.1% away from median
(+) | highs are linear (4.5% delta to prev. frequency)
Overall 100 - 16.000 Hz
(±) | linearity of overall sound is average (17.1% difference to median)
Compared to same class
» 43% of all tested devices in this class were better, 9% similar, 48% worse
» The best had a delta of 5%, average was 18%, worst was 53%
Compared to all devices tested
» 31% of all tested devices were better, 8% similar, 61% worse
» The best had a delta of 4%, average was 24%, worst was 134%
Acer Swift 3 SF314-55-31N8 audio analysis
(-) | not very loud speakers (64.7 dB)
Bass 100 - 315 Hz
(-) | nearly no bass - on average 17.1% lower than median
(+) | bass is linear (5.3% delta to prev. frequency)
Mids 400 - 2000 Hz
(+) | balanced mids - only 3.1% away from median
(+) | mids are linear (6.8% delta to prev. frequency)
Highs 2 - 16 kHz
(+) | balanced highs - only 1.8% away from median
(+) | highs are linear (3.8% delta to prev. frequency)
Overall 100 - 16.000 Hz
(±) | linearity of overall sound is average (19.4% difference to median)
Compared to same class
» 60% of all tested devices in this class were better, 7% similar, 33% worse
» The best had a delta of 5%, average was 18%, worst was 53%
Compared to all devices tested
» 48% of all tested devices were better, 7% similar, 45% worse
» The best had a delta of 4%, average was 24%, worst was 134%
Huawei MateBook D 14 W50F audio analysis
(±) | speaker loudness is average but good (72 dB)
Bass 100 - 315 Hz
(-) | nearly no bass - on average 17.3% lower than median
(-) | bass is not linear (15.5% delta to prev. frequency)
Mids 400 - 2000 Hz
(±) | higher mids - on average 7.4% higher than median
(±) | linearity of mids is average (9.6% delta to prev. frequency)
Highs 2 - 16 kHz
(+) | balanced highs - only 3% away from median
(+) | highs are linear (5.2% delta to prev. frequency)
Overall 100 - 16.000 Hz
(±) | linearity of overall sound is average (23.2% difference to median)
Compared to same class
» 65% of all tested devices in this class were better, 8% similar, 27% worse
» The best had a delta of 7%, average was 21%, worst was 53%
Compared to all devices tested
» 69% of all tested devices were better, 5% similar, 25% worse
» The best had a delta of 4%, average was 24%, worst was 134%
| Off / Standby | |
| Idle | |
| Load |
|
Key:
min: | |
| Battery Runtime - WiFi Websurfing | |
| Average of class Subnotebook (7.25 - 26.4, n=59, last 2 years) | |
| Asus ZenBook 14 UX433FA | |
| Acer Swift 3 SF314-55-31N8 | |
| Huawei MateBook D 14 W50F | |
| Asus Zenbook 14 UX433FA-A6018T | |
| Tuxedo InfinityBook Pro 14 | |
Pros
Cons
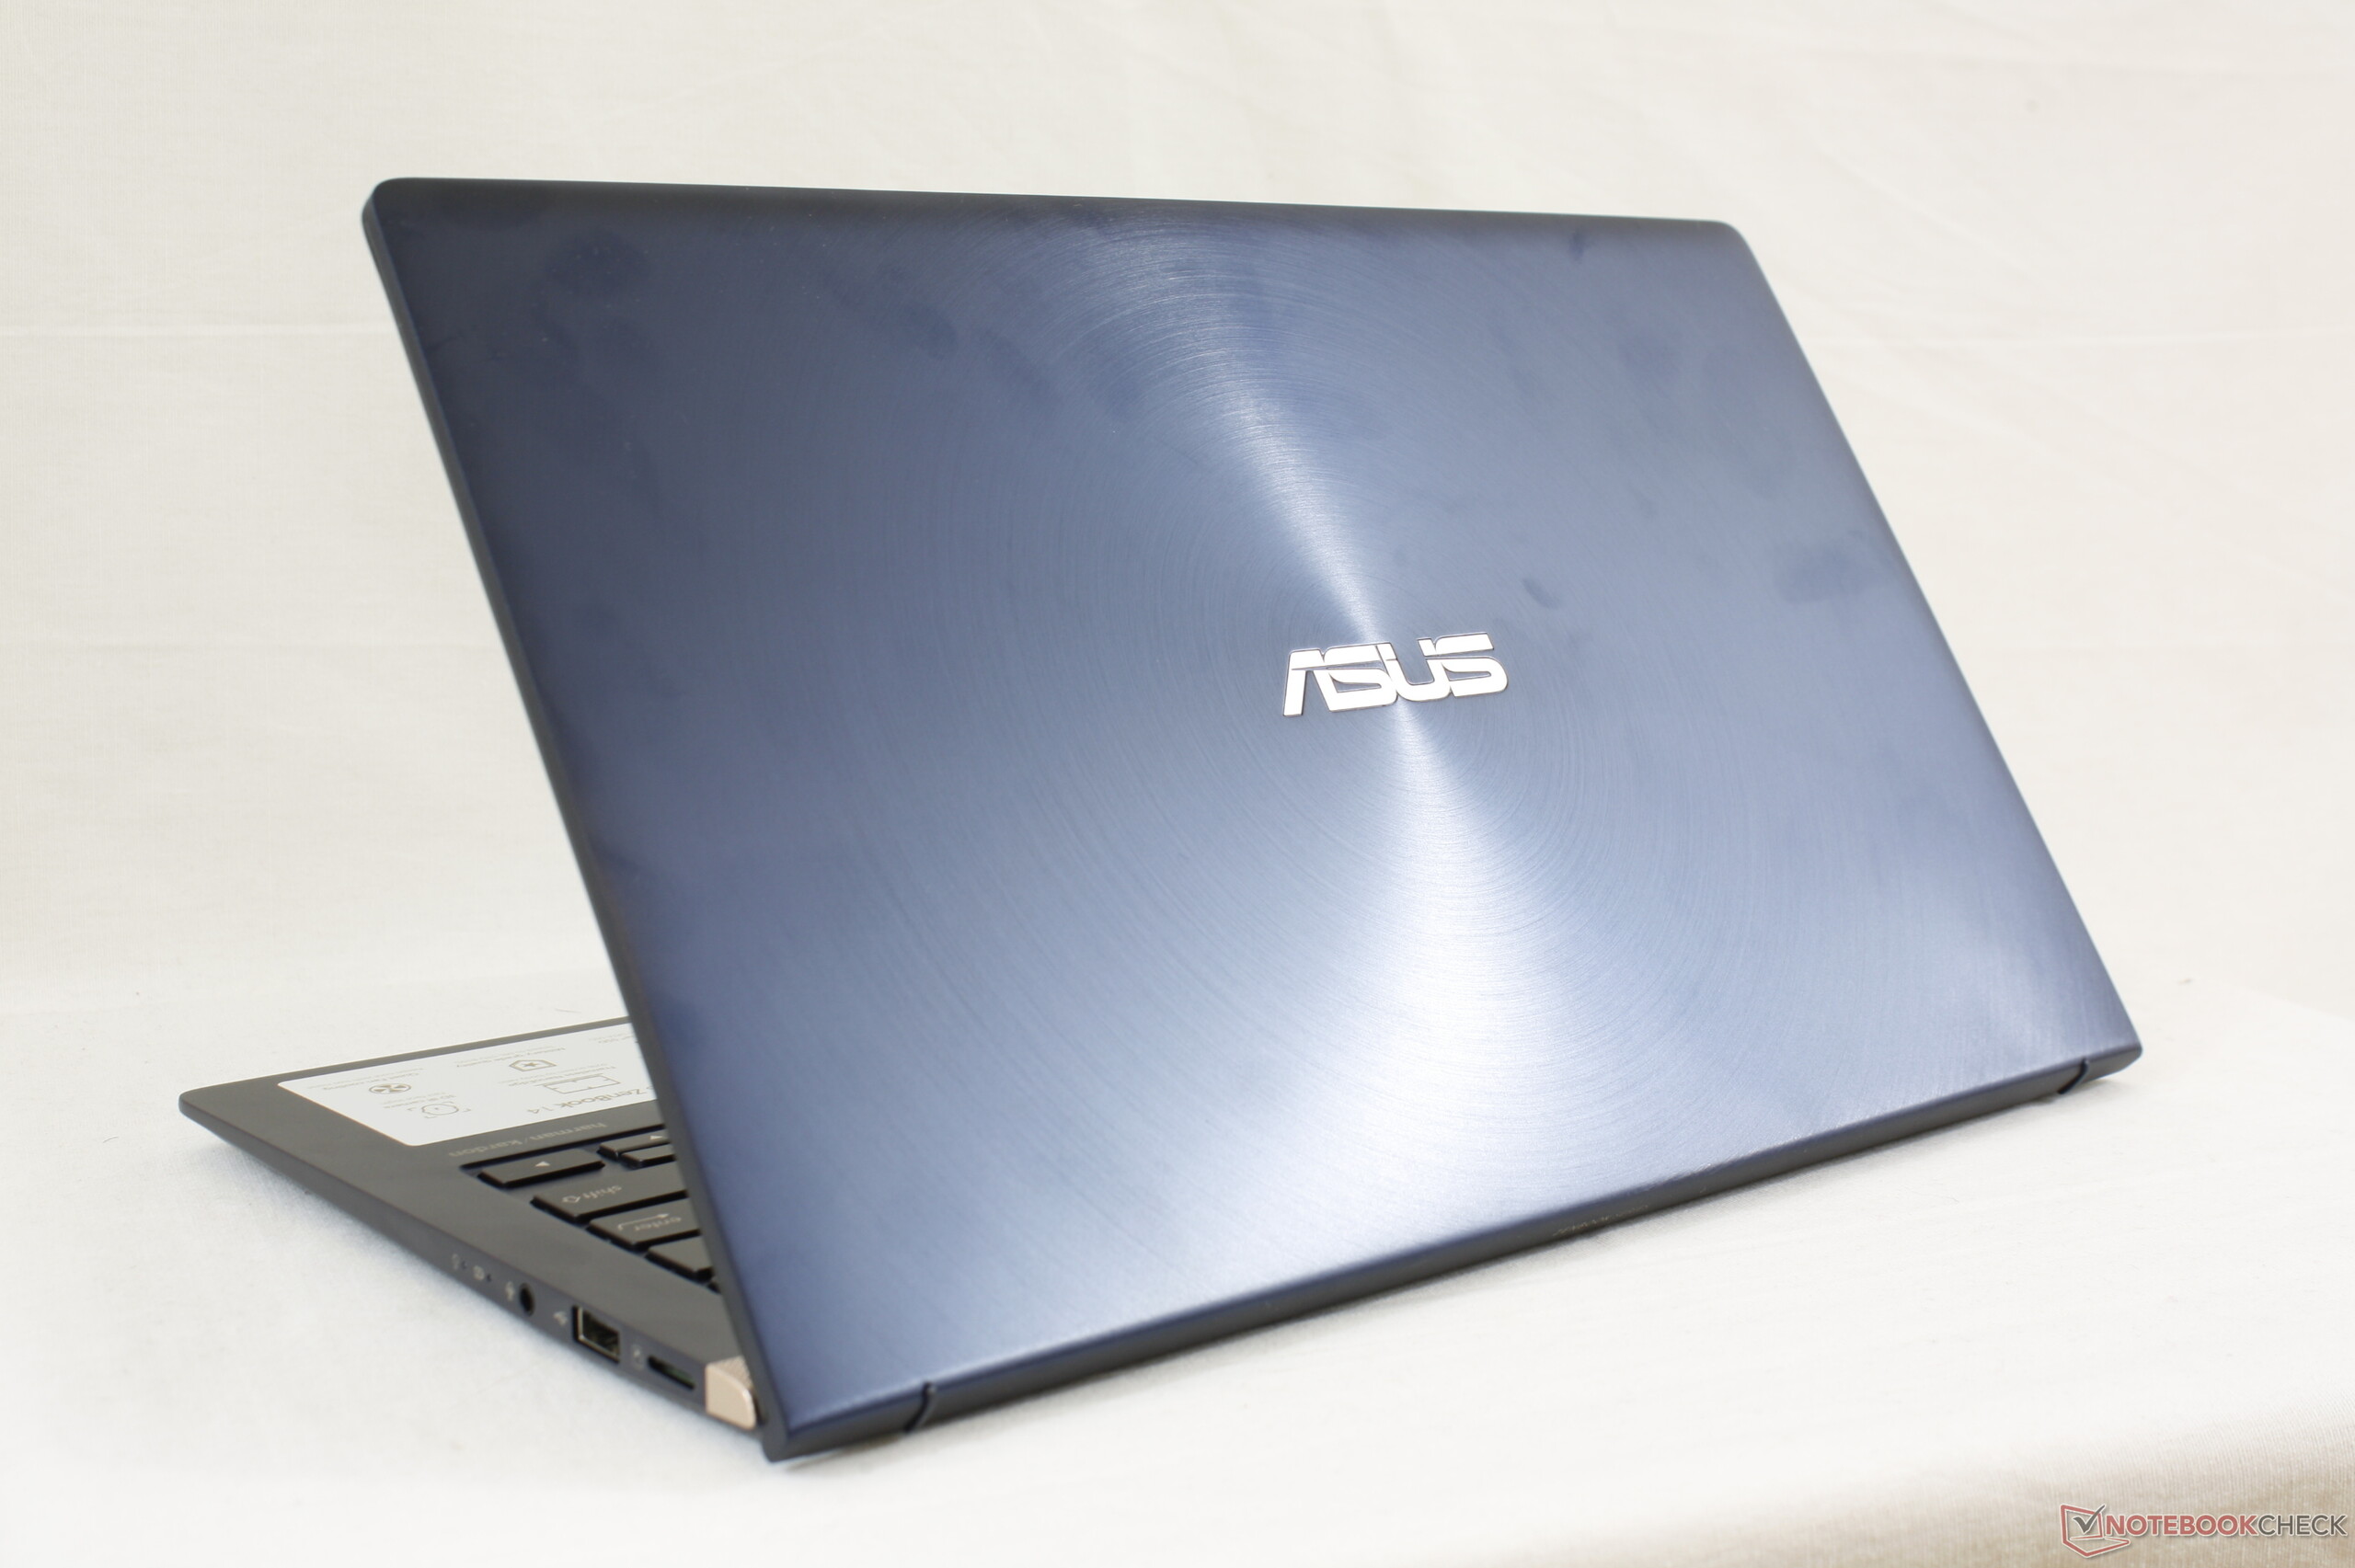
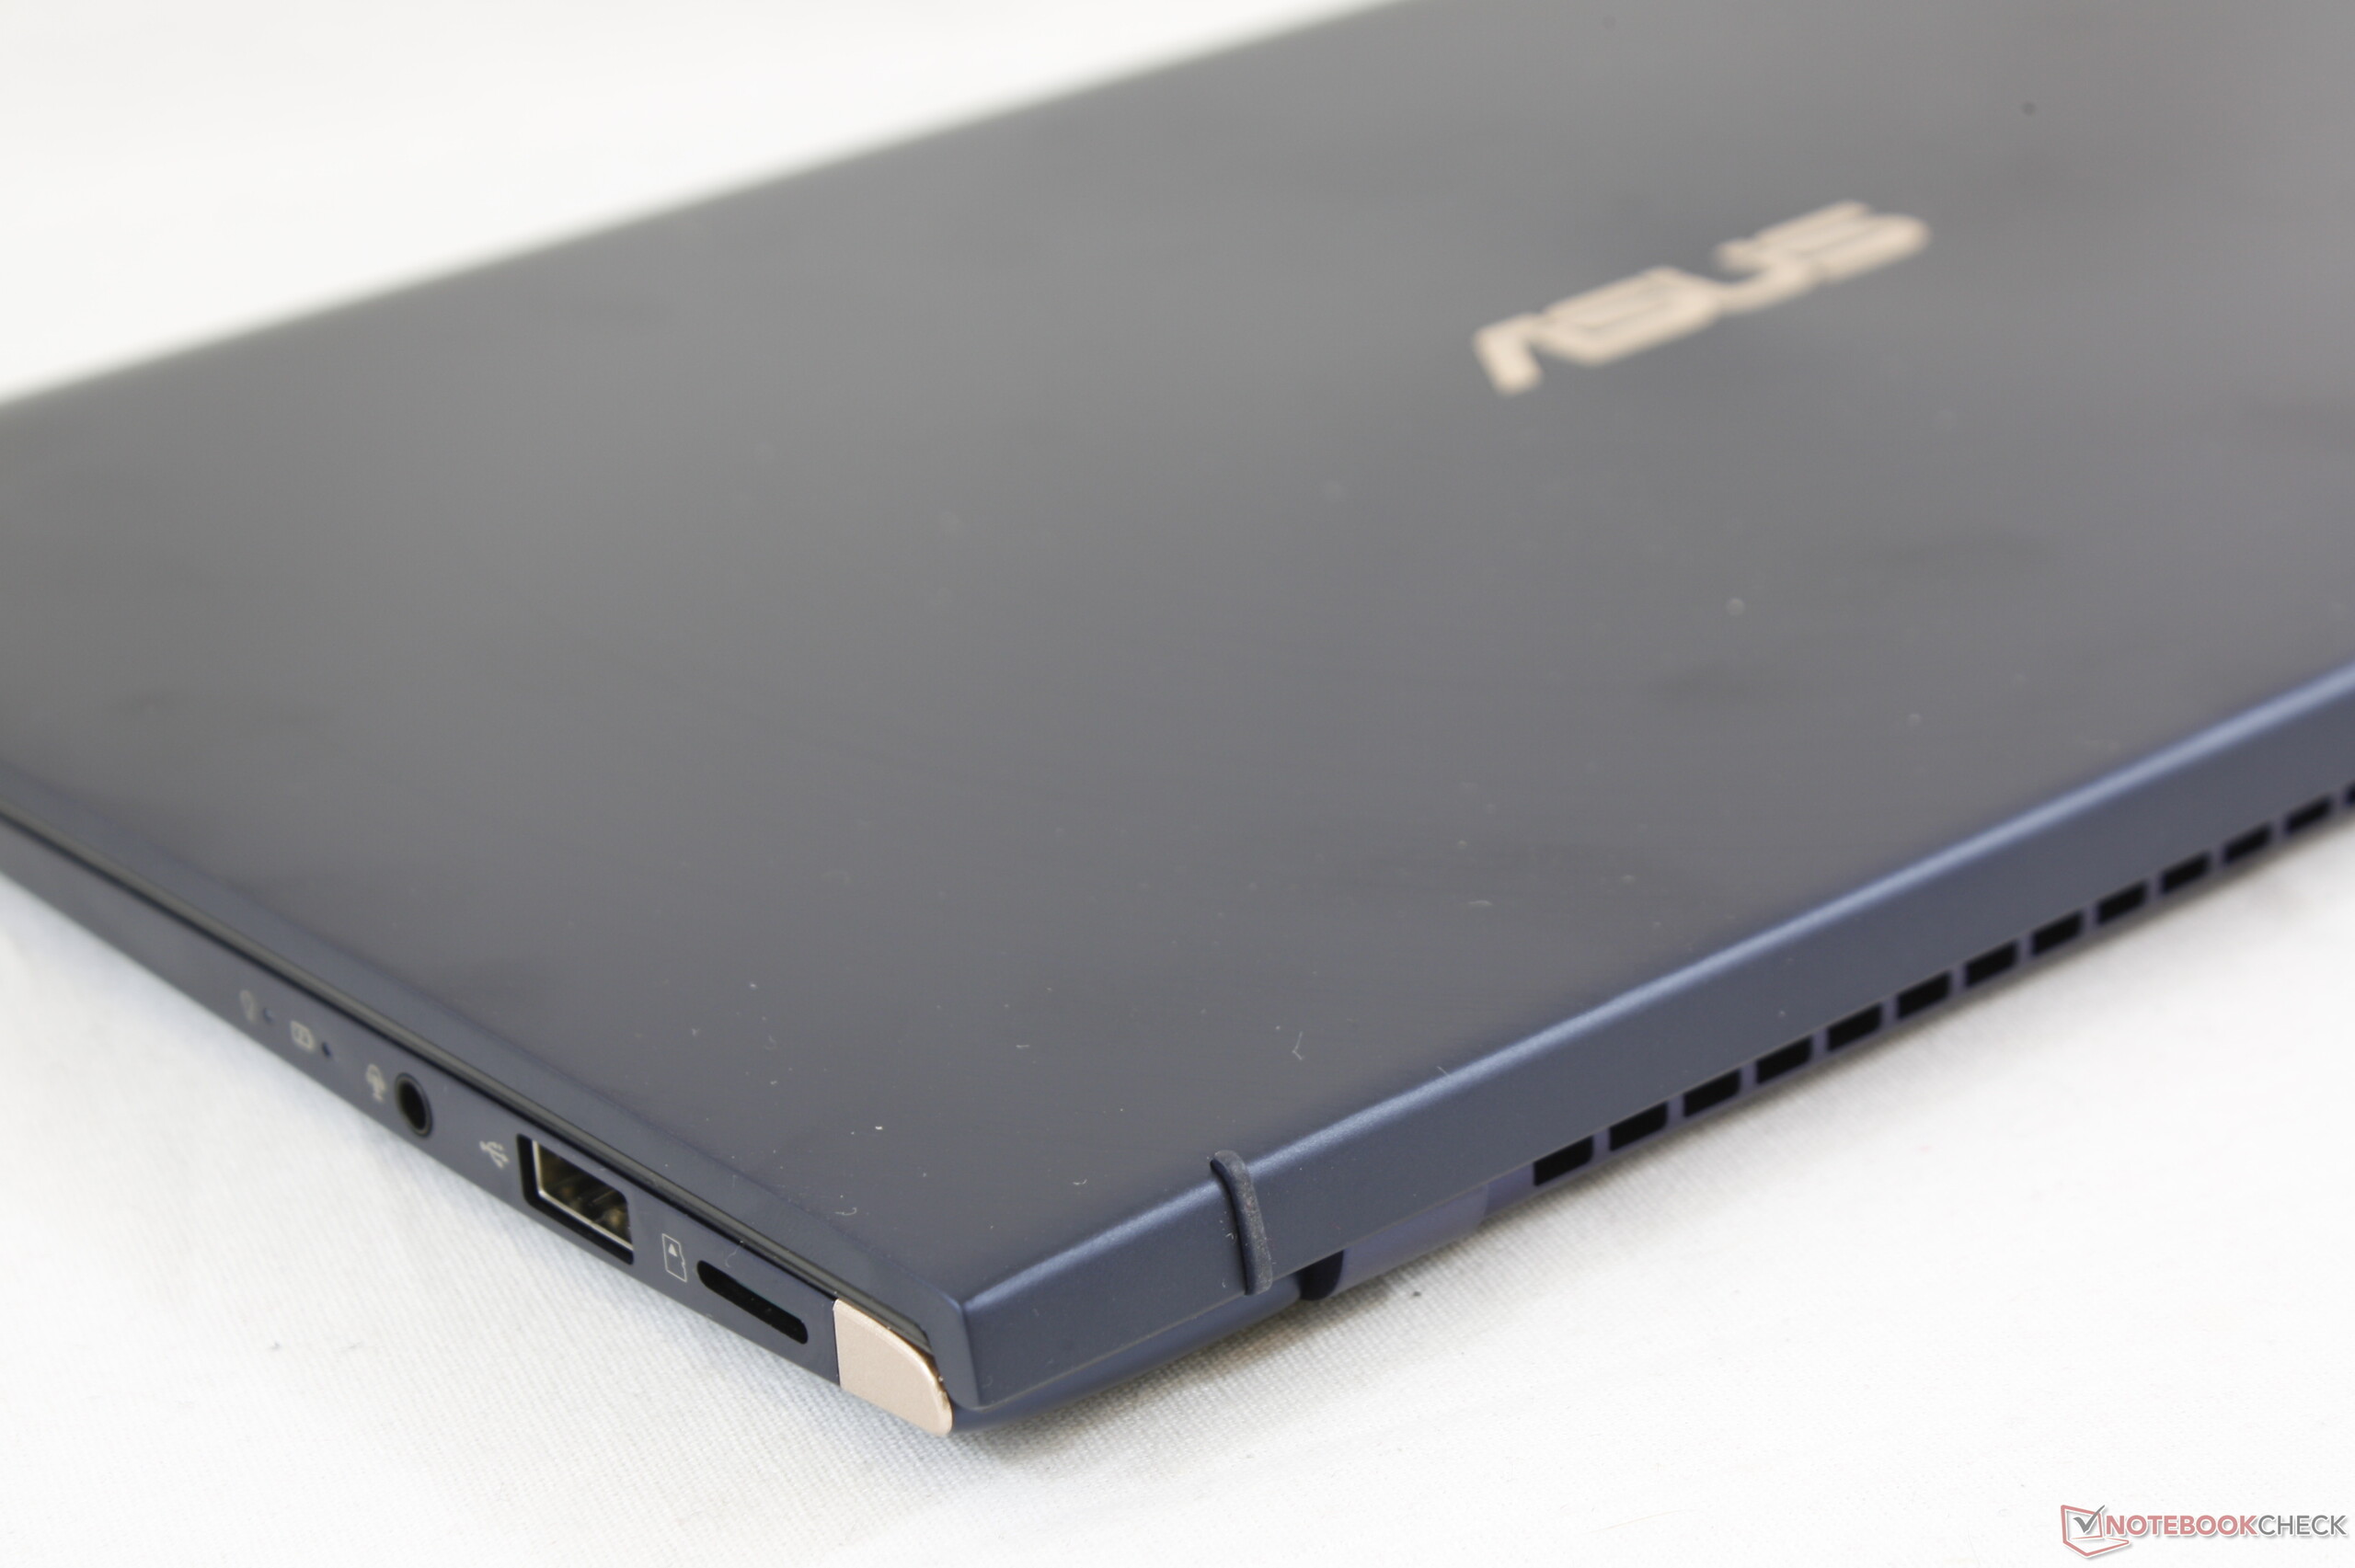
华硕灵耀U 2代UX433FA-A6061T是一款纤薄,时尚,小巧的14英寸笔记本电脑。它的金属外壳做工很好,其Whiskey-Lake Core i5处理器应该为大多数程序和用途提供足够的性能。A6061T也非常安静,因此在噪音敏感的环境中使用它时应该没有什么问题。
“华硕灵耀U 2代UX433FA-A6061T是一款精心设计且功能强大的14英寸笔记本电脑,但是它的低亮度显示屏和BIOS都让人失望。“
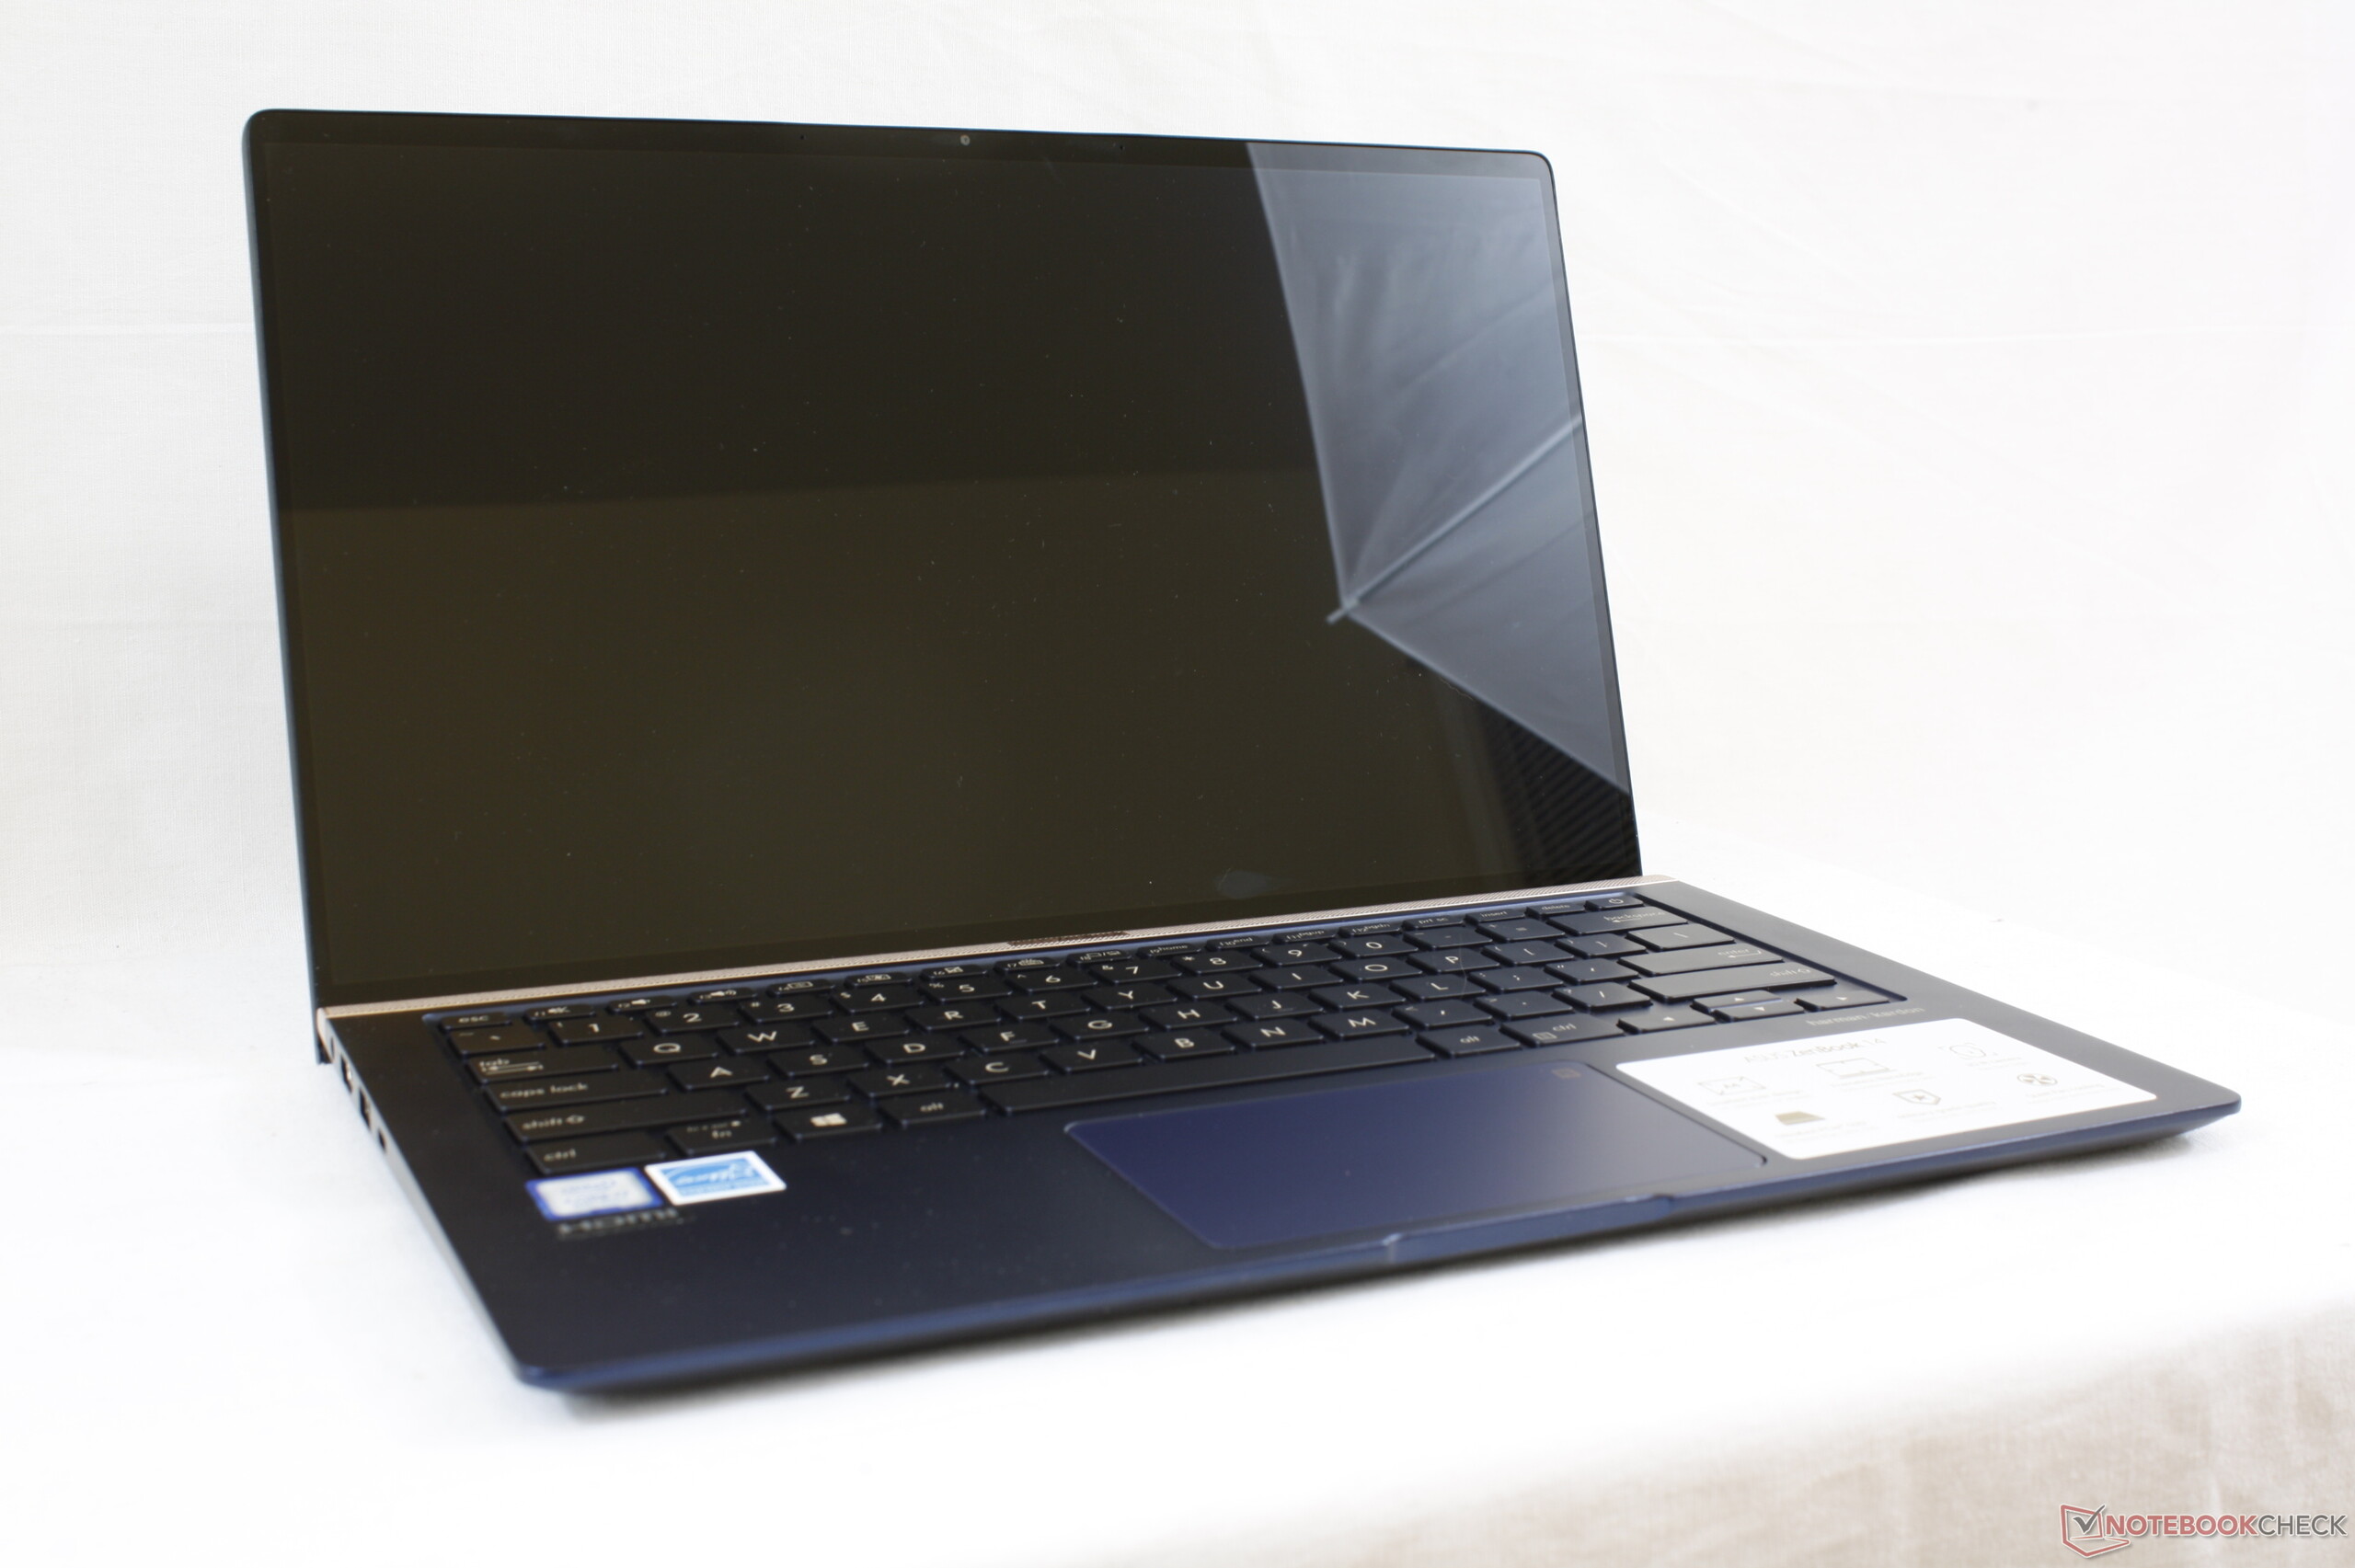
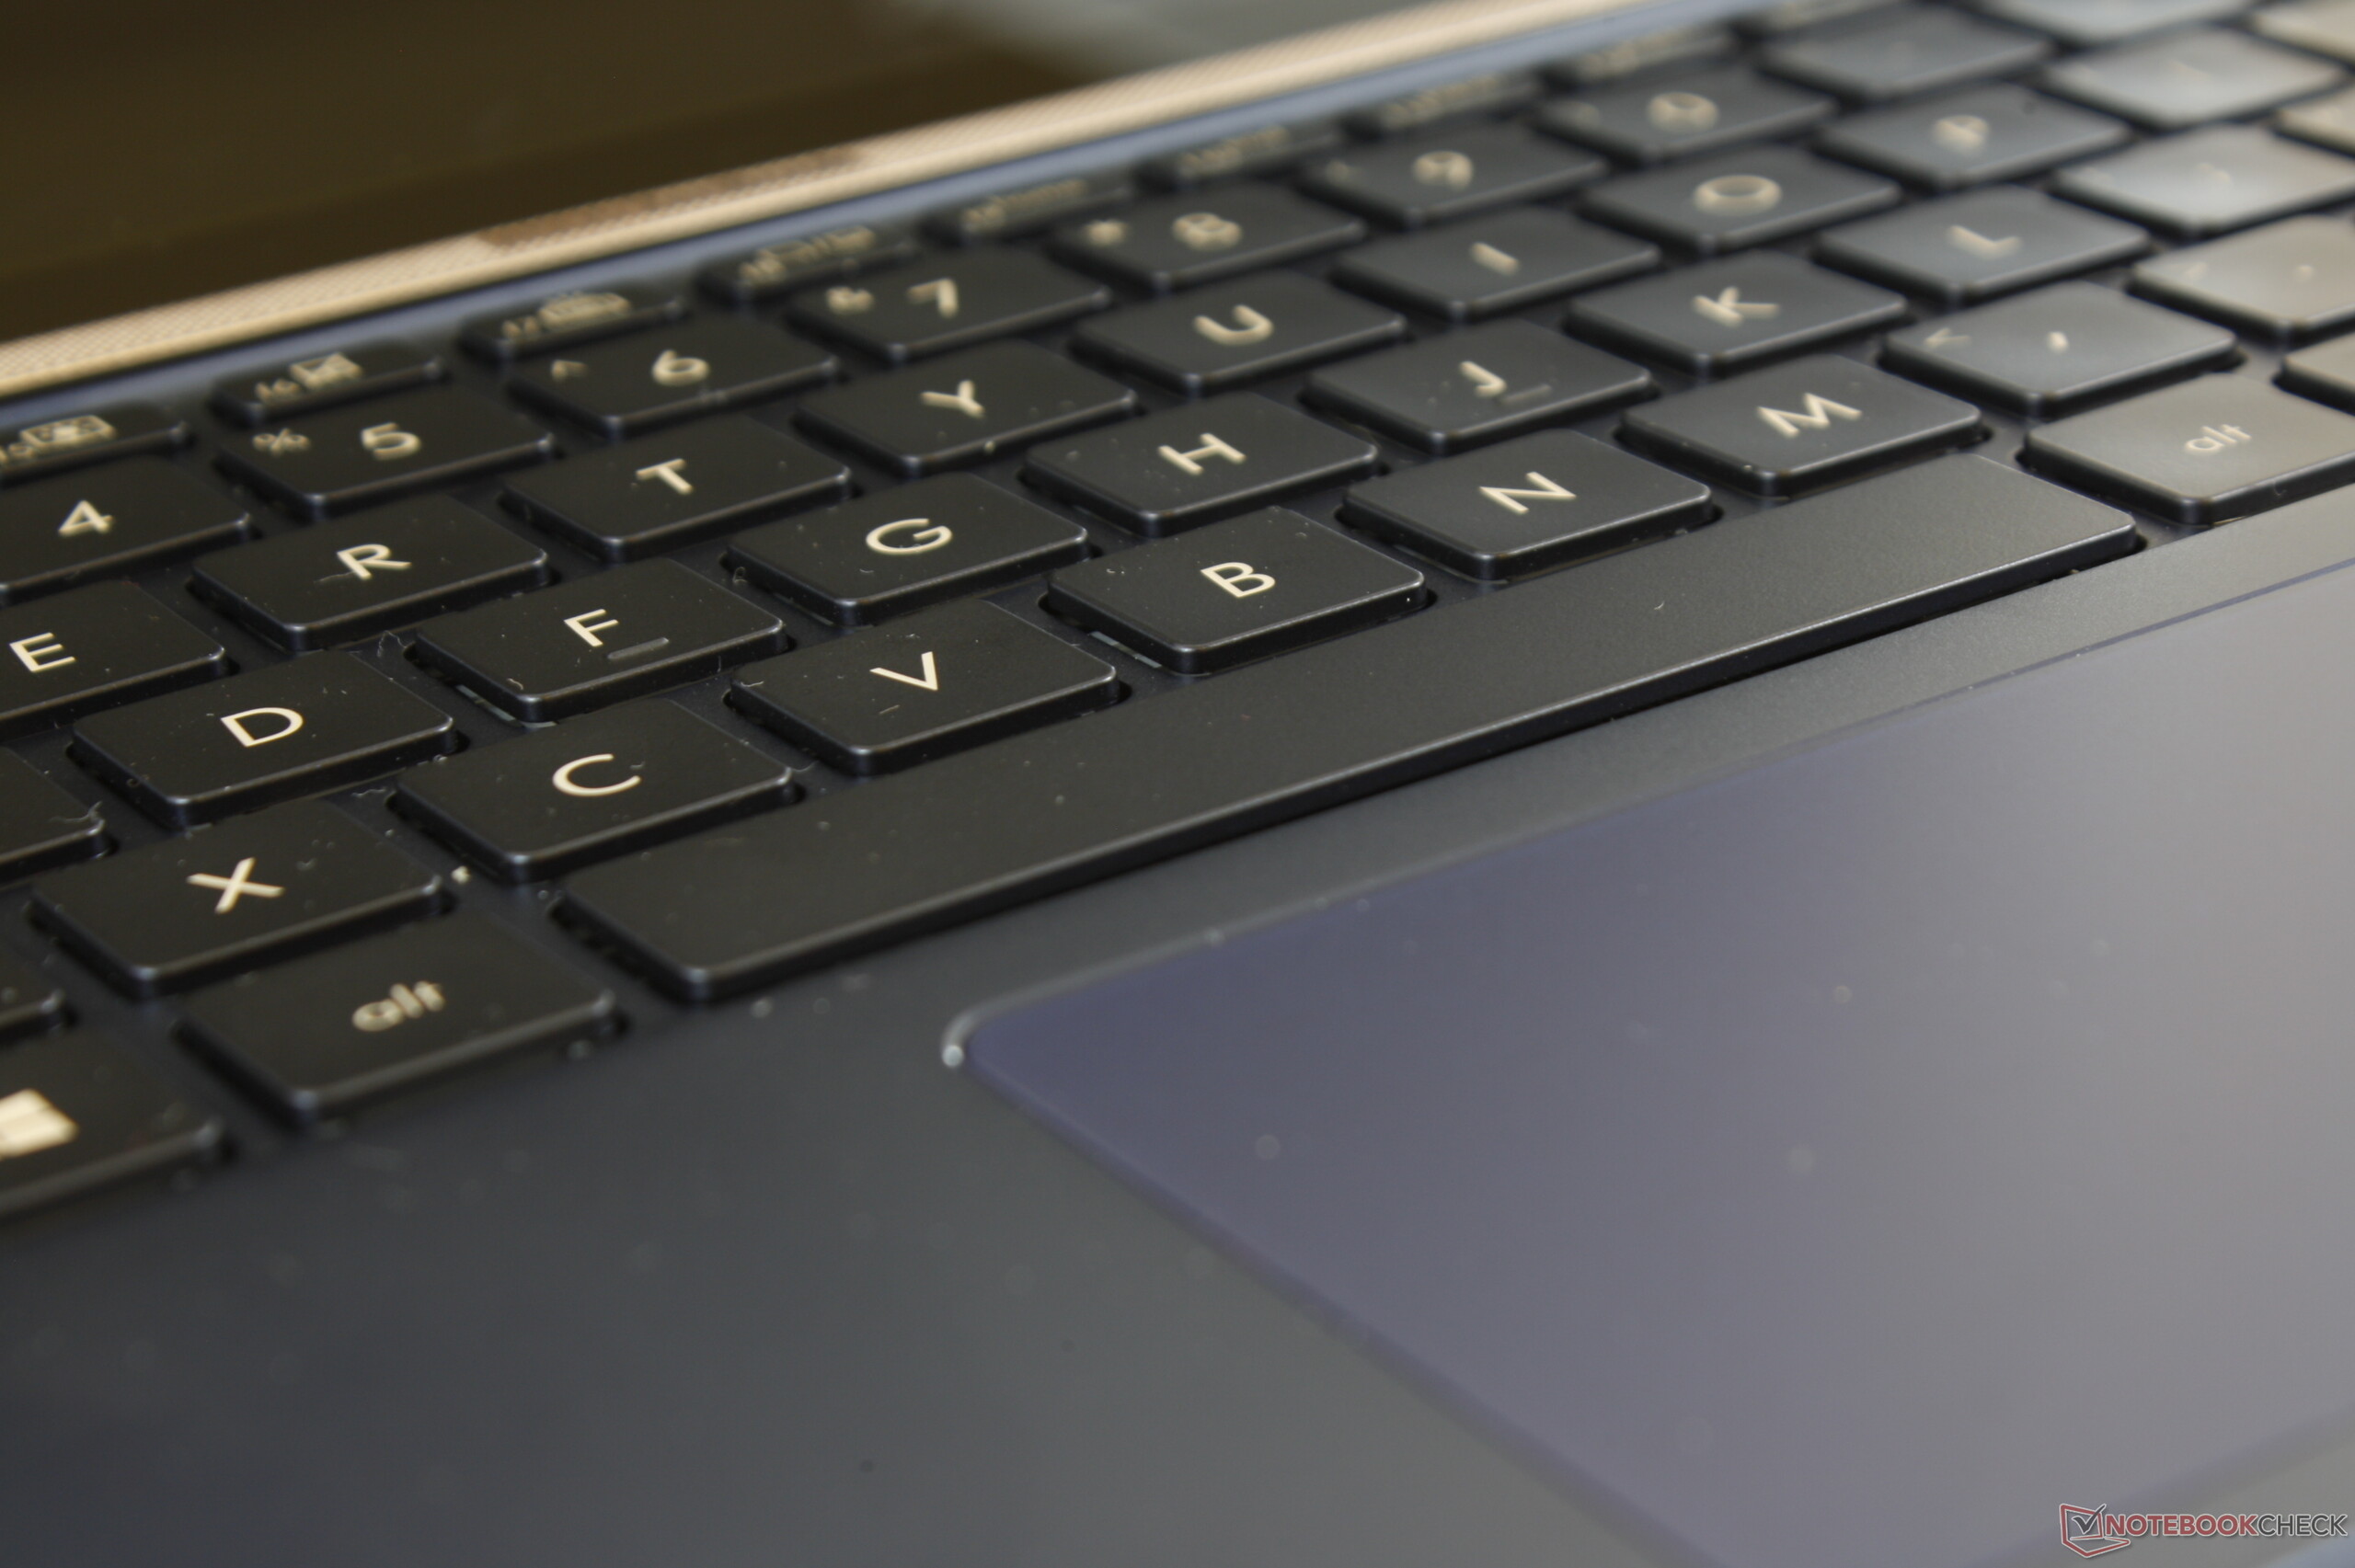
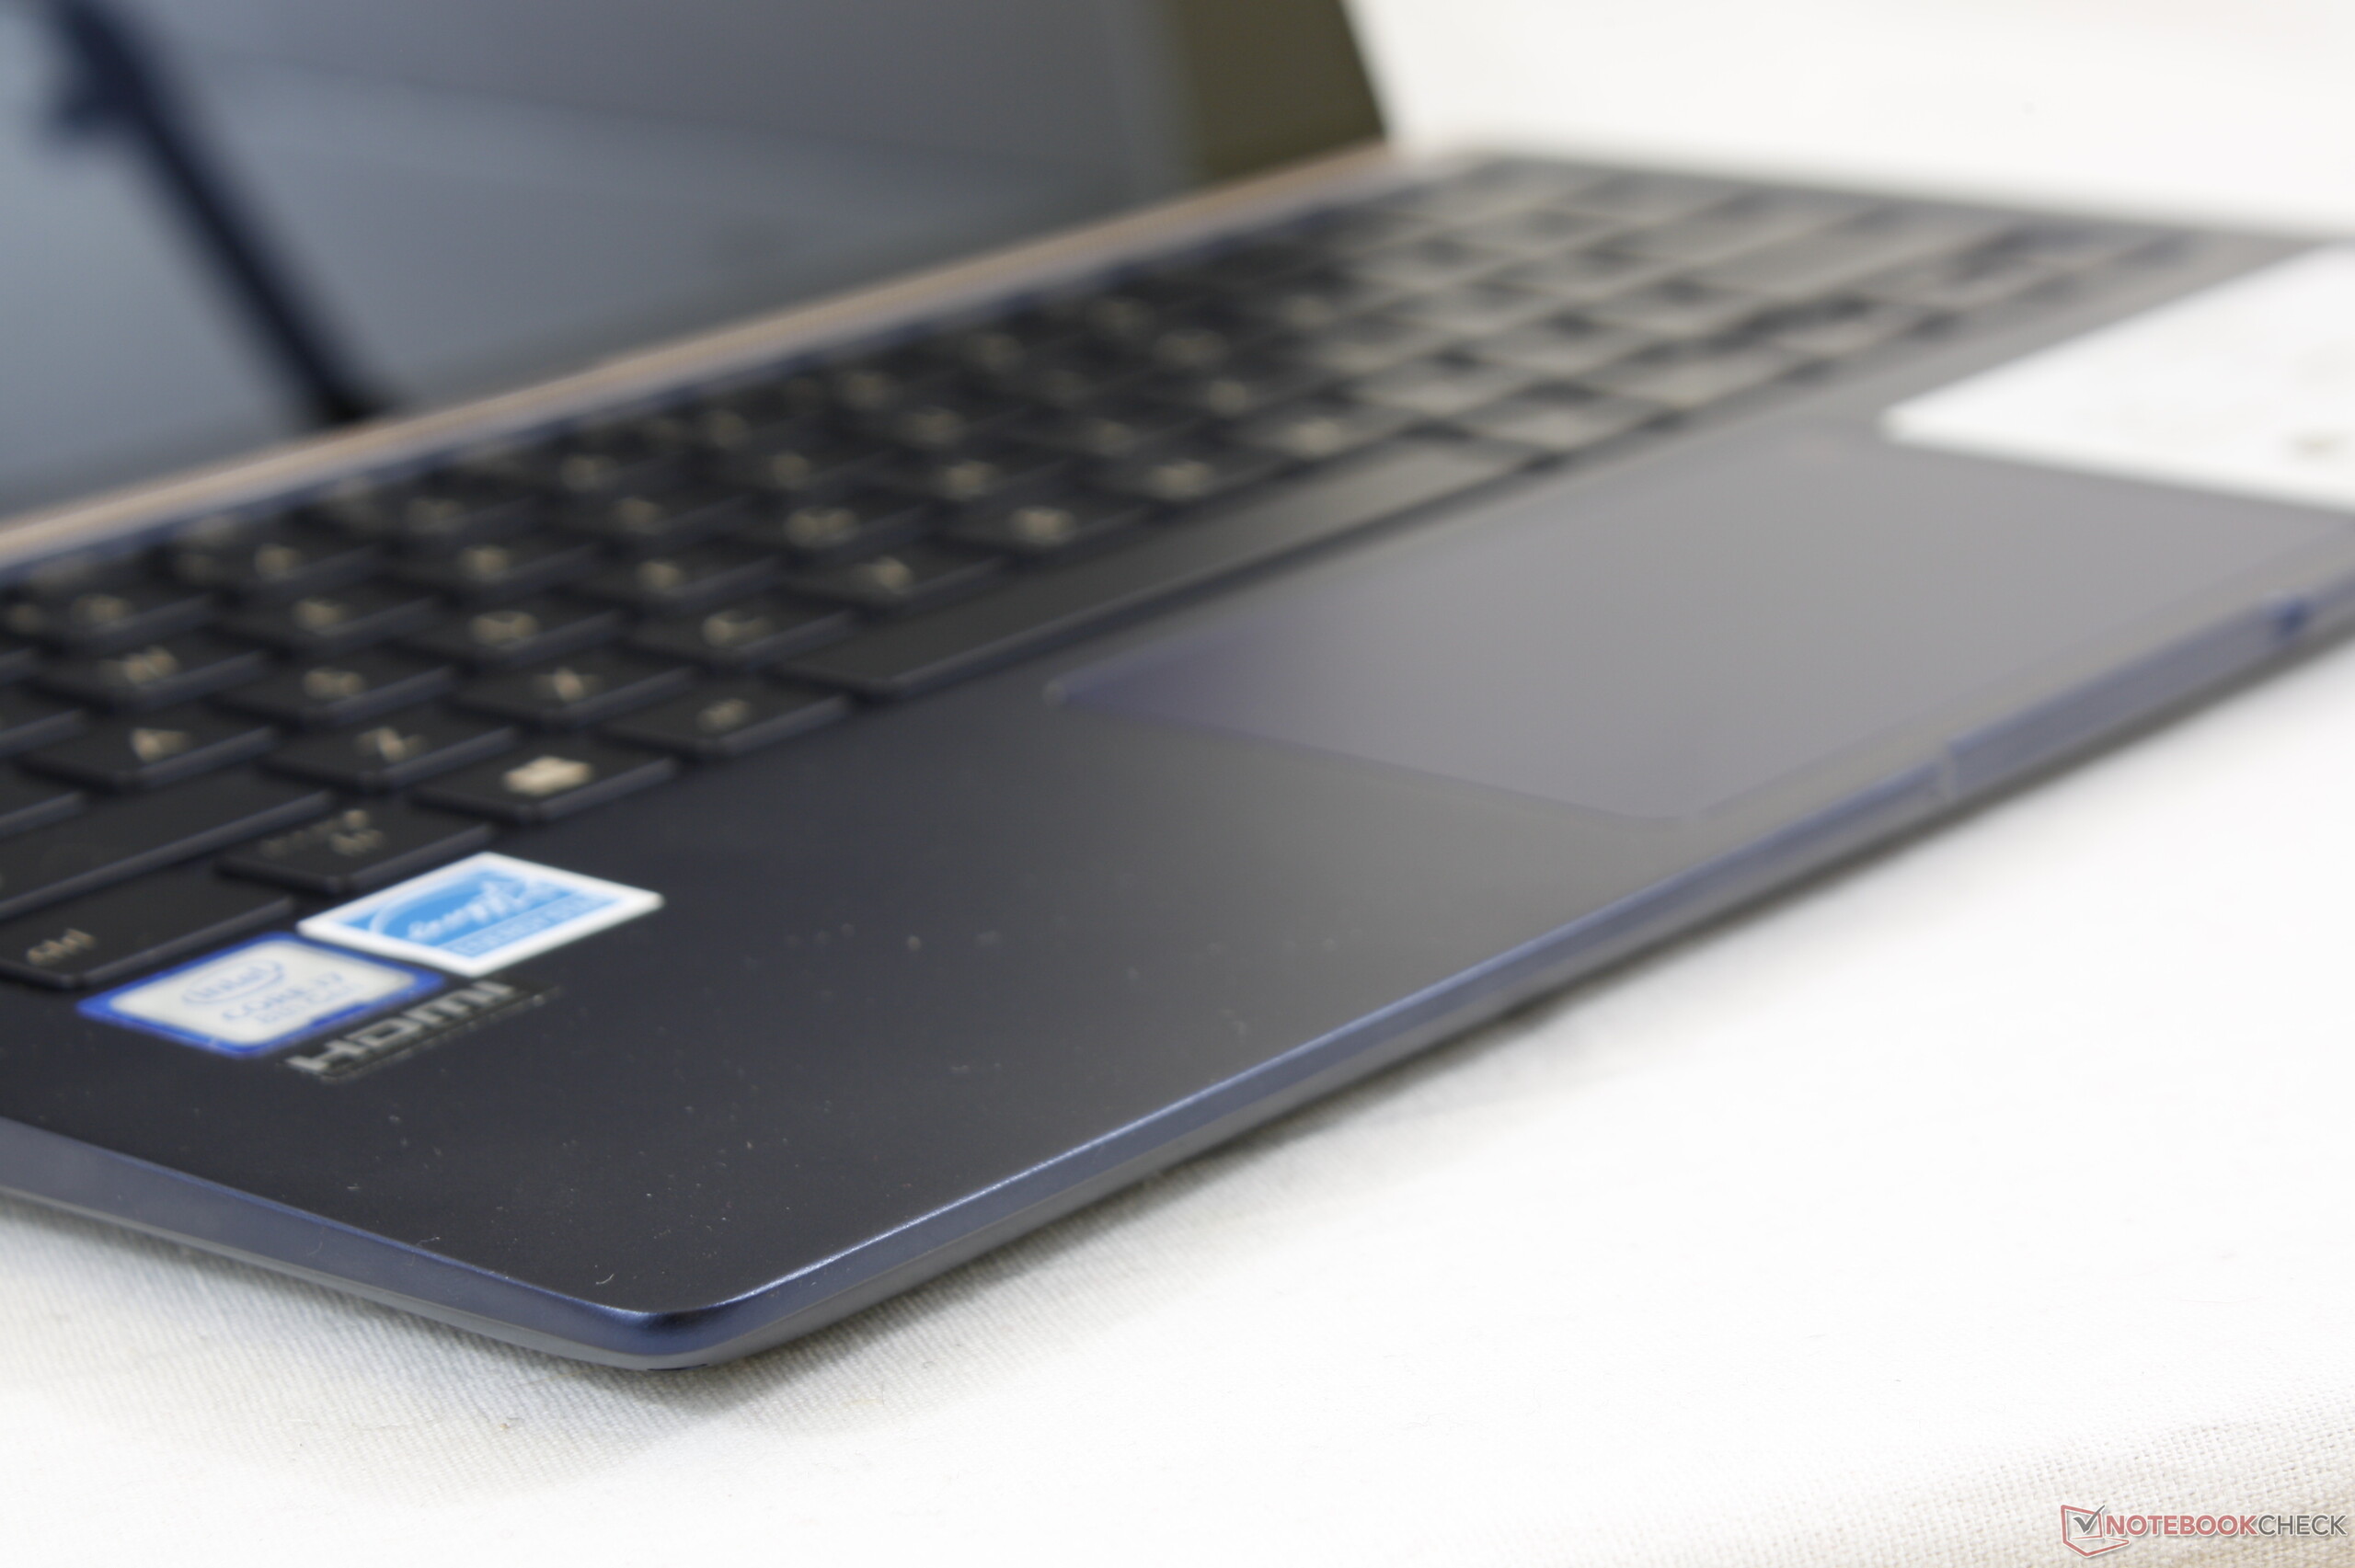
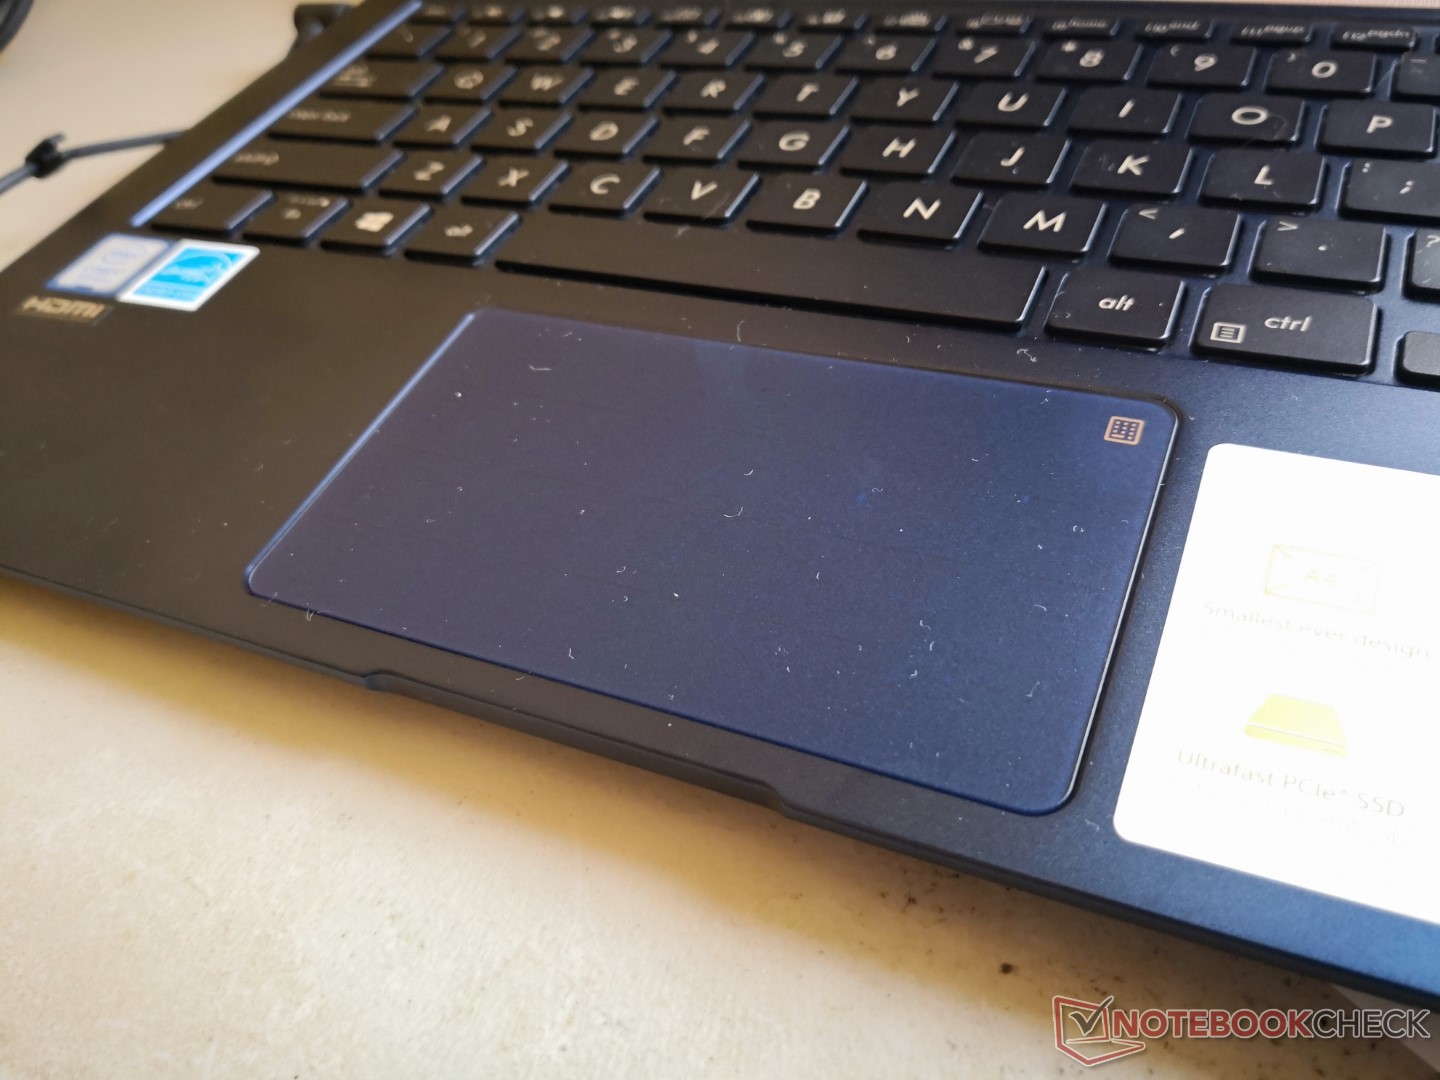
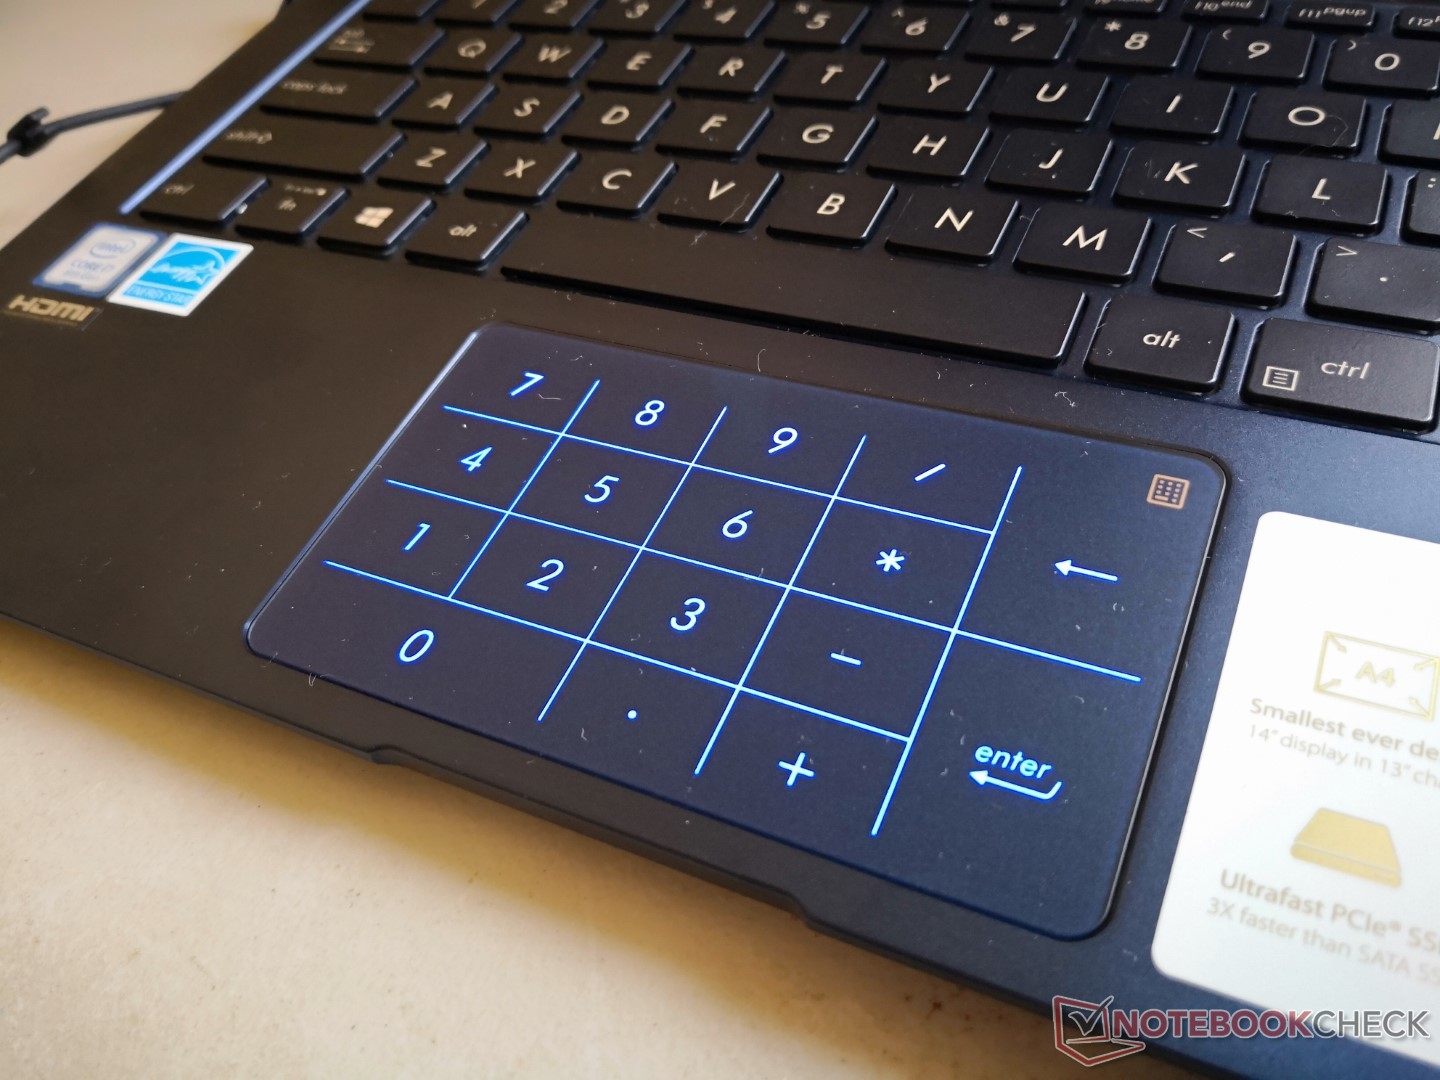
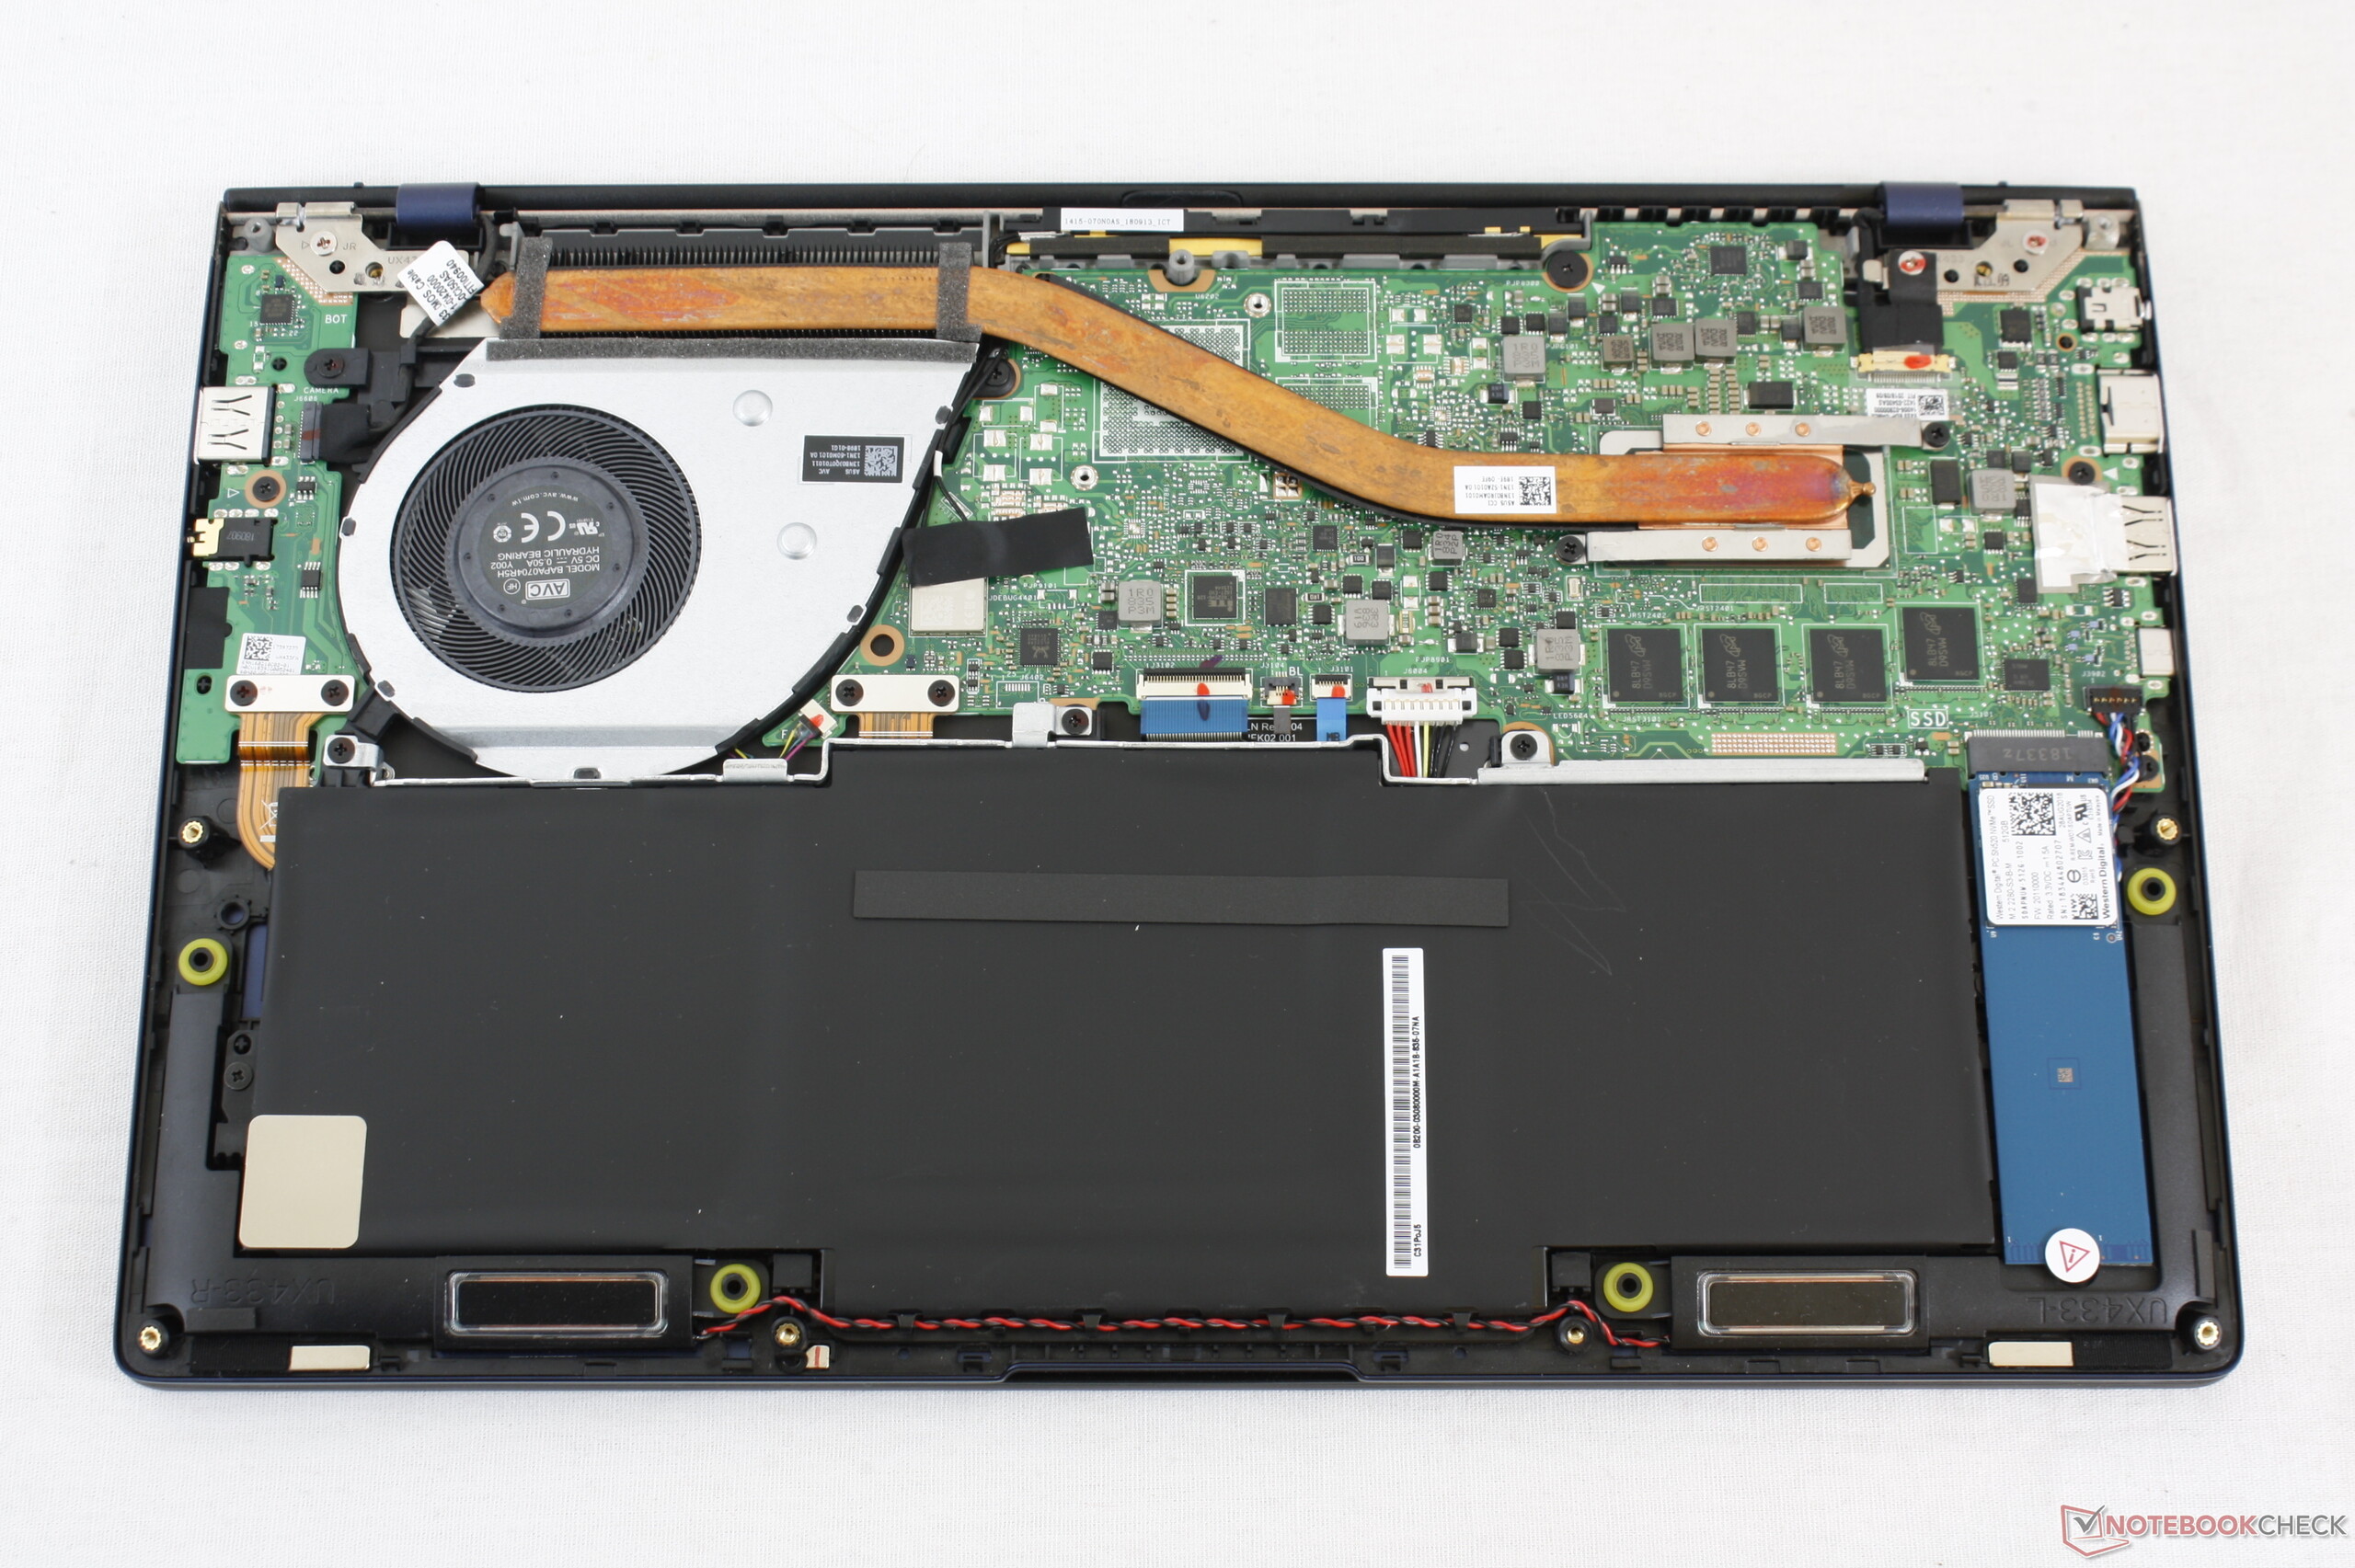
NVMe SSD也很不错,因为它可确保系统流畅地运行。如果存储空间不足,您可以随时更换SSD,但必须对设备进行拆卸才能执行此操作。键盘也很不错,而其隐藏的数字键盘很有趣,可能对于某些人来说非常实用。
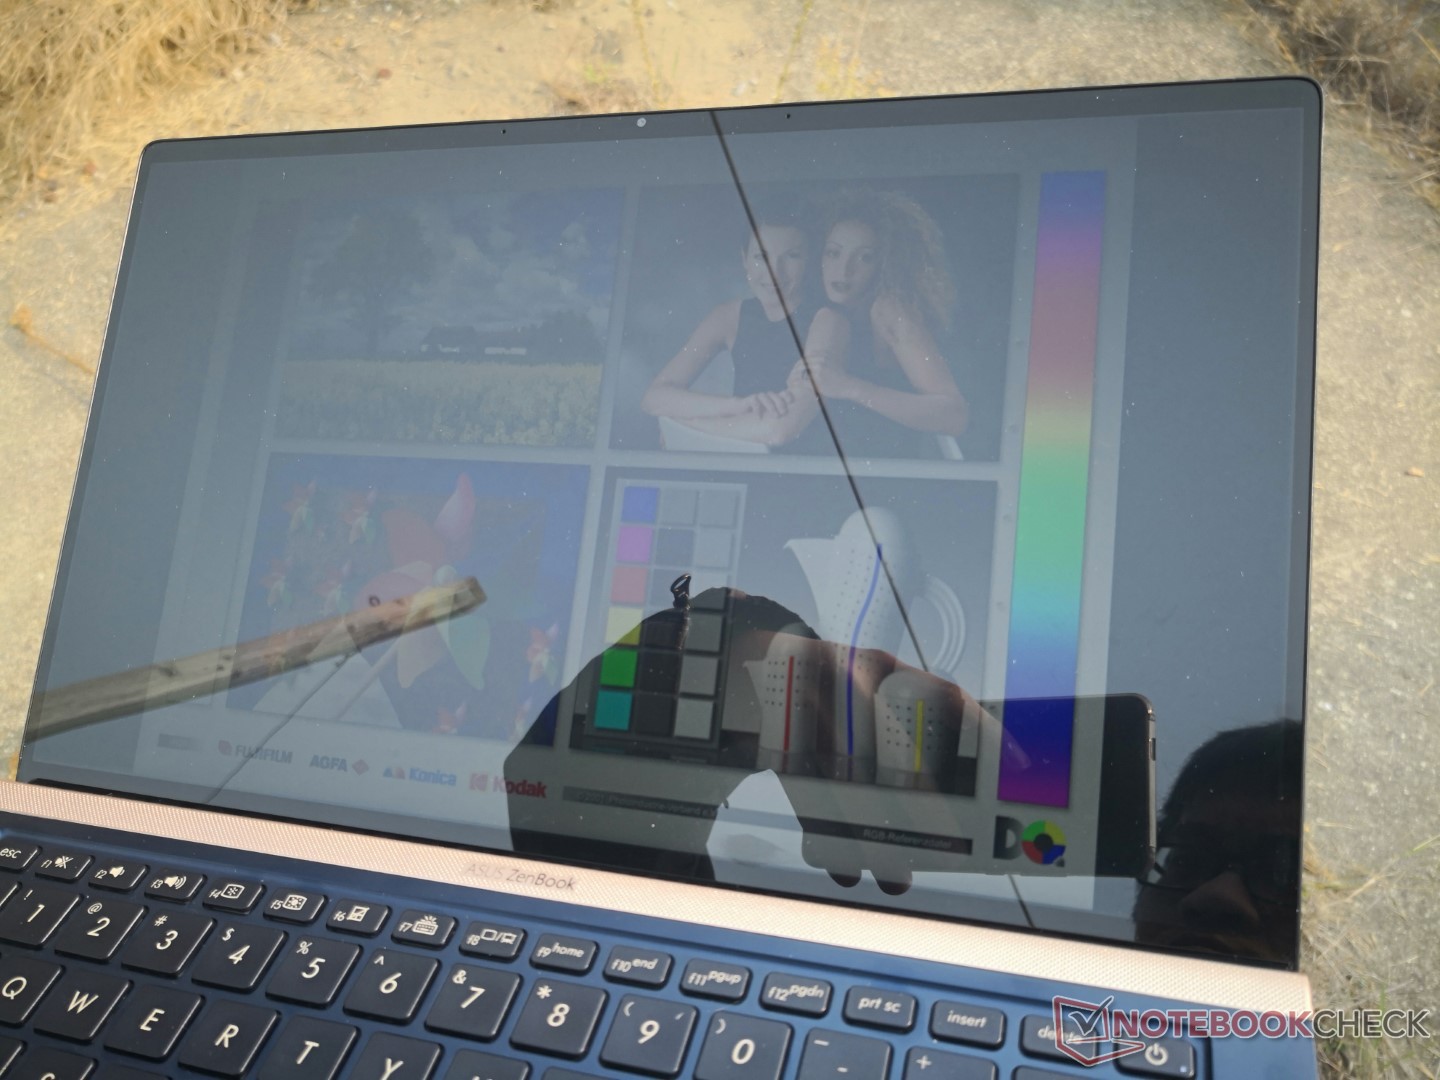
UX433FA-A6061T也具有良好的电池寿命,但奇怪的是它比其功能更强大的同型号更短,尽管电池尺寸相同。此外,IPS显示屏具有稳定的视角和良好的对比度,但我们认为亮度还是太低。我们不喜欢华硕选择了亮面屏的决定,因为它具有高反光性,但这是大多数现代笔记本电脑都有的问题。
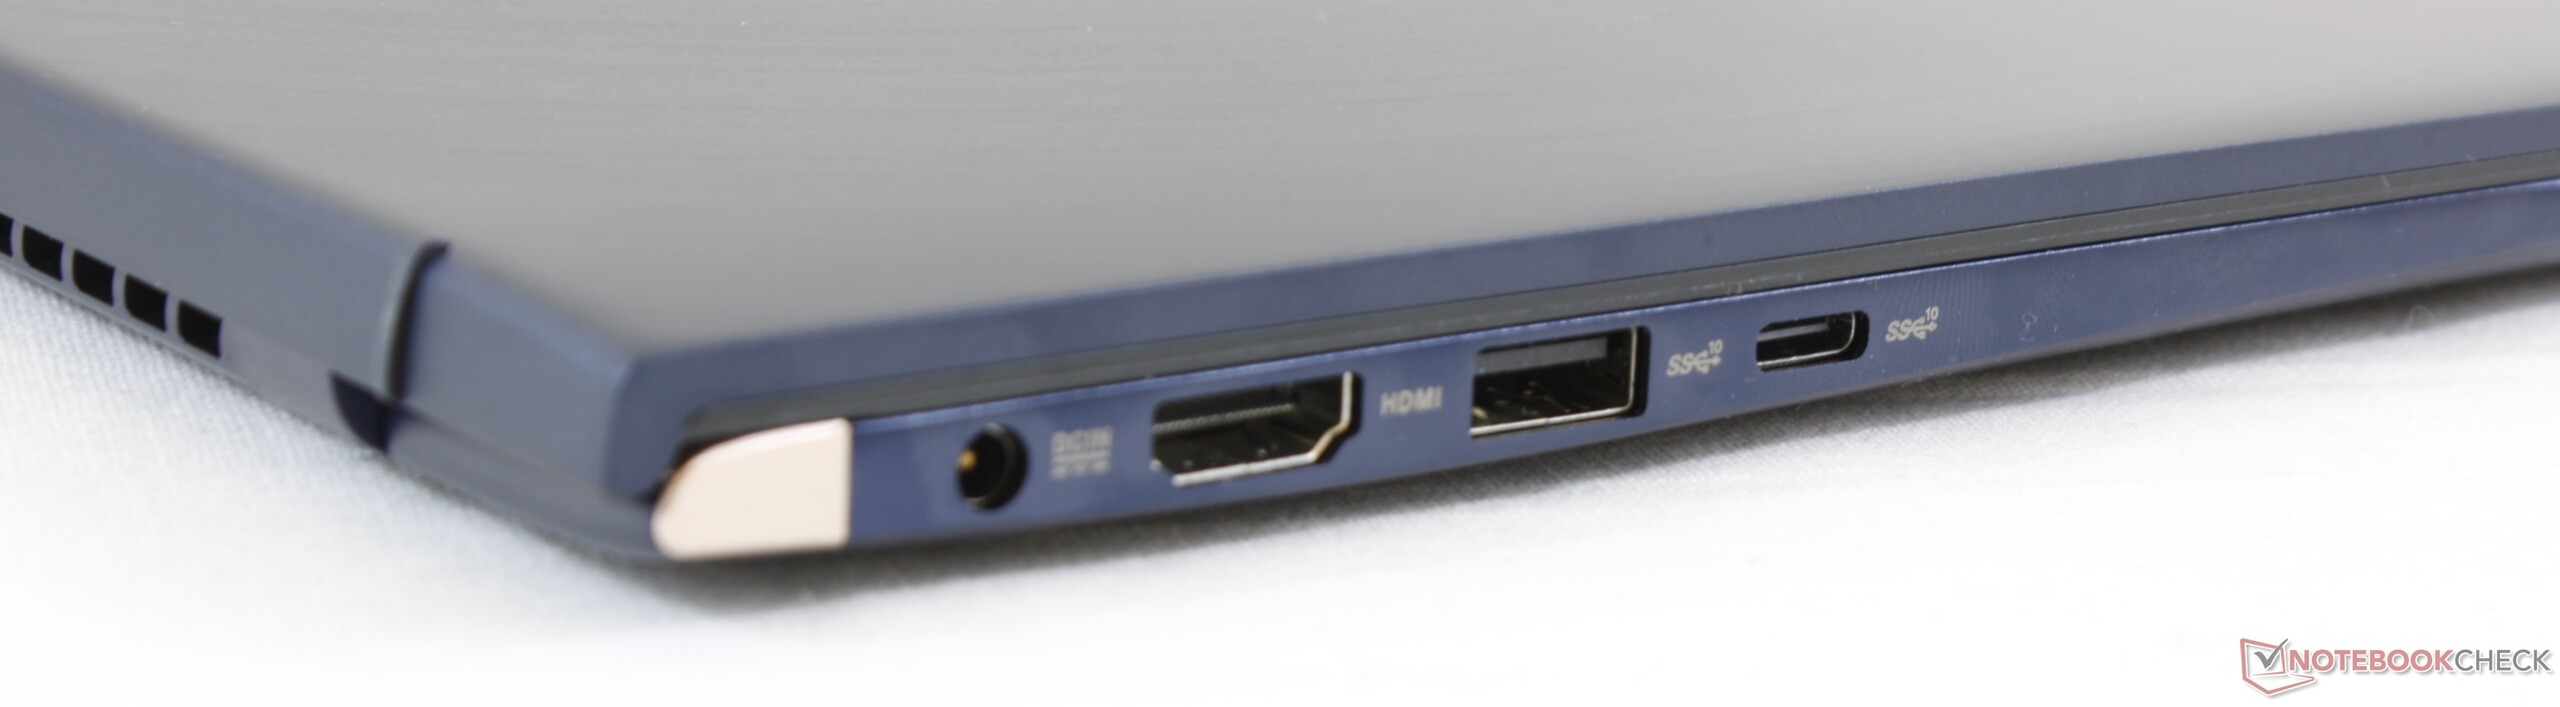
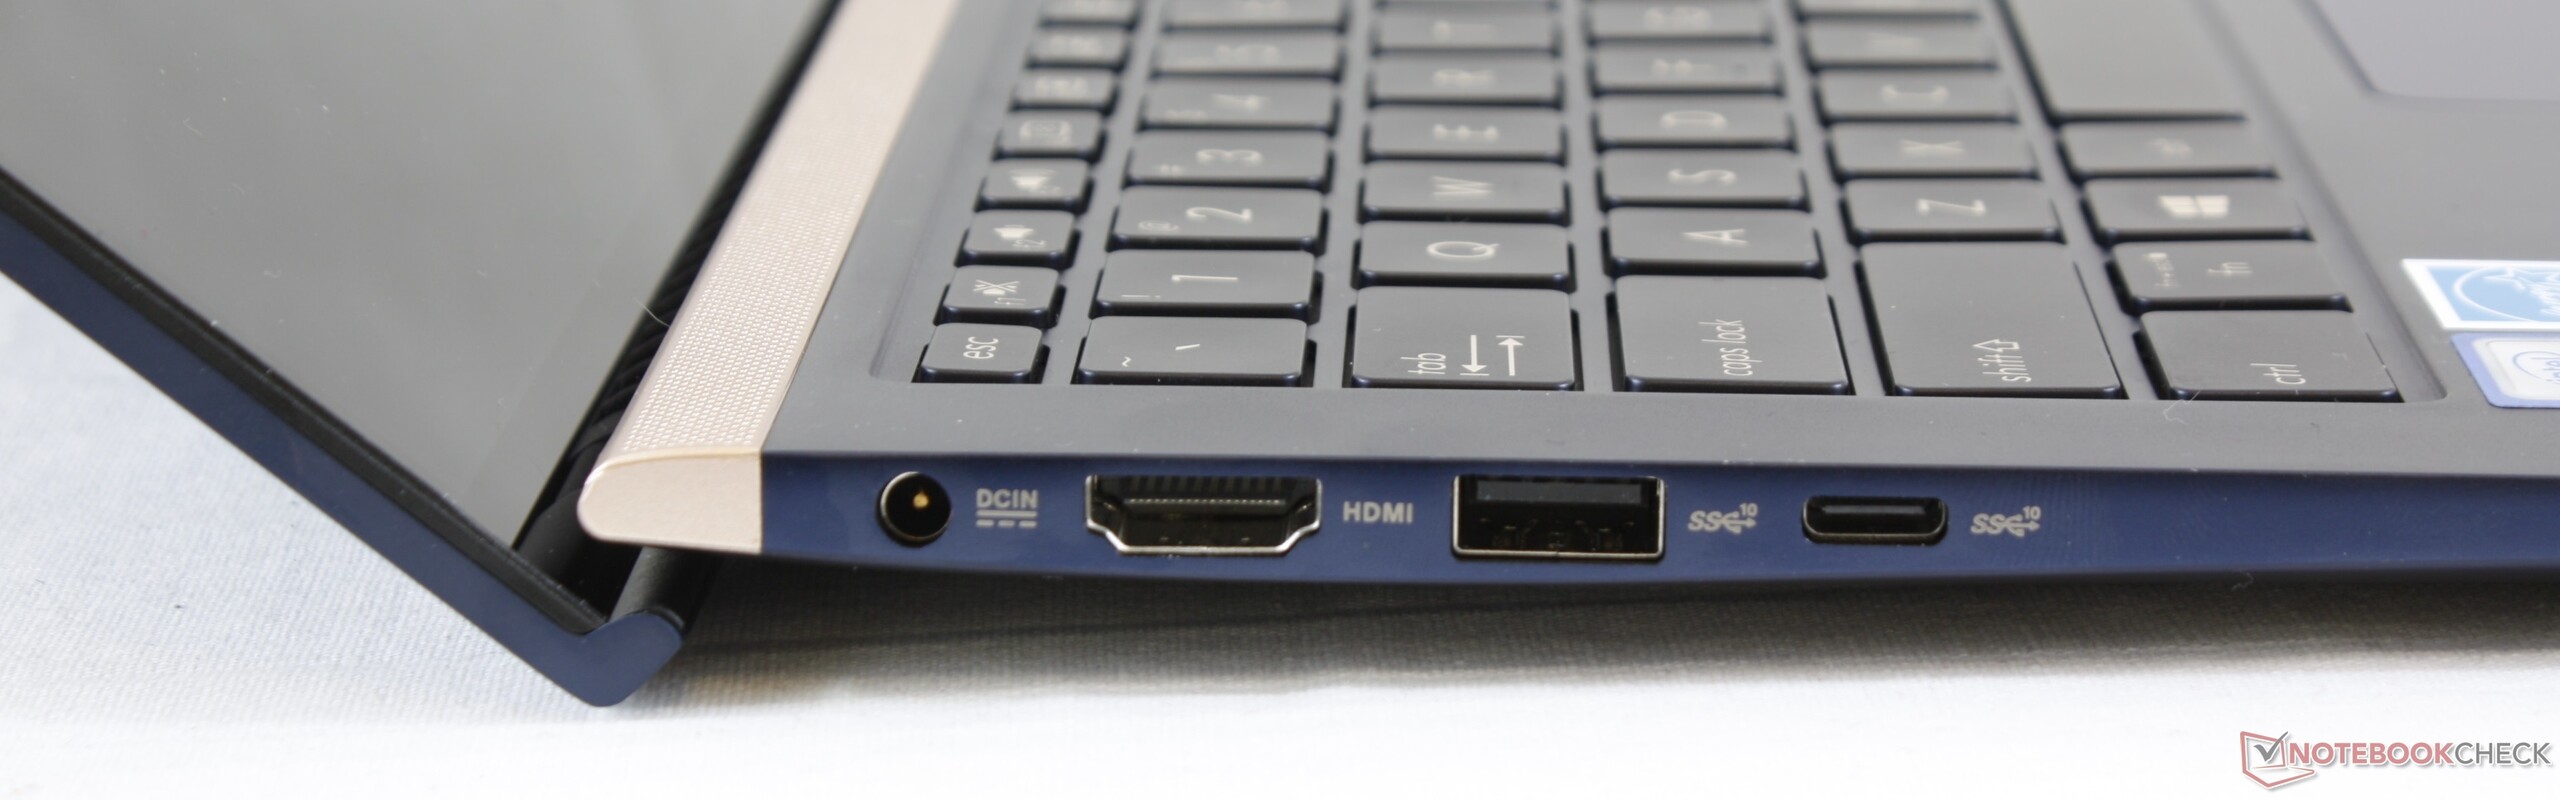
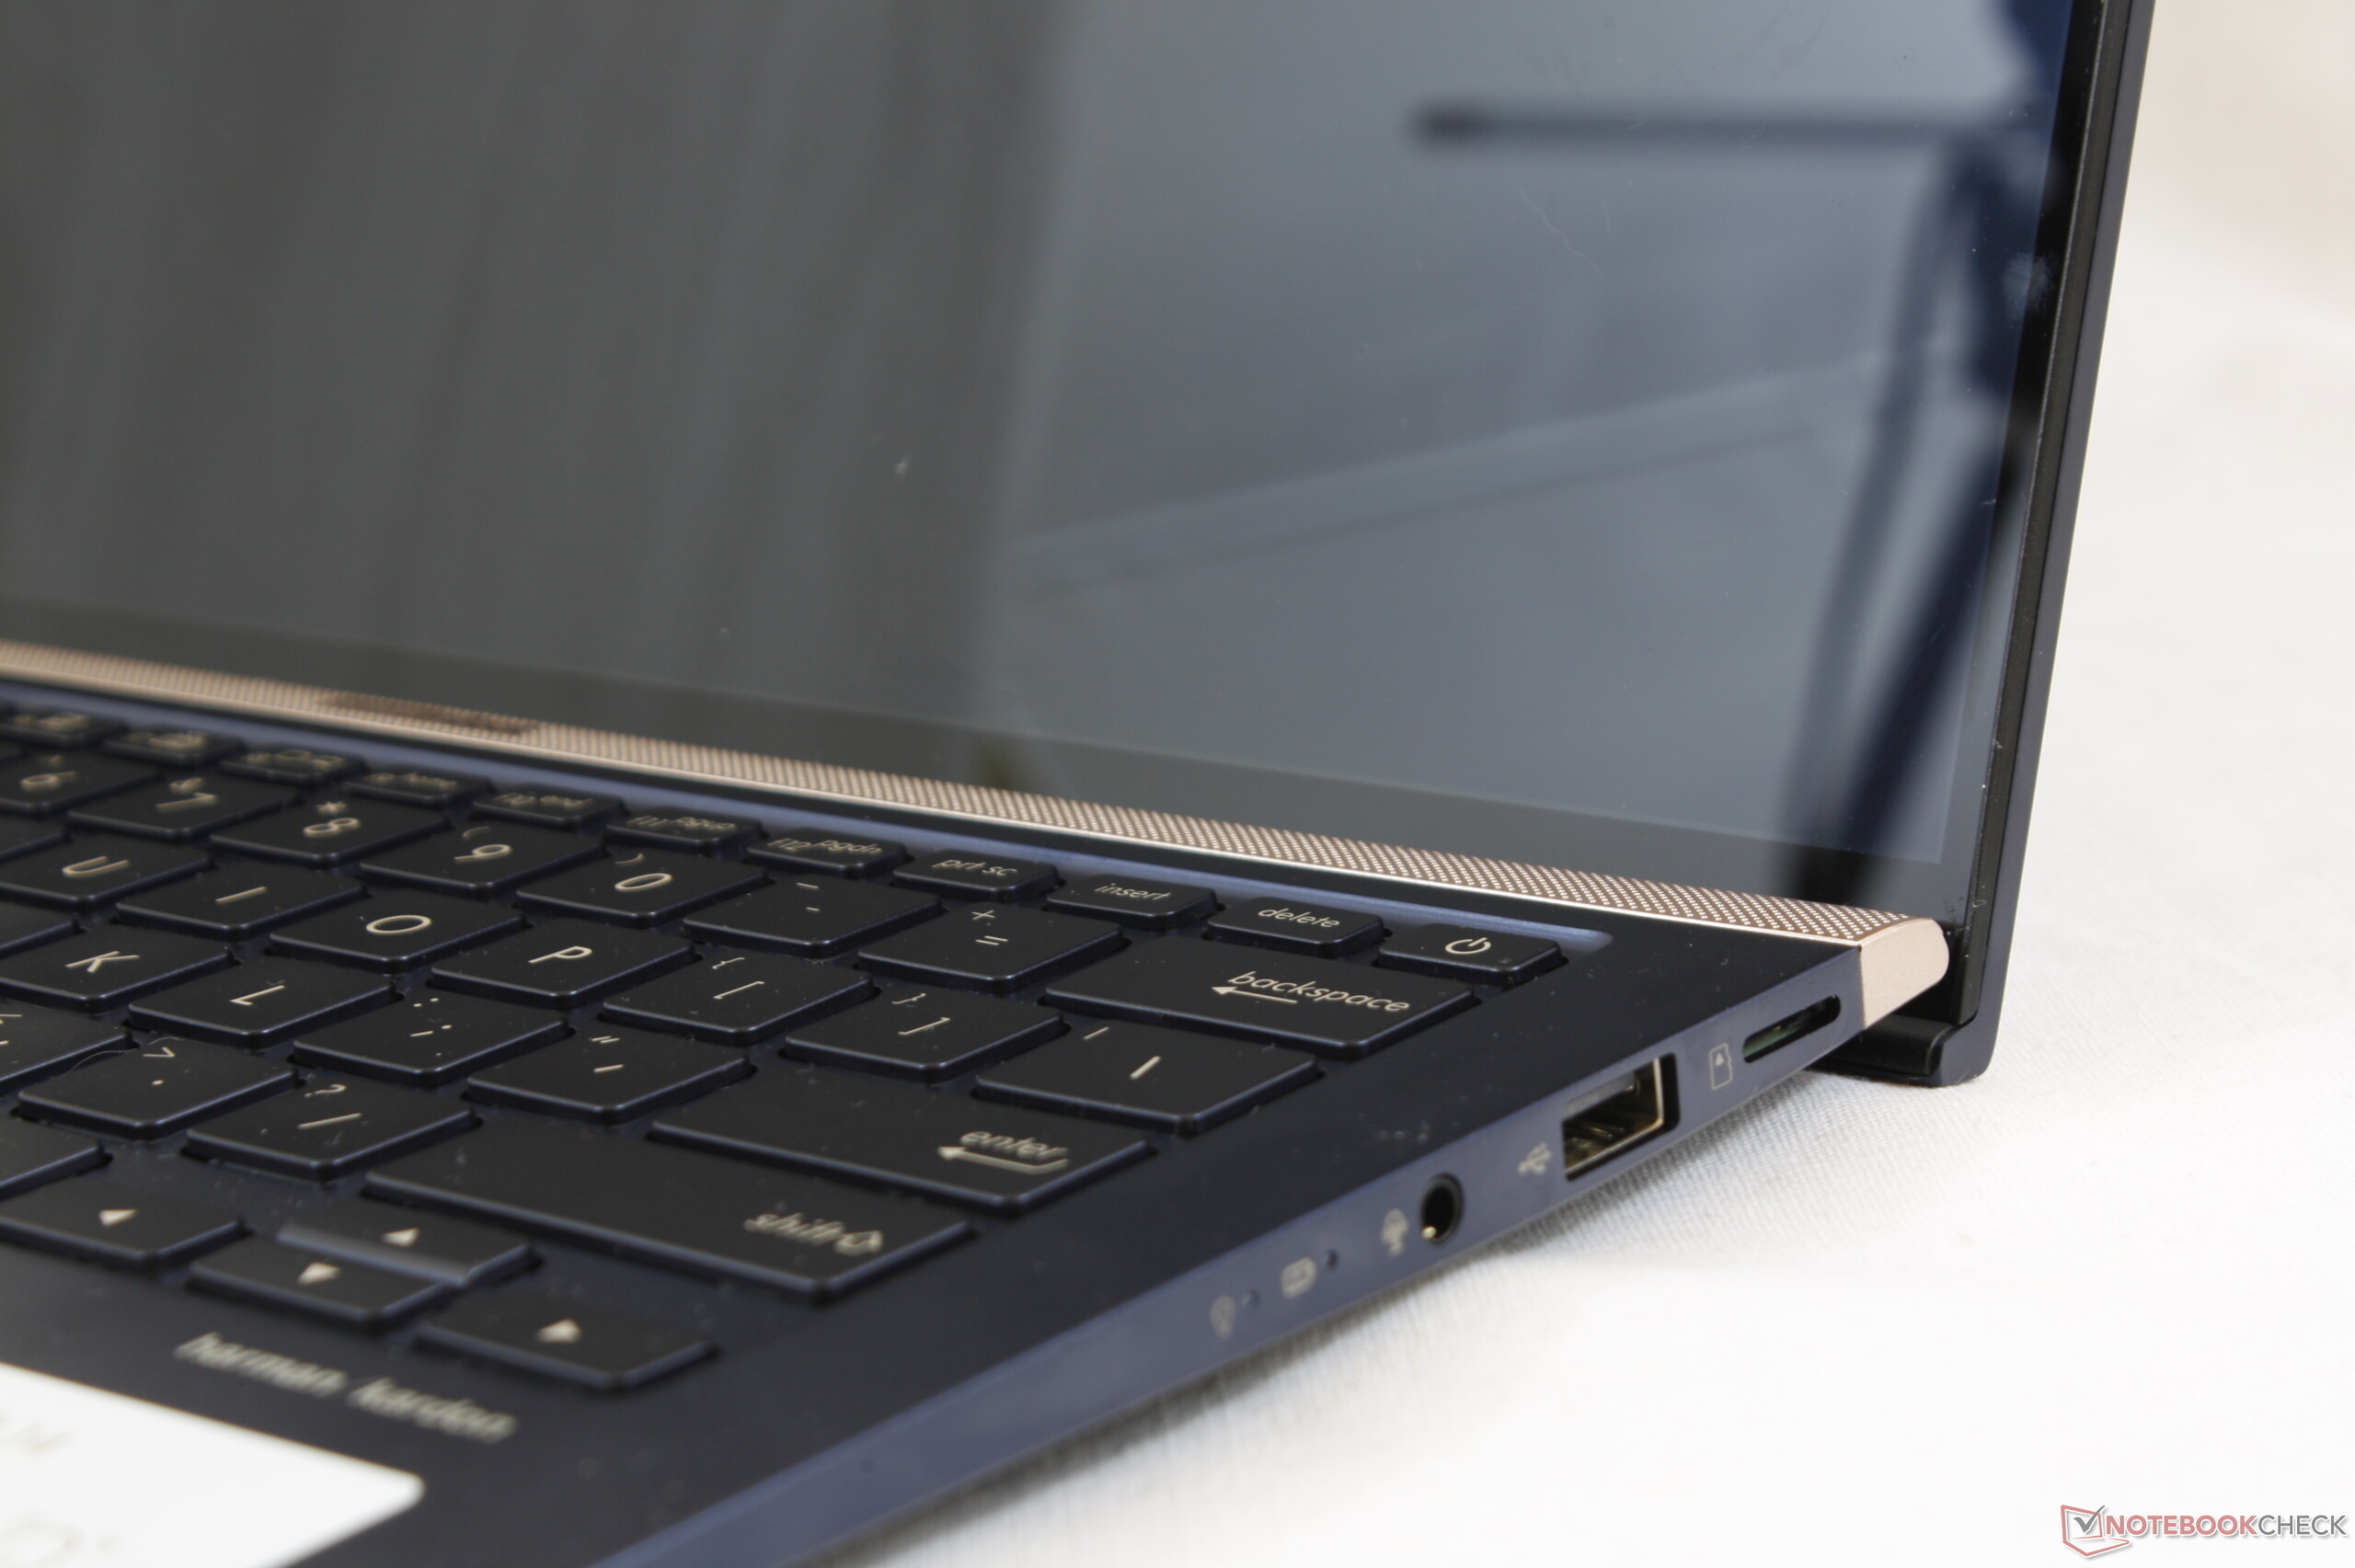
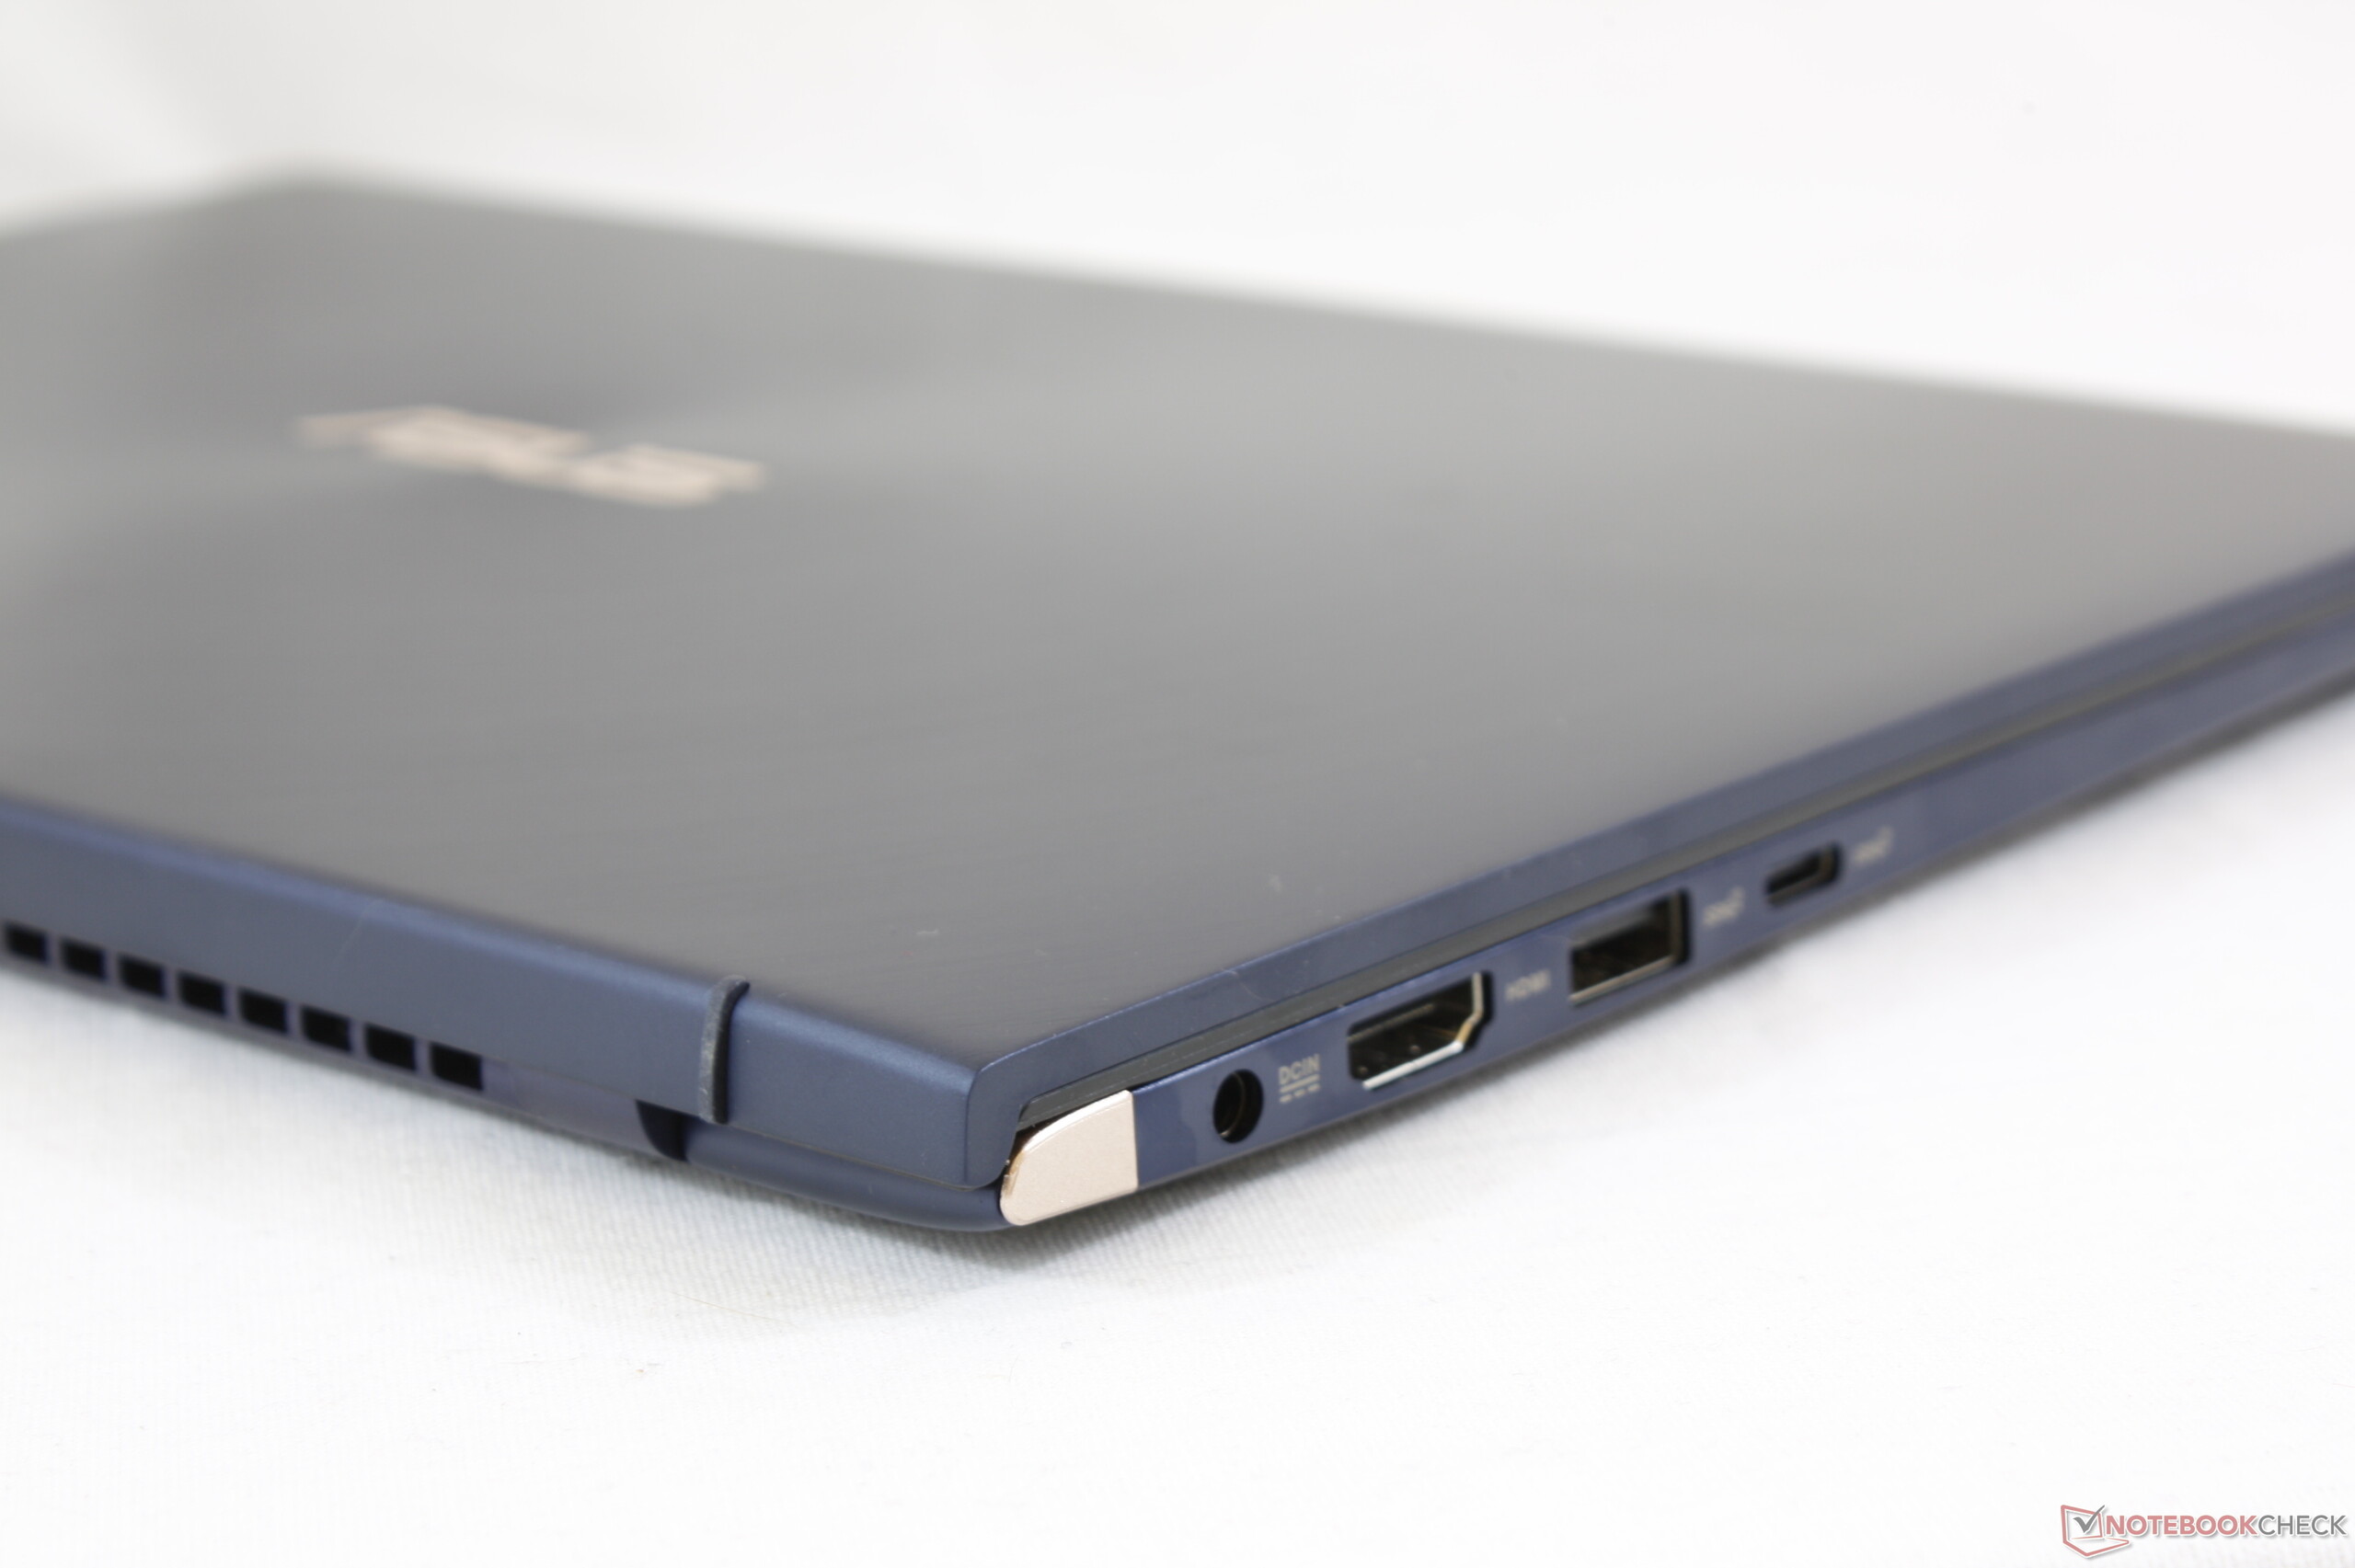
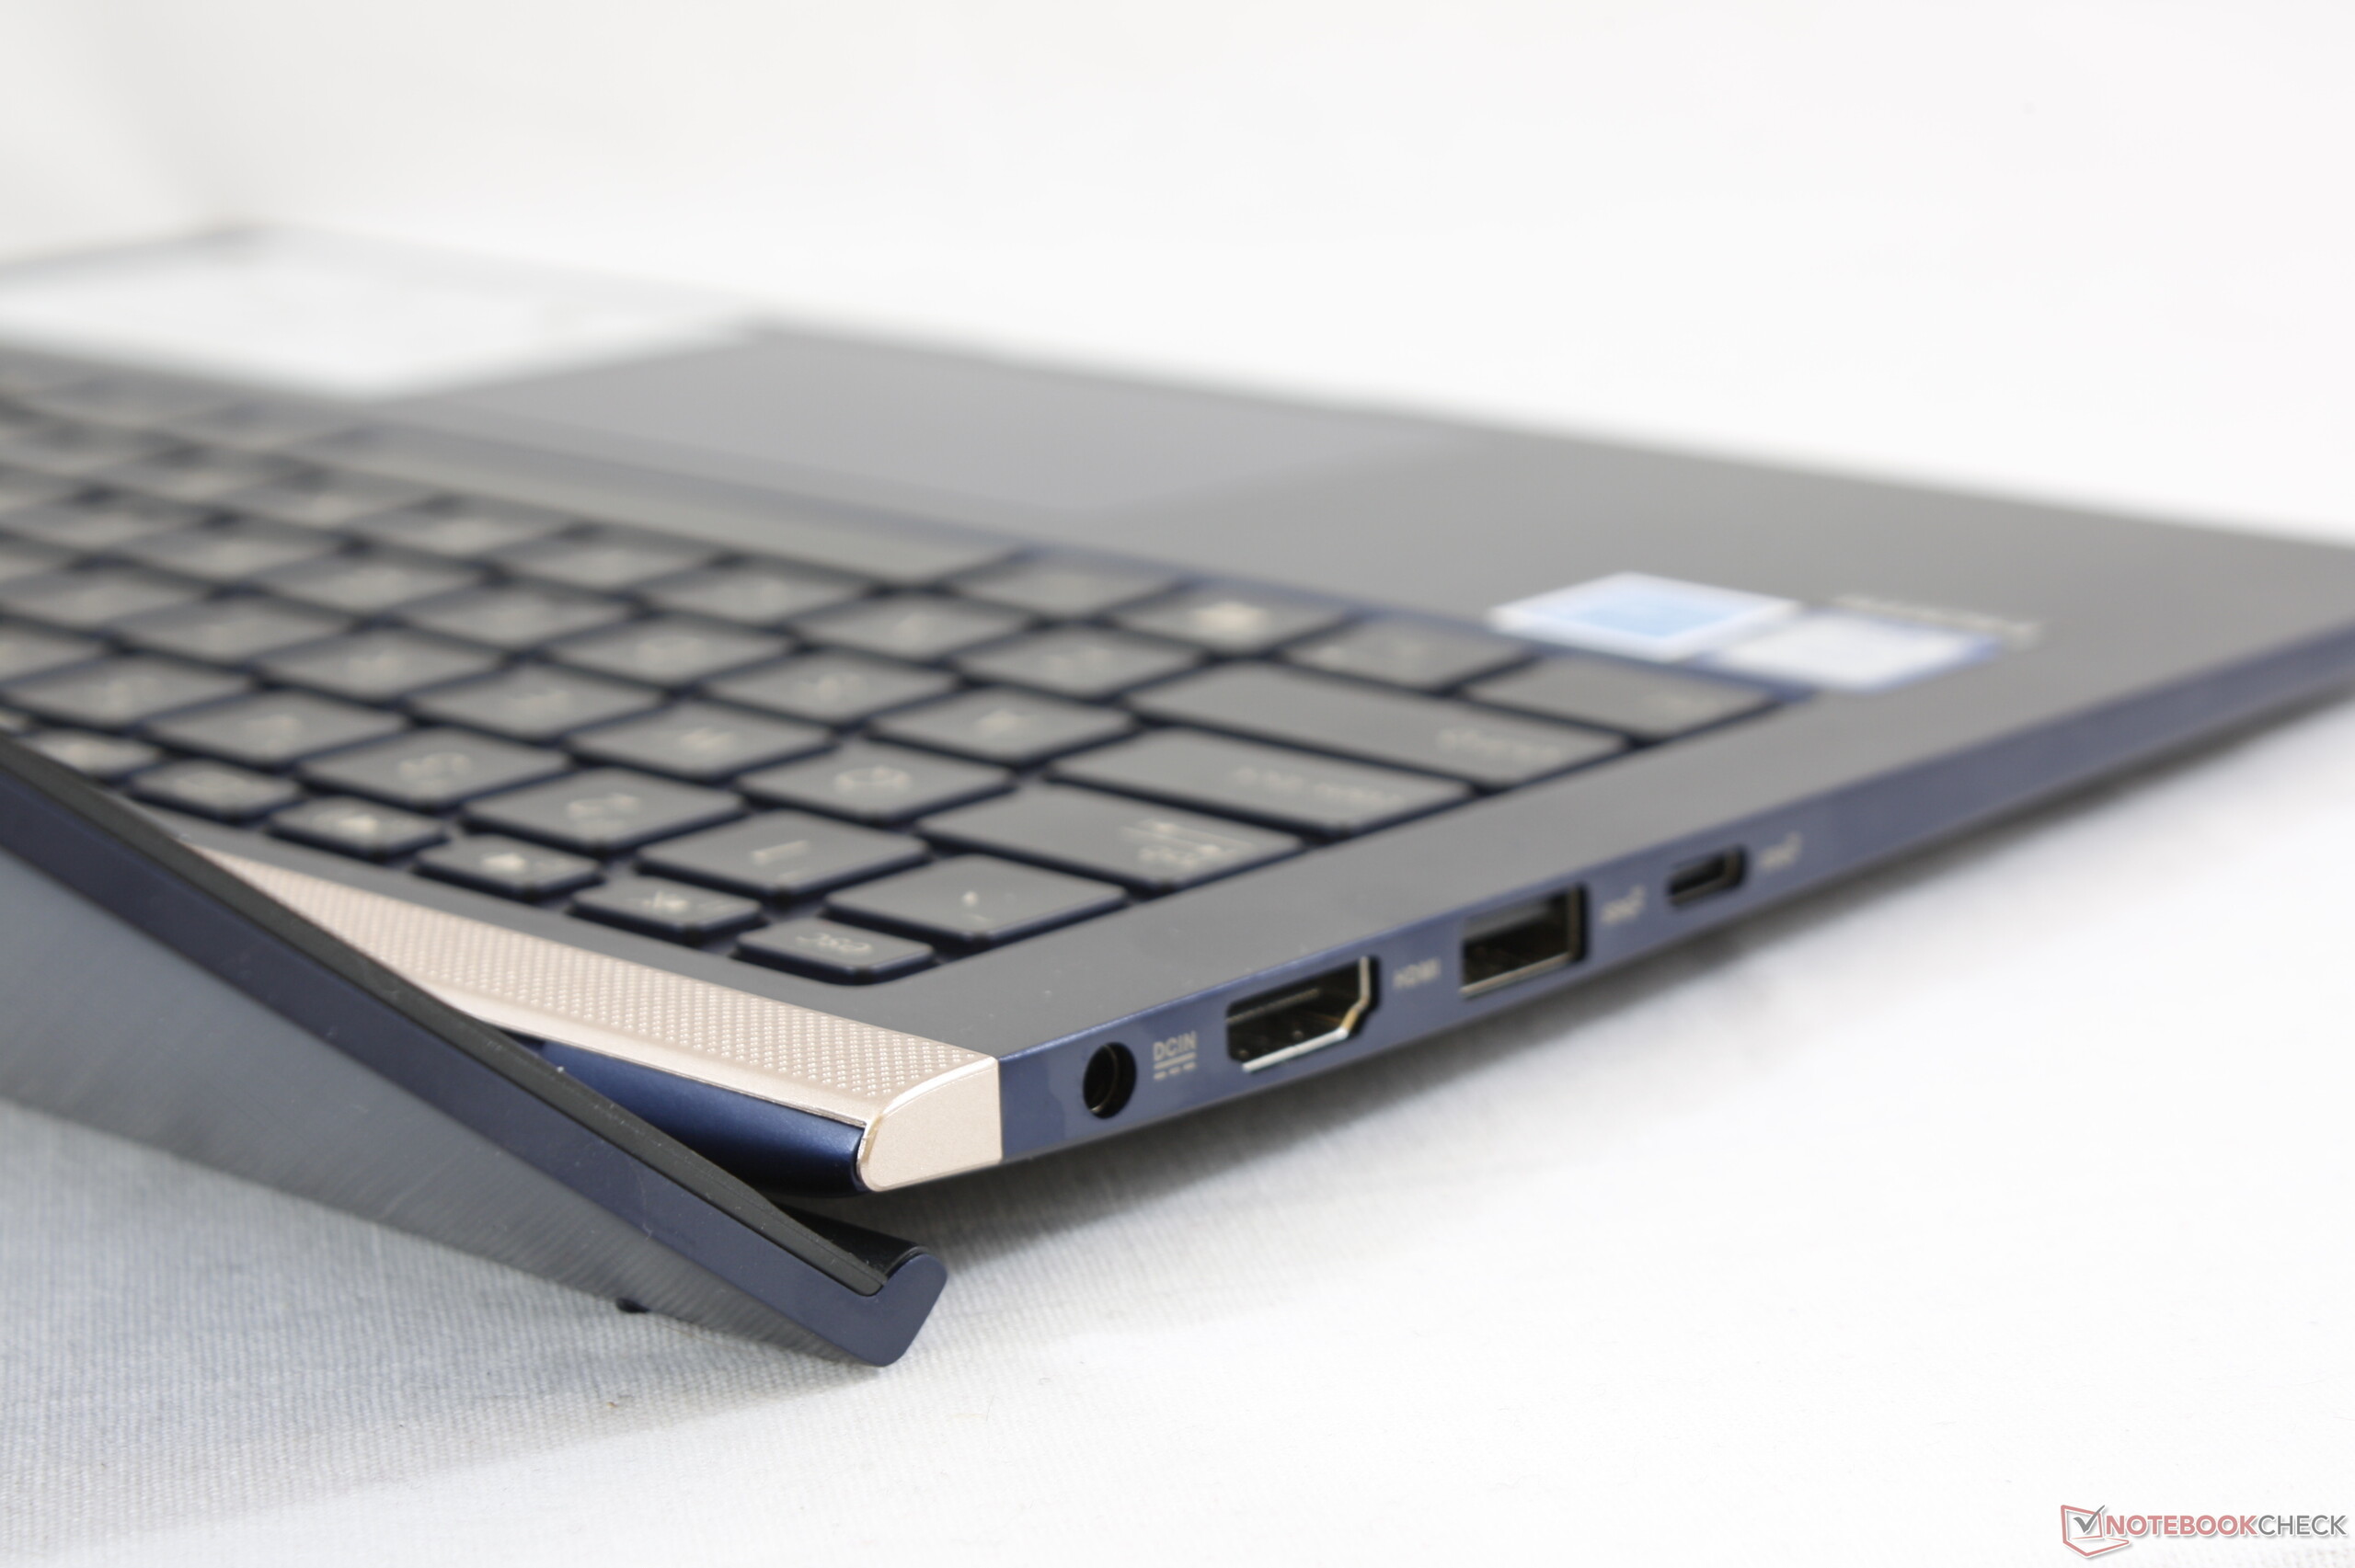
奇怪的是,USB Type-C端口无法为设备充电,也不支持DisplayPort输出。我们本来希望华硕能够为UX433FA配备一个雷电3端口,因为我们已经看到许多制造商开始给他们7000-8000元价位的笔记本电脑配备雷电3。因为这将允许人们外接GPU,这仍然是一个利基市场。
总的来说,UX433FA-A6061T是一款体面的14英寸笔记本电脑,它有很多功能,但它的价格仅略微低高配版于UX433FA-A6076T。 A6061T不能像我们预期的那样比i7版更好地保持其性能,这是令人失望的。但这并不妨碍UX433FA-A6061T取得优异的总体成绩。
Asus Zenbook 14 UX433FA-A6018T
- 02/08/2019 v6 (old)
Sascha Mölck
Price comparison

