惠普 Pavilion x360 13-u102ng 变形本简短评测

| SD Card Reader | |
| average JPG Copy Test (av. of 3 runs) | |
| HP Pavilion x360 13-u102ng | |
| Lenovo Yoga 510-14IKB | |
| Asus VivoBook Flip TP301UA-DW006T | |
| Dell Inspiron 13 5368 | |
| Acer Aspire R13 R7-372T-746N | |
| maximum AS SSD Seq Read Test (1GB) | |
| HP Pavilion x360 13-u102ng | |
| Lenovo Yoga 510-14IKB | |
| Asus VivoBook Flip TP301UA-DW006T | |
| Acer Aspire R13 R7-372T-746N | |
| Dell Inspiron 13 5368 | |
| Networking | |
| iperf Server (receive) TCP 1 m | |
| Asus VivoBook Flip TP301UA-DW006T (Seb) | |
| Dell Inspiron 13 5368 (Seb) | |
| Lenovo Yoga 510-14IKB | |
| HP Pavilion x360 13-u102ng (jseb) | |
| iperf Client (transmit) TCP 1 m | |
| Asus VivoBook Flip TP301UA-DW006T (Seb) | |
| Dell Inspiron 13 5368 (Seb) | |
| Lenovo Yoga 510-14IKB | |
| HP Pavilion x360 13-u102ng (jseb) | |
| |||||||||||||||||||||||||
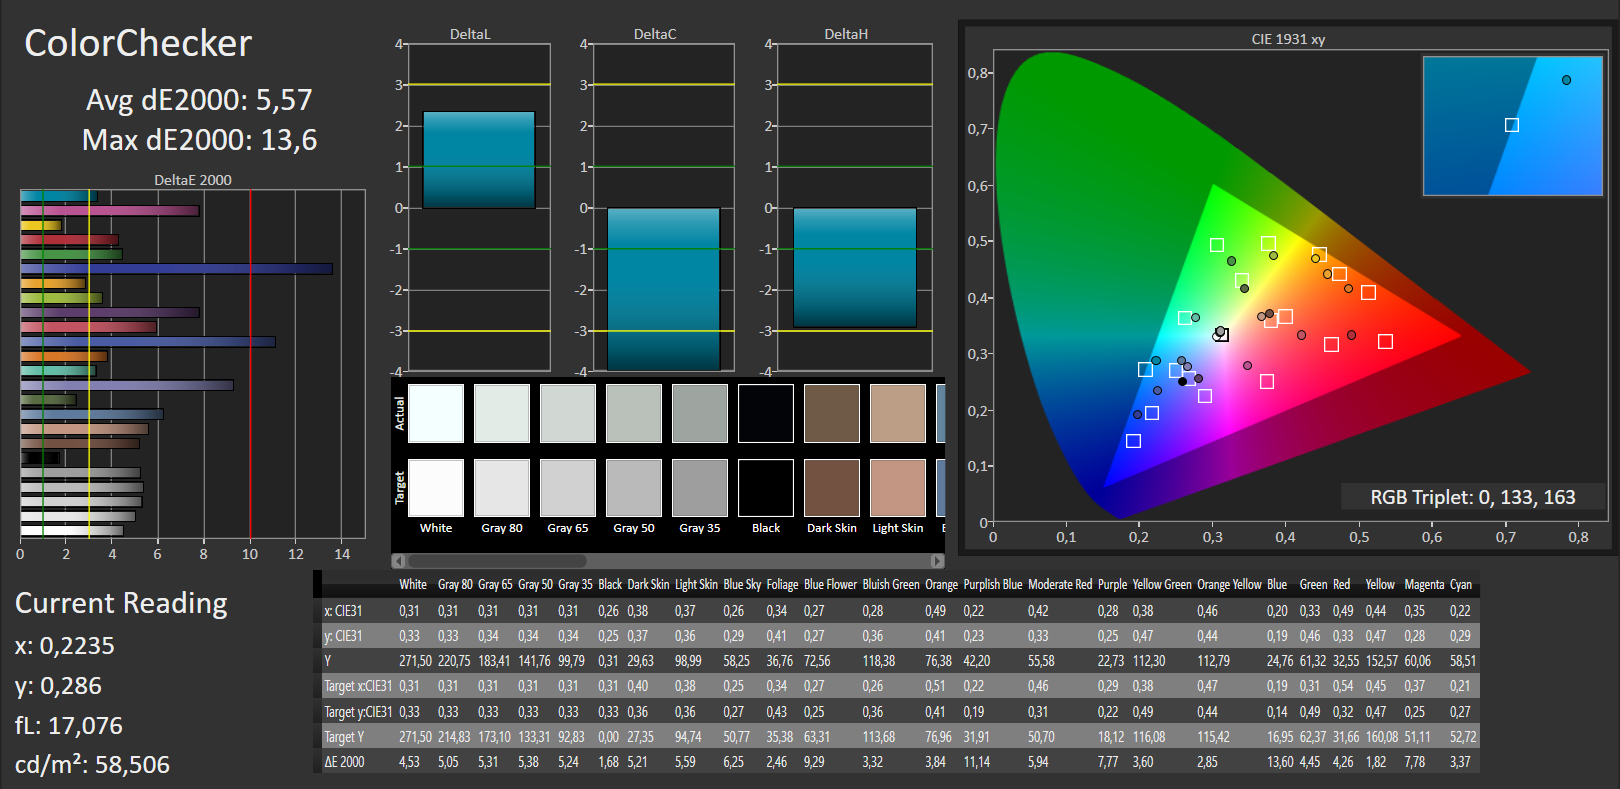
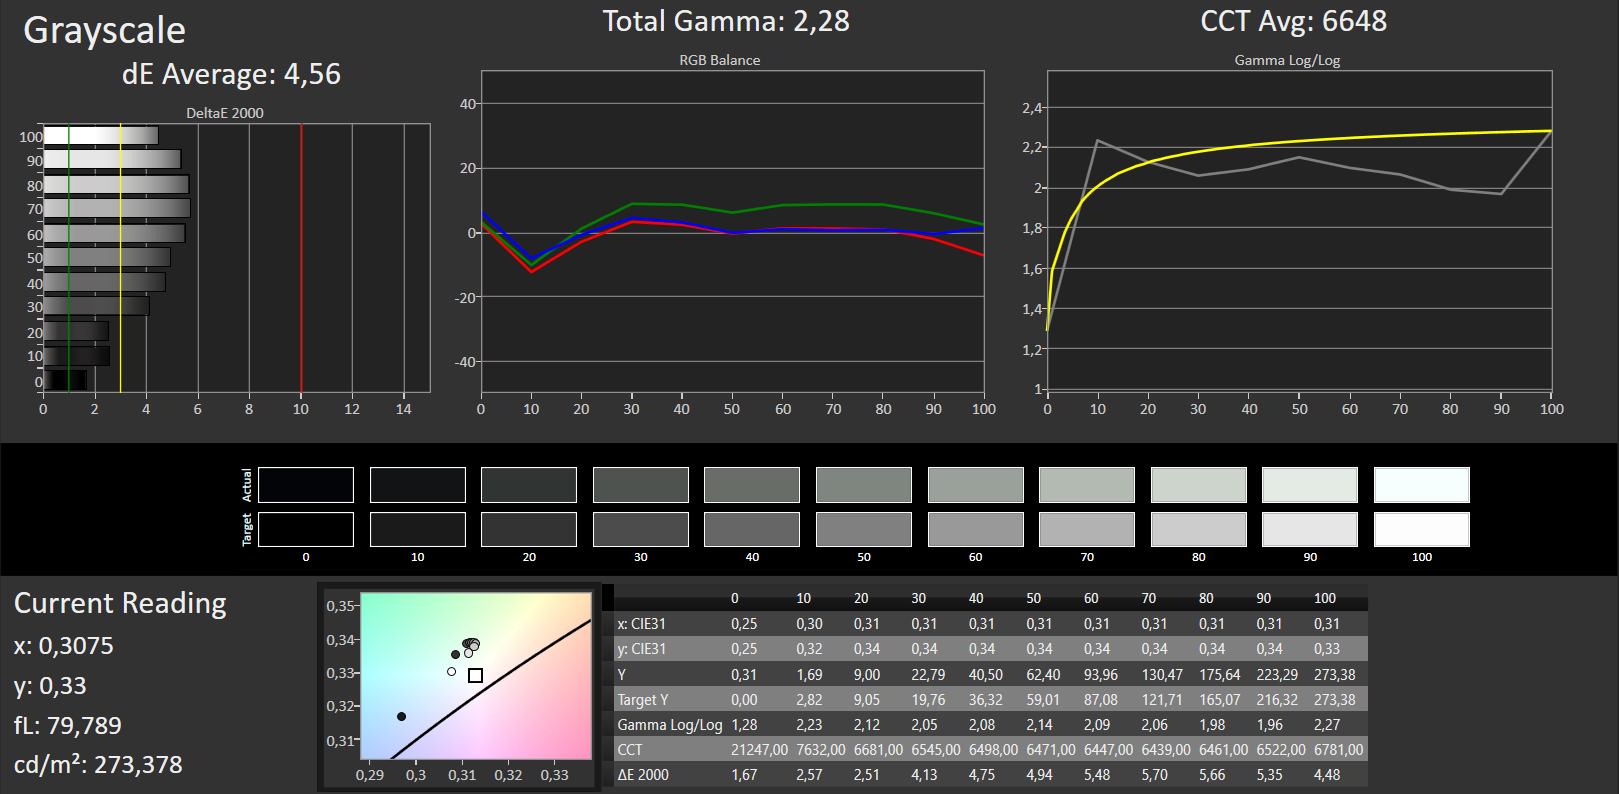
Brightness Distribution: 88 %
Center on Battery: 277 cd/m²
Contrast: 894:1 (Black: 0.31 cd/m²)
ΔE ColorChecker Calman: 5.57 | ∀{0.5-29.43 Ø4.72}
ΔE Greyscale Calman: 4.56 | ∀{0.09-98 Ø4.97}
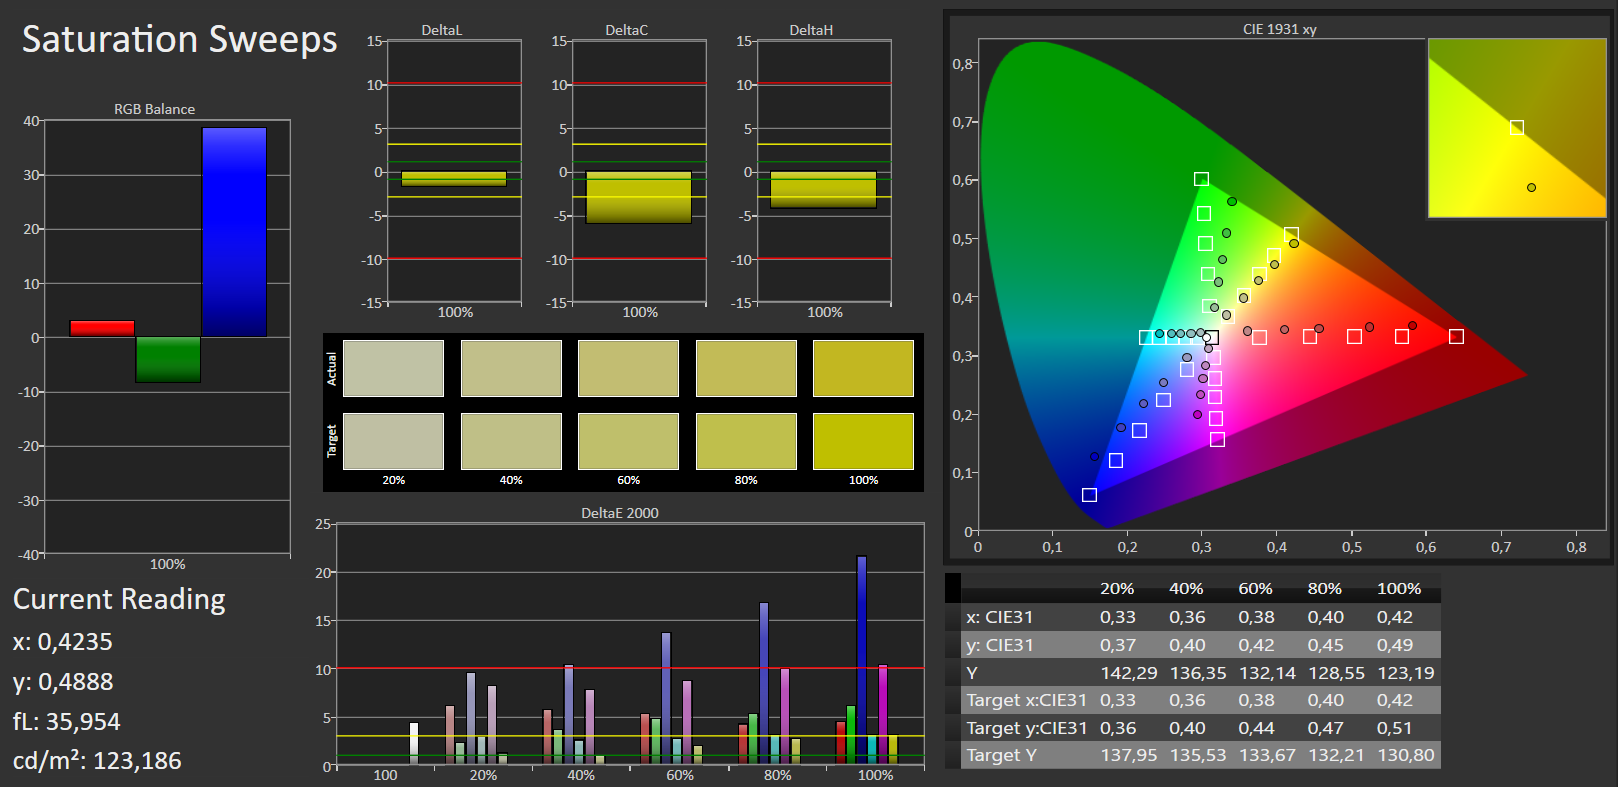
59% sRGB (Argyll 1.6.3 3D)
38% AdobeRGB 1998 (Argyll 1.6.3 3D)
40.76% AdobeRGB 1998 (Argyll 3D)
59.1% sRGB (Argyll 3D)
39.43% Display P3 (Argyll 3D)
Gamma: 2.28
CCT: 6648 K
| HP Pavilion x360 13-u102ng IPS, 1920x1080, 13.3" | Asus VivoBook Flip TP301UA-DW006T TN, 1920x1080, 13.3" | Dell Inspiron 13 5368 IPS, 1920x1080, 13.3" | Acer Aspire R13 R7-372T-746N IPS, 2560x1440, 13.3" | Lenovo Yoga 510-14IKB IPS, 1920x1080, 14" | |
|---|---|---|---|---|---|
| Display | 6% | -1% | 72% | 6% | |
| Display P3 Coverage (%) | 39.43 | 41.63 6% | 38.88 -1% | 69.6 77% | 41.78 6% |
| sRGB Coverage (%) | 59.1 | 62.6 6% | 57.7 -2% | 98 66% | 62.9 6% |
| AdobeRGB 1998 Coverage (%) | 40.76 | 43.02 6% | 40.17 -1% | 70.7 73% | 43.17 6% |
| Response Times | 32% | -20% | -8% | -48% | |
| Response Time Grey 50% / Grey 80% * (ms) | 38 ? | 38 ? -0% | 44 ? -16% | 36 ? 5% | 53 ? -39% |
| Response Time Black / White * (ms) | 25 ? | 9 ? 64% | 31 ? -24% | 30 ? -20% | 39 ? -56% |
| PWM Frequency (Hz) | 50 ? | 1000 ? | 350 ? | ||
| Screen | -7% | 6% | 41% | 0% | |
| Brightness middle (cd/m²) | 277 | 166 -40% | 240 -13% | 320 16% | 243 -12% |
| Brightness (cd/m²) | 263 | 165 -37% | 229 -13% | 308 17% | 248 -6% |
| Brightness Distribution (%) | 88 | 90 2% | 92 5% | 91 3% | 91 3% |
| Black Level * (cd/m²) | 0.31 | 0.44 -42% | 0.24 23% | 0.17 45% | 0.32 -3% |
| Contrast (:1) | 894 | 377 -58% | 1000 12% | 1882 111% | 759 -15% |
| Colorchecker dE 2000 * | 5.57 | 4.07 27% | 4.75 15% | 3.18 43% | 5.44 2% |
| Colorchecker dE 2000 max. * | 13.6 | 6.38 53% | 9.09 33% | 9.91 27% | 9.73 28% |
| Greyscale dE 2000 * | 4.56 | 3.99 12% | 4.3 6% | 4.13 9% | 4.74 -4% |
| Gamma | 2.28 96% | 2.49 88% | 2.5 88% | 2.03 108% | 2.38 92% |
| CCT | 6648 98% | 7491 87% | 5893 110% | 6752 96% | 7799 83% |
| Color Space (Percent of AdobeRGB 1998) (%) | 38 | 40 5% | 36.79 -3% | 65 71% | 39.6 4% |
| Color Space (Percent of sRGB) (%) | 59 | 63 7% | 57.39 -3% | 98 66% | 62.5 6% |
| Total Average (Program / Settings) | 10% /
1% | -5% /
1% | 35% /
41% | -14% /
-5% |
* ... smaller is better
Screen Flickering / PWM (Pulse-Width Modulation)
| Screen flickering / PWM not detected | ||
In comparison: 52 % of all tested devices do not use PWM to dim the display. If PWM was detected, an average of 7781 (minimum: 5 - maximum: 343500) Hz was measured. | ||
Display Response Times
| ↔ Response Time Black to White | ||
|---|---|---|
| 25 ms ... rise ↗ and fall ↘ combined | ↗ 6 ms rise | 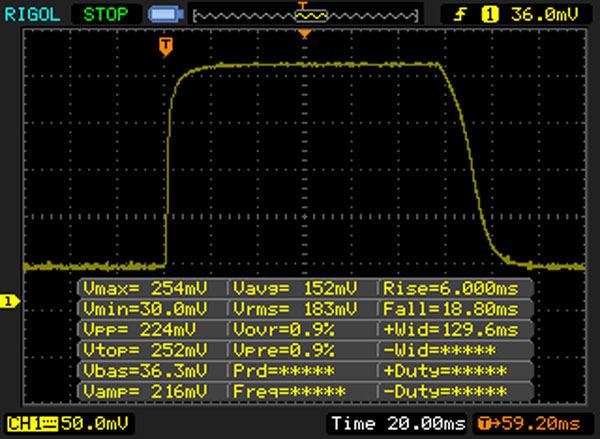 |
| ↘ 19 ms fall | ||
| The screen shows relatively slow response rates in our tests and may be too slow for gamers. In comparison, all tested devices range from 0.1 (minimum) to 240 (maximum) ms. » 59 % of all devices are better. This means that the measured response time is worse than the average of all tested devices (19.8 ms). | ||
| ↔ Response Time 50% Grey to 80% Grey | ||
| 38 ms ... rise ↗ and fall ↘ combined | ↗ 14 ms rise | 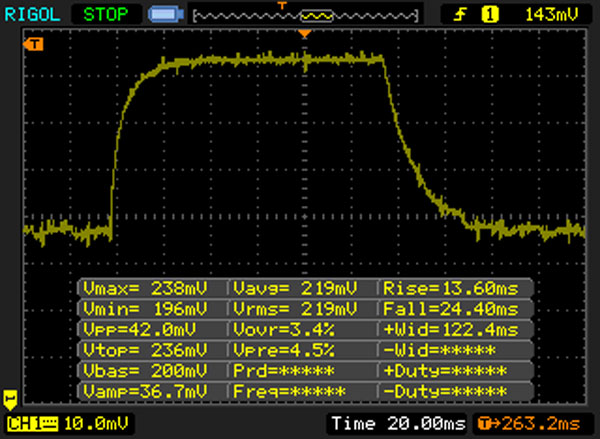 |
| ↘ 24 ms fall | ||
| The screen shows slow response rates in our tests and will be unsatisfactory for gamers. In comparison, all tested devices range from 0.165 (minimum) to 636 (maximum) ms. » 55 % of all devices are better. This means that the measured response time is worse than the average of all tested devices (31 ms). | ||
| Cinebench R10 | |
| Rendering Multiple CPUs 32Bit | |
| HP Pavilion x360 13-u102ng | |
| Acer Aspire R13 R7-372T-746N | |
| Rendering Single 32Bit | |
| HP Pavilion x360 13-u102ng | |
| Acer Aspire R13 R7-372T-746N | |
| Geekbench 3 | |
| 32 Bit Single-Core Score | |
| Acer Aspire R13 R7-372T-746N | |
| HP Pavilion x360 13-u102ng | |
| 32 Bit Multi-Core Score | |
| Acer Aspire R13 R7-372T-746N | |
| HP Pavilion x360 13-u102ng | |
| Geekbench 4.0 | |
| 64 Bit Single-Core Score | |
| HP Pavilion x360 13-u102ng | |
| 64 Bit Multi-Core Score | |
| HP Pavilion x360 13-u102ng | |
| JetStream 1.1 - 1.1 Total | |
| Acer Aspire R13 R7-372T-746N | |
| HP Pavilion x360 13-u102ng | |
| Dell Inspiron 13 5368 | |
| Asus VivoBook Flip TP301UA-DW006T | |
| PCMark 7 Score | 3227 points | |
| PCMark 8 Home Score Accelerated v2 | 3274 points | |
| PCMark 8 Creative Score Accelerated v2 | 3806 points | |
| PCMark 8 Work Score Accelerated v2 | 4050 points | |
Help | ||
| PCMark 8 | |
| Home Score Accelerated v2 | |
| Dell Inspiron 13 5368 | |
| Lenovo Yoga 510-14IKB | |
| HP Pavilion x360 13-u102ng | |
| Acer Aspire R13 R7-372T-746N | |
| Asus VivoBook Flip TP301UA-DW006T | |
| Work Score Accelerated v2 | |
| Dell Inspiron 13 5368 | |
| Asus VivoBook Flip TP301UA-DW006T | |
| HP Pavilion x360 13-u102ng | |
| Acer Aspire R13 R7-372T-746N | |

| HP Pavilion x360 13-u102ng HGST Travelstar 5K1000 HTS541010A7E630 | Asus VivoBook Flip TP301UA-DW006T Samsung CM871 MZ7LF128HCHP | Dell Inspiron 13 5368 Toshiba THNSNK256GCS8 | Acer Aspire R13 R7-372T-746N Lite-On CV1-8B256 | Lenovo Yoga 510-14IKB Samsung MZYTY256HDHP | |
|---|---|---|---|---|---|
| CrystalDiskMark 3.0 | 1925% | 9303% | 9785% | 11295% | |
| Read Seq (MB/s) | 104.8 | 396 278% | 479 357% | 507 384% | 518 394% |
| Write Seq (MB/s) | 91 | 133.5 47% | 270.1 197% | 354.4 289% | 476.5 424% |
| Read 512 (MB/s) | 20.67 | 259.5 1155% | 428.3 1972% | 355.3 1619% | 408 1874% |
| Write 512 (MB/s) | 45.05 | 23.86 -47% | 267.9 495% | 353.9 686% | 274.5 509% |
| Read 4k (MB/s) | 0.215 | 5.783 2590% | 23.77 10956% | 32.66 15091% | 35.66 16486% |
| Write 4k (MB/s) | 1.037 | 8.507 720% | 81.4 7750% | 81.6 7769% | 106.7 10189% |
| Read 4k QD32 (MB/s) | 0.968 | 97.5 9972% | 333.6 34363% | 277.6 28578% | 368.7 37989% |
| Write 4k QD32 (MB/s) | 1.09 | 8.515 681% | 200.9 18331% | 261.2 23863% | 246.3 22496% |
| 3DMark 06 Standard Score | 8117 points | |
| 3DMark 11 Performance | 1509 points | |
| 3DMark Ice Storm Standard Score | 48460 points | |
| 3DMark Cloud Gate Standard Score | 5429 points | |
| 3DMark Fire Strike Score | 708 points | |
Help | ||
| 3DMark 11 - 1280x720 Performance GPU | |
| Lenovo Yoga 510-14IKB | |
| Dell Inspiron 13 5368 | |
| Acer Aspire R13 R7-372T-746N | |
| HP Pavilion x360 13-u102ng | |
| Asus VivoBook Flip TP301UA-DW006T | |
| 3DMark | |
| 1280x720 Cloud Gate Standard Graphics | |
| Dell Inspiron 13 5368 | |
| Acer Aspire R13 R7-372T-746N | |
| HP Pavilion x360 13-u102ng | |
| Lenovo Yoga 510-14IKB | |
| Asus VivoBook Flip TP301UA-DW006T | |
| 1920x1080 Fire Strike Graphics | |
| Lenovo Yoga 510-14IKB | |
| Acer Aspire R13 R7-372T-746N | |
| HP Pavilion x360 13-u102ng | |
| low | med. | high | ultra | |
|---|---|---|---|---|
| Tomb Raider (2013) | 62.1 | 32.3 | 19.4 | 9.6 |
| BioShock Infinite (2013) | 38.6 | 24.4 | 20.1 | 7.1 |
| Battlefield 4 (2013) | 34.9 | 25 | 16.3 | 6.2 |
| Watch Dogs 2 (2016) | 13.8 | 11.7 |
Noise level
| Idle |
| 31.3 / 31.3 / 31.6 dB(A) |
| HDD |
| 31.7 dB(A) |
| Load |
| 34.2 / 37.3 dB(A) |
 | ||
30 dB silent 40 dB(A) audible 50 dB(A) loud |
||
min: | ||
| HP Pavilion x360 13-u102ng i5-7200U, HD Graphics 620 | Asus VivoBook Flip TP301UA-DW006T 6100U, HD Graphics 520 | Dell Inspiron 13 5368 6500U, HD Graphics 520 | Acer Aspire R13 R7-372T-746N 6500U, HD Graphics 520 | Lenovo Yoga 510-14IKB i5-7200U, Radeon R5 M430 | |
|---|---|---|---|---|---|
| Noise | -0% | 5% | -4% | 0% | |
| off / environment * (dB) | 30.5 | 31 -2% | 29 5% | 31.3 -3% | 29 5% |
| Idle Minimum * (dB) | 31.3 | 31.3 -0% | 29 7% | 31.3 -0% | 29 7% |
| Idle Average * (dB) | 31.3 | 31.3 -0% | 29 7% | 31.3 -0% | 29 7% |
| Idle Maximum * (dB) | 31.6 | 32.9 -4% | 29 8% | 31.8 -1% | 29 8% |
| Load Average * (dB) | 34.2 | 35 -2% | 31 9% | 39.2 -15% | 37.3 -9% |
| Load Maximum * (dB) | 37.3 | 34.9 6% | 40.3 -8% | 39.1 -5% | 43.1 -16% |
* ... smaller is better
(+) The maximum temperature on the upper side is 34.6 °C / 94 F, compared to the average of 35.4 °C / 96 F, ranging from 19.6 to 60 °C for the class Convertible.
(+) The bottom heats up to a maximum of 36.4 °C / 98 F, compared to the average of 36.9 °C / 98 F
(+) In idle usage, the average temperature for the upper side is 25 °C / 77 F, compared to the device average of 30.3 °C / 87 F.
(+) The palmrests and touchpad are cooler than skin temperature with a maximum of 29 °C / 84.2 F and are therefore cool to the touch.
(±) The average temperature of the palmrest area of similar devices was 28 °C / 82.4 F (-1 °C / -1.8 F).
| HP Pavilion x360 13-u102ng i5-7200U, HD Graphics 620 | Asus VivoBook Flip TP301UA-DW006T 6100U, HD Graphics 520 | Dell Inspiron 13 5368 6500U, HD Graphics 520 | Acer Aspire R13 R7-372T-746N 6500U, HD Graphics 520 | Lenovo Yoga 510-14IKB i5-7200U, Radeon R5 M430 | |
|---|---|---|---|---|---|
| Heat | 7% | -23% | -2% | -16% | |
| Maximum Upper Side * (°C) | 34.6 | 30.6 12% | 41.6 -20% | 40 -16% | 40.1 -16% |
| Maximum Bottom * (°C) | 36.4 | 33.3 9% | 45.9 -26% | 37.6 -3% | 46.1 -27% |
| Idle Upper Side * (°C) | 26.6 | 25.7 3% | 32.7 -23% | 25.1 6% | 28.5 -7% |
| Idle Bottom * (°C) | 27.7 | 26.6 4% | 34.1 -23% | 26 6% | 31.6 -14% |
* ... smaller is better
HP Pavilion x360 13-u102ng audio analysis
(±) | speaker loudness is average but good (74 dB)
Bass 100 - 315 Hz
(-) | nearly no bass - on average 32.3% lower than median
(±) | linearity of bass is average (8.9% delta to prev. frequency)
Mids 400 - 2000 Hz
(+) | balanced mids - only 3.6% away from median
(±) | linearity of mids is average (7.1% delta to prev. frequency)
Highs 2 - 16 kHz
(+) | balanced highs - only 2.5% away from median
(+) | highs are linear (2.7% delta to prev. frequency)
Overall 100 - 16.000 Hz
(±) | linearity of overall sound is average (21.7% difference to median)
Compared to same class
» 60% of all tested devices in this class were better, 10% similar, 31% worse
» The best had a delta of 6%, average was 20%, worst was 57%
Compared to all devices tested
» 61% of all tested devices were better, 7% similar, 31% worse
» The best had a delta of 4%, average was 24%, worst was 134%
Apple MacBook 12 (Early 2016) 1.1 GHz audio analysis
(+) | speakers can play relatively loud (83.6 dB)
Bass 100 - 315 Hz
(±) | reduced bass - on average 11.3% lower than median
(±) | linearity of bass is average (14.2% delta to prev. frequency)
Mids 400 - 2000 Hz
(+) | balanced mids - only 2.4% away from median
(+) | mids are linear (5.5% delta to prev. frequency)
Highs 2 - 16 kHz
(+) | balanced highs - only 2% away from median
(+) | highs are linear (4.5% delta to prev. frequency)
Overall 100 - 16.000 Hz
(+) | overall sound is linear (10.2% difference to median)
Compared to same class
» 7% of all tested devices in this class were better, 2% similar, 91% worse
» The best had a delta of 5%, average was 18%, worst was 53%
Compared to all devices tested
» 5% of all tested devices were better, 1% similar, 94% worse
» The best had a delta of 4%, average was 24%, worst was 134%
| Off / Standby | |
| Idle | |
| Load |
|
Key:
min: | |
| HP Pavilion x360 13-u102ng i5-7200U, HD Graphics 620 | Asus VivoBook Flip TP301UA-DW006T 6100U, HD Graphics 520 | Dell Inspiron 13 5368 6500U, HD Graphics 520 | Acer Aspire R13 R7-372T-746N 6500U, HD Graphics 520 | Lenovo Yoga 510-14IKB i5-7200U, Radeon R5 M430 | |
|---|---|---|---|---|---|
| Power Consumption | 21% | 6% | -30% | -17% | |
| Idle Minimum * (Watt) | 4.7 | 2.95 37% | 4.4 6% | 6.2 -32% | 3.9 17% |
| Idle Average * (Watt) | 7.2 | 5.6 22% | 6.1 15% | 8 -11% | 7.1 1% |
| Idle Maximum * (Watt) | 7.9 | 7.7 3% | 6.8 14% | 11.6 -47% | 7.7 3% |
| Load Average * (Watt) | 30 | 22.6 25% | 29 3% | 40 -33% | 33.4 -11% |
| Load Maximum * (Watt) | 29 | 23.5 19% | 31.9 -10% | 36.6 -26% | 55.9 -93% |
* ... smaller is better
| HP Pavilion x360 13-u102ng i5-7200U, HD Graphics 620, 41 Wh | Asus VivoBook Flip TP301UA-DW006T 6100U, HD Graphics 520, 55 Wh | Dell Inspiron 13 5368 6500U, HD Graphics 520, 42 Wh | Acer Aspire R13 R7-372T-746N 6500U, HD Graphics 520, 49 Wh | Lenovo Yoga 510-14IKB i5-7200U, Radeon R5 M430, 35 Wh | |
|---|---|---|---|---|---|
| Battery runtime | 81% | -2% | 16% | 22% | |
| Reader / Idle (h) | 9.3 | 21 126% | 11.2 20% | 11.2 20% | 12 29% |
| H.264 (h) | 5.3 | 6.6 25% | |||
| WiFi v1.3 (h) | 5.4 | 4.8 -11% | 4 -26% | 6.4 19% | 6.2 15% |
| Load (h) | 1.4 | 3.2 129% | 1.4 0% | 1.4 0% | 1.7 21% |
Pros
Cons
惠普的13.3寸变形本搭配了英特尔的最新Kaby Lake架构酷睿i5处理器。这块芯片提供了不错的处理性能,足以日常办公和上网浏览所需。这台笔记本电脑在使用中几乎不会发热,在待机时可以保持安静。在高速运行时风扇会发出一些呜呜声。由于搭配了1TB硬盘,你应该不会遇到存储空间不足的状况。用户也可以自行升级固态硬盘。不过这台Pavilion并不特别易于维护,如果需要增加内存的话需要拆下主板。
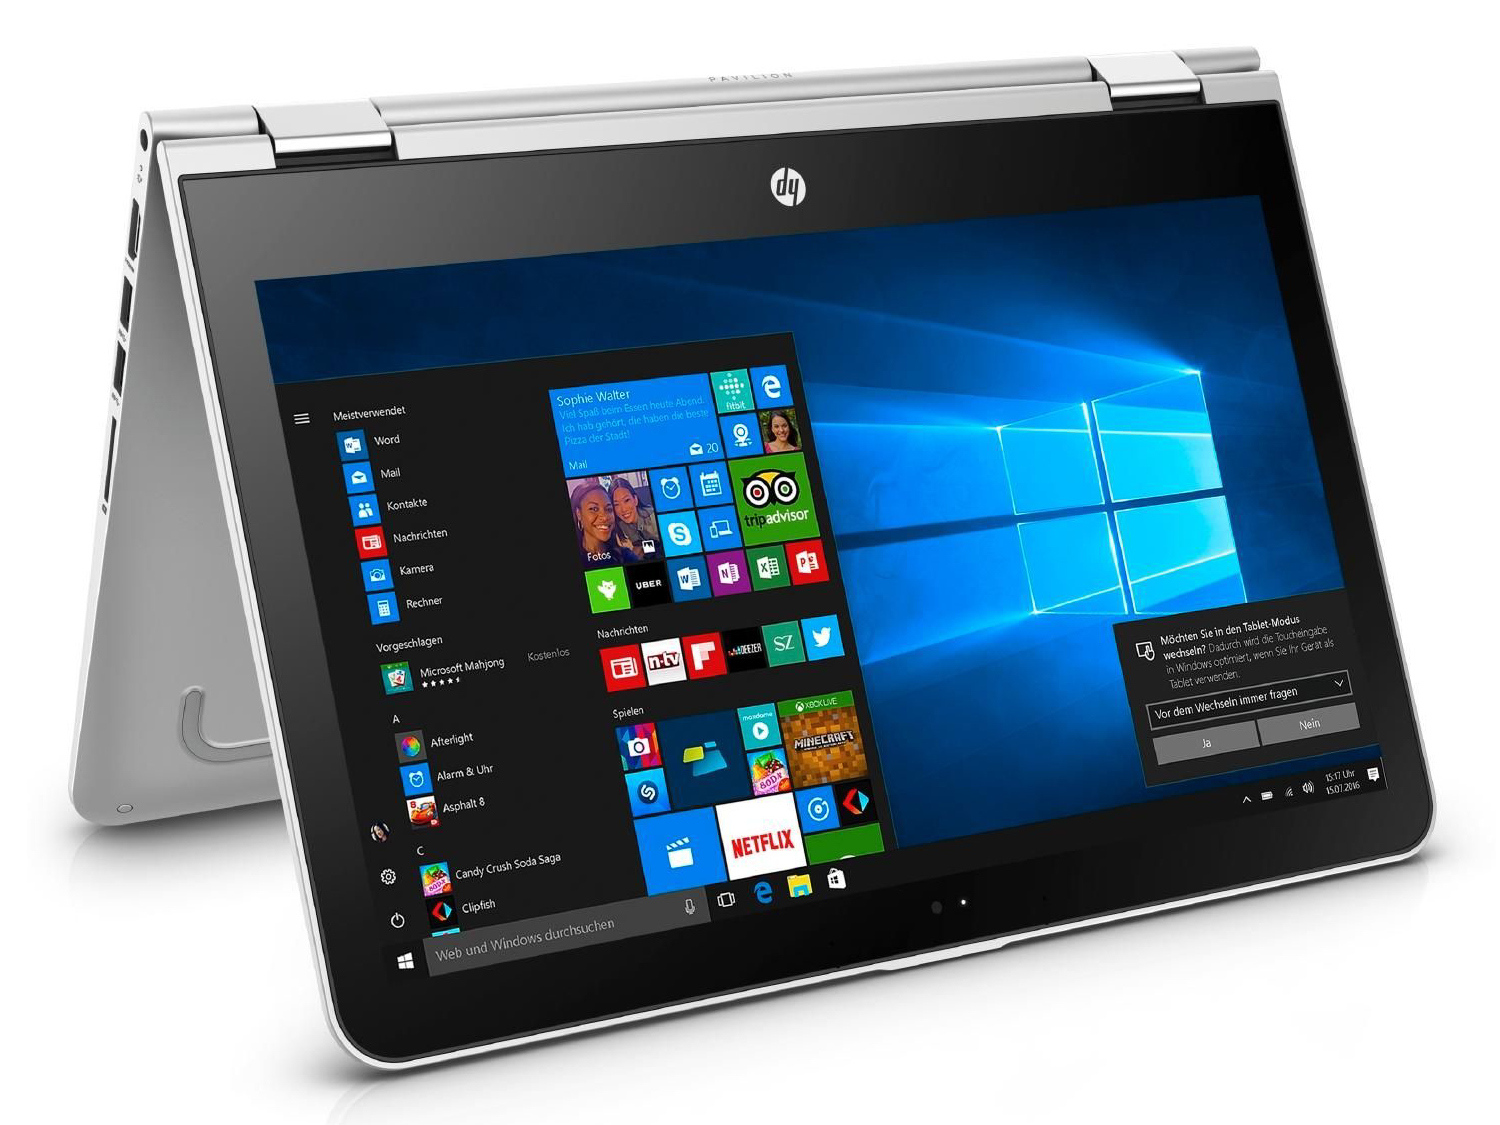
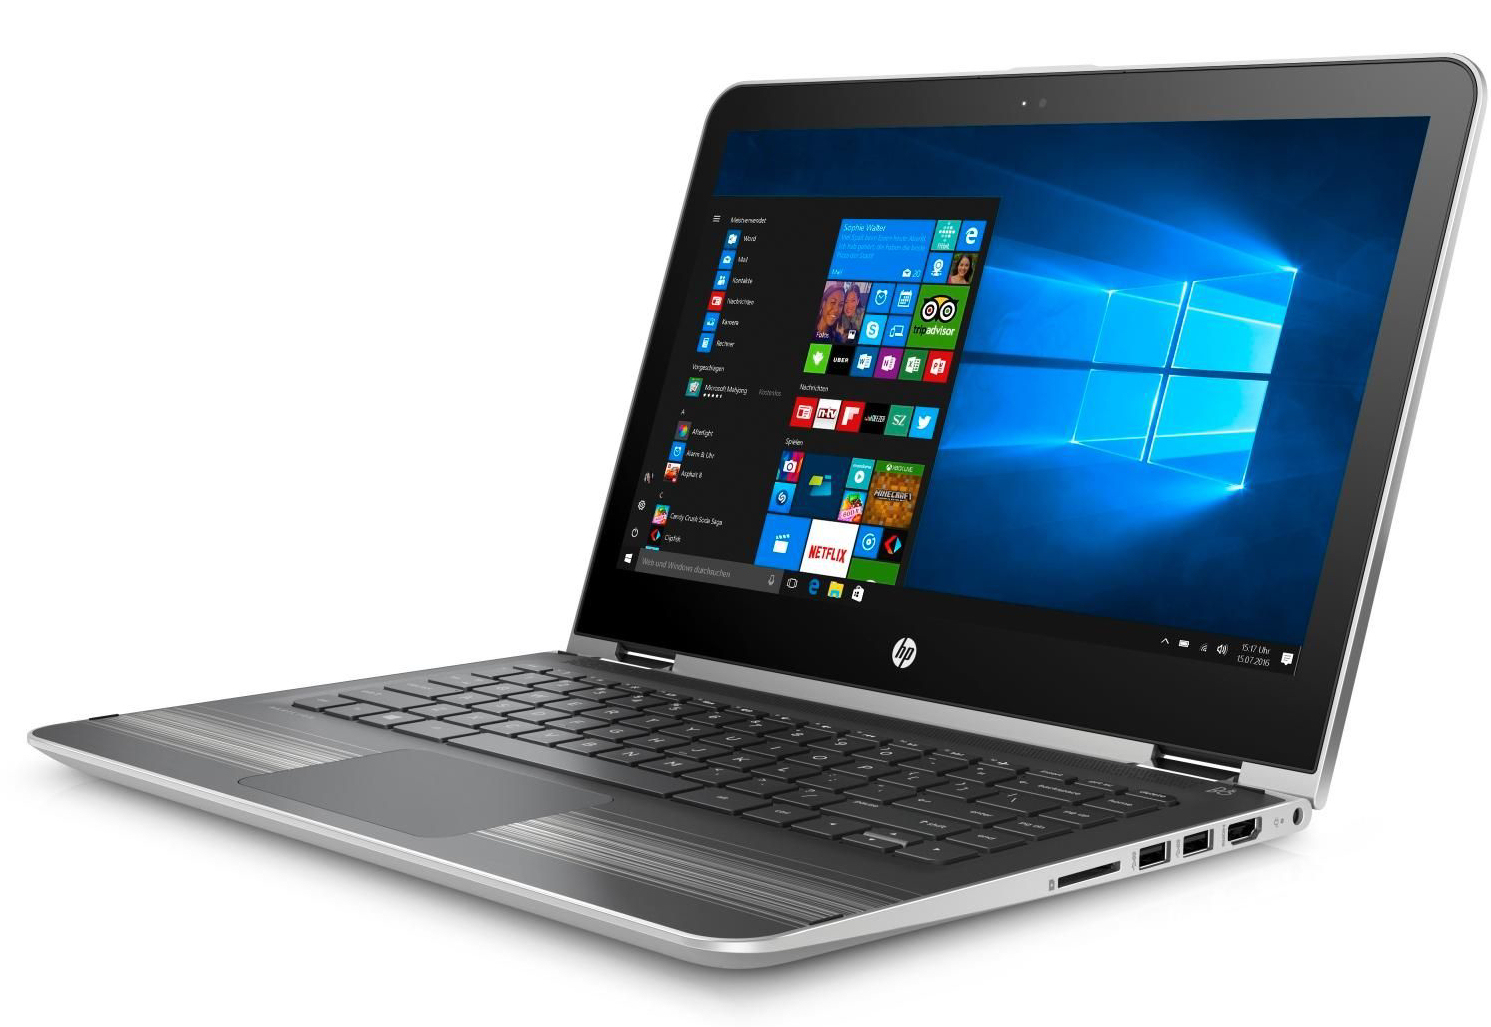
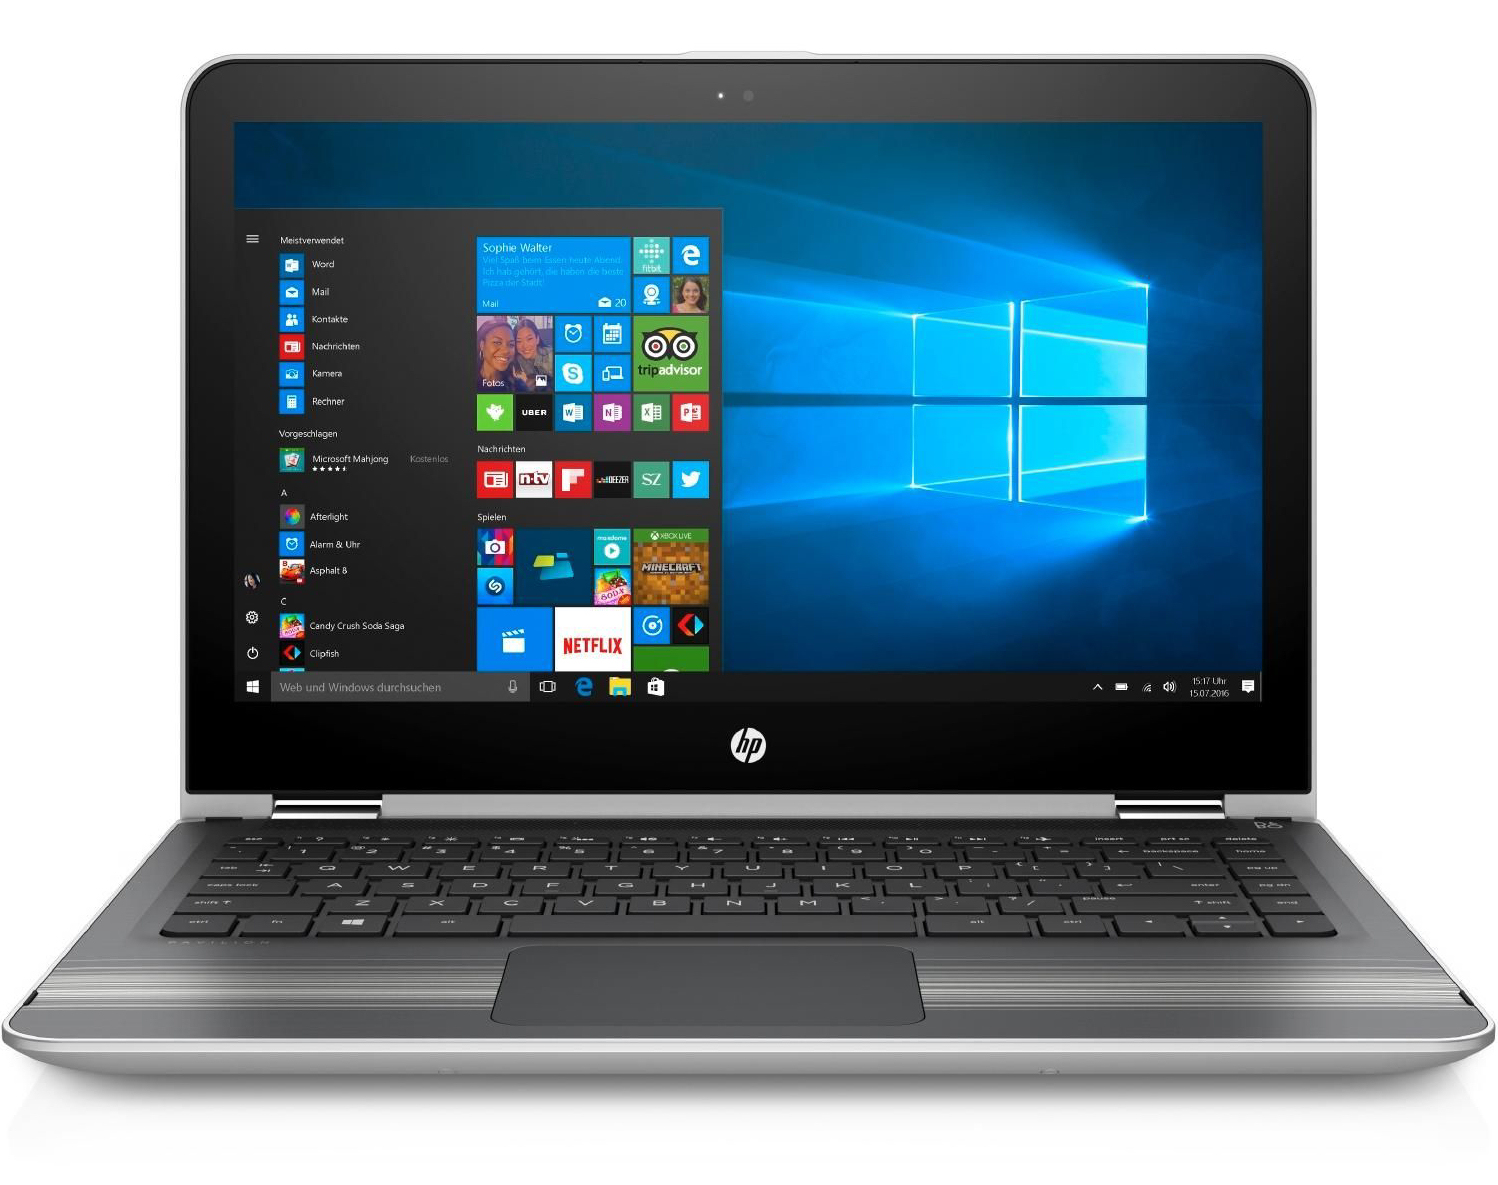
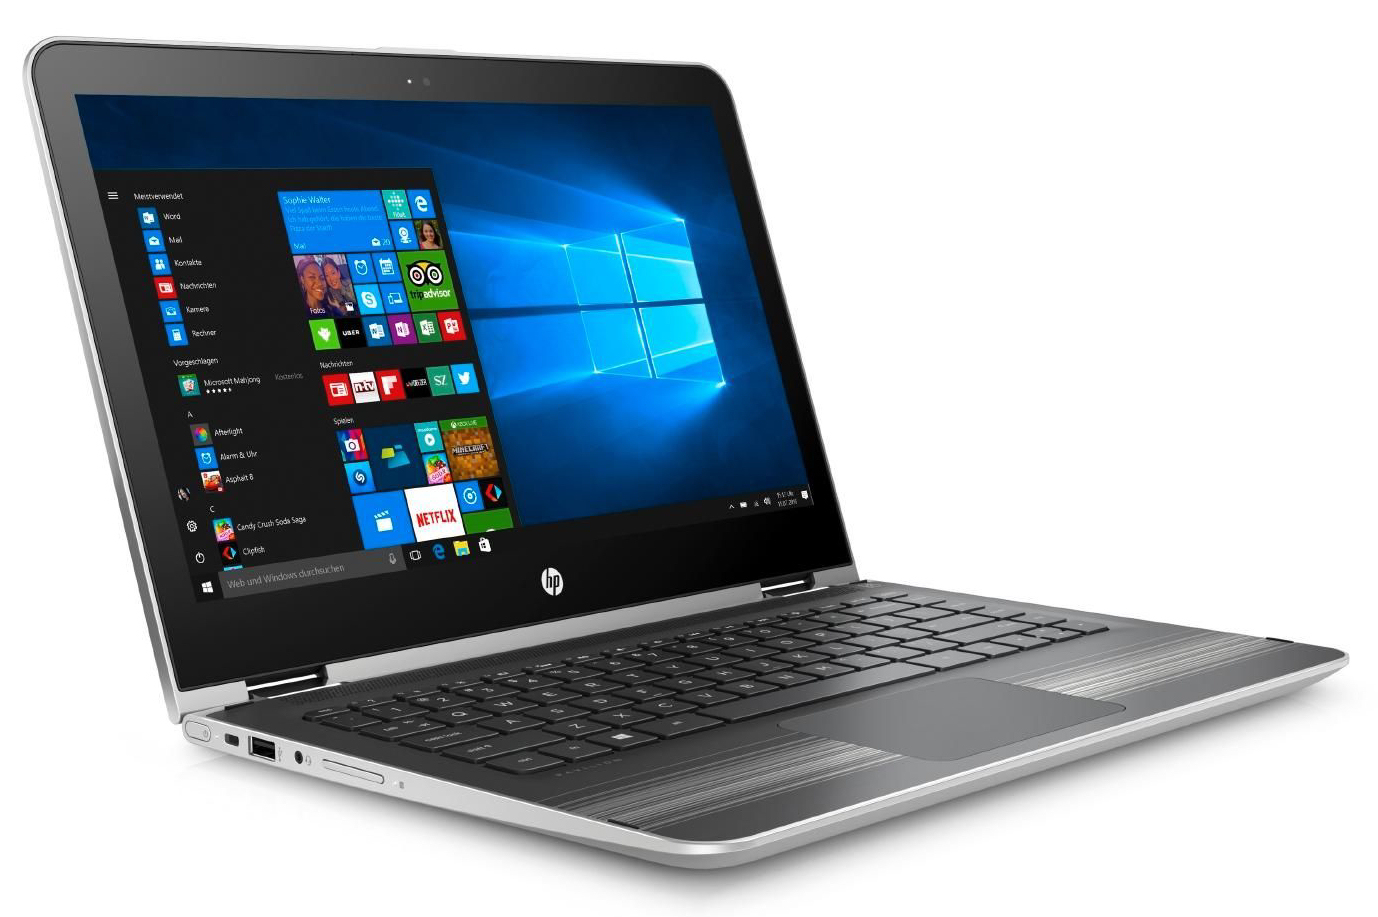
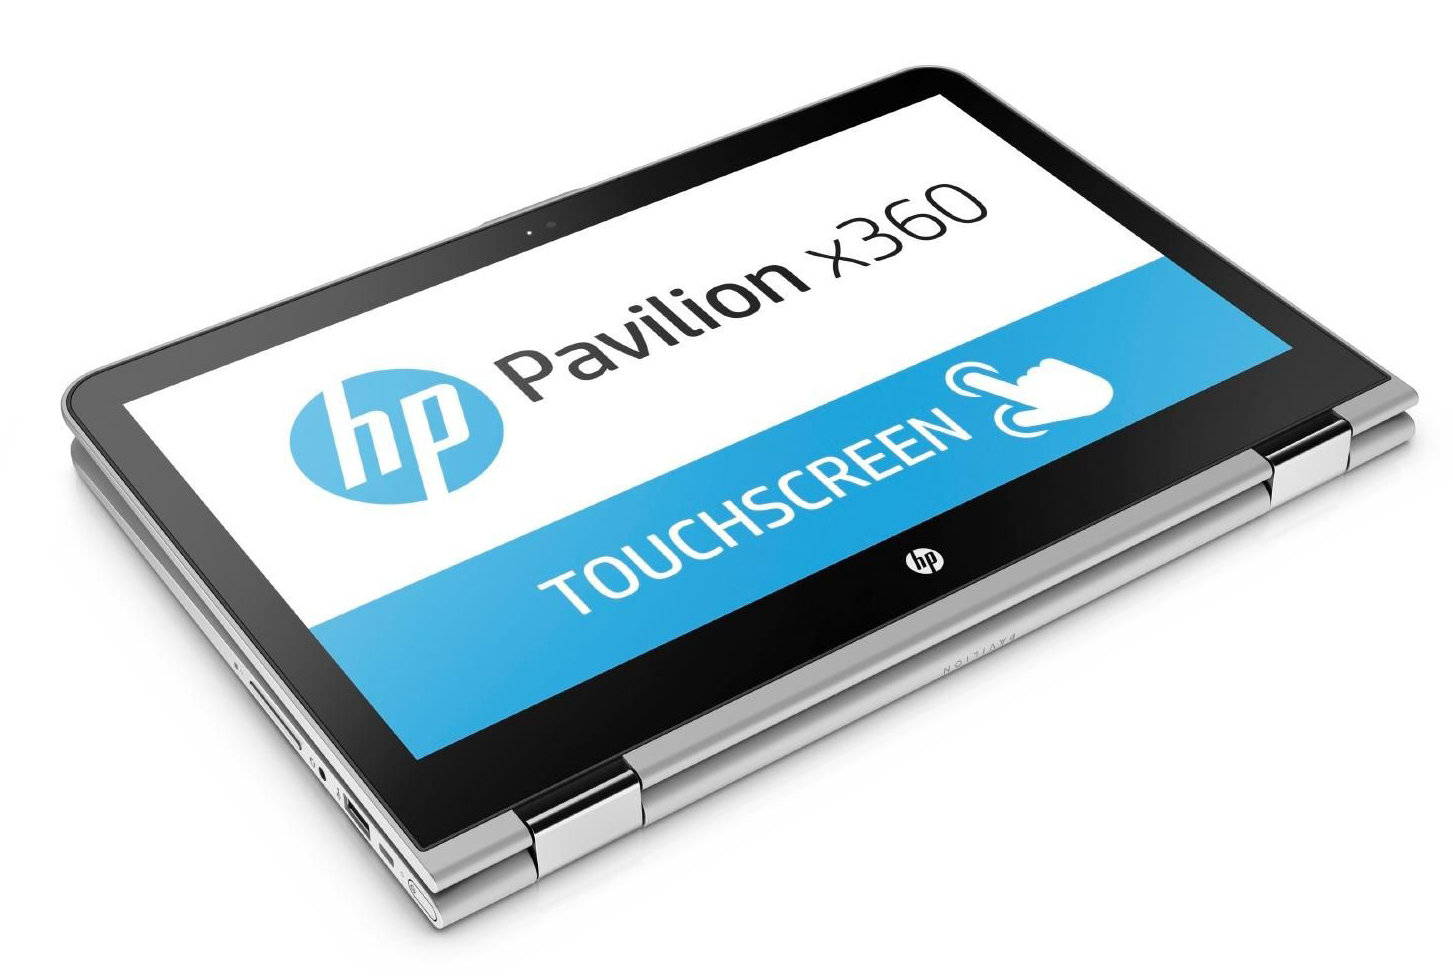
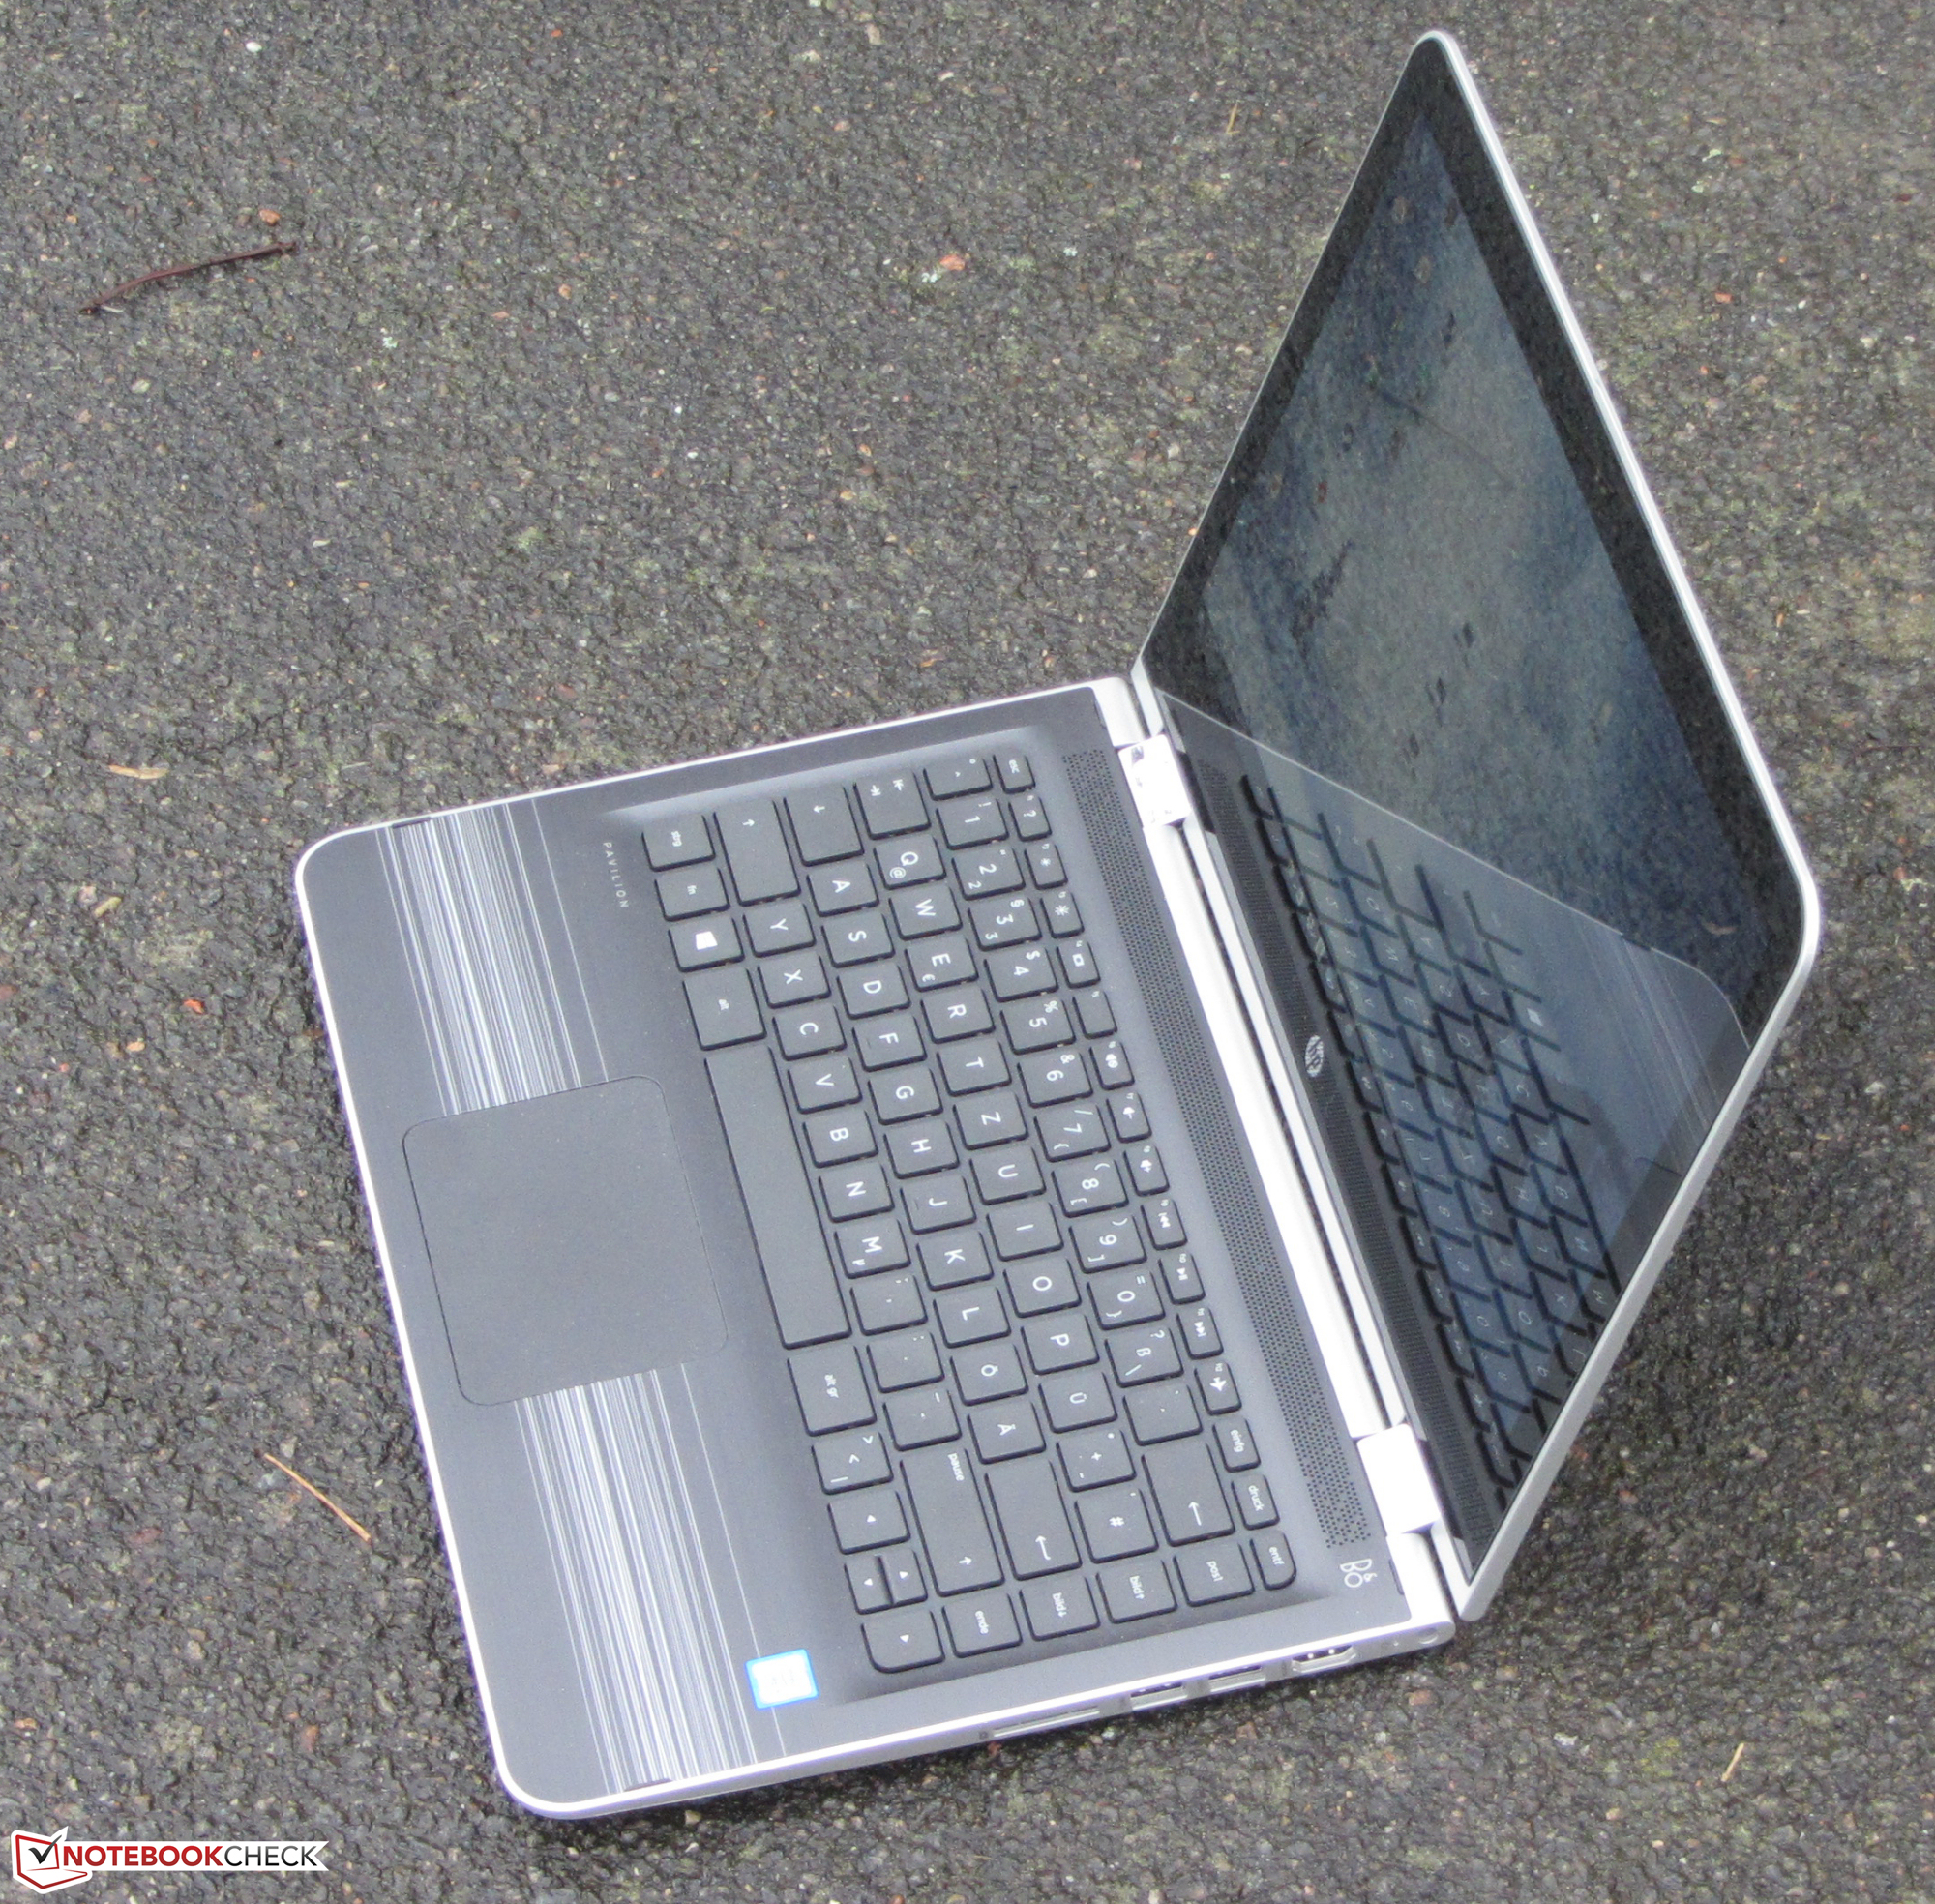
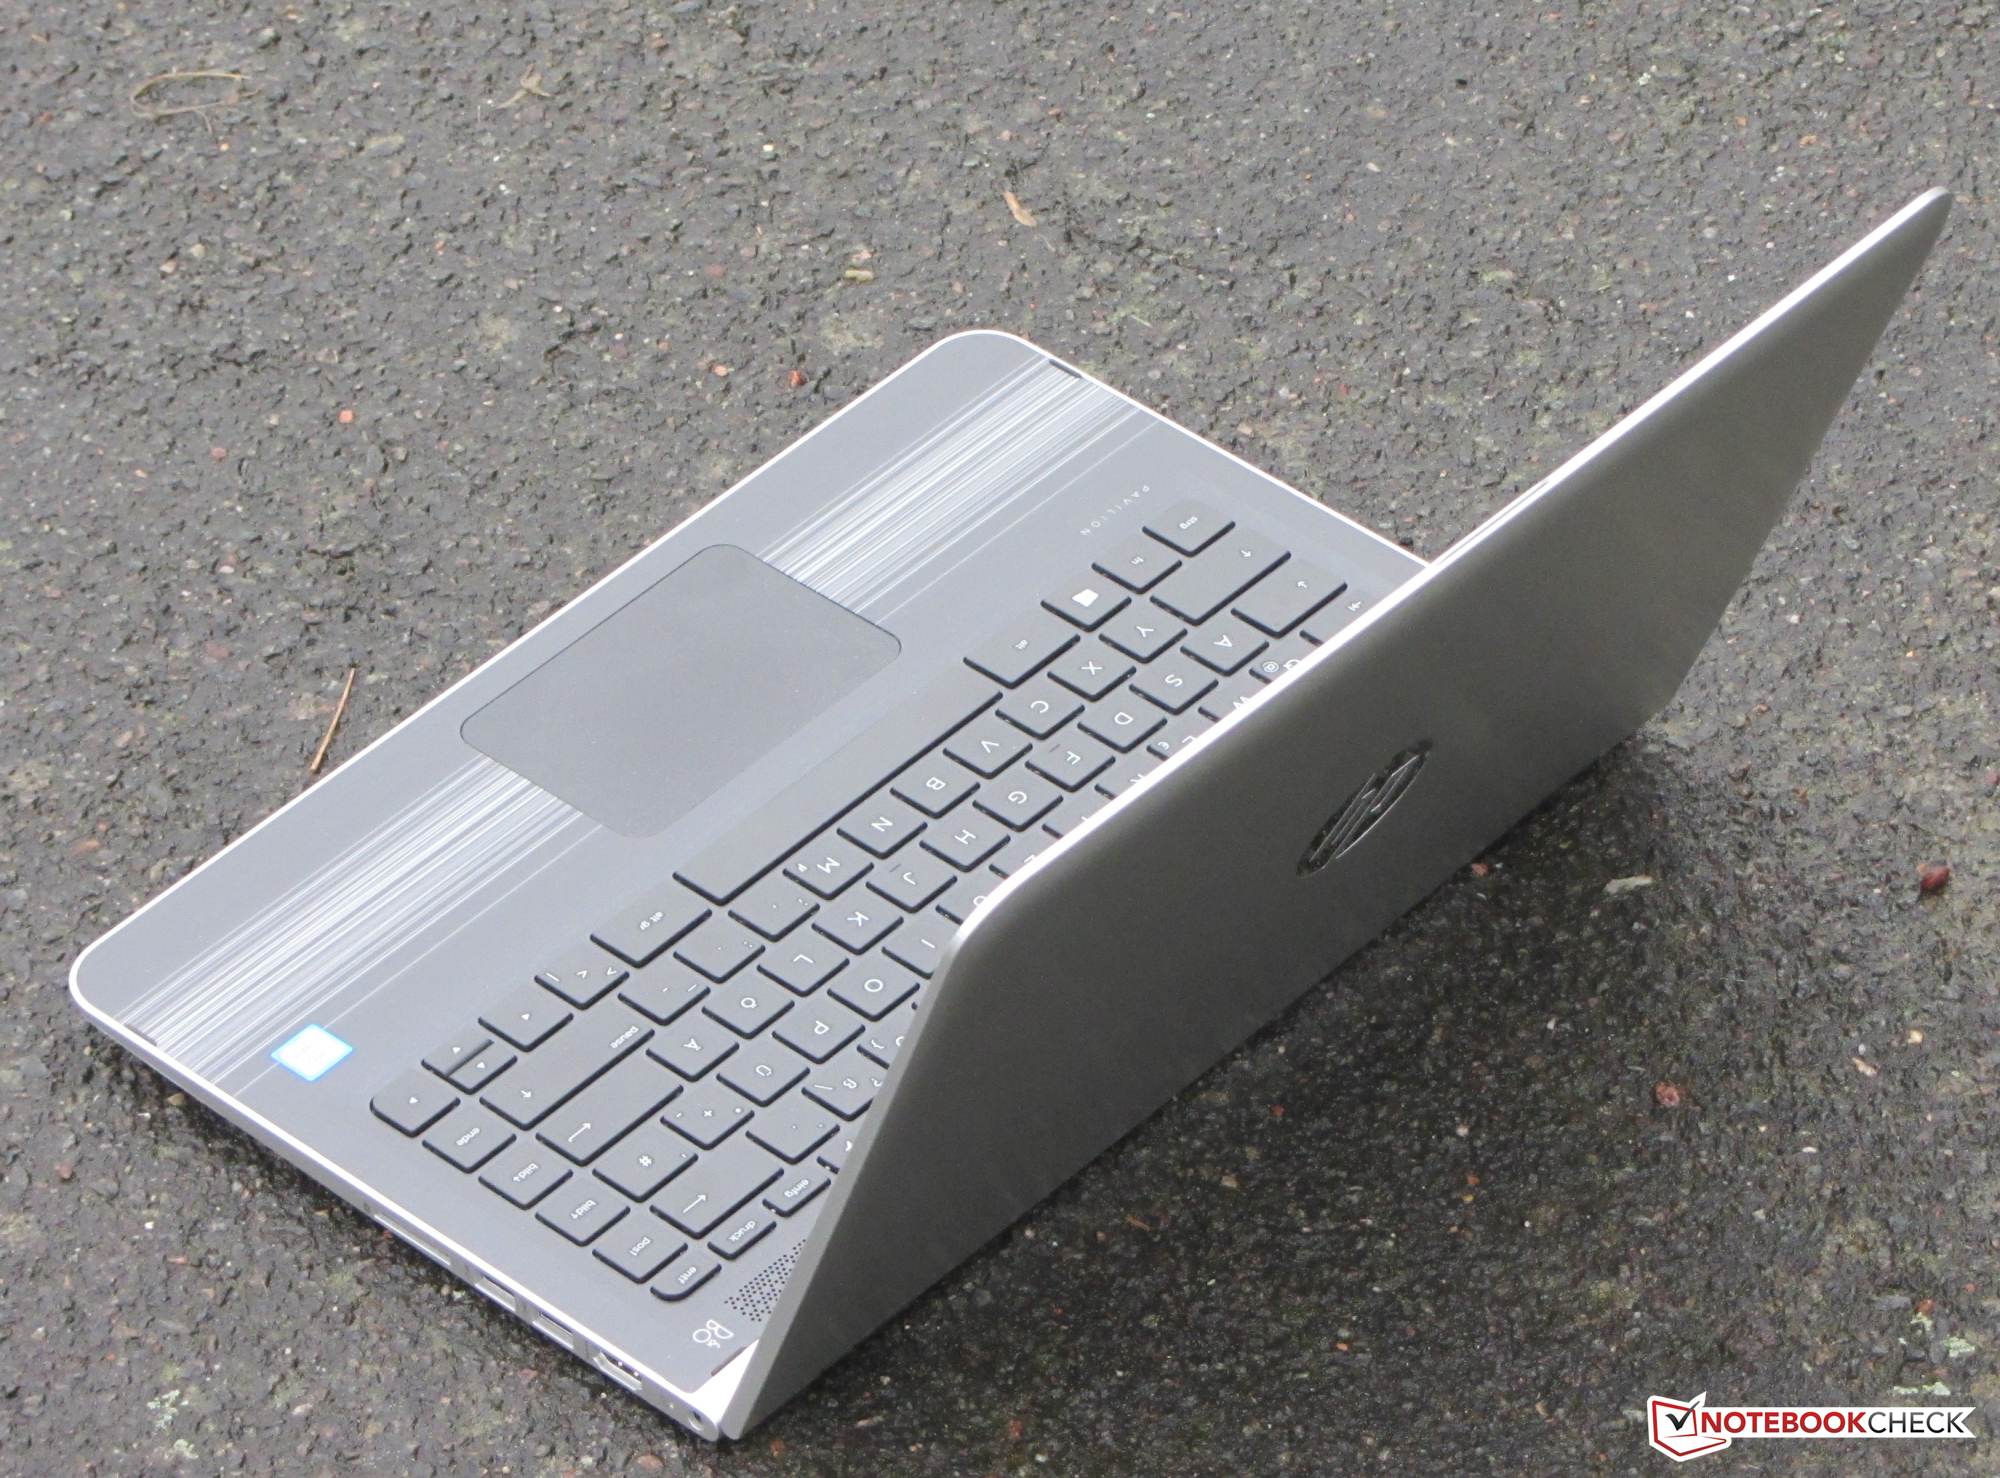
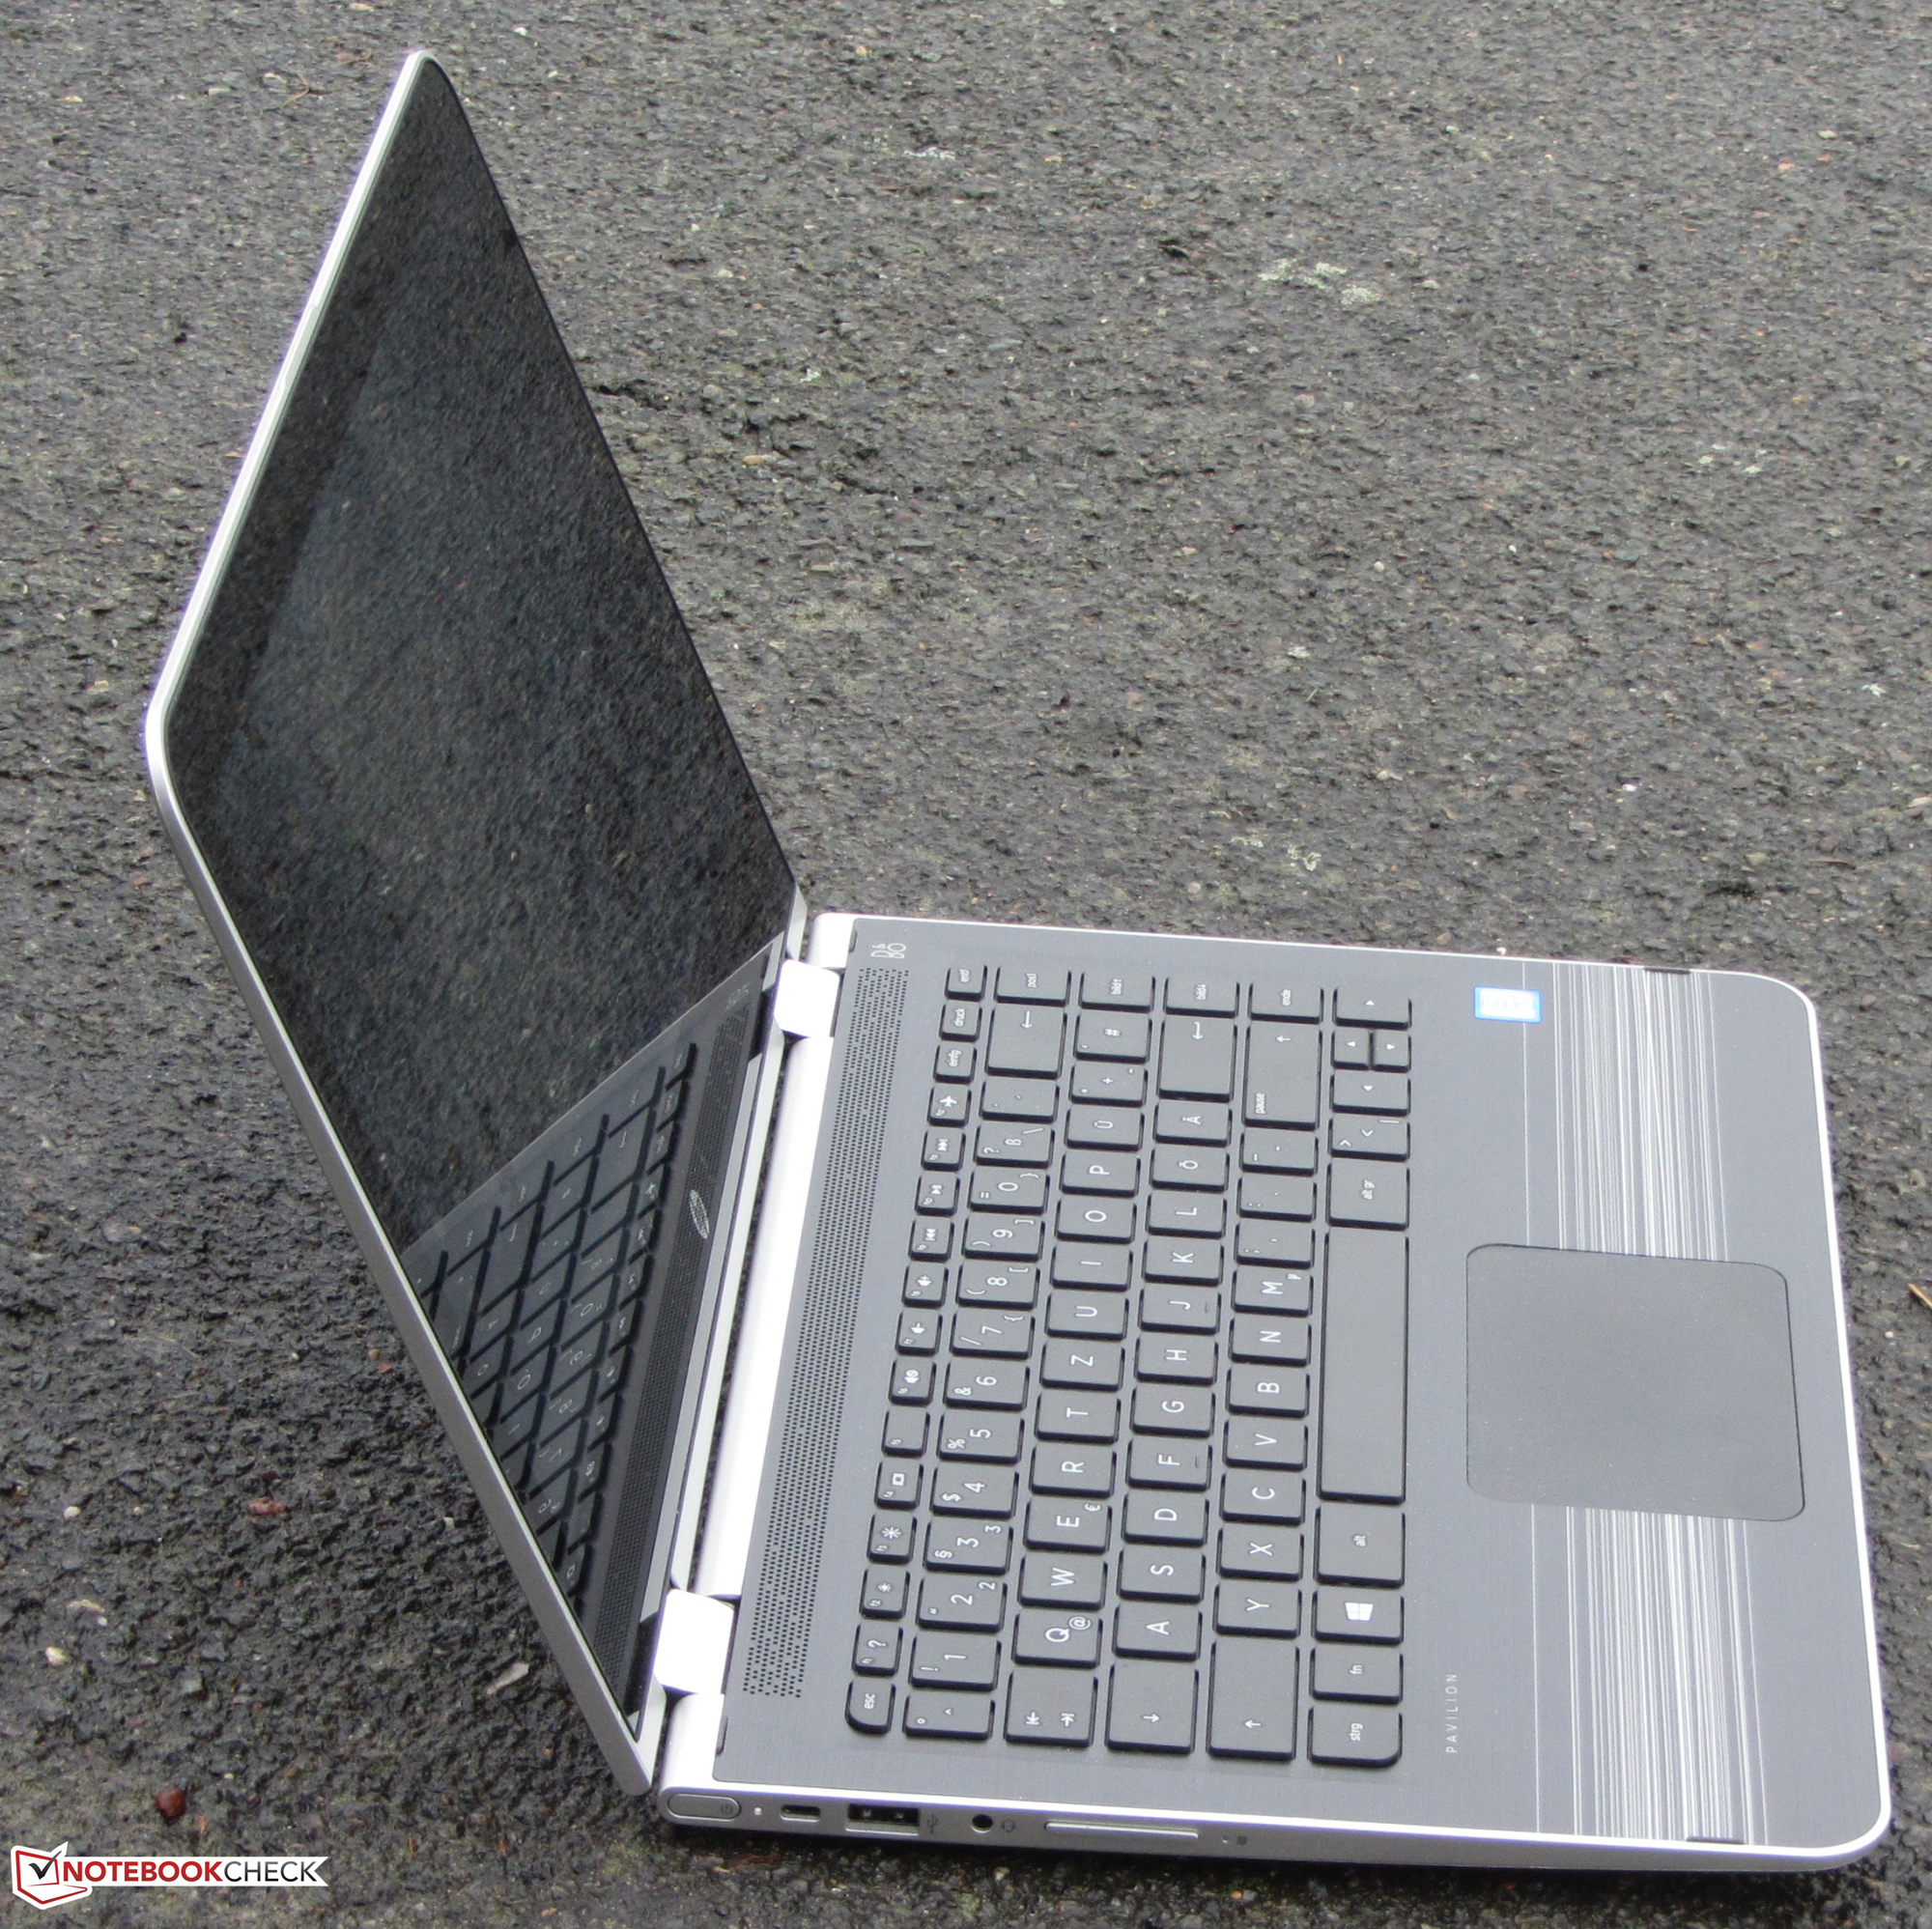
Pavilion x360 13-u102ng是惠普带来的一台13.3寸家用变形本。
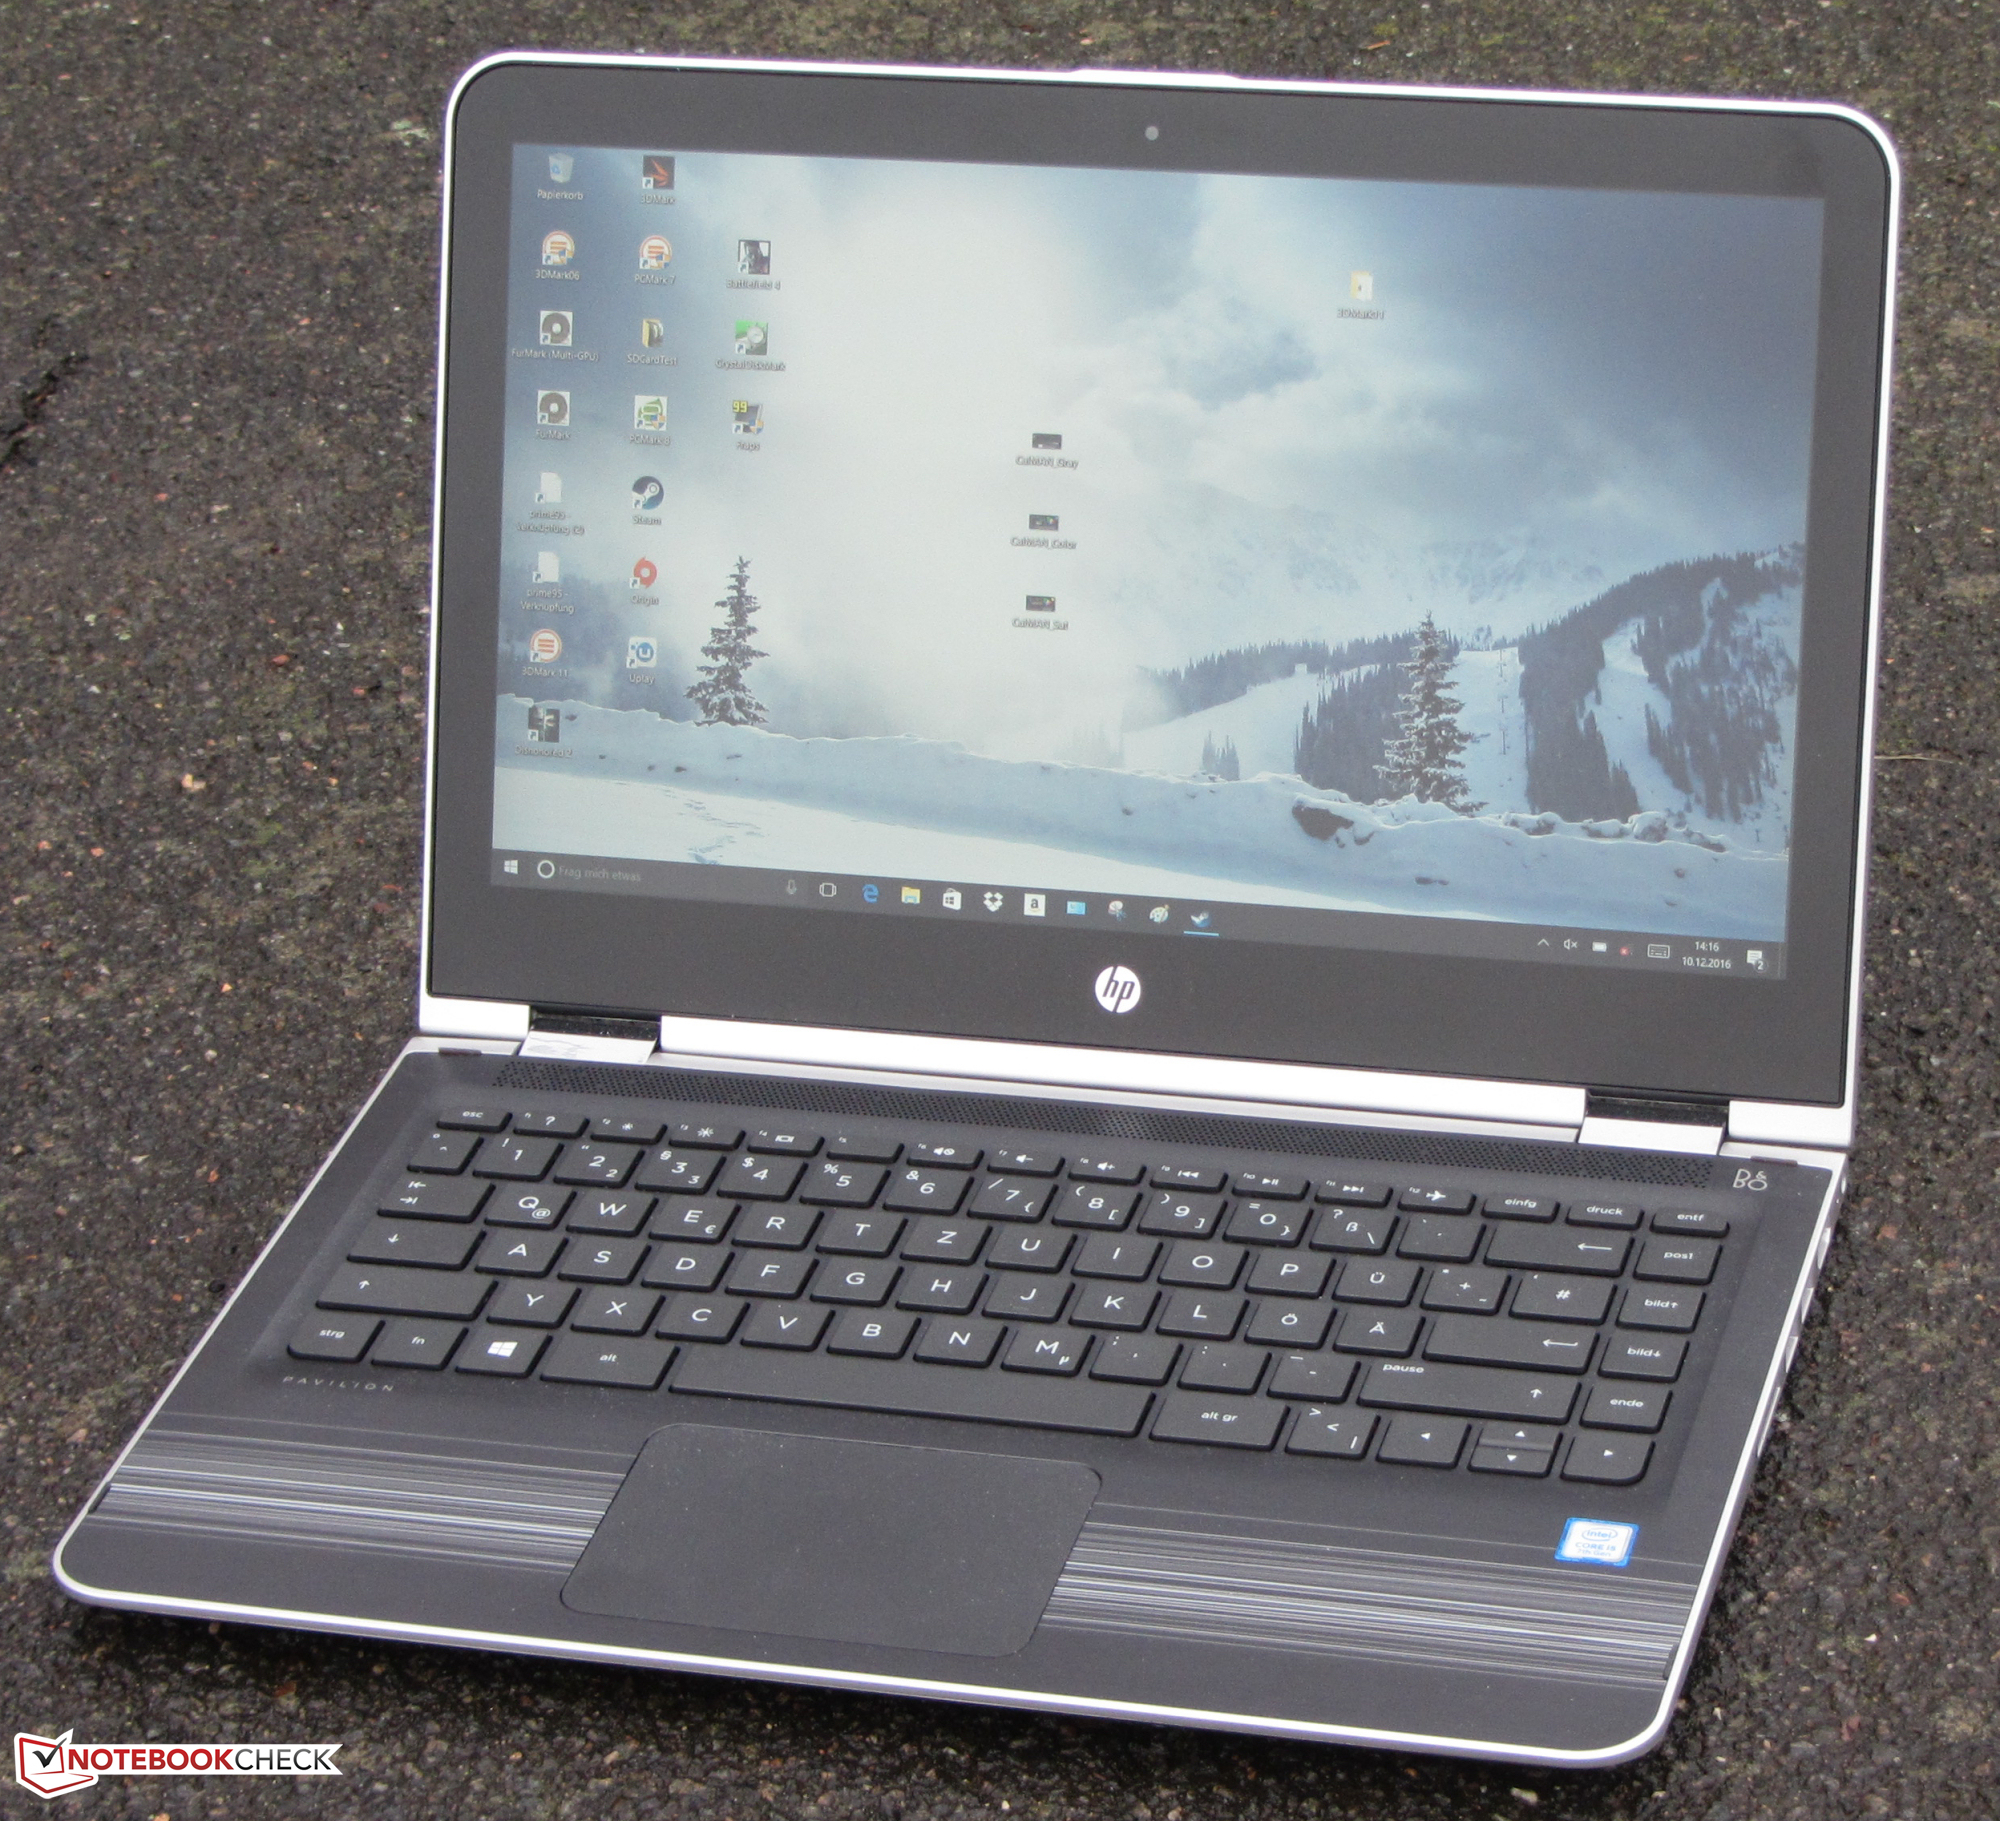
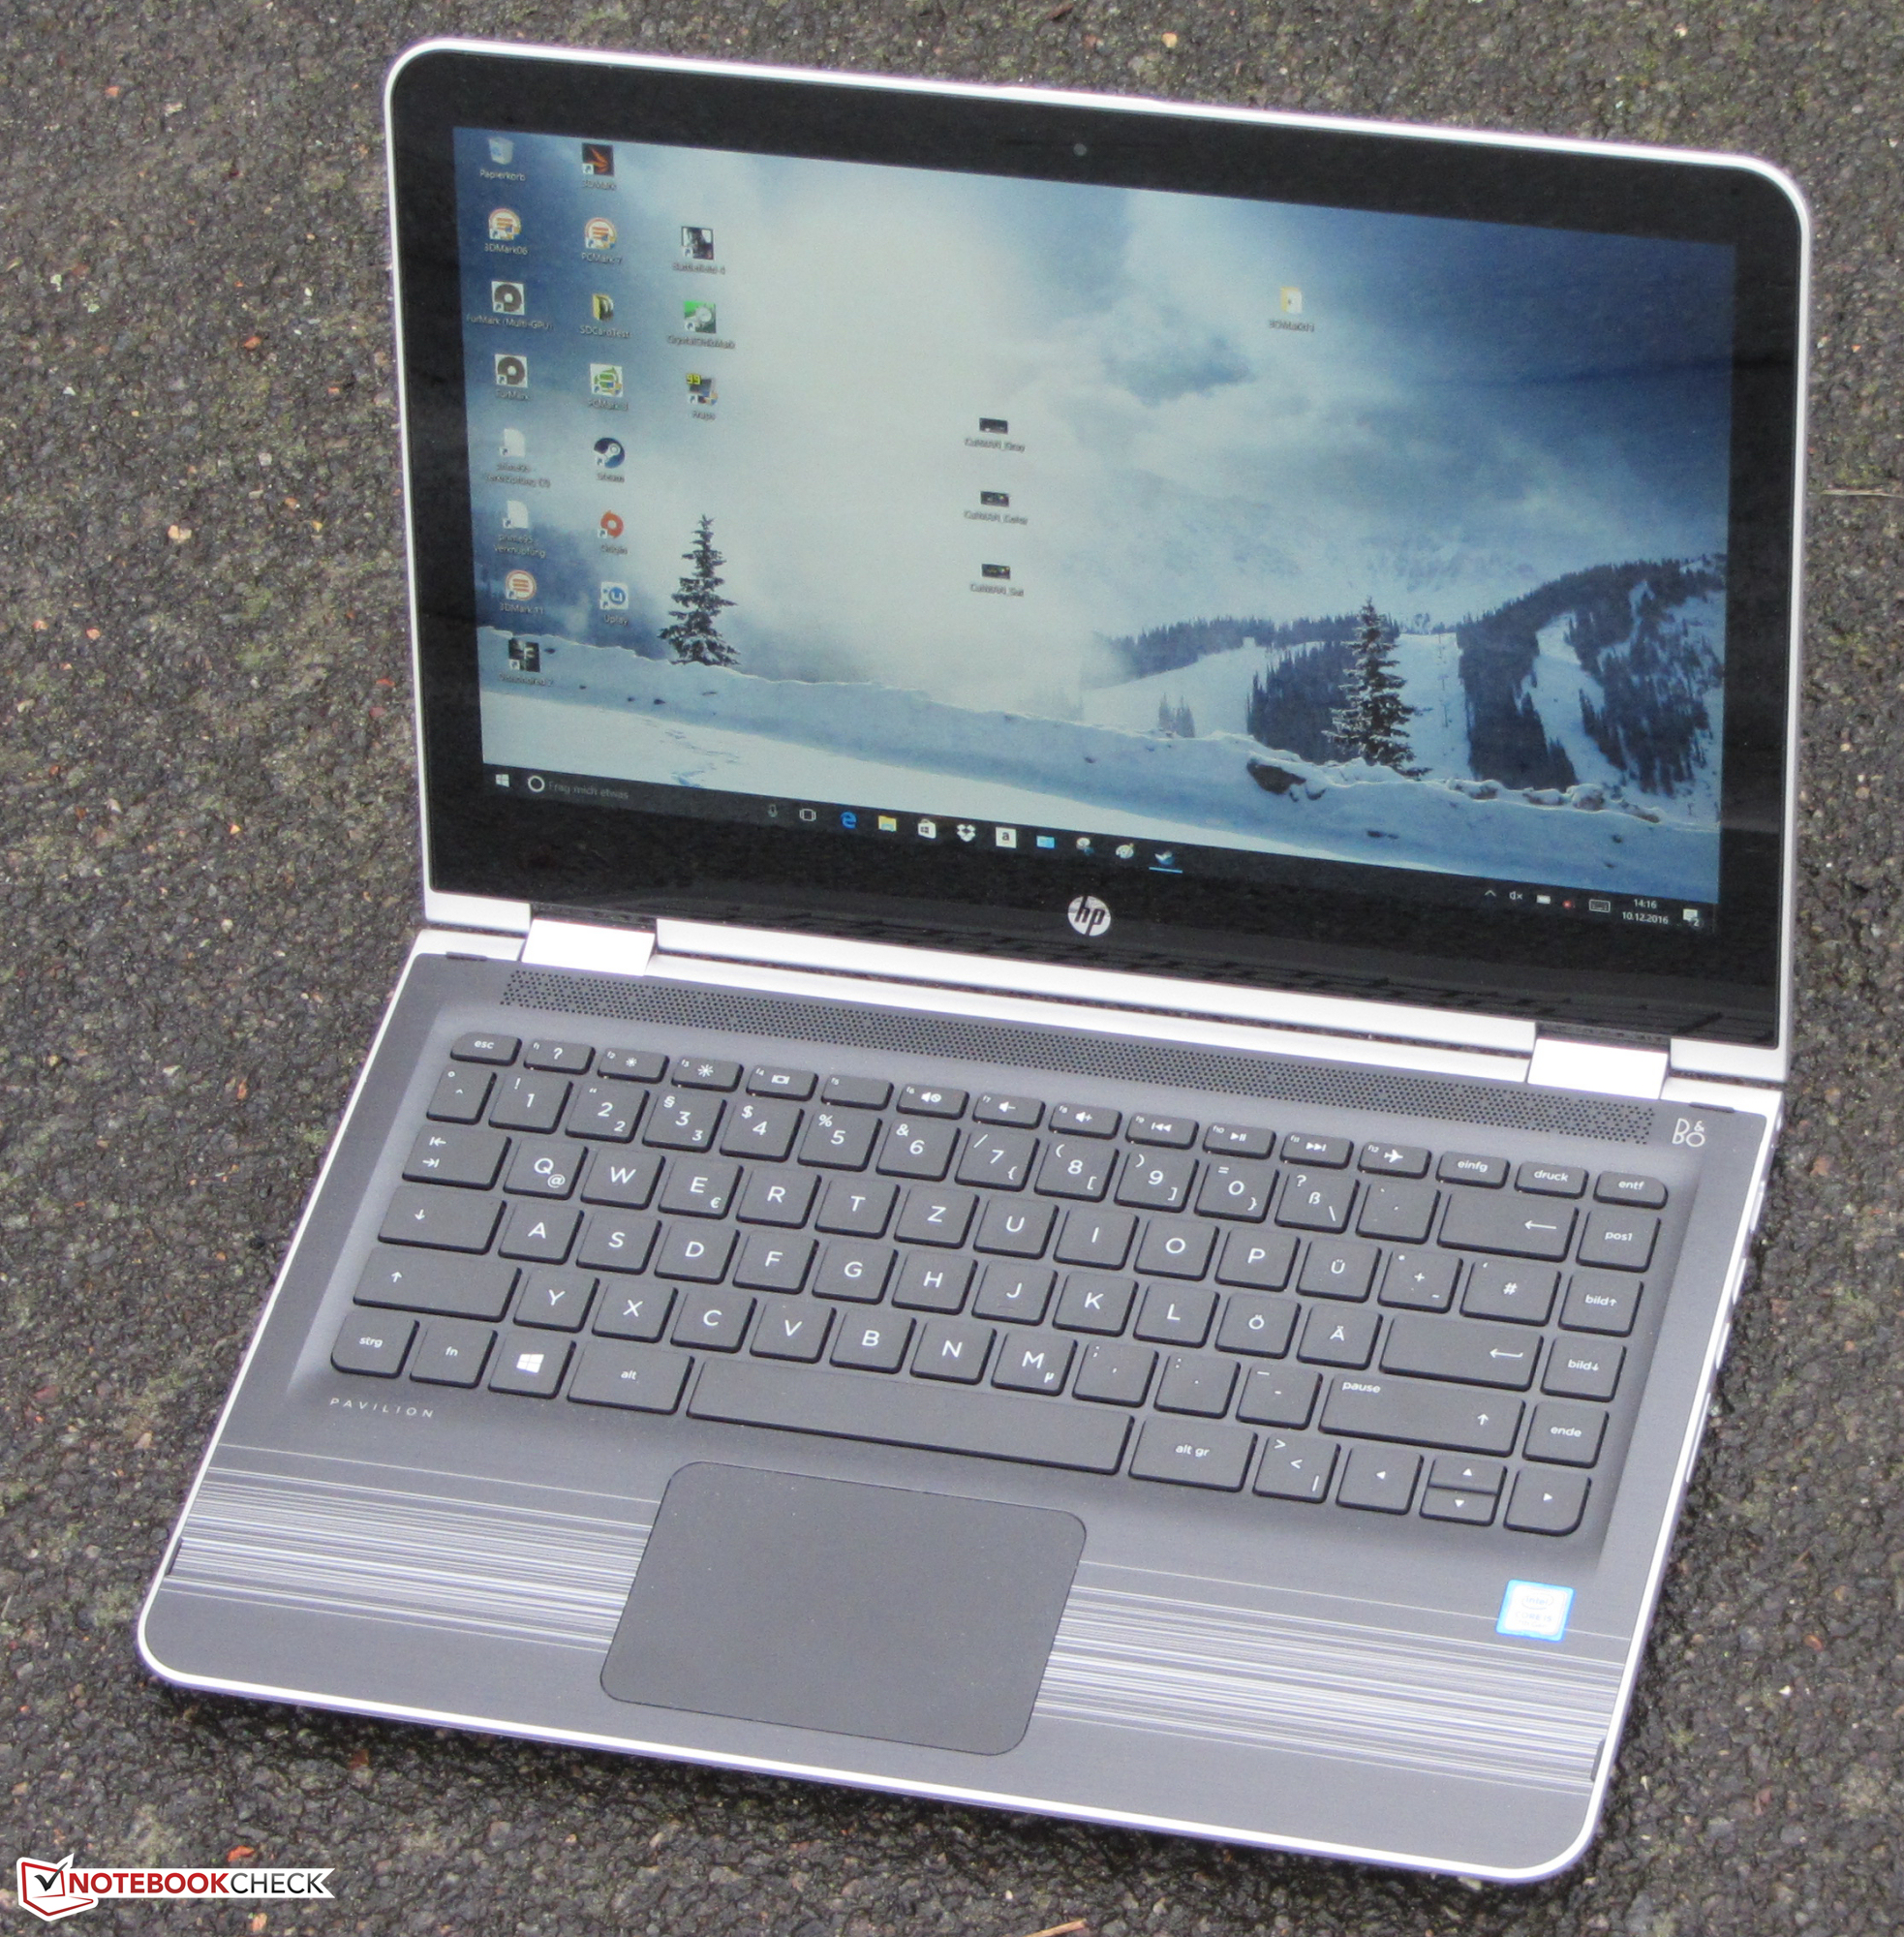
它的内置键盘提供了不错的输入体验,可以适合文字处理工作的需要。全高清的IPS屏幕可视角度稳定,对比度优秀。而在亮度上它则有些不足,不过考虑到这台设备的价位也无可厚非。它在惠普产品线中这台13.3寸设备应该算是一台对学生用户十分有吸引力的机型。遗憾的是它有限的续航会让一部分用户比较失望。另外,惠普只提供了一年质保,而最近的新设备大都提供了两年质保。
注:本文是基于完整评测的缩减版本,阅读完整的英文评测,请点击这里。
HP Pavilion x360 13-u102ng
- 12/14/2016 v6 (old)
Sascha Mölck