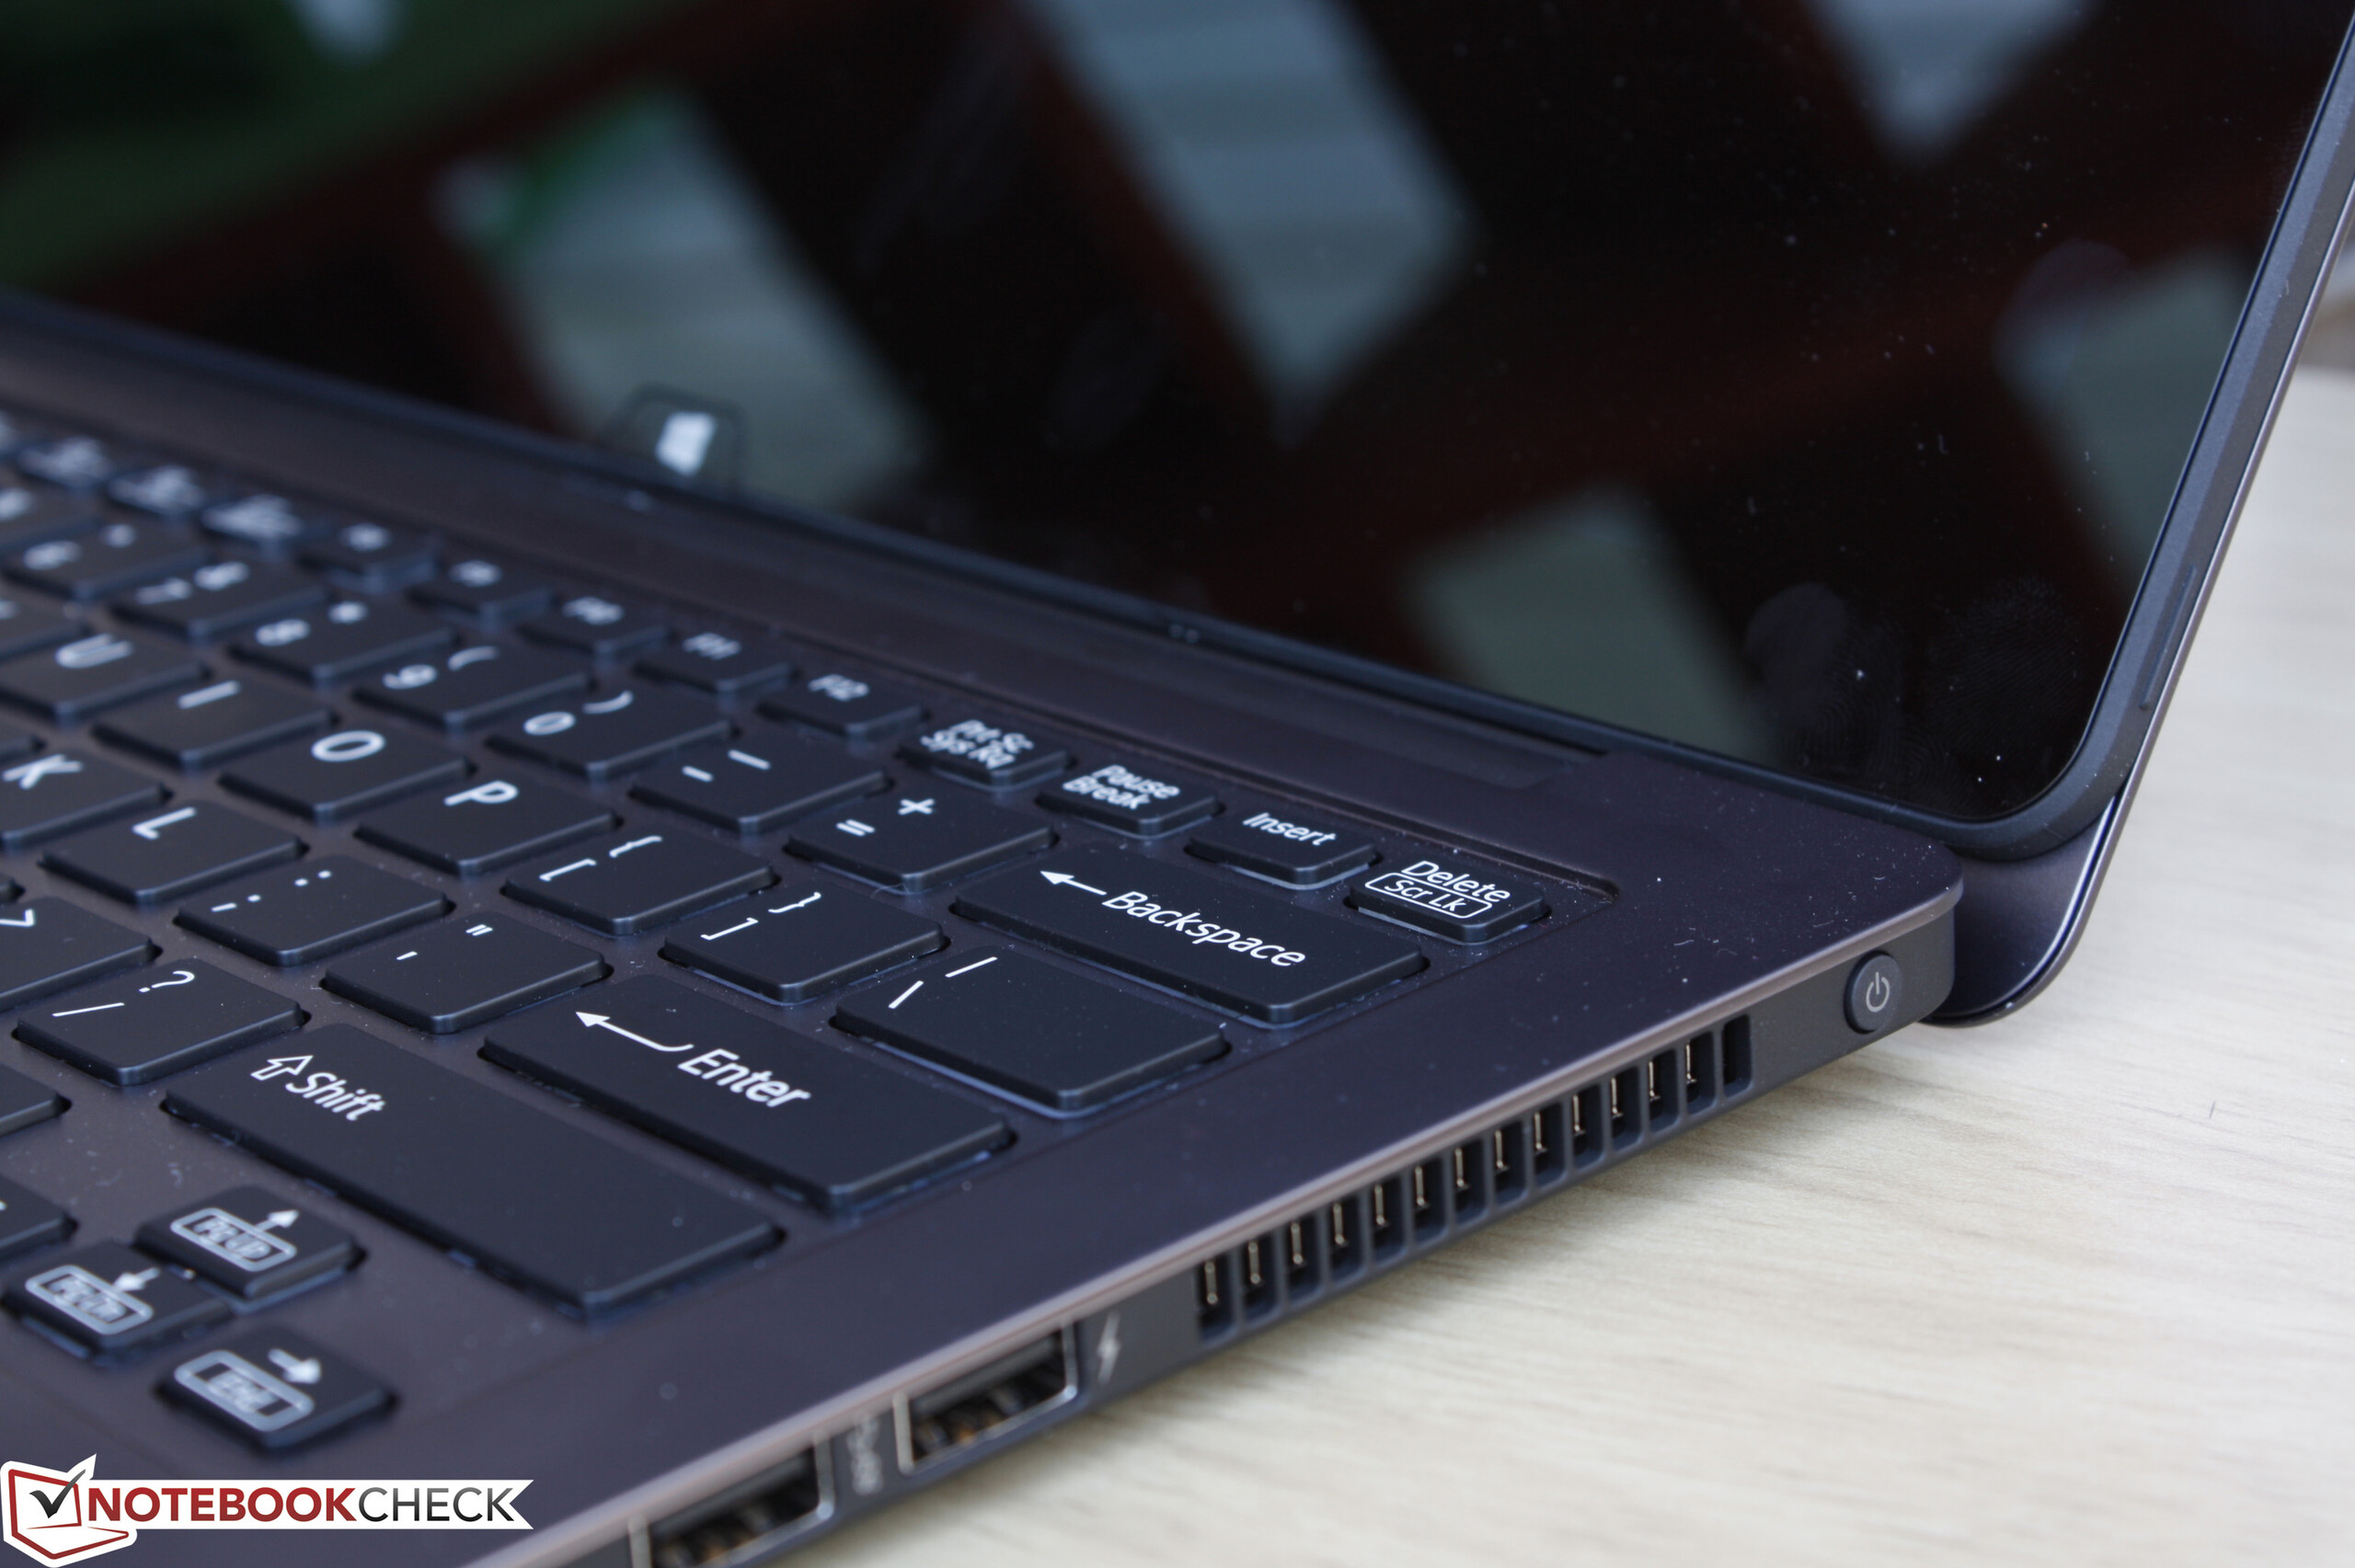
Vaio Z Flip VJZ13BA11L 变形本简短评测


| |||||||||||||||||||||||||
Brightness Distribution: 89 %
Center on Battery: 355.2 cd/m²
Contrast: 1246:1 (Black: 0.285 cd/m²)
ΔE ColorChecker Calman: 9.56 | ∀{0.5-29.43 Ø4.71}
ΔE Greyscale Calman: 4.08 | ∀{0.09-98 Ø4.96}
97.1% sRGB (Argyll 1.6.3 3D)
64.3% AdobeRGB 1998 (Argyll 1.6.3 3D)
69.4% AdobeRGB 1998 (Argyll 3D)
97.1% sRGB (Argyll 3D)
68.7% Display P3 (Argyll 3D)
Gamma: 2.33
CCT: 6560 K
| Sony Vaio Z Flip 13.3", 2560x1440 | Apple MacBook Air 13 inch 2015-03 13.3", 1440x900 | Lenovo Yoga 900-13ISK 80MK 13.3", 3200x1800 | Dell XPS 13 9350 WQXGA 13.3", 3200x1800 | Asus Zenbook UX303UA-R4051T 13.3", 1920x1080 | |
|---|---|---|---|---|---|
| Display | -40% | -8% | -6% | -3% | |
| Display P3 Coverage (%) | 68.7 | 40.1 -42% | 63.2 -8% | 63.6 -7% | 67.5 -2% |
| sRGB Coverage (%) | 97.1 | 59.8 -38% | 88.7 -9% | 92.3 -5% | 92.5 -5% |
| AdobeRGB 1998 Coverage (%) | 69.4 | 41.51 -40% | 64.9 -6% | 65.4 -6% | 67.7 -2% |
| Response Times | 7% | -22% | 18% | ||
| Response Time Grey 50% / Grey 80% * (ms) | 38.4 ? | 38.8 ? -1% | 50.8 ? -32% | 31 ? 19% | |
| Response Time Black / White * (ms) | 26.4 ? | 22.4 ? 15% | 29.6 ? -12% | 22 ? 17% | |
| PWM Frequency (Hz) | 1316 | 198 ? | |||
| Screen | -7% | -22% | 8% | -1% | |
| Brightness middle (cd/m²) | 355.2 | 329 -7% | 319.8 -10% | 307.5 -13% | 357 1% |
| Brightness (cd/m²) | 354 | 310 -12% | 302 -15% | 297 -16% | 351 -1% |
| Brightness Distribution (%) | 89 | 82 -8% | 88 -1% | 92 3% | 90 1% |
| Black Level * (cd/m²) | 0.285 | 0.405 -42% | 0.835 -193% | 0.207 27% | 0.58 -104% |
| Contrast (:1) | 1246 | 812 -35% | 383 -69% | 1486 19% | 616 -51% |
| Colorchecker dE 2000 * | 9.56 | 3.96 59% | 2.68 72% | 4.18 56% | 3.39 65% |
| Colorchecker dE 2000 max. * | 12.81 | 7.51 41% | 7.84 39% | 6.76 47% | |
| Greyscale dE 2000 * | 4.08 | 3.51 14% | 2.35 42% | 4.94 -21% | 2.36 42% |
| Gamma | 2.33 94% | 3.83 57% | 2.09 105% | 2.31 95% | 2.2 100% |
| CCT | 6560 99% | 6711 97% | 6975 93% | 7645 85% | 6653 98% |
| Color Space (Percent of AdobeRGB 1998) (%) | 64.3 | 38.4 -40% | 57 -11% | 59 -8% | 60 -7% |
| Color Space (Percent of sRGB) (%) | 97.1 | 59.8 -38% | 88 -9% | 92 -5% | 93 -4% |
| Total Average (Program / Settings) | -24% /
-14% | -8% /
-15% | -7% /
1% | 5% /
1% |
* ... smaller is better
Display Response Times
| ↔ Response Time Black to White | ||
|---|---|---|
| 26.4 ms ... rise ↗ and fall ↘ combined | ↗ 6.8 ms rise | 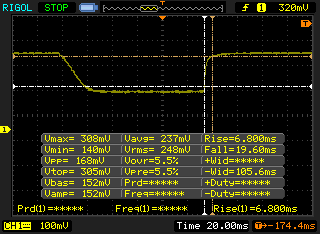 |
| ↘ 19.6 ms fall | ||
| The screen shows relatively slow response rates in our tests and may be too slow for gamers. In comparison, all tested devices range from 0.1 (minimum) to 240 (maximum) ms. » 66 % of all devices are better. This means that the measured response time is worse than the average of all tested devices (19.8 ms). | ||
| ↔ Response Time 50% Grey to 80% Grey | ||
| 38.4 ms ... rise ↗ and fall ↘ combined | ↗ 14.8 ms rise | 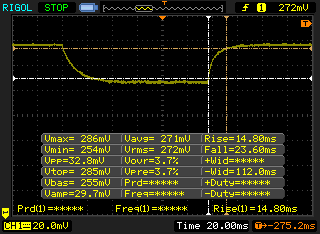 |
| ↘ 23.6 ms fall | ||
| The screen shows slow response rates in our tests and will be unsatisfactory for gamers. In comparison, all tested devices range from 0.165 (minimum) to 636 (maximum) ms. » 58 % of all devices are better. This means that the measured response time is worse than the average of all tested devices (31 ms). | ||
Screen Flickering / PWM (Pulse-Width Modulation)
| Screen flickering / PWM not detected | 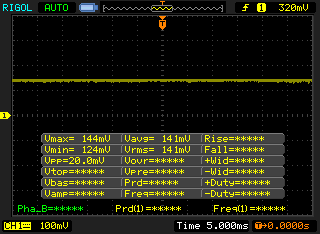 | ||
In comparison: 52 % of all tested devices do not use PWM to dim the display. If PWM was detected, an average of 7754 (minimum: 5 - maximum: 343500) Hz was measured. | |||
| Cinebench R15 | |
| CPU Single 64Bit (sort by value) | |
| Sony Vaio Z Flip | |
| Asus GL552VW-DH74 | |
| Clevo W230SD | |
| HP ProBook 650 G2 T8X61EA | |
| Razer Blade Stealth UHD i7-6500U | |
| CPU Multi 64Bit (sort by value) | |
| Sony Vaio Z Flip | |
| Asus GL552VW-DH74 | |
| Clevo W230SD | |
| HP ProBook 650 G2 T8X61EA | |
| Razer Blade Stealth UHD i7-6500U | |
| Cinebench R11.5 | |
| CPU Single 64Bit (sort by value) | |
| Sony Vaio Z Flip | |
| Asus GL552VW-DH74 | |
| Clevo W230SD | |
| HP ProBook 650 G2 T8X61EA | |
| Razer Blade Stealth UHD i7-6500U | |
| CPU Multi 64Bit (sort by value) | |
| Sony Vaio Z Flip | |
| Asus GL552VW-DH74 | |
| Clevo W230SD | |
| HP ProBook 650 G2 T8X61EA | |
| Razer Blade Stealth UHD i7-6500U | |
| Cinebench R10 | |
| Rendering Single 32Bit (sort by value) | |
| Sony Vaio Z Flip | |
| Asus GL552VW-DH74 | |
| Clevo W230SD | |
| HP ProBook 650 G2 T8X61EA | |
| Razer Blade Stealth UHD i7-6500U | |
| Rendering Multiple CPUs 32Bit (sort by value) | |
| Sony Vaio Z Flip | |
| Asus GL552VW-DH74 | |
| Clevo W230SD | |
| HP ProBook 650 G2 T8X61EA | |
| Razer Blade Stealth UHD i7-6500U | |
| wPrime 2.10 - 1024m (sort by value) | |
| Sony Vaio Z Flip | |
| Asus GL552VW-DH74 | |
| Clevo W230SD | |
| HP ProBook 650 G2 T8X61EA | |
| Razer Blade Stealth UHD i7-6500U | |
| Super Pi Mod 1.5 XS 32M - 32M (sort by value) | |
| Sony Vaio Z Flip | |
| Asus GL552VW-DH74 | |
| Clevo W230SD | |
| HP ProBook 650 G2 T8X61EA | |
| Razer Blade Stealth UHD i7-6500U | |
* ... smaller is better
| PCMark 8 | |
| Home Score Accelerated v2 (sort by value) | |
| Sony Vaio Z Flip | |
| Apple MacBook Air 13 inch 2015-03 | |
| Asus Zenbook UX303UA-R4051T | |
| Dell XPS 13 9350 WQXGA | |
| Lenovo Yoga 900-13ISK 80MK | |
| Work Score Accelerated v2 (sort by value) | |
| Sony Vaio Z Flip | |
| Apple MacBook Air 13 inch 2015-03 | |
| Asus Zenbook UX303UA-R4051T | |
| Dell XPS 13 9350 WQXGA | |
| Lenovo Yoga 900-13ISK 80MK | |
| Creative Score Accelerated v2 (sort by value) | |
| Sony Vaio Z Flip | |
| Apple MacBook Air 13 inch 2015-03 | |
| Asus Zenbook UX303UA-R4051T | |
| Dell XPS 13 9350 WQXGA | |
| Lenovo Yoga 900-13ISK 80MK | |
| PCMark 7 Score | 5449 points | |
| PCMark 8 Home Score Accelerated v2 | 3424 points | |
| PCMark 8 Creative Score Accelerated v2 | 4321 points | |
| PCMark 8 Work Score Accelerated v2 | 4432 points | |
Help | ||
| Sony Vaio Z Flip Iris Graphics 550, 6567U, Samsung SM951 MZVPV256 m.2 | Apple MacBook Air 13 inch 2015-03 HD Graphics 6000, 5650U, Apple SSD SD0256F | Lenovo Yoga 900-13ISK 80MK HD Graphics 520, 6500U, Samsung SSD PM871 MZNLN512HCJH | Dell XPS 13 9350 WQXGA Iris Graphics 540, 6560U, Samsung PM951 NVMe 512 GB | Asus Zenbook UX303UA-R4051T HD Graphics 520, 6500U, SK hynix SSD Canvas SC300 HFS256G32MND | |
|---|---|---|---|---|---|
| AS SSD | -70% | -43% | 9% | -71% | |
| Copy Game MB/s (MB/s) | 639 | 479.3 -25% | 298.7 -53% | 753 18% | 198.8 -69% |
| Copy Program MB/s (MB/s) | 349.2 | 245 -30% | 249.6 -29% | 271.8 -22% | 160.3 -54% |
| Copy ISO MB/s (MB/s) | 731 | 643 -12% | 364.5 -50% | 1041 42% | 249.3 -66% |
| Score Total (Points) | 2323 | 2383 3% | 1129 -51% | 3158 36% | 909 -61% |
| Score Write (Points) | 559 | 463 -17% | 429 -23% | 664 19% | 308 -45% |
| Score Read (Points) | 1187 | 1281 8% | 458 -61% | 1679 41% | 399 -66% |
| Access Time Write * (ms) | 0.031 | 0.155 -400% | 0.039 -26% | 0.031 -0% | 0.07 -126% |
| Access Time Read * (ms) | 0.039 | 0.171 -338% | 0.054 -38% | 0.046 -18% | 0.1 -156% |
| 4K-64 Write (MB/s) | 326.4 | 338.9 4% | 303 -7% | 492 51% | 213.4 -35% |
| 4K-64 Read (MB/s) | 949 | 1140 20% | 374.8 -61% | 1497 58% | 331.2 -65% |
| 4K Write (MB/s) | 121.8 | 23.73 -81% | 80.6 -34% | 116.5 -4% | 65.1 -47% |
| 4K Read (MB/s) | 47.59 | 19.16 -60% | 32.29 -32% | 38.29 -20% | 20.4 -57% |
| Seq Write (MB/s) | 1107 | 1001 -10% | 454.6 -59% | 559 -50% | 301.6 -73% |
| Seq Read (MB/s) | 1896 | 1212 -36% | 505 -73% | 1442 -24% | 474.5 -75% |
* ... smaller is better

| 3DMark 11 | |
| 1280x720 Performance (sort by value) | |
| Sony Vaio Z Flip | |
| MSI PE60 2QD | |
| Lenovo Ideapad 500s-14ISK | |
| Apple MacBook Pro Retina 13 inch 2015-03 | |
| Lenovo ThinkPad T460p | |
| Toshiba Portege Z30t-B1320W10 | |
| 1280x720 Performance GPU (sort by value) | |
| Sony Vaio Z Flip | |
| MSI PE60 2QD | |
| Lenovo Ideapad 500s-14ISK | |
| Apple MacBook Pro Retina 13 inch 2015-03 | |
| Lenovo ThinkPad T460p | |
| Toshiba Portege Z30t-B1320W10 | |
| 1280x720 Performance Physics (sort by value) | |
| Sony Vaio Z Flip | |
| MSI PE60 2QD | |
| Lenovo Ideapad 500s-14ISK | |
| Apple MacBook Pro Retina 13 inch 2015-03 | |
| Lenovo ThinkPad T460p | |
| Toshiba Portege Z30t-B1320W10 | |
| 1280x720 Performance Combined (sort by value) | |
| Sony Vaio Z Flip | |
| MSI PE60 2QD | |
| Lenovo Ideapad 500s-14ISK | |
| Apple MacBook Pro Retina 13 inch 2015-03 | |
| Lenovo ThinkPad T460p | |
| Toshiba Portege Z30t-B1320W10 | |
| 3DMark 11 Performance | 2839 points | |
| 3DMark Ice Storm Standard Score | 81504 points | |
| 3DMark Cloud Gate Standard Score | 8646 points | |
| 3DMark Fire Strike Score | 1544 points | |
| 3DMark Fire Strike Extreme Score | 690 points | |
Help | ||
| Metro: Last Light | |
| 1366x768 Medium (DX10) AF:4x | |
| MSI PX60 QD-034US | |
| Microsoft Surface Book Core i5 | |
| Sony Vaio Z Flip | |
| Apple MacBook Pro Retina 13 inch 2015-03 | |
| 1366x768 High (DX11) AF:16x | |
| MSI PX60 QD-034US | |
| Microsoft Surface Book Core i5 | |
| Sony Vaio Z Flip | |
| Apple MacBook Pro Retina 13 inch 2015-03 | |
| 1920x1080 Very High (DX11) AF:16x | |
| MSI PX60 QD-034US | |
| Microsoft Surface Book Core i5 | |
| Sony Vaio Z Flip | |
| Apple MacBook Pro Retina 13 inch 2015-03 | |
| Sleeping Dogs | |
| 1366x768 Medium Preset AA:Normal | |
| MSI PX60 QD-034US | |
| Microsoft Surface Book Core i5 | |
| Sony Vaio Z Flip | |
| 1366x768 High Preset AA:High | |
| MSI PX60 QD-034US | |
| Microsoft Surface Book Core i5 | |
| Sony Vaio Z Flip | |
| 1920x1080 Extreme Preset AA:Extreme | |
| MSI PX60 QD-034US | |
| Microsoft Surface Book Core i5 | |
| Sony Vaio Z Flip | |
| Rise of the Tomb Raider | |
| 1366x768 Medium Preset AF:2x | |
| Sony Vaio Z Flip | |
| Acer Aspire V3-575G-5093 | |
| Lenovo ThinkPad T460s-20FA003GGE | |
| 1920x1080 High Preset AA:FX AF:4x | |
| Sony Vaio Z Flip | |
| Acer Aspire V3-575G-5093 | |
| Lenovo ThinkPad T460s-20FA003GGE | |
| Thief | |
| 1366x768 Normal Preset AA:FX | |
| MSI PX60 QD-034US | |
| Microsoft Surface Book Core i5 | |
| Sony Vaio Z Flip | |
| Apple MacBook Pro Retina 13 inch 2015-03 | |
| 1366x768 High Preset AA:FXAA & Low SS AF:4x | |
| MSI PX60 QD-034US | |
| Microsoft Surface Book Core i5 | |
| Sony Vaio Z Flip | |
| Apple MacBook Pro Retina 13 inch 2015-03 | |
| 1920x1080 Very High Preset AA:FXAA & High SS AF:8x | |
| MSI PX60 QD-034US | |
| Sony Vaio Z Flip | |
| Microsoft Surface Book Core i5 | |
| Apple MacBook Pro Retina 13 inch 2015-03 | |
| Metal Gear Solid V | |
| 1366x768 Medium / Off | |
| MSI PX60 QD-034US | |
| Sony Vaio Z Flip | |
| Microsoft Surface Book Core i5 | |
| 1920x1080 High / On | |
| MSI PX60 QD-034US | |
| Microsoft Surface Book Core i5 | |
| Sony Vaio Z Flip | |
| 1920x1080 Extra High / On | |
| MSI PX60 QD-034US | |
| Microsoft Surface Book Core i5 | |
| Sony Vaio Z Flip | |
| low | med. | high | ultra | |
|---|---|---|---|---|
| Sleeping Dogs (2012) | 74.5 | 29.8 | 7 | |
| Tomb Raider (2013) | 77.2 | 52 | 23.6 | |
| BioShock Infinite (2013) | 51.4 | 43.4 | ||
| Metro: Last Light (2013) | 41.4 | 24.9 | 12.6 | |
| Thief (2014) | 25.4 | 21.1 | 10 | |
| Metal Gear Solid V (2015) | 55.7 | 18.9 | 12.3 | |
| Rise of the Tomb Raider (2016) | 18.3 | 10.9 |
| Sony Vaio Z Flip Iris Graphics 550, 6567U, Samsung SM951 MZVPV256 m.2 | Apple MacBook Air 13 inch 2015-03 HD Graphics 6000, 5650U, Apple SSD SD0256F | Lenovo Yoga 900-13ISK 80MK HD Graphics 520, 6500U, Samsung SSD PM871 MZNLN512HCJH | Dell XPS 13 9350 WQXGA Iris Graphics 540, 6560U, Samsung PM951 NVMe 512 GB | Asus Zenbook UX303UA-R4051T HD Graphics 520, 6500U, SK hynix SSD Canvas SC300 HFS256G32MND | |
|---|---|---|---|---|---|
| Noise | 5% | 10% | 12% | 6% | |
| off / environment * (dB) | 29.1 | 29.2 -0% | 31.3 -8% | ||
| Idle Minimum * (dB) | 29.1 | 29.2 -0% | 29.7 -2% | 29.2 -0% | 31.3 -8% |
| Idle Average * (dB) | 29.1 | 29.2 -0% | 29.8 -2% | 29.2 -0% | 31.3 -8% |
| Idle Maximum * (dB) | 29.1 | 29.2 -0% | 30 -3% | 29.2 -0% | 31.5 -8% |
| Load Average * (dB) | 46.6 | 40.2 14% | 32 31% | 31.4 33% | 33.2 29% |
| Load Maximum * (dB) | 53.5 | 46.3 13% | 38.5 28% | 31.4 41% | 34.1 36% |
* ... smaller is better
Noise level
| Idle |
| 29.1 / 29.1 / 29.1 dB(A) |
| Load |
| 46.6 / 53.5 dB(A) |
 | ||
30 dB silent 40 dB(A) audible 50 dB(A) loud |
||
min: | ||
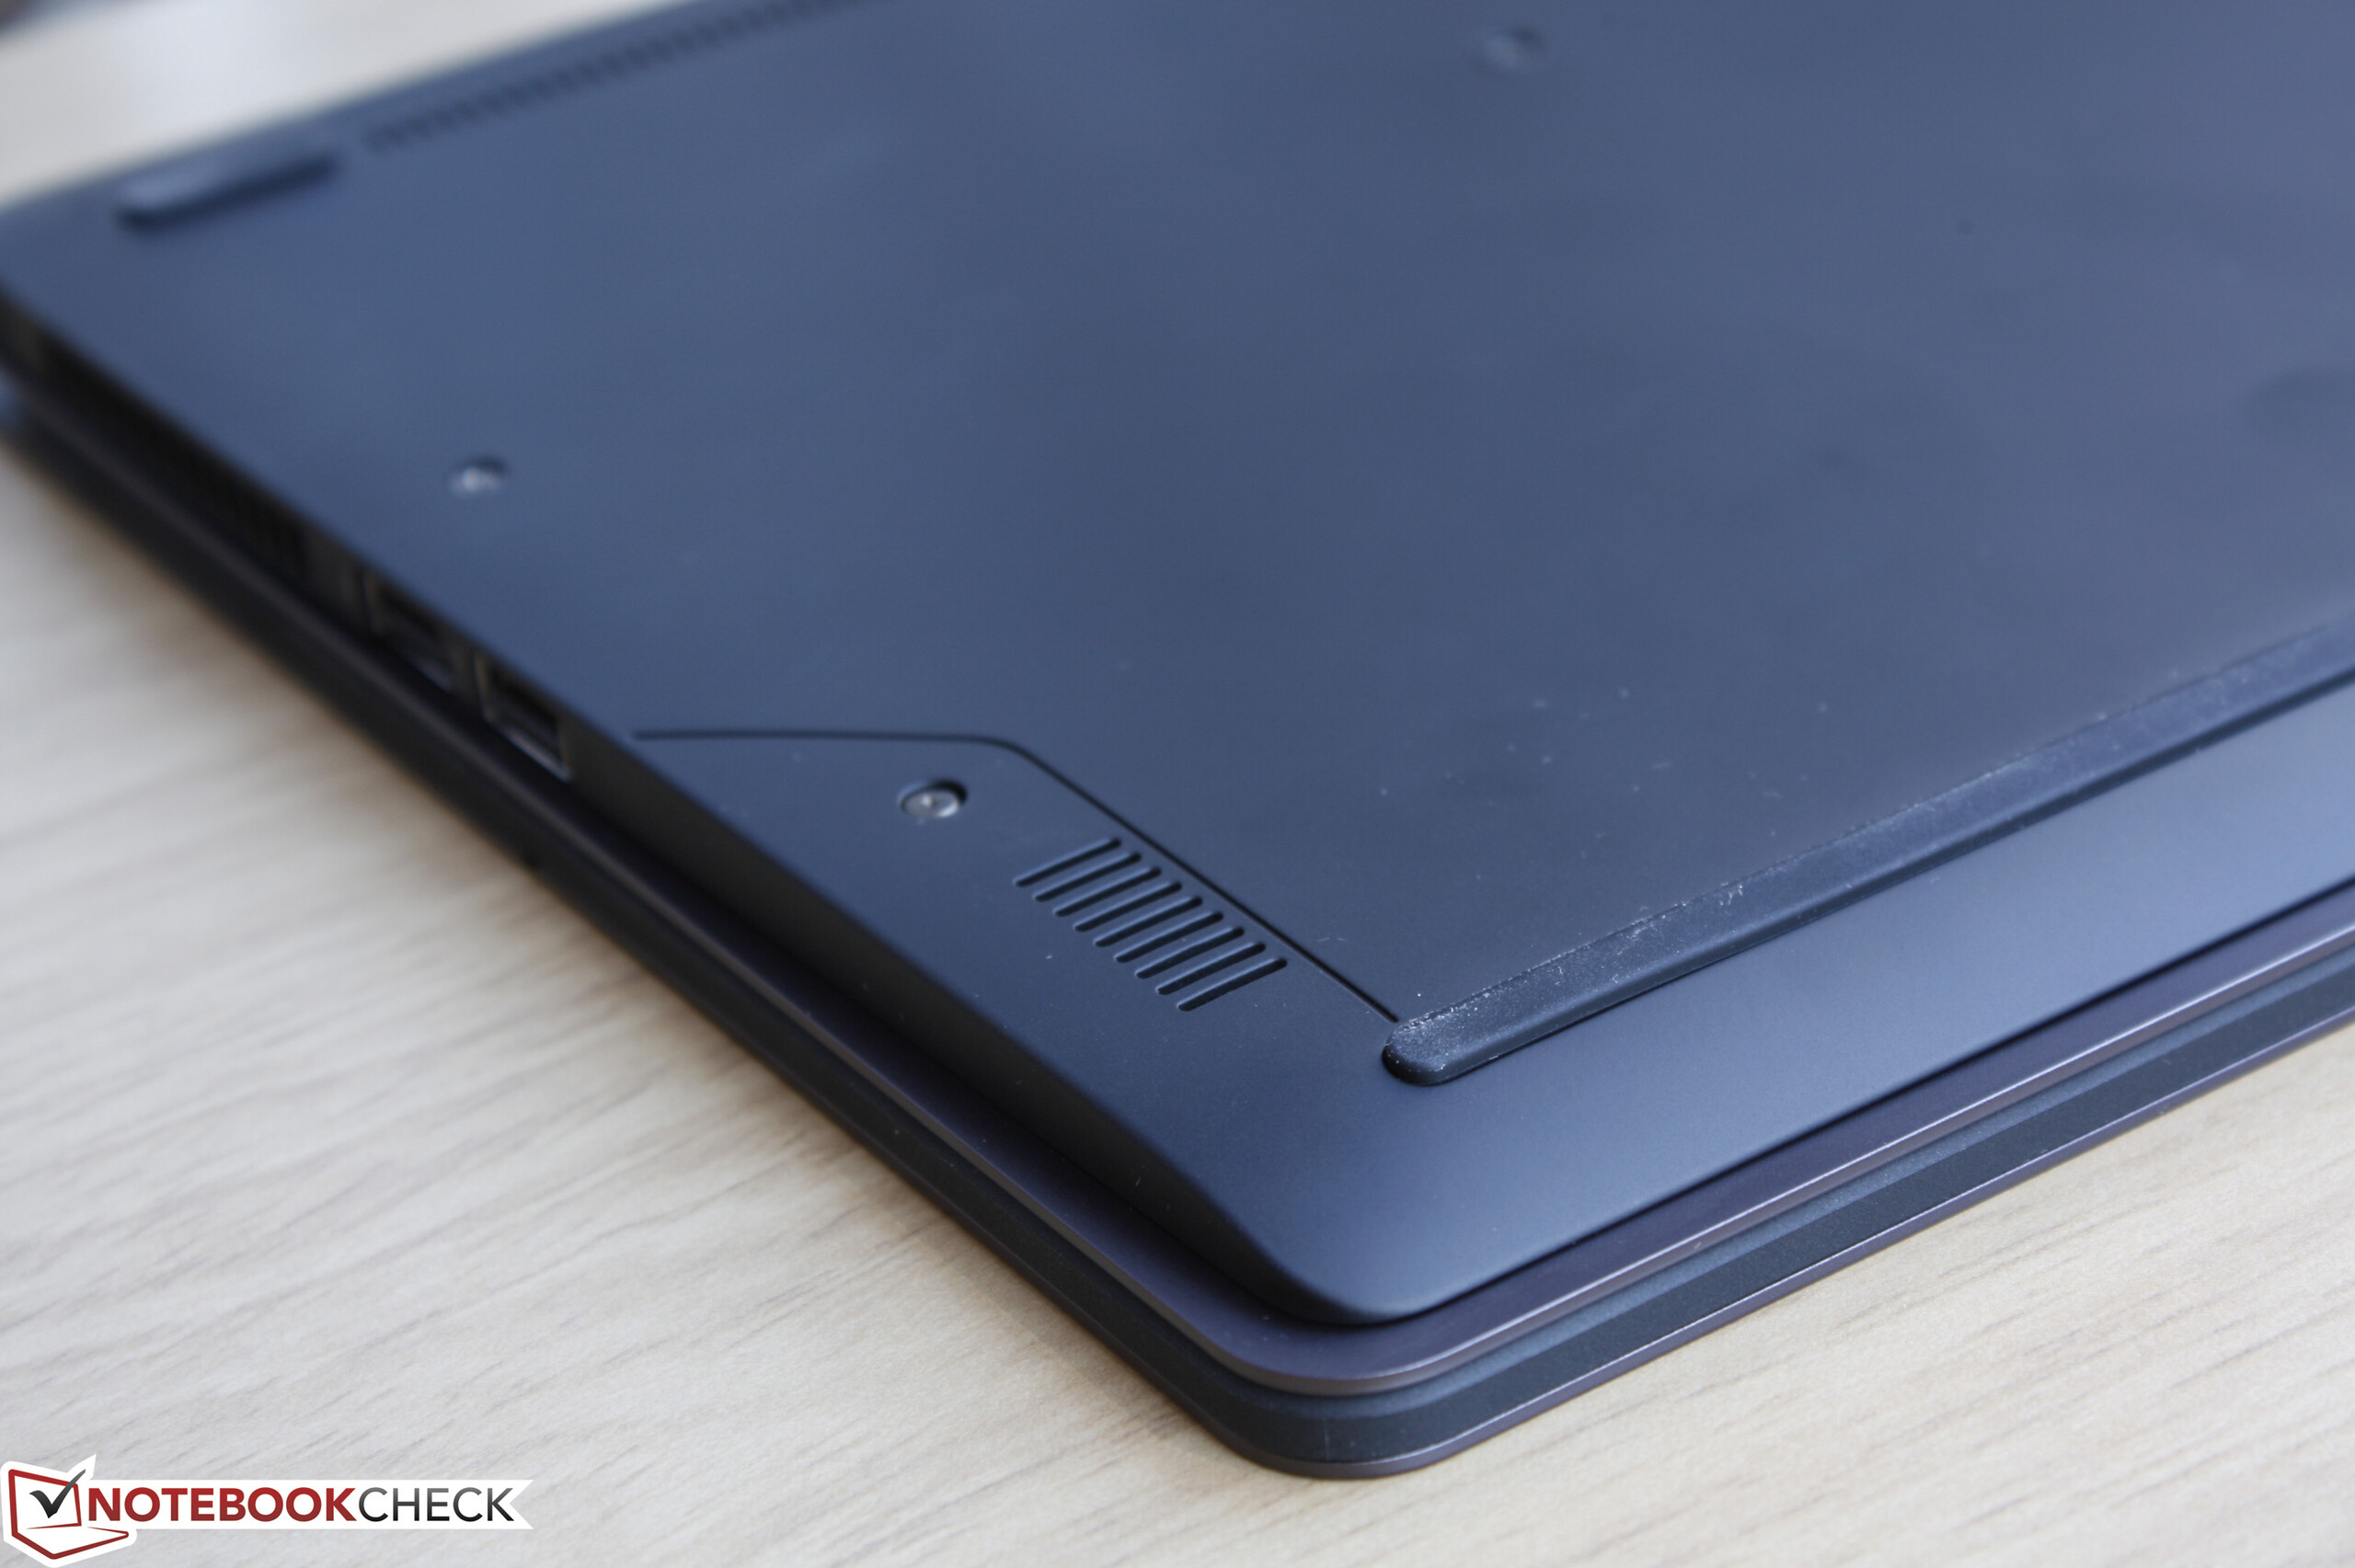
(±) The maximum temperature on the upper side is 41 °C / 106 F, compared to the average of 35.4 °C / 96 F, ranging from 19.6 to 60 °C for the class Convertible.
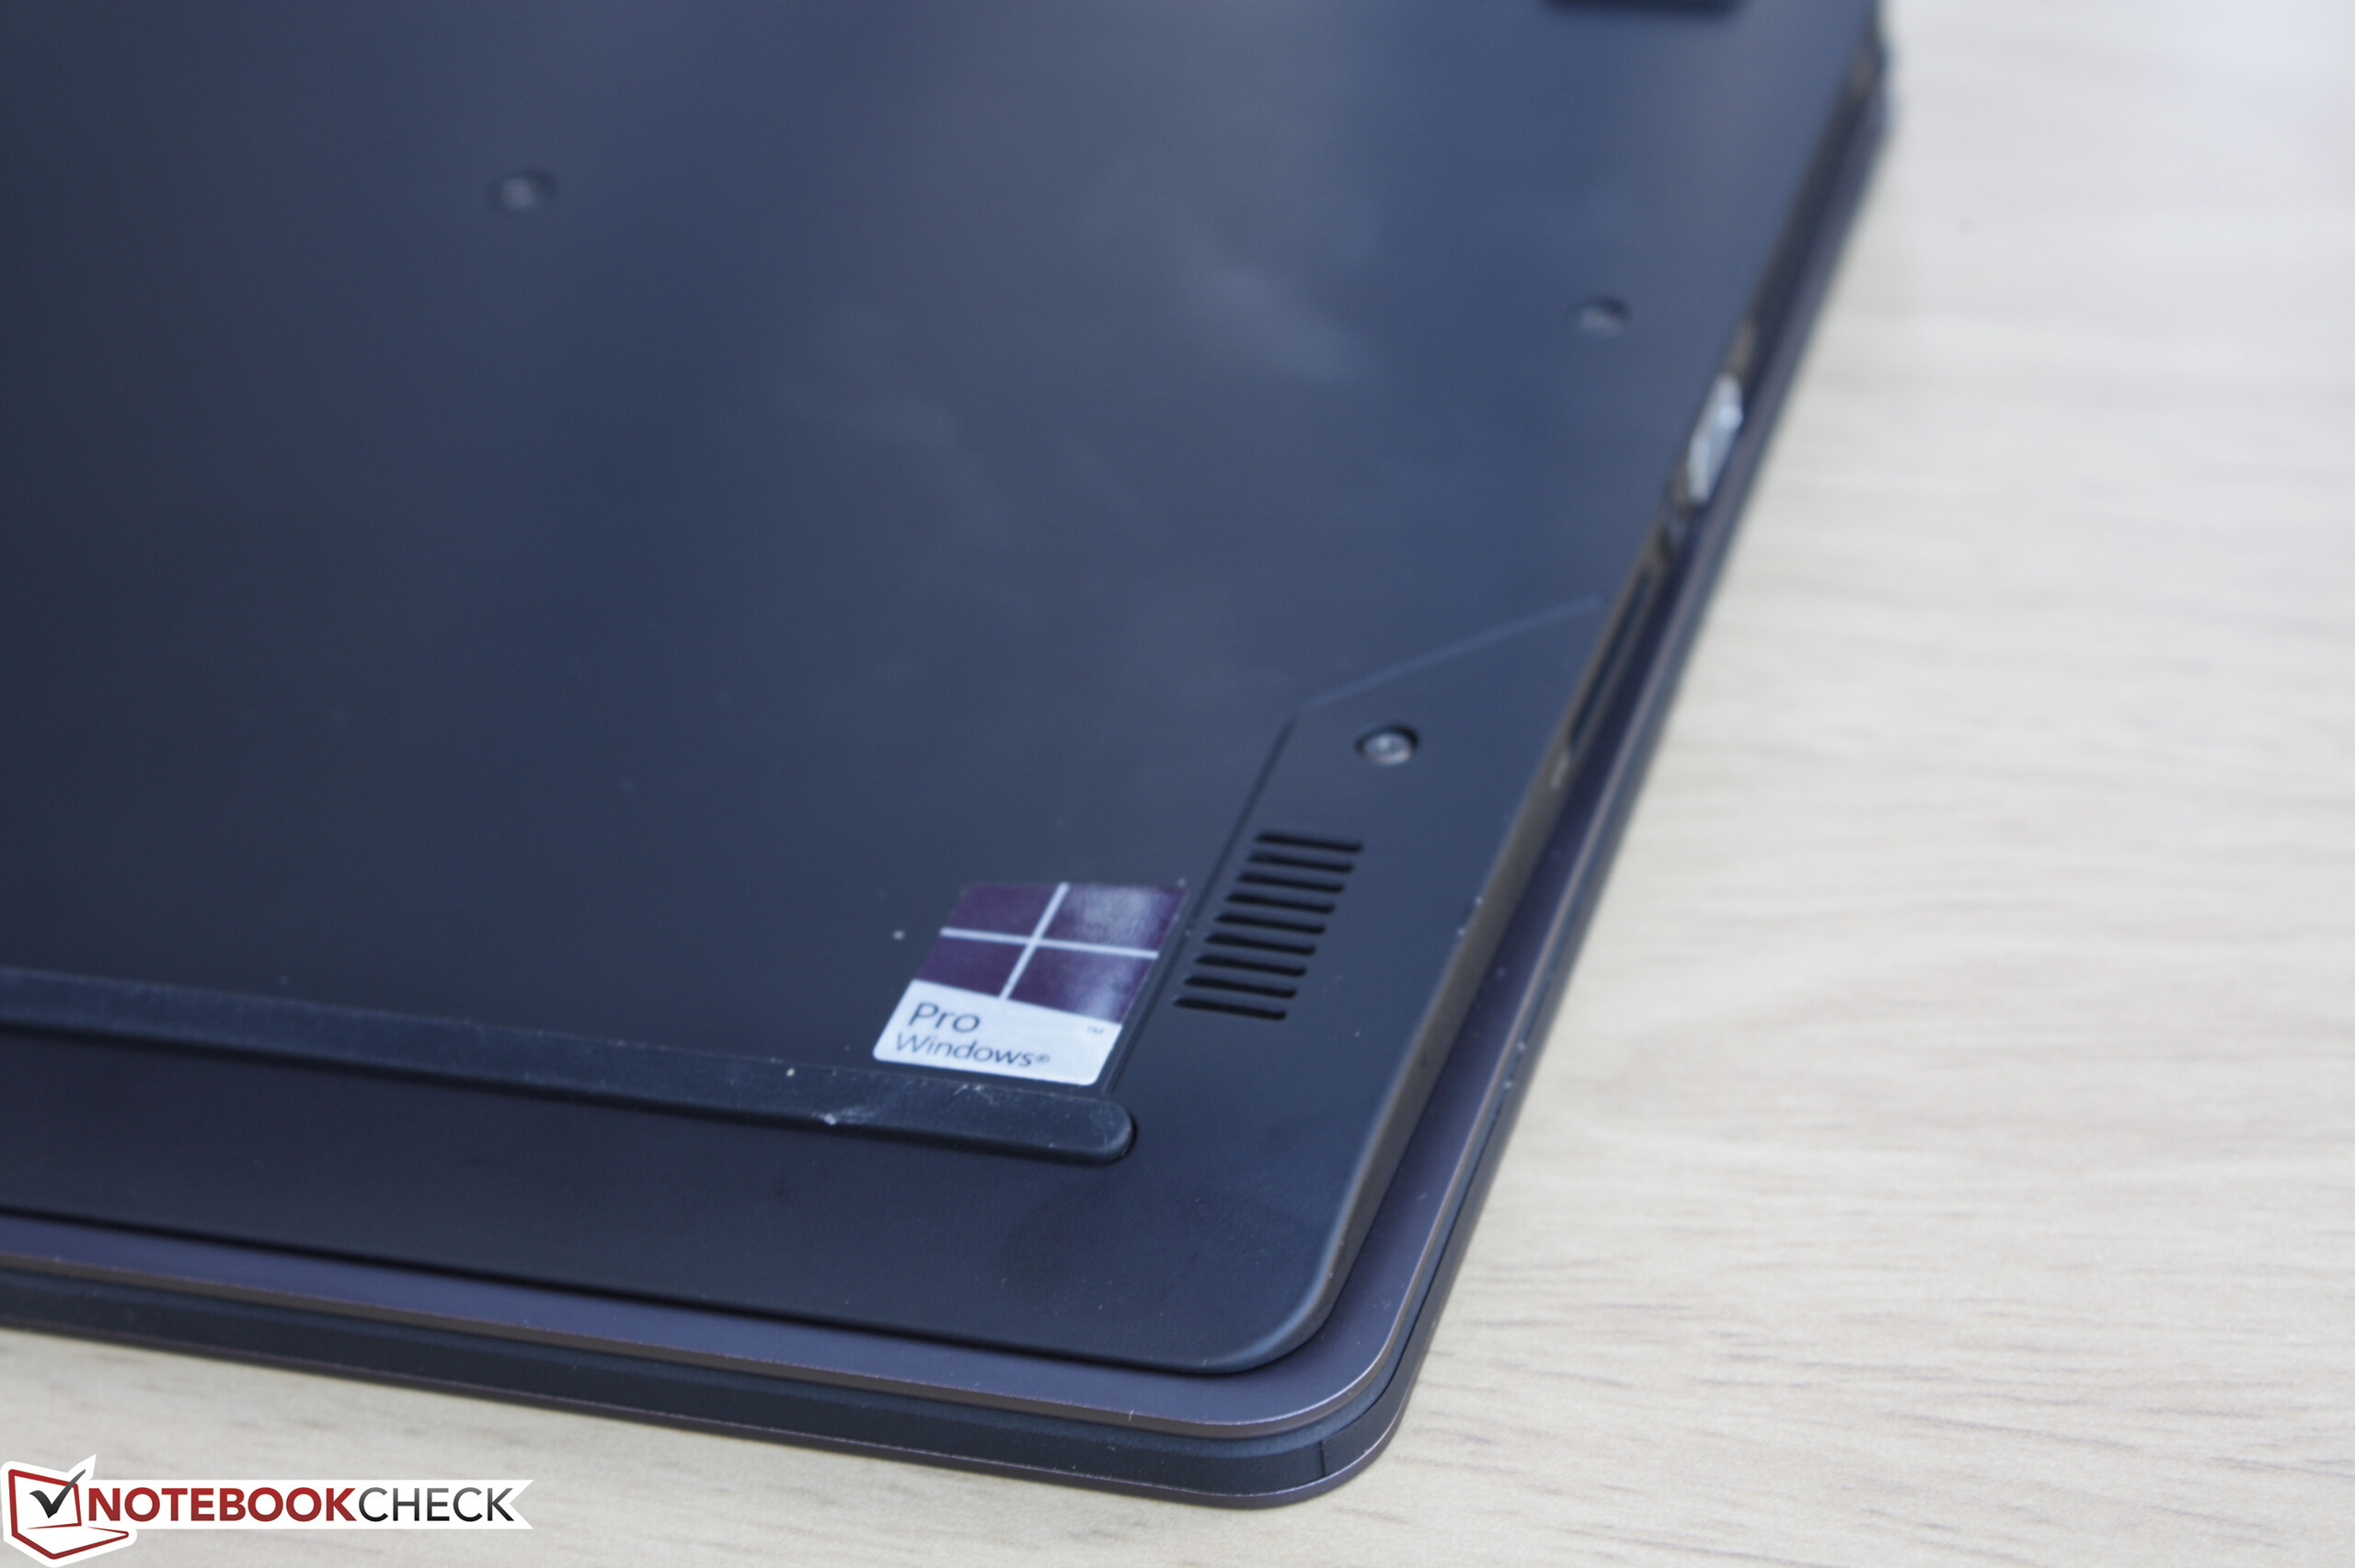
(-) The bottom heats up to a maximum of 47.2 °C / 117 F, compared to the average of 36.9 °C / 98 F
(+) In idle usage, the average temperature for the upper side is 24.8 °C / 77 F, compared to the device average of 30.3 °C / 87 F.
(+) The palmrests and touchpad are cooler than skin temperature with a maximum of 27.8 °C / 82 F and are therefore cool to the touch.
(±) The average temperature of the palmrest area of similar devices was 28 °C / 82.4 F (+0.2 °C / 0.4 F).
| Sony Vaio Z Flip Iris Graphics 550, 6567U, Samsung SM951 MZVPV256 m.2 | Apple MacBook Air 13 inch 2015-03 HD Graphics 6000, 5650U, Apple SSD SD0256F | Microsoft Surface Book Core i7 Maxwell GPU (940M, GDDR5), 6600U, Samsung MZFLV512 NVMe | Dell XPS 13 9350 WQXGA Iris Graphics 540, 6560U, Samsung PM951 NVMe 512 GB | Asus Zenbook UX303UA-R4051T HD Graphics 520, 6500U, SK hynix SSD Canvas SC300 HFS256G32MND | |
|---|---|---|---|---|---|
| Power Consumption | 21% | -32% | -24% | 14% | |
| Idle Minimum * (Watt) | 3.7 | 2.7 27% | 4.5 -22% | 7.2 -95% | 3.5 5% |
| Idle Average * (Watt) | 6.9 | 5.7 17% | 9.8 -42% | 9.3 -35% | 7.3 -6% |
| Idle Maximum * (Watt) | 8 | 6 25% | 12.2 -53% | 11.6 -45% | 7.9 1% |
| Load Average * (Watt) | 41.3 | 32.1 22% | 46 -11% | 31.9 23% | 26.6 36% |
| Load Maximum * (Watt) | 42.6 | 36.2 15% | 56 -31% | 29.9 30% | 28 34% |
* ... smaller is better
| Off / Standby | |
| Idle | |
| Load |
|
Key:
min: | |
| Sony Vaio Z Flip 58 Wh | Apple MacBook Air 13 inch 2015-03 54 Wh | Lenovo Yoga 900-13ISK 80MK 66 Wh | Dell XPS 13 9350 WQXGA 56 Wh | Asus Zenbook UX303UA-R4051T 50 Wh | |
|---|---|---|---|---|---|
| Battery runtime | 21% | -15% | -30% | -9% | |
| Reader / Idle (h) | 15.8 | 26.2 66% | 14.1 -11% | 10.1 -36% | |
| WiFi v1.3 (h) | 7.5 | 10.3 37% | 6.7 -11% | 5.2 -31% | 6.8 -9% |
| Load (h) | 2.7 | 1.6 -41% | 2.1 -22% | 2.1 -22% |
Pros
Cons
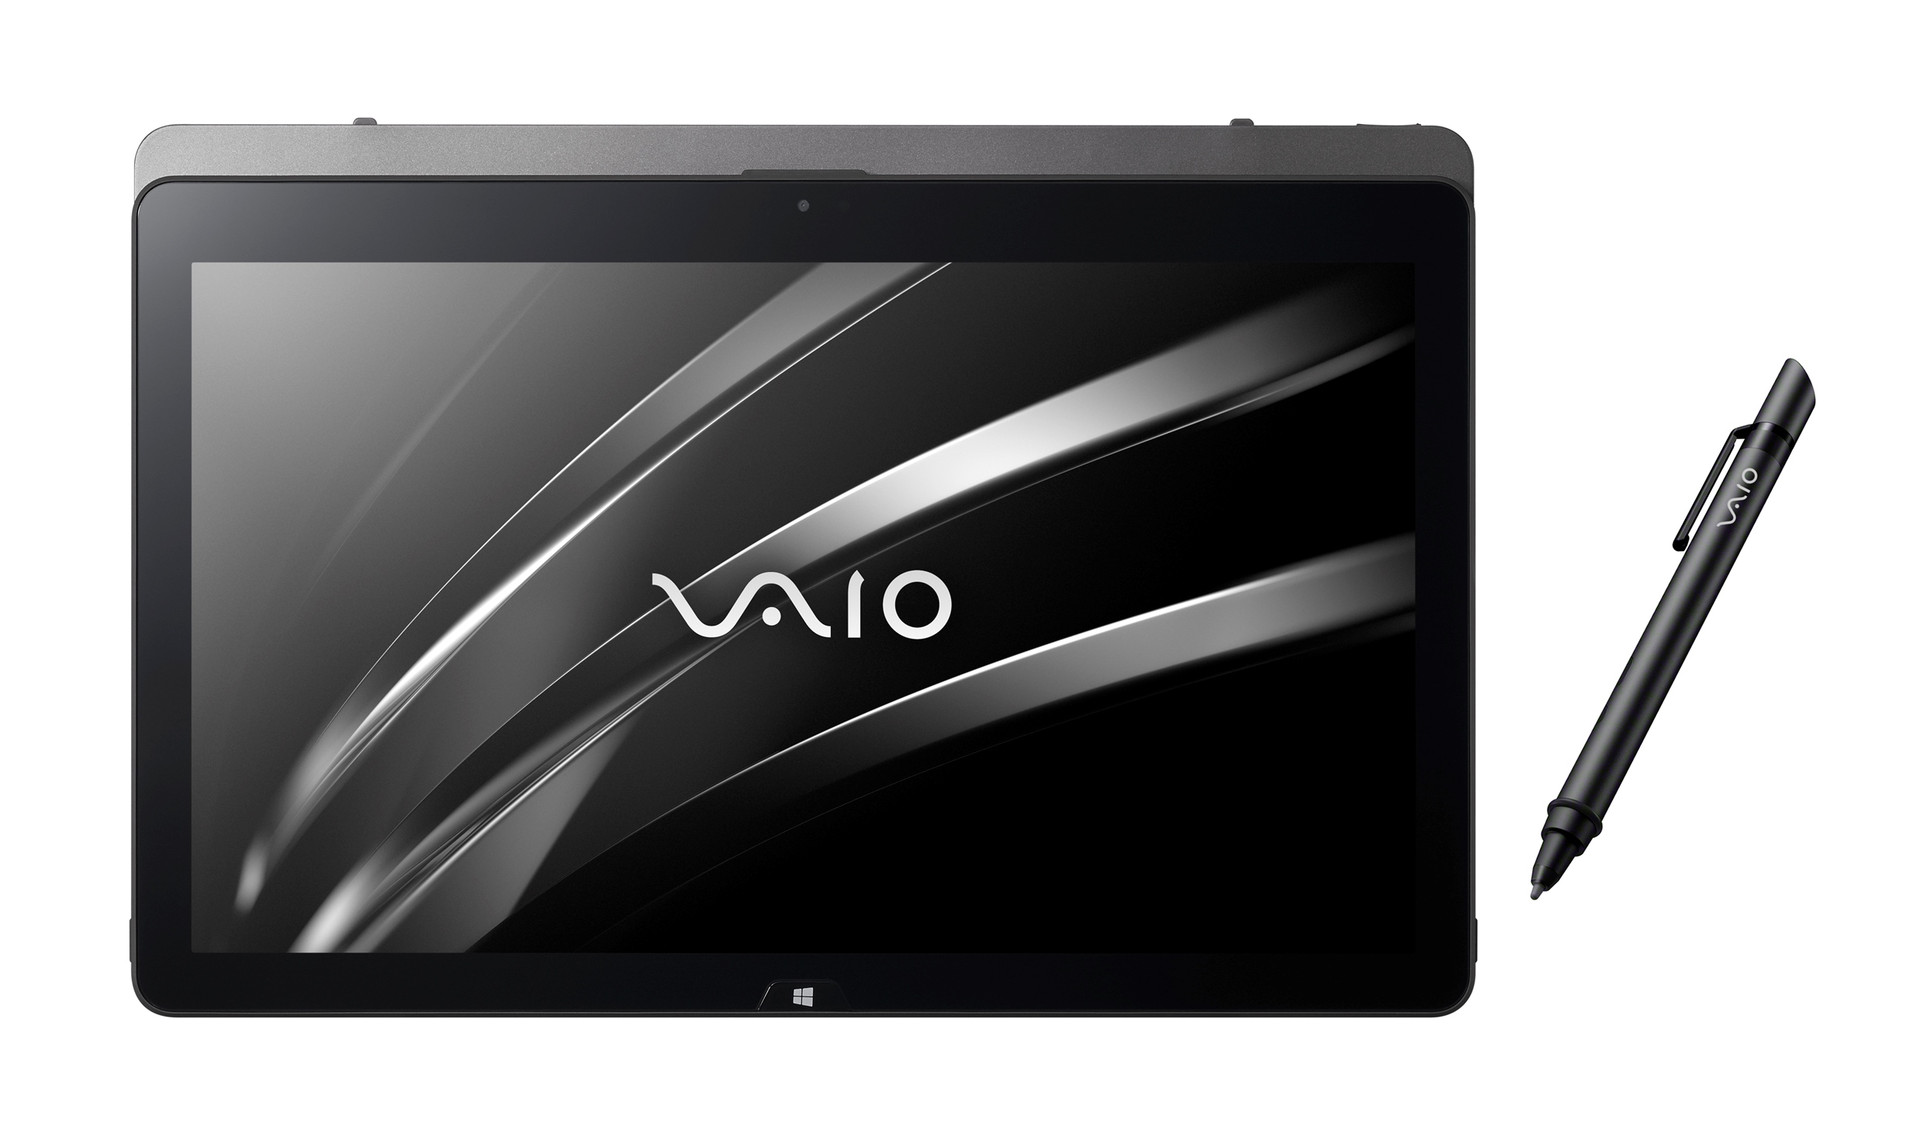
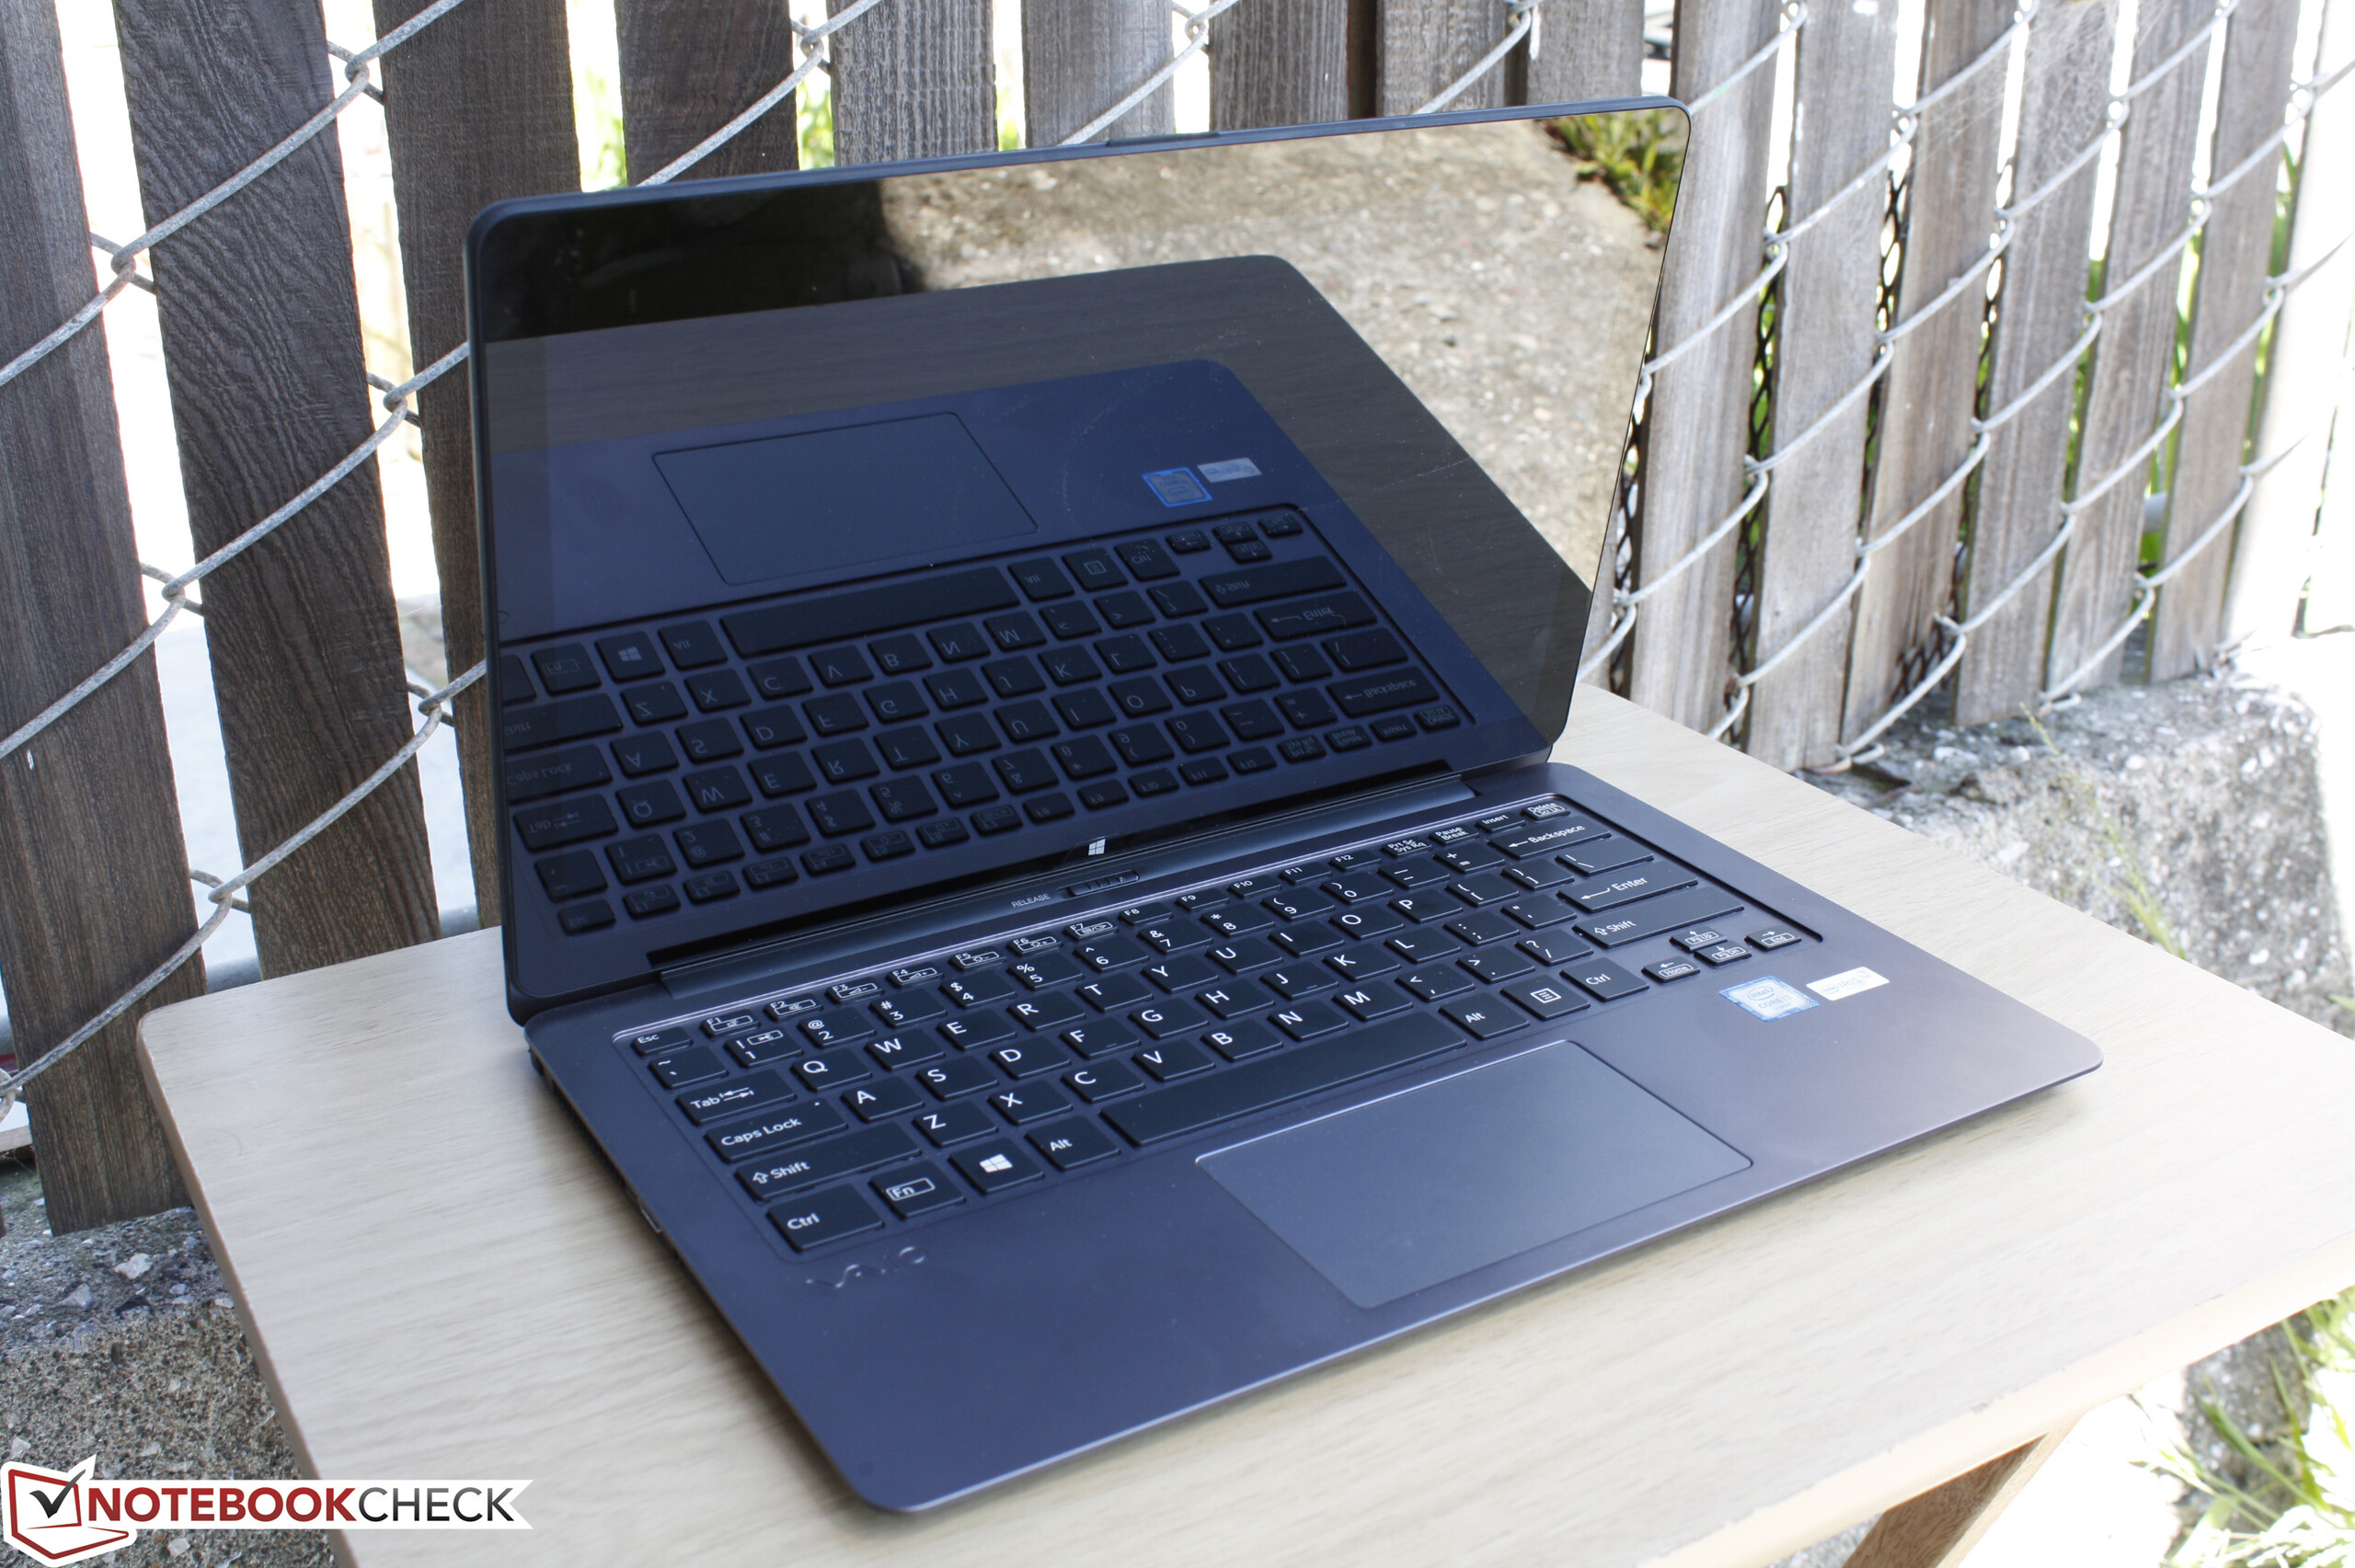
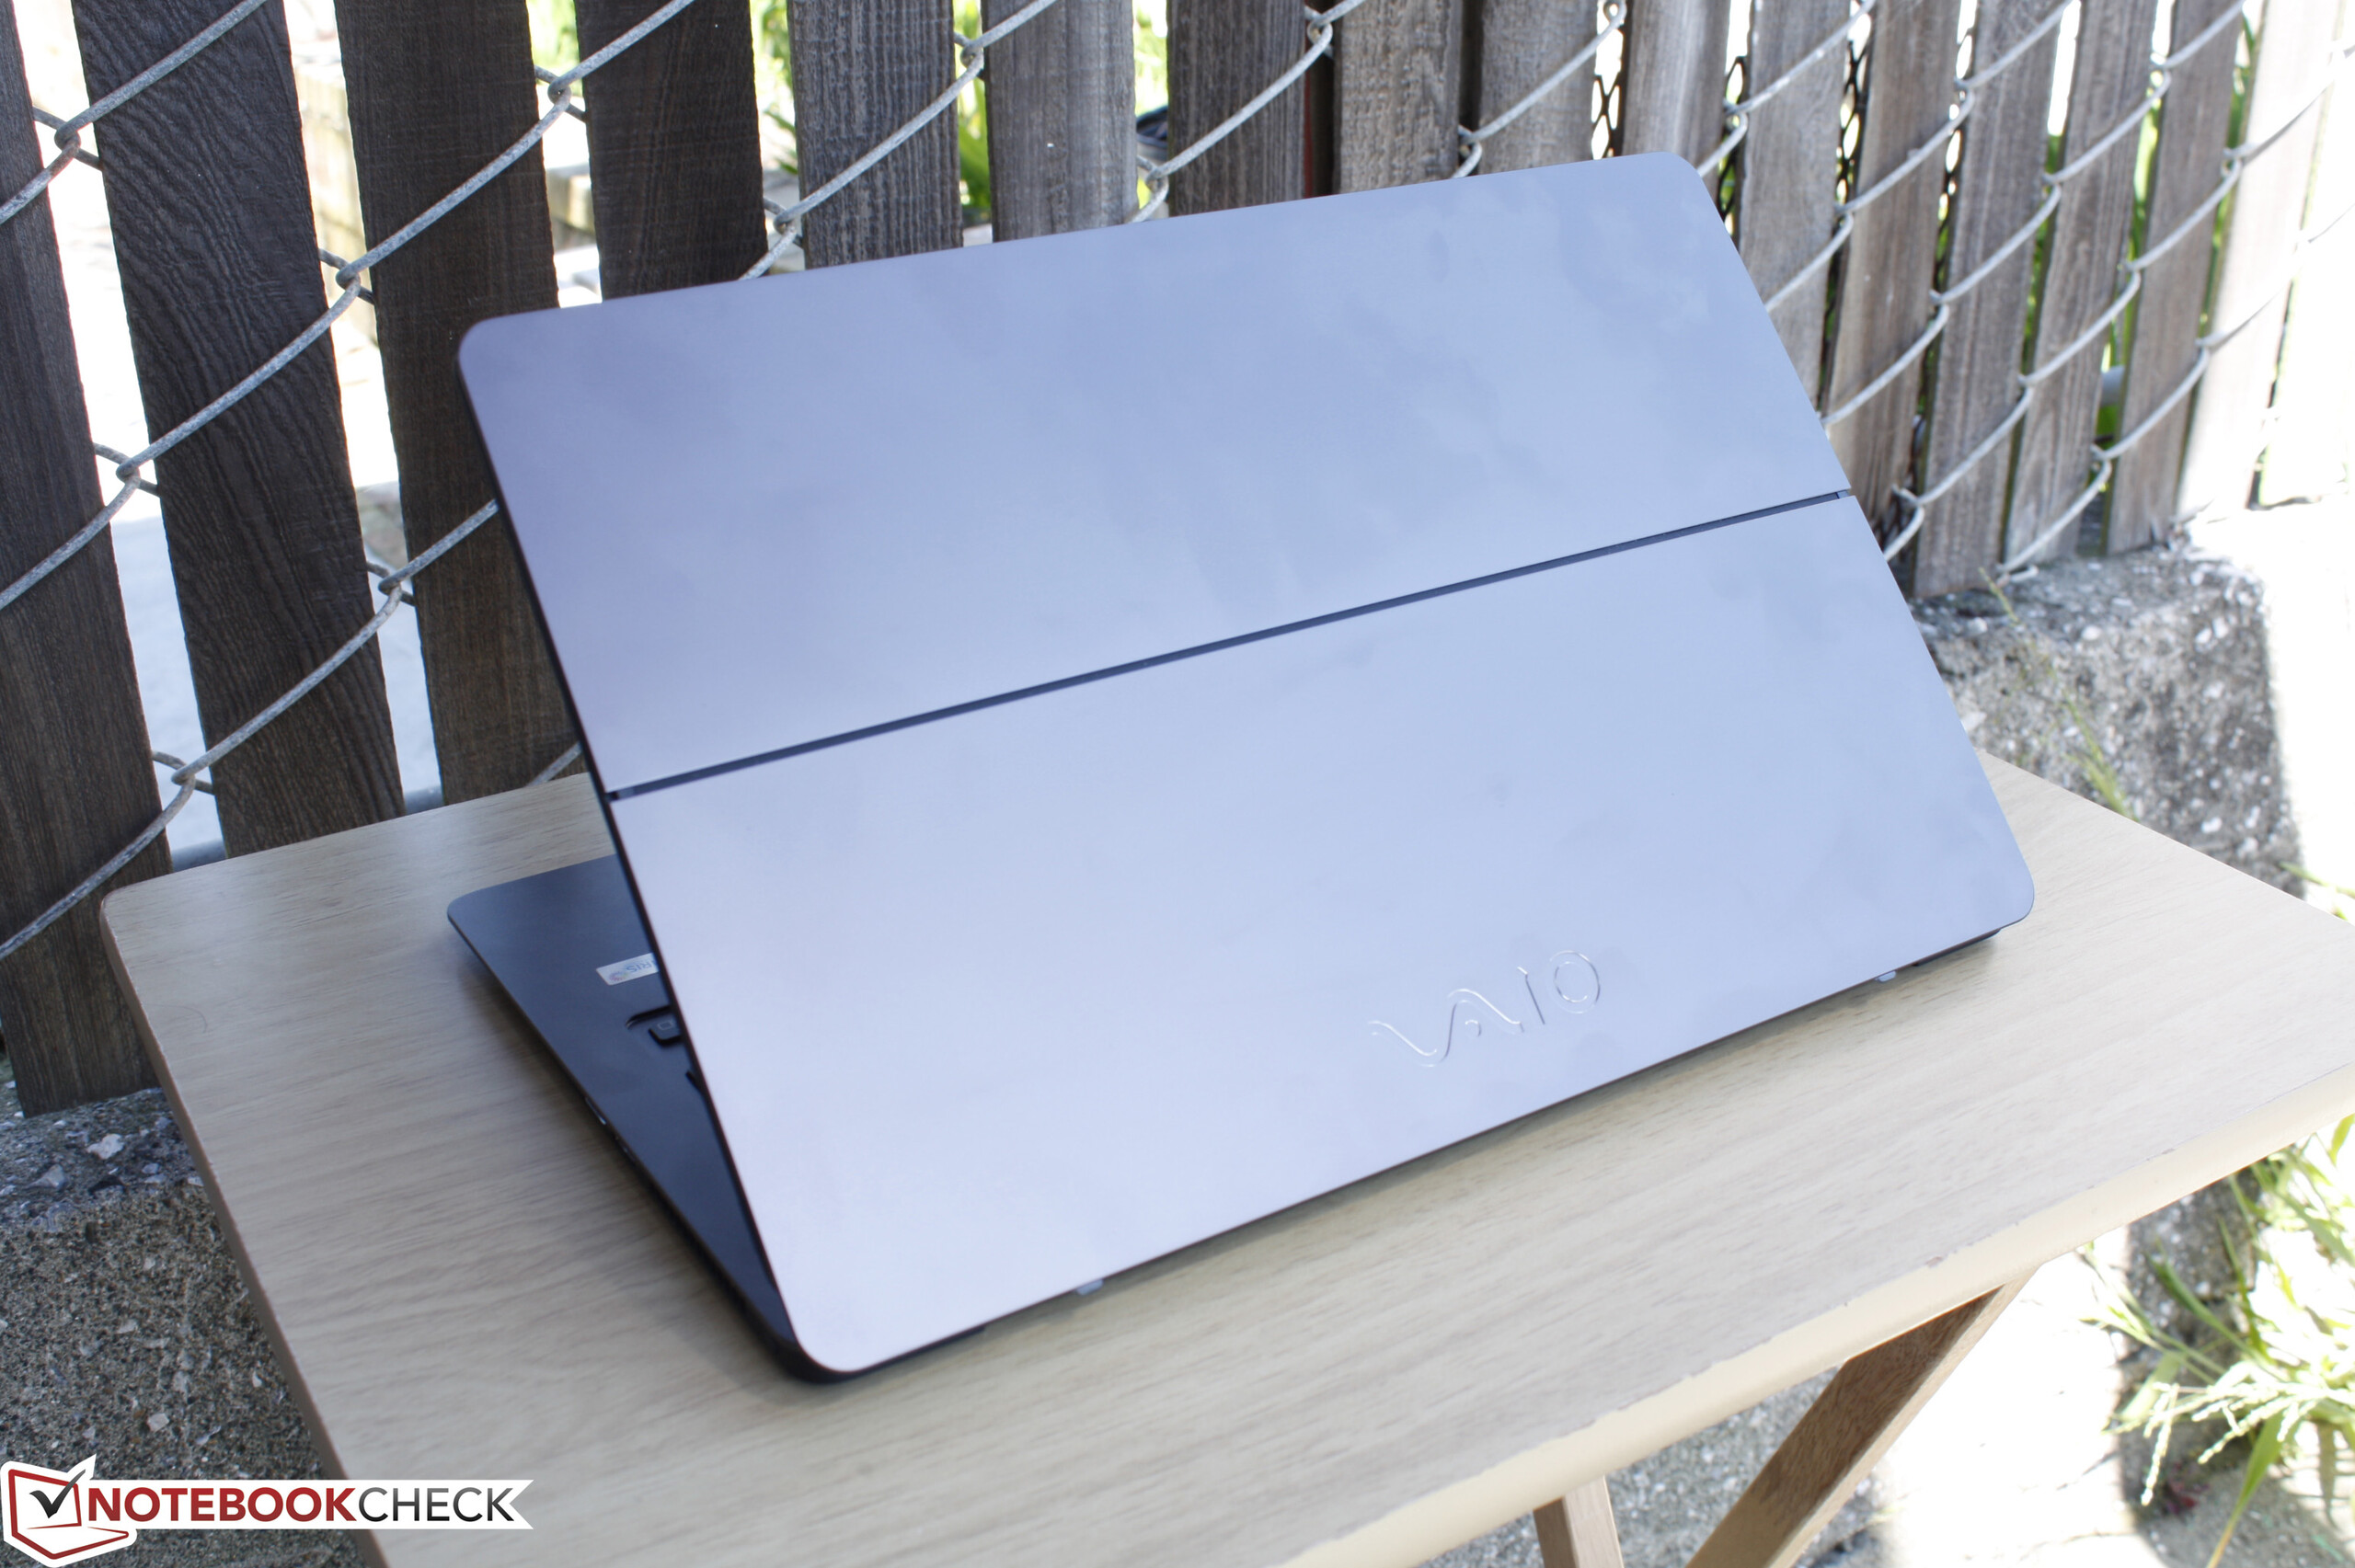
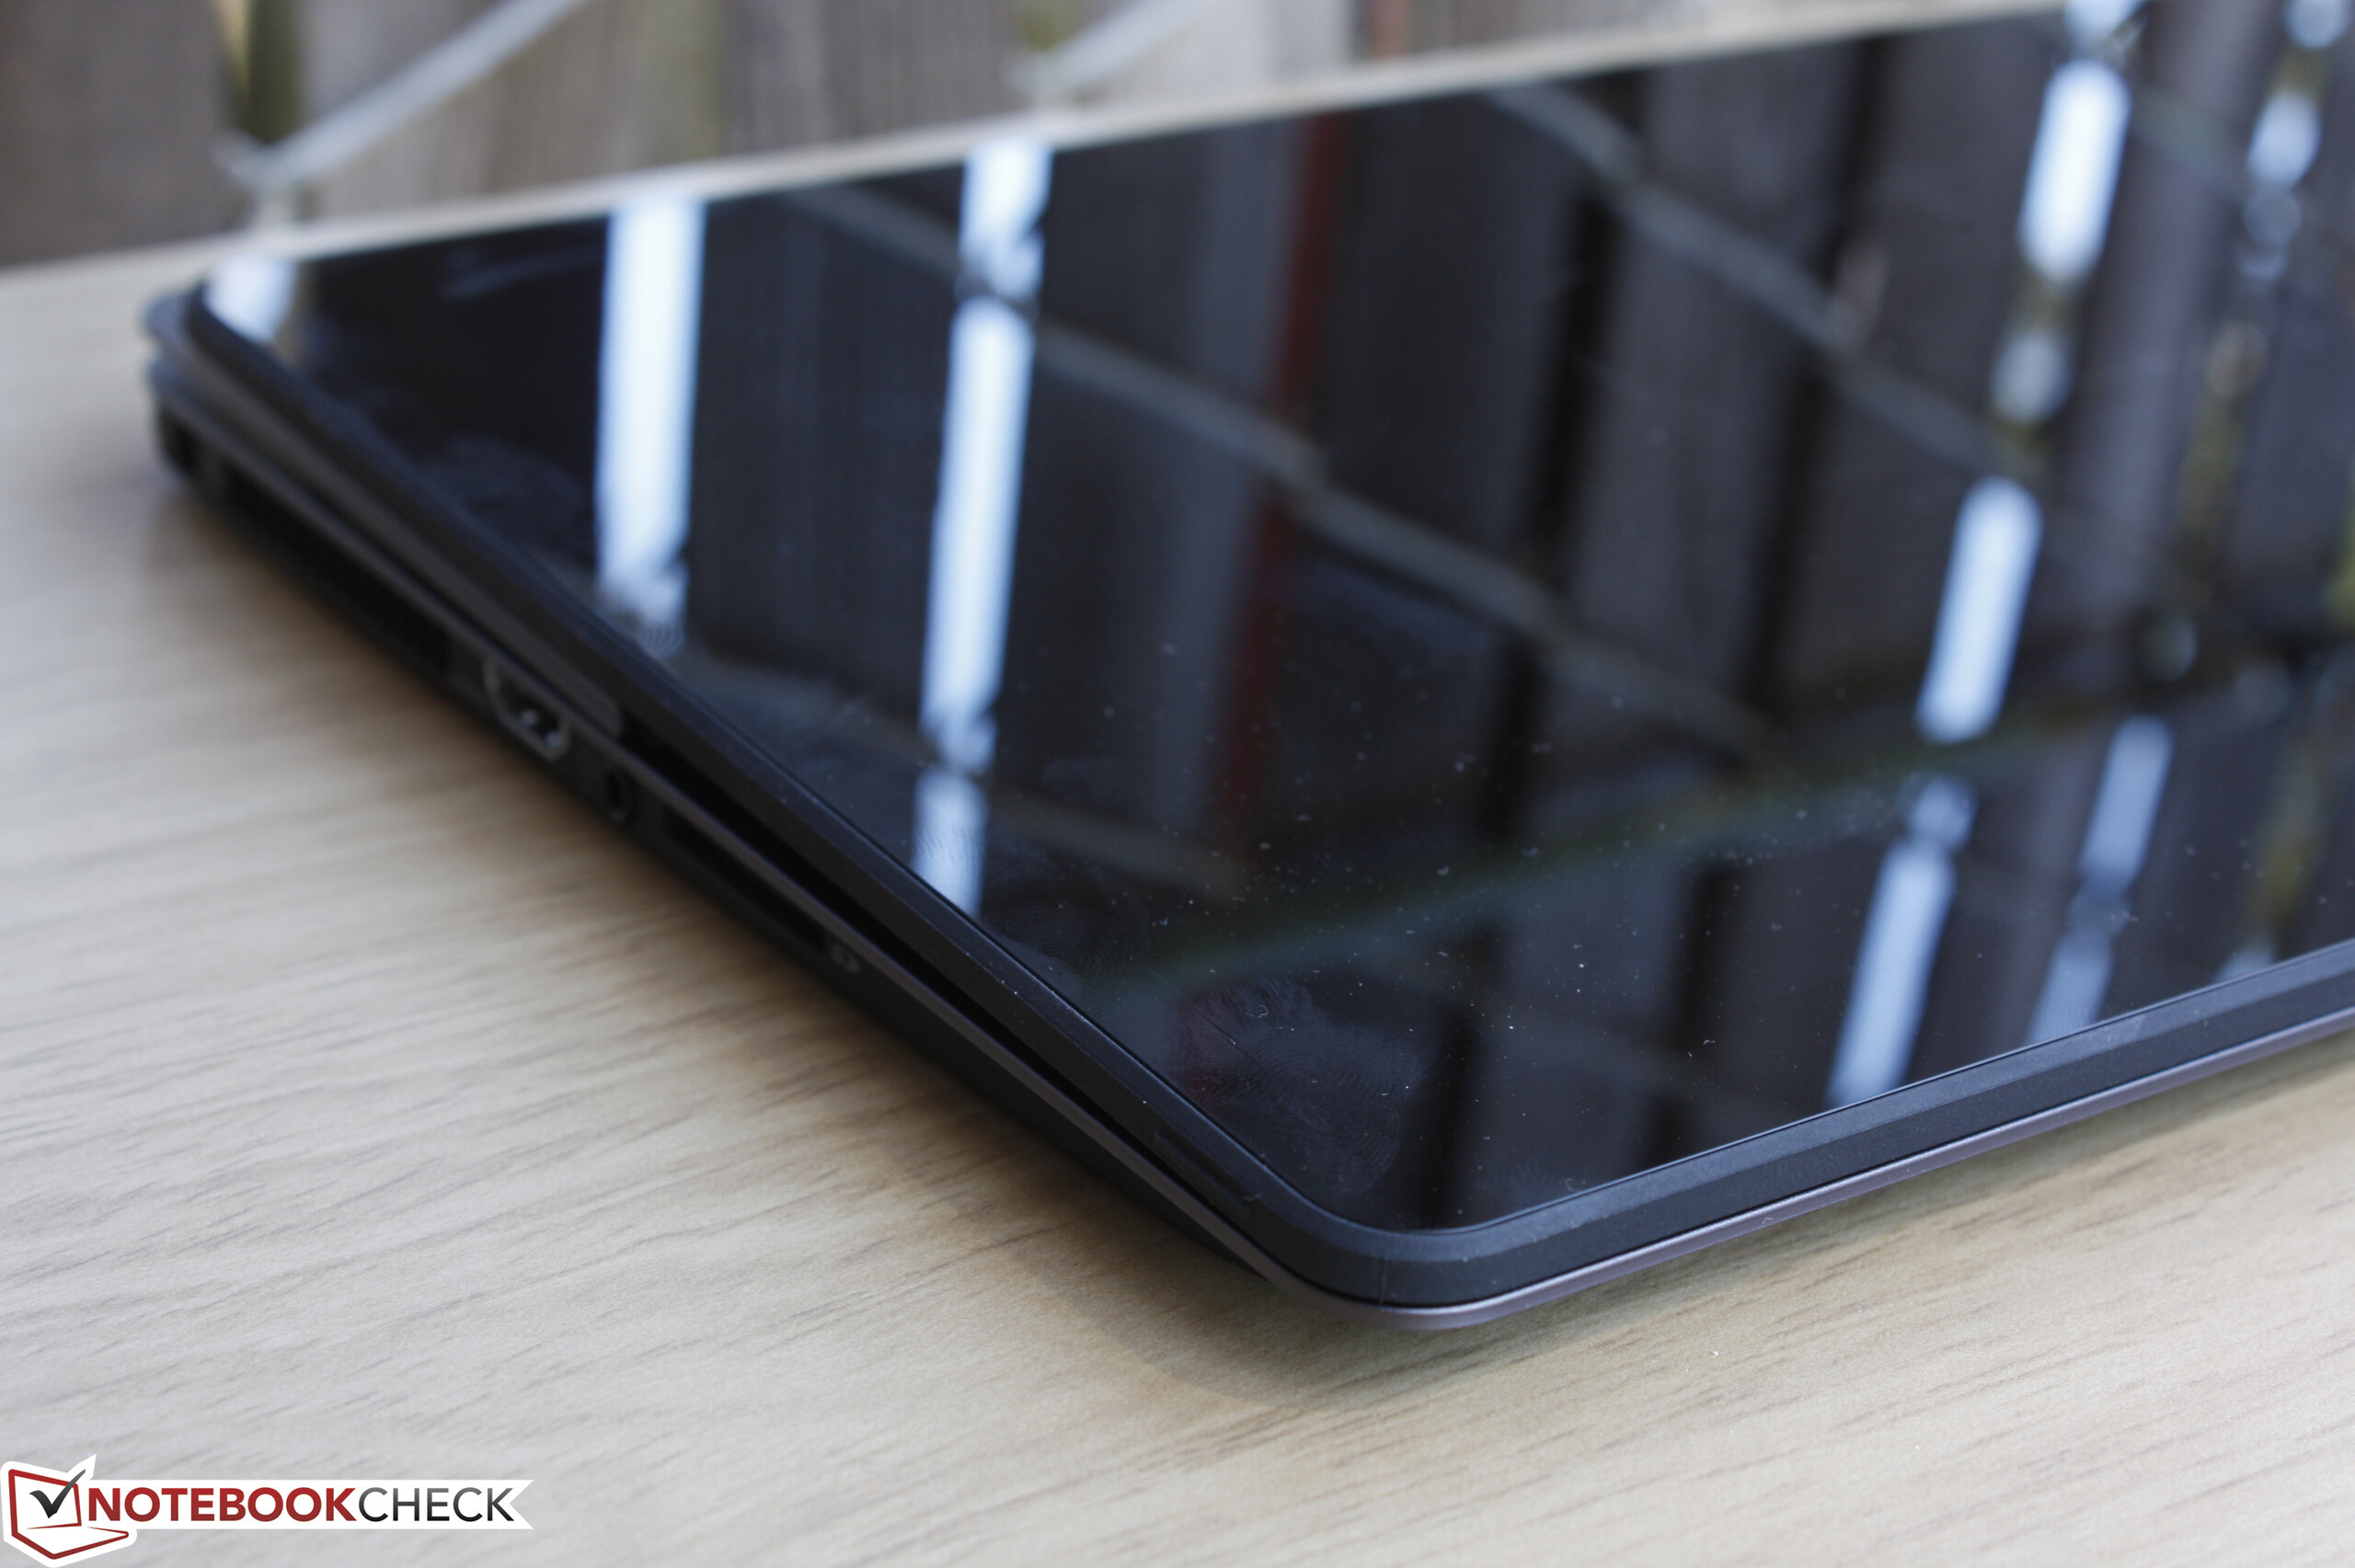
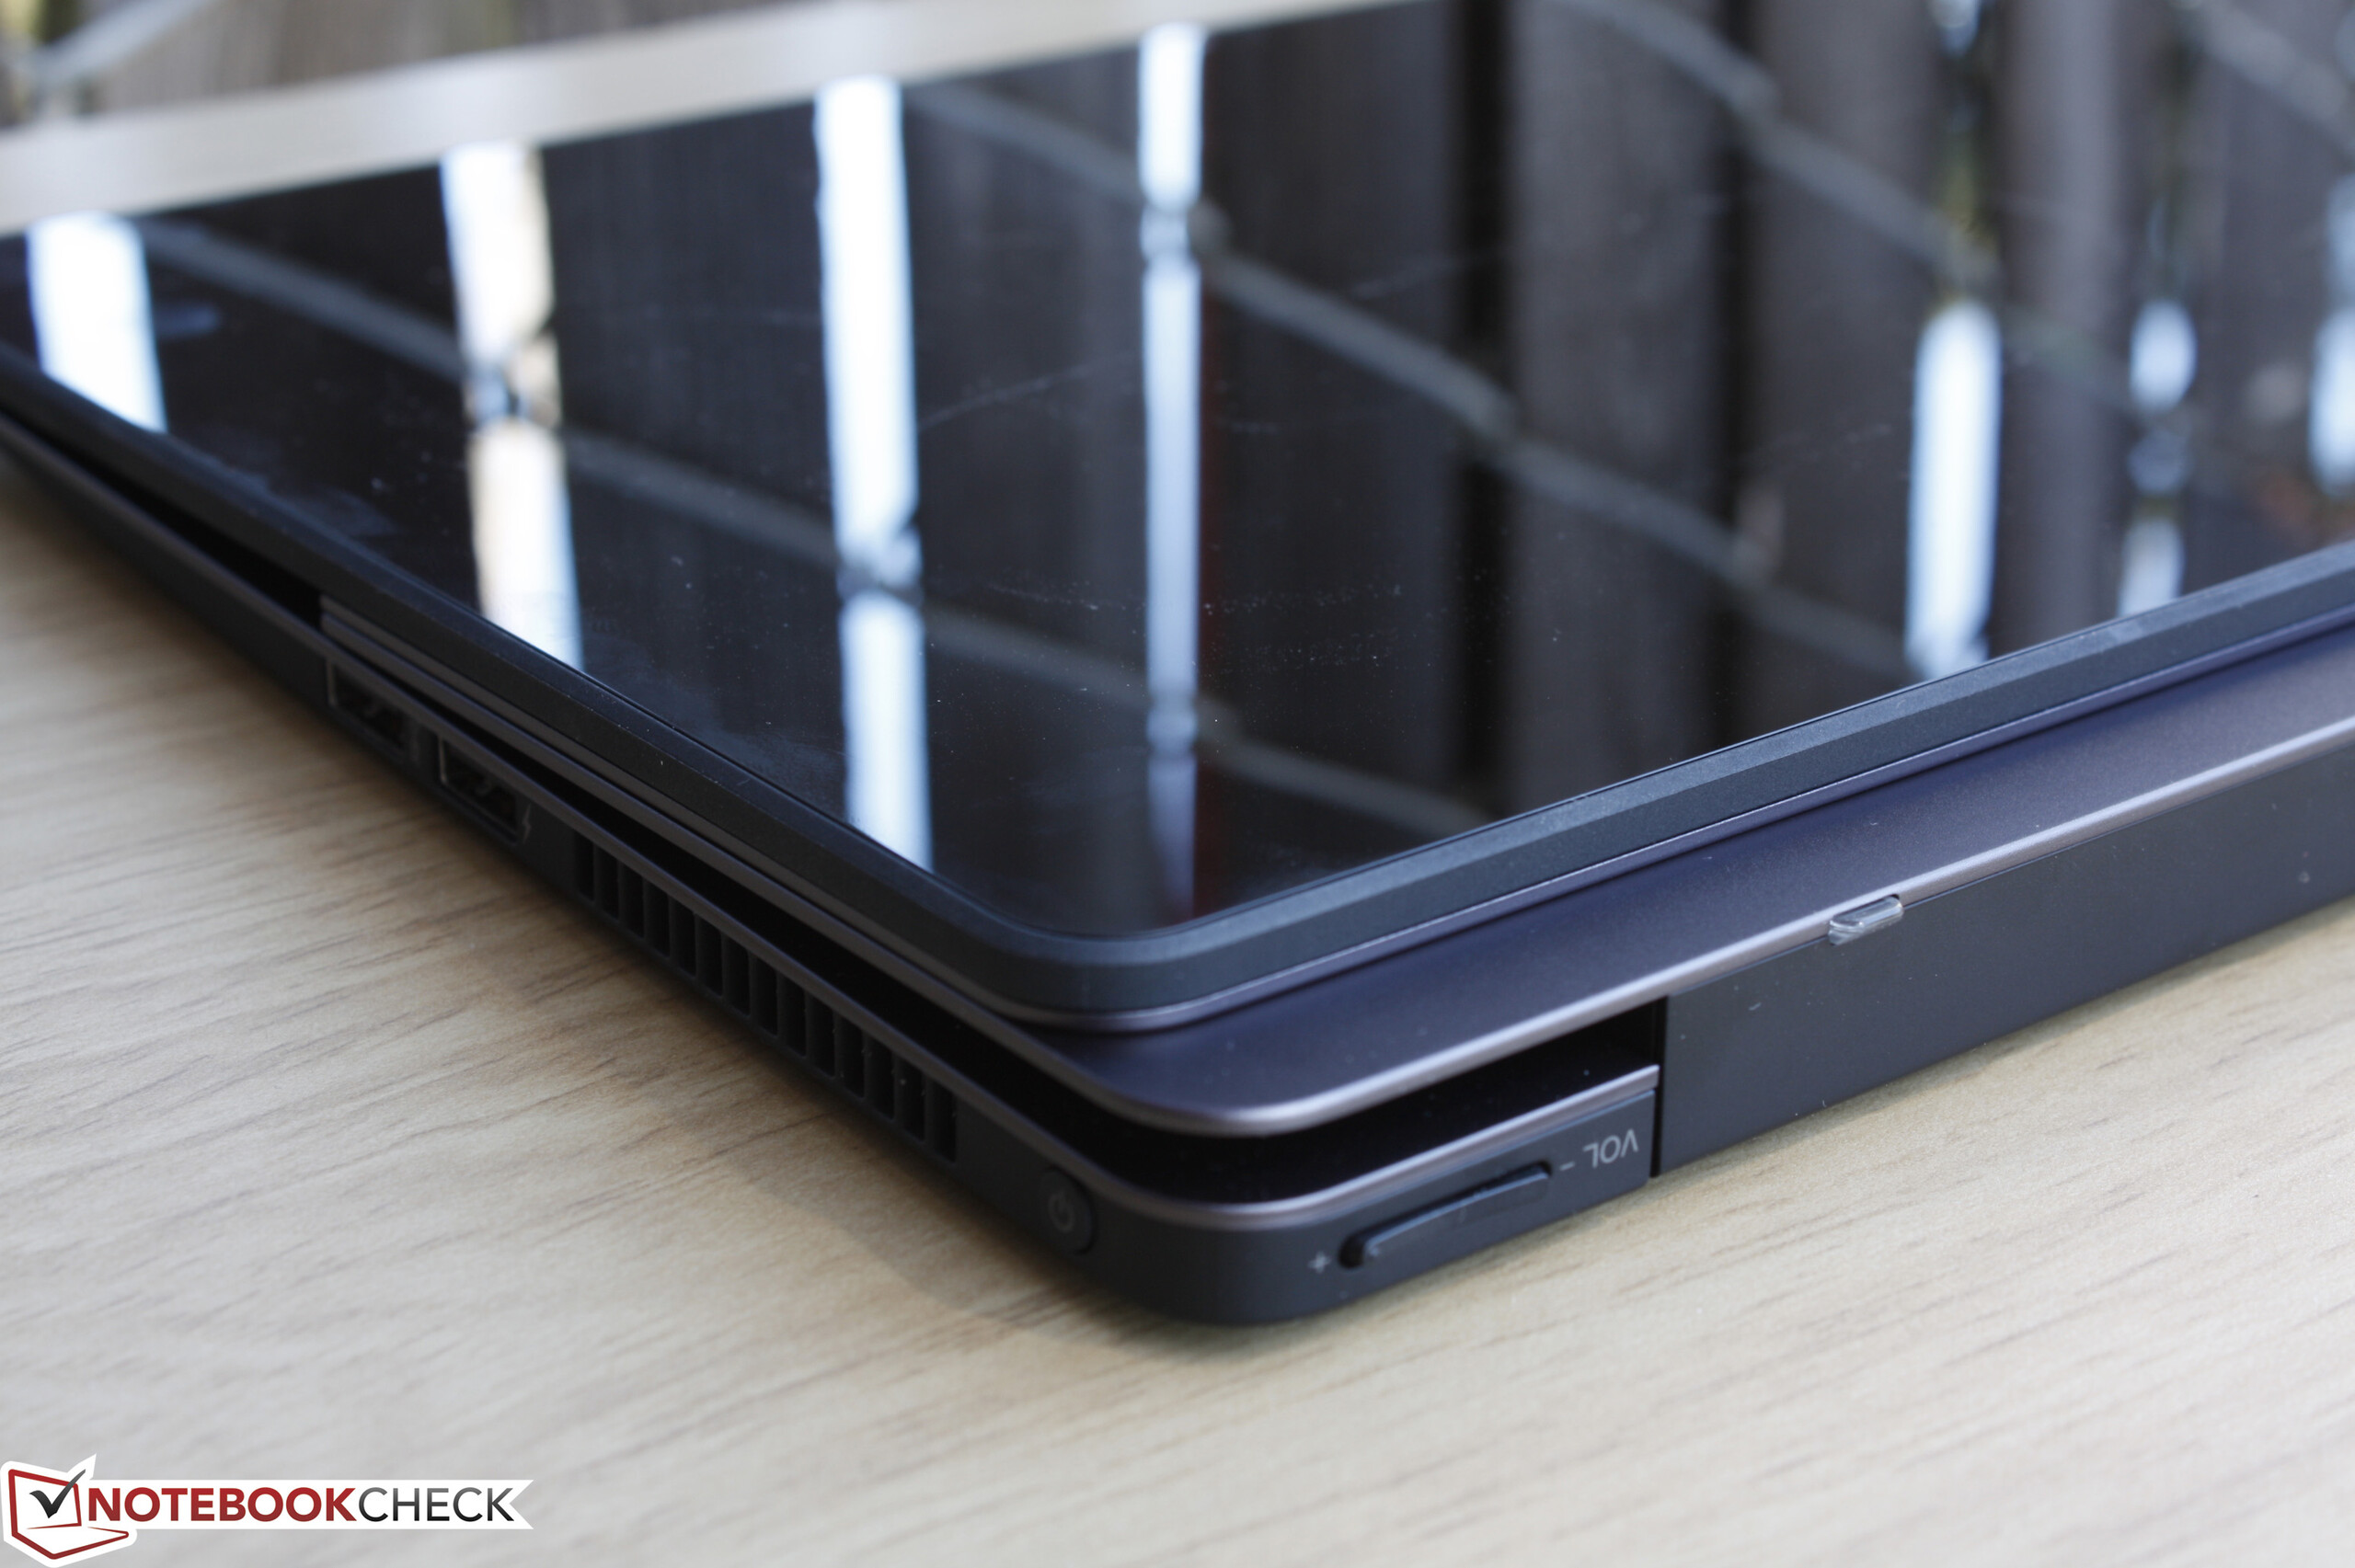
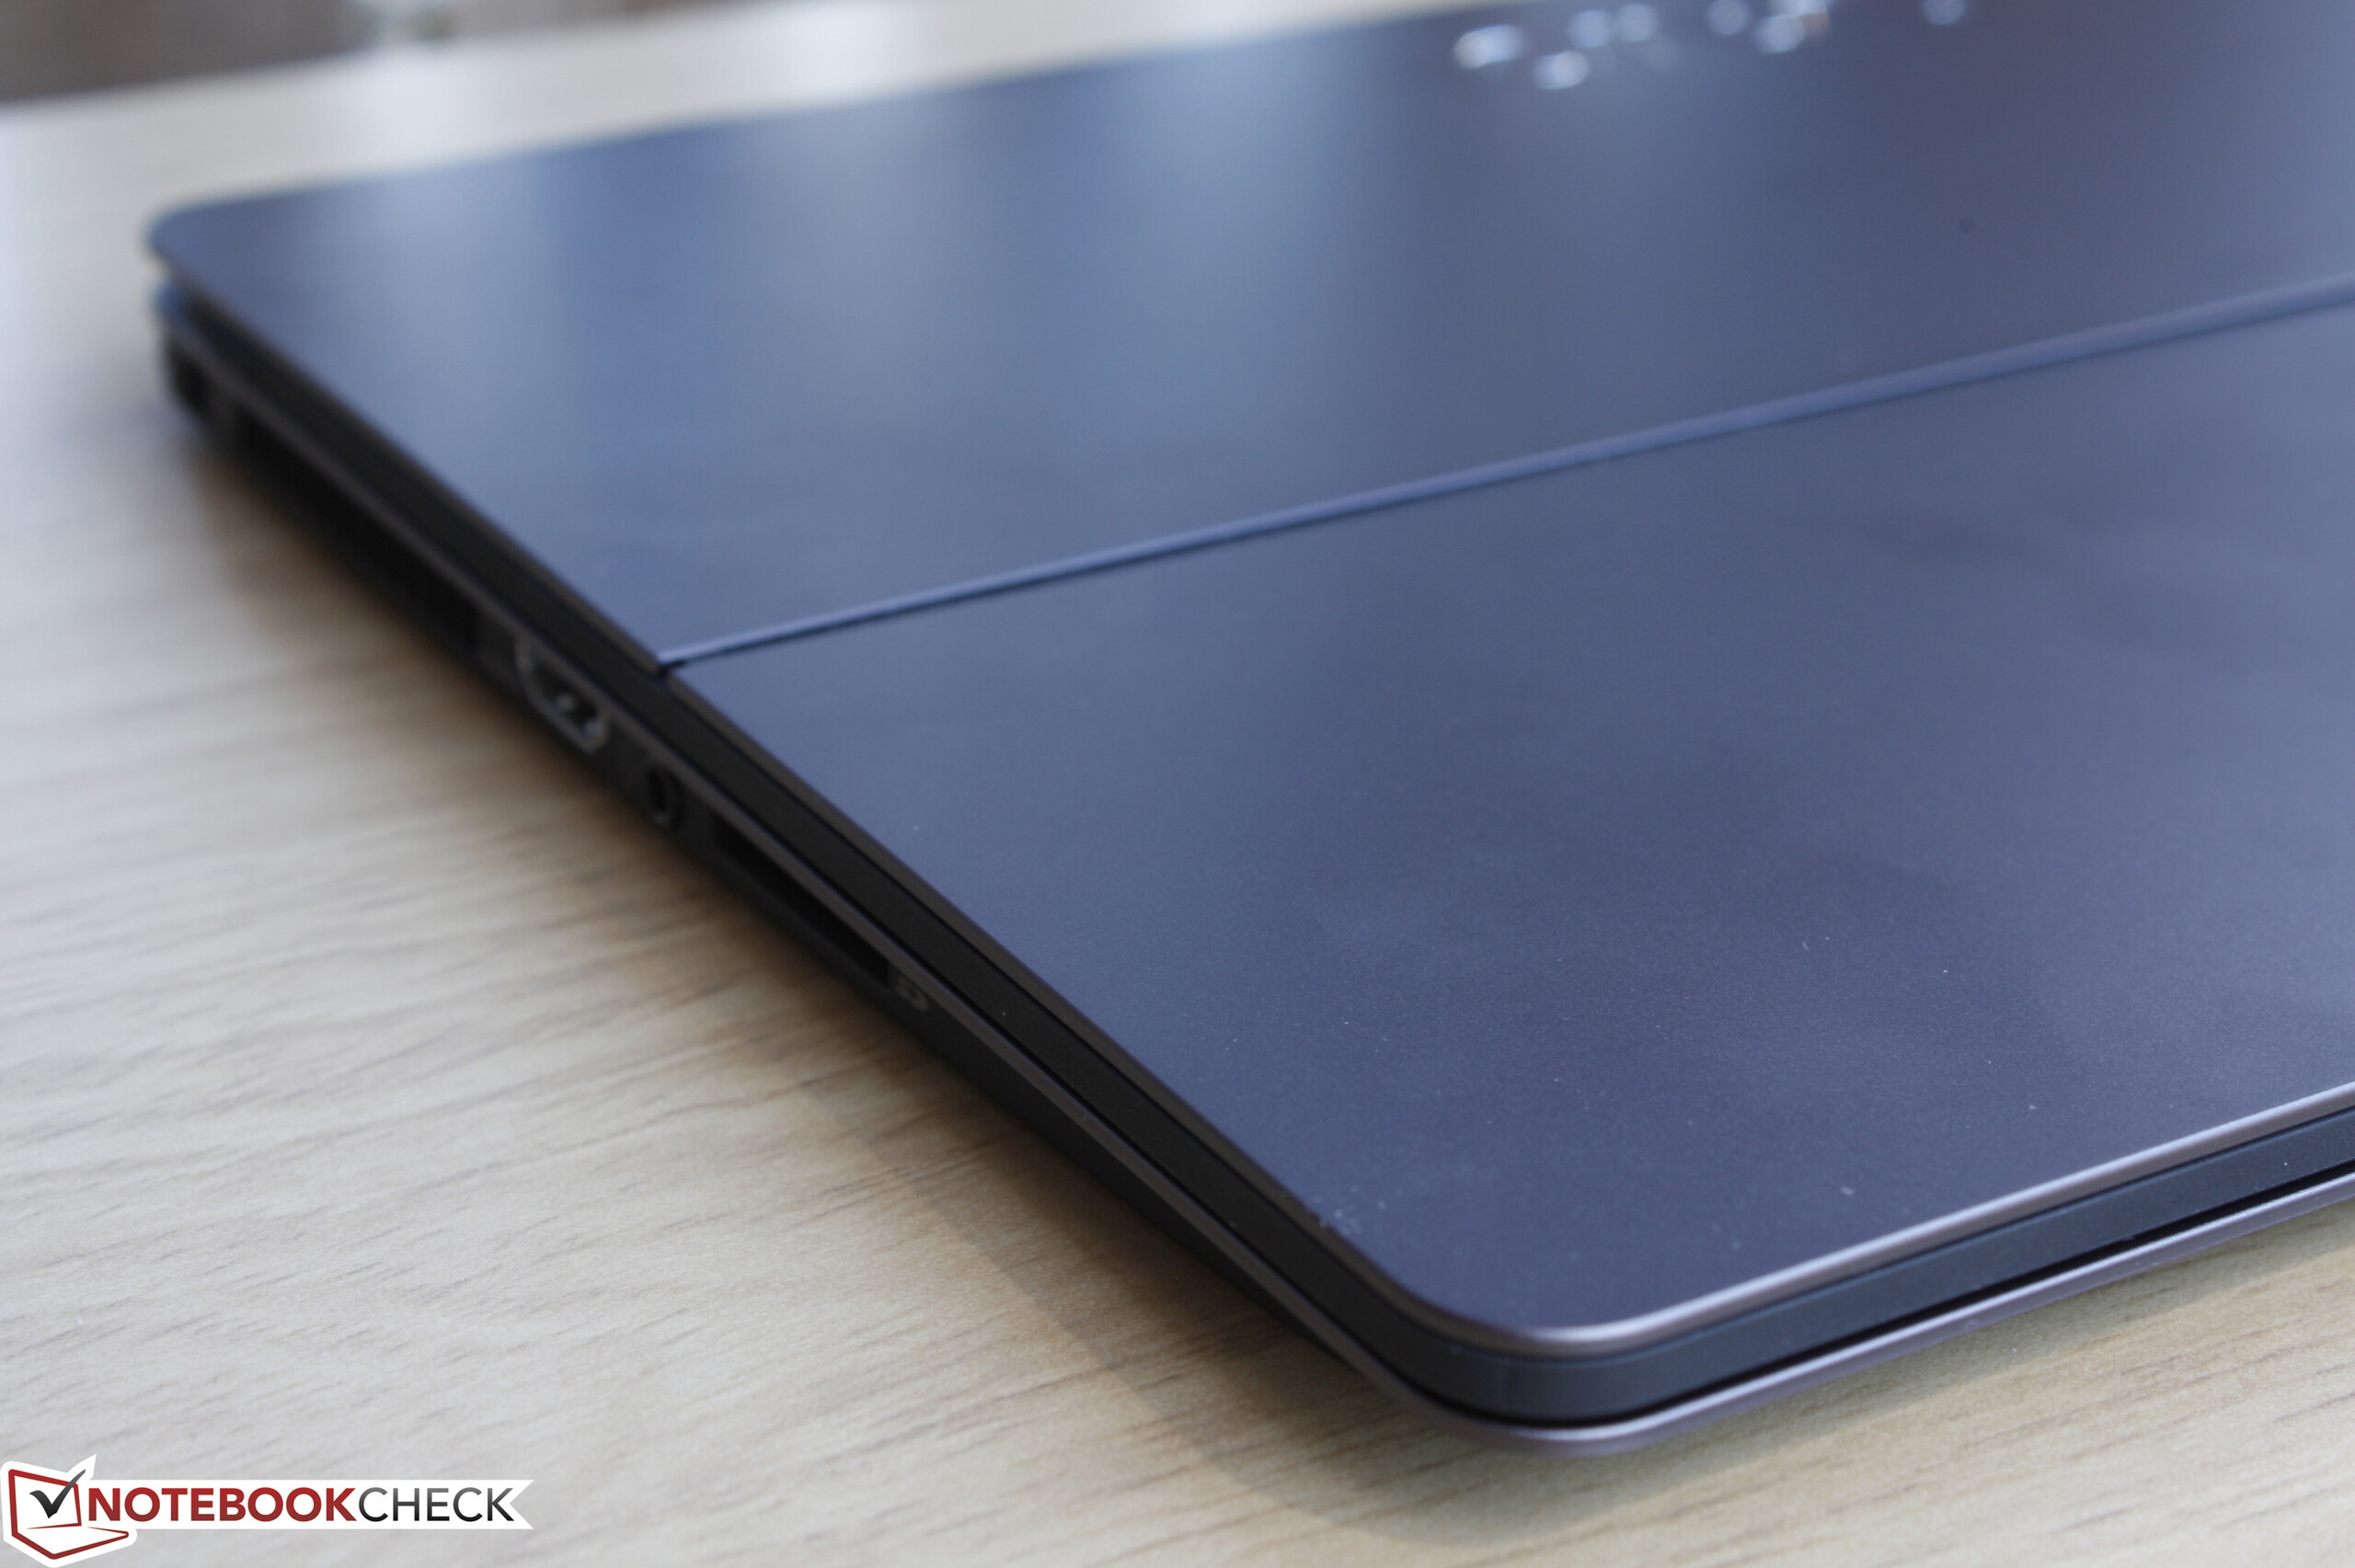
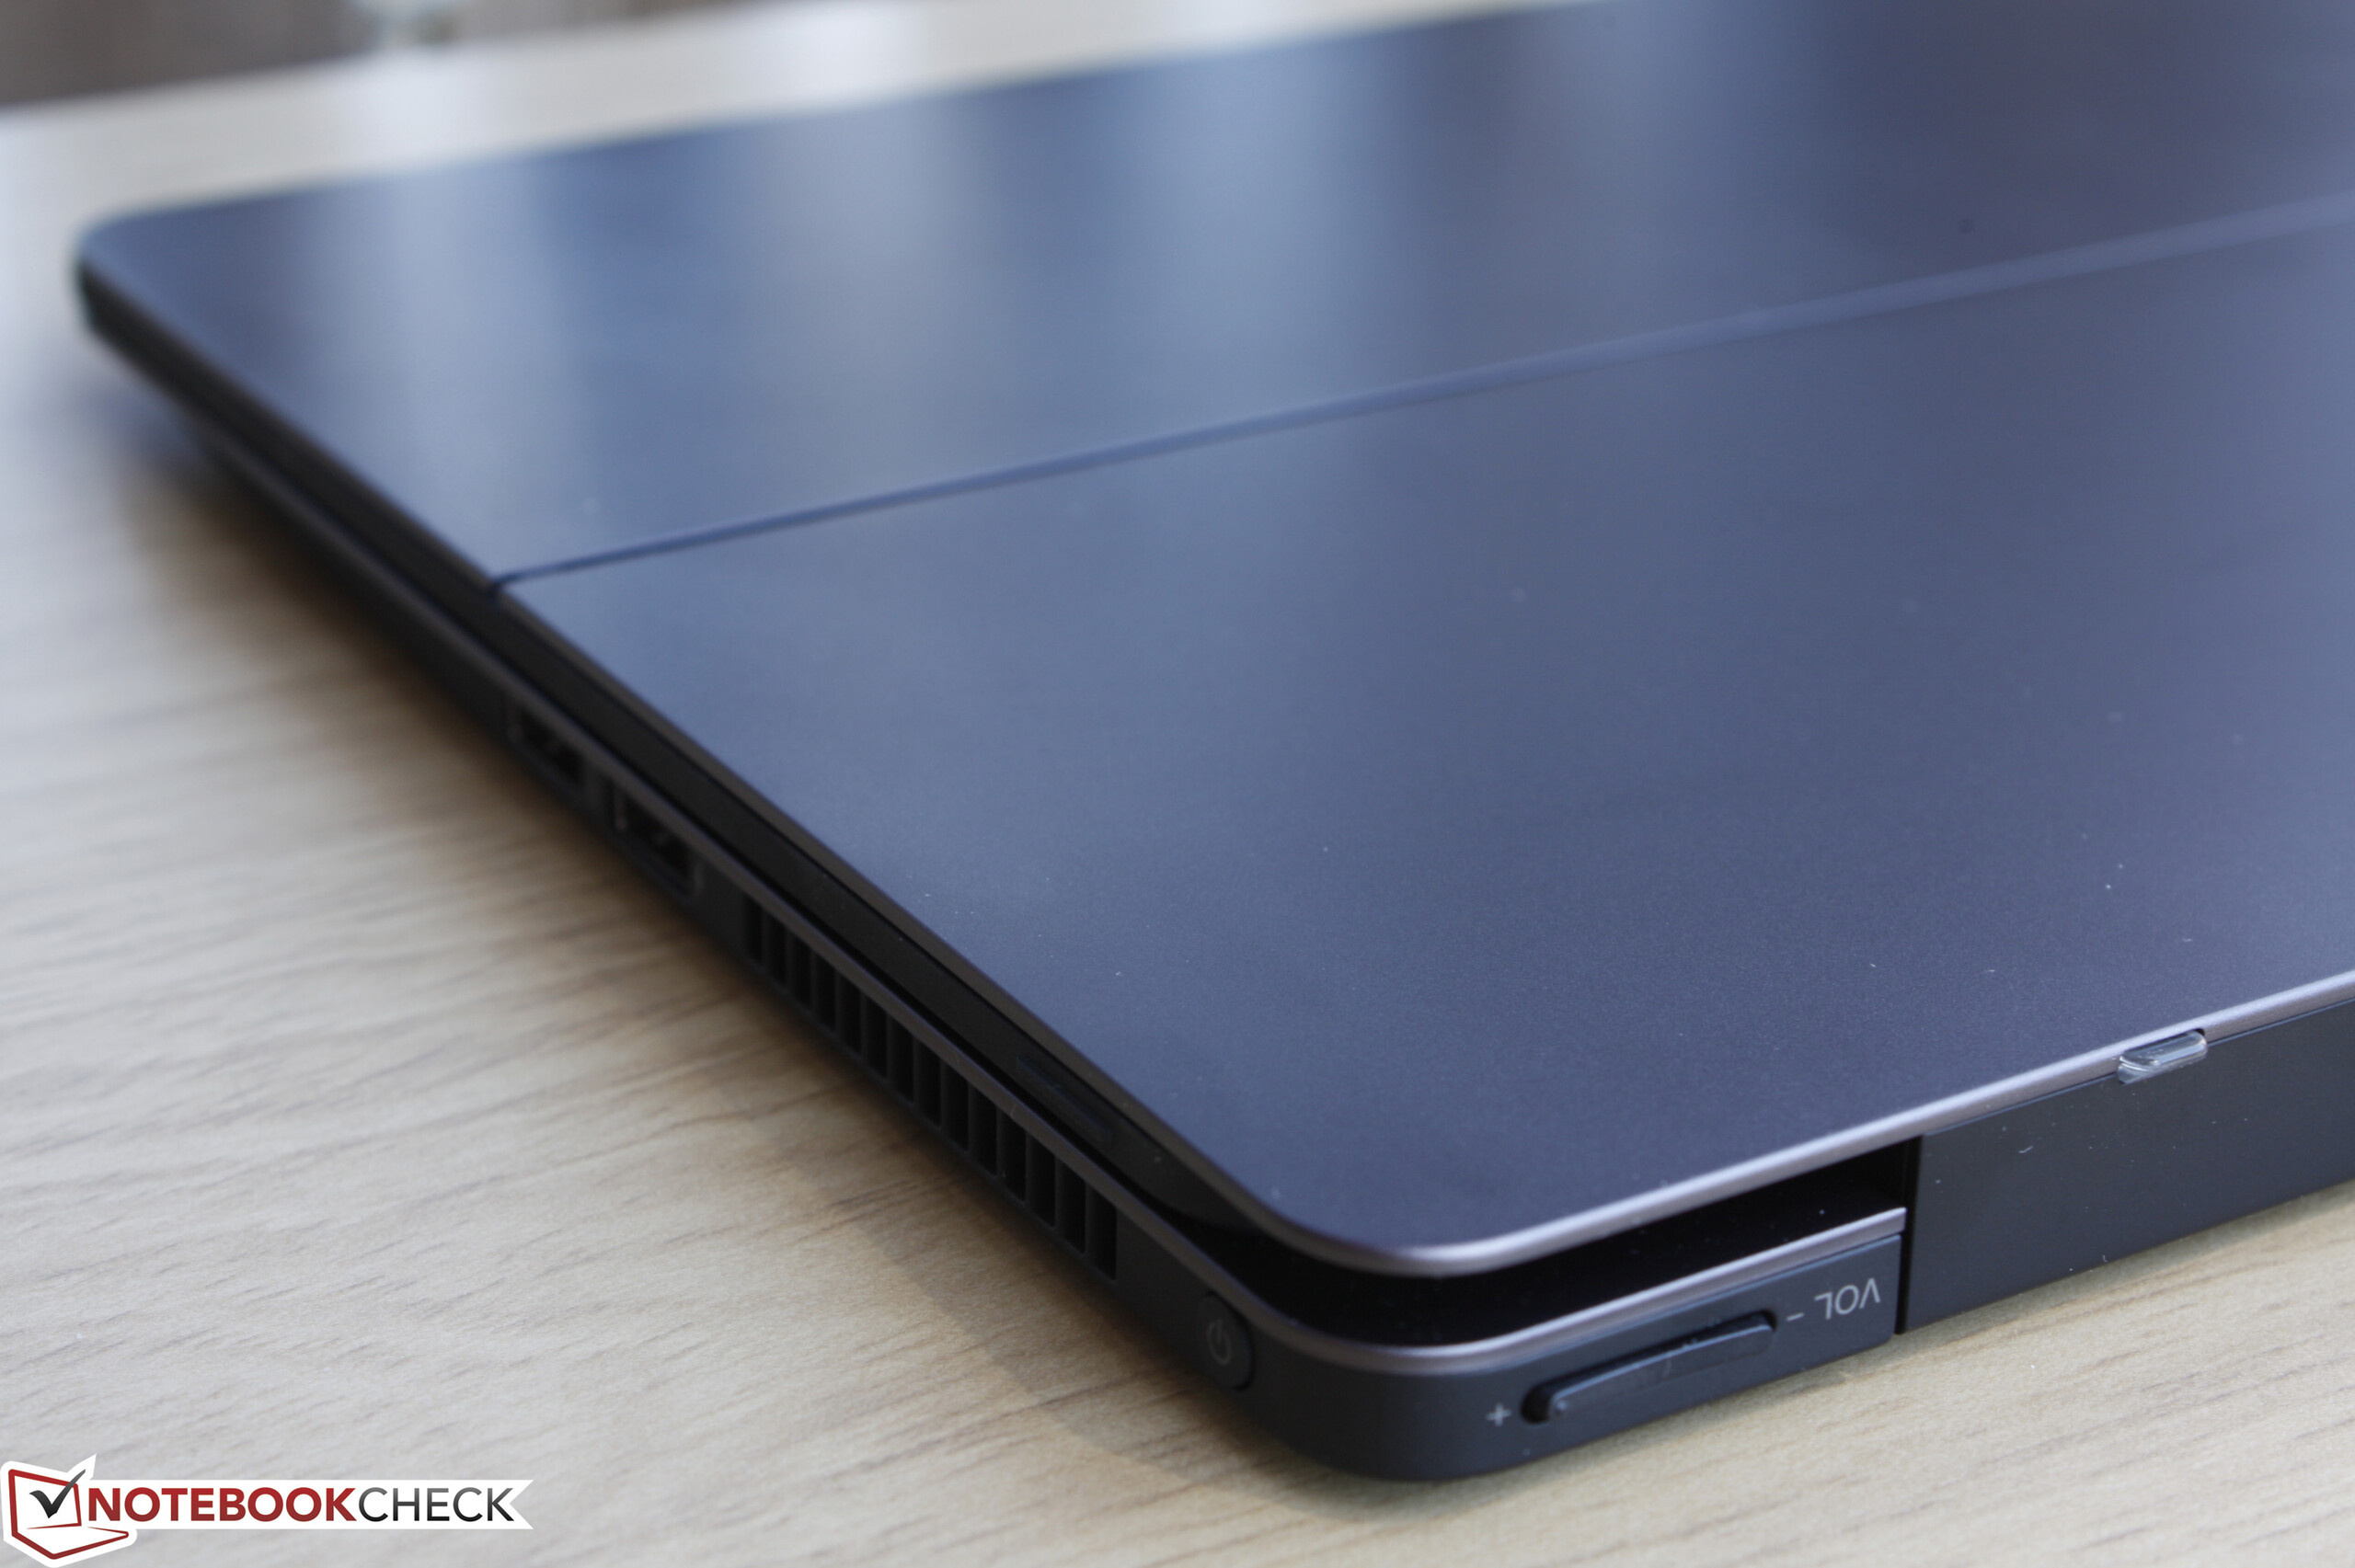
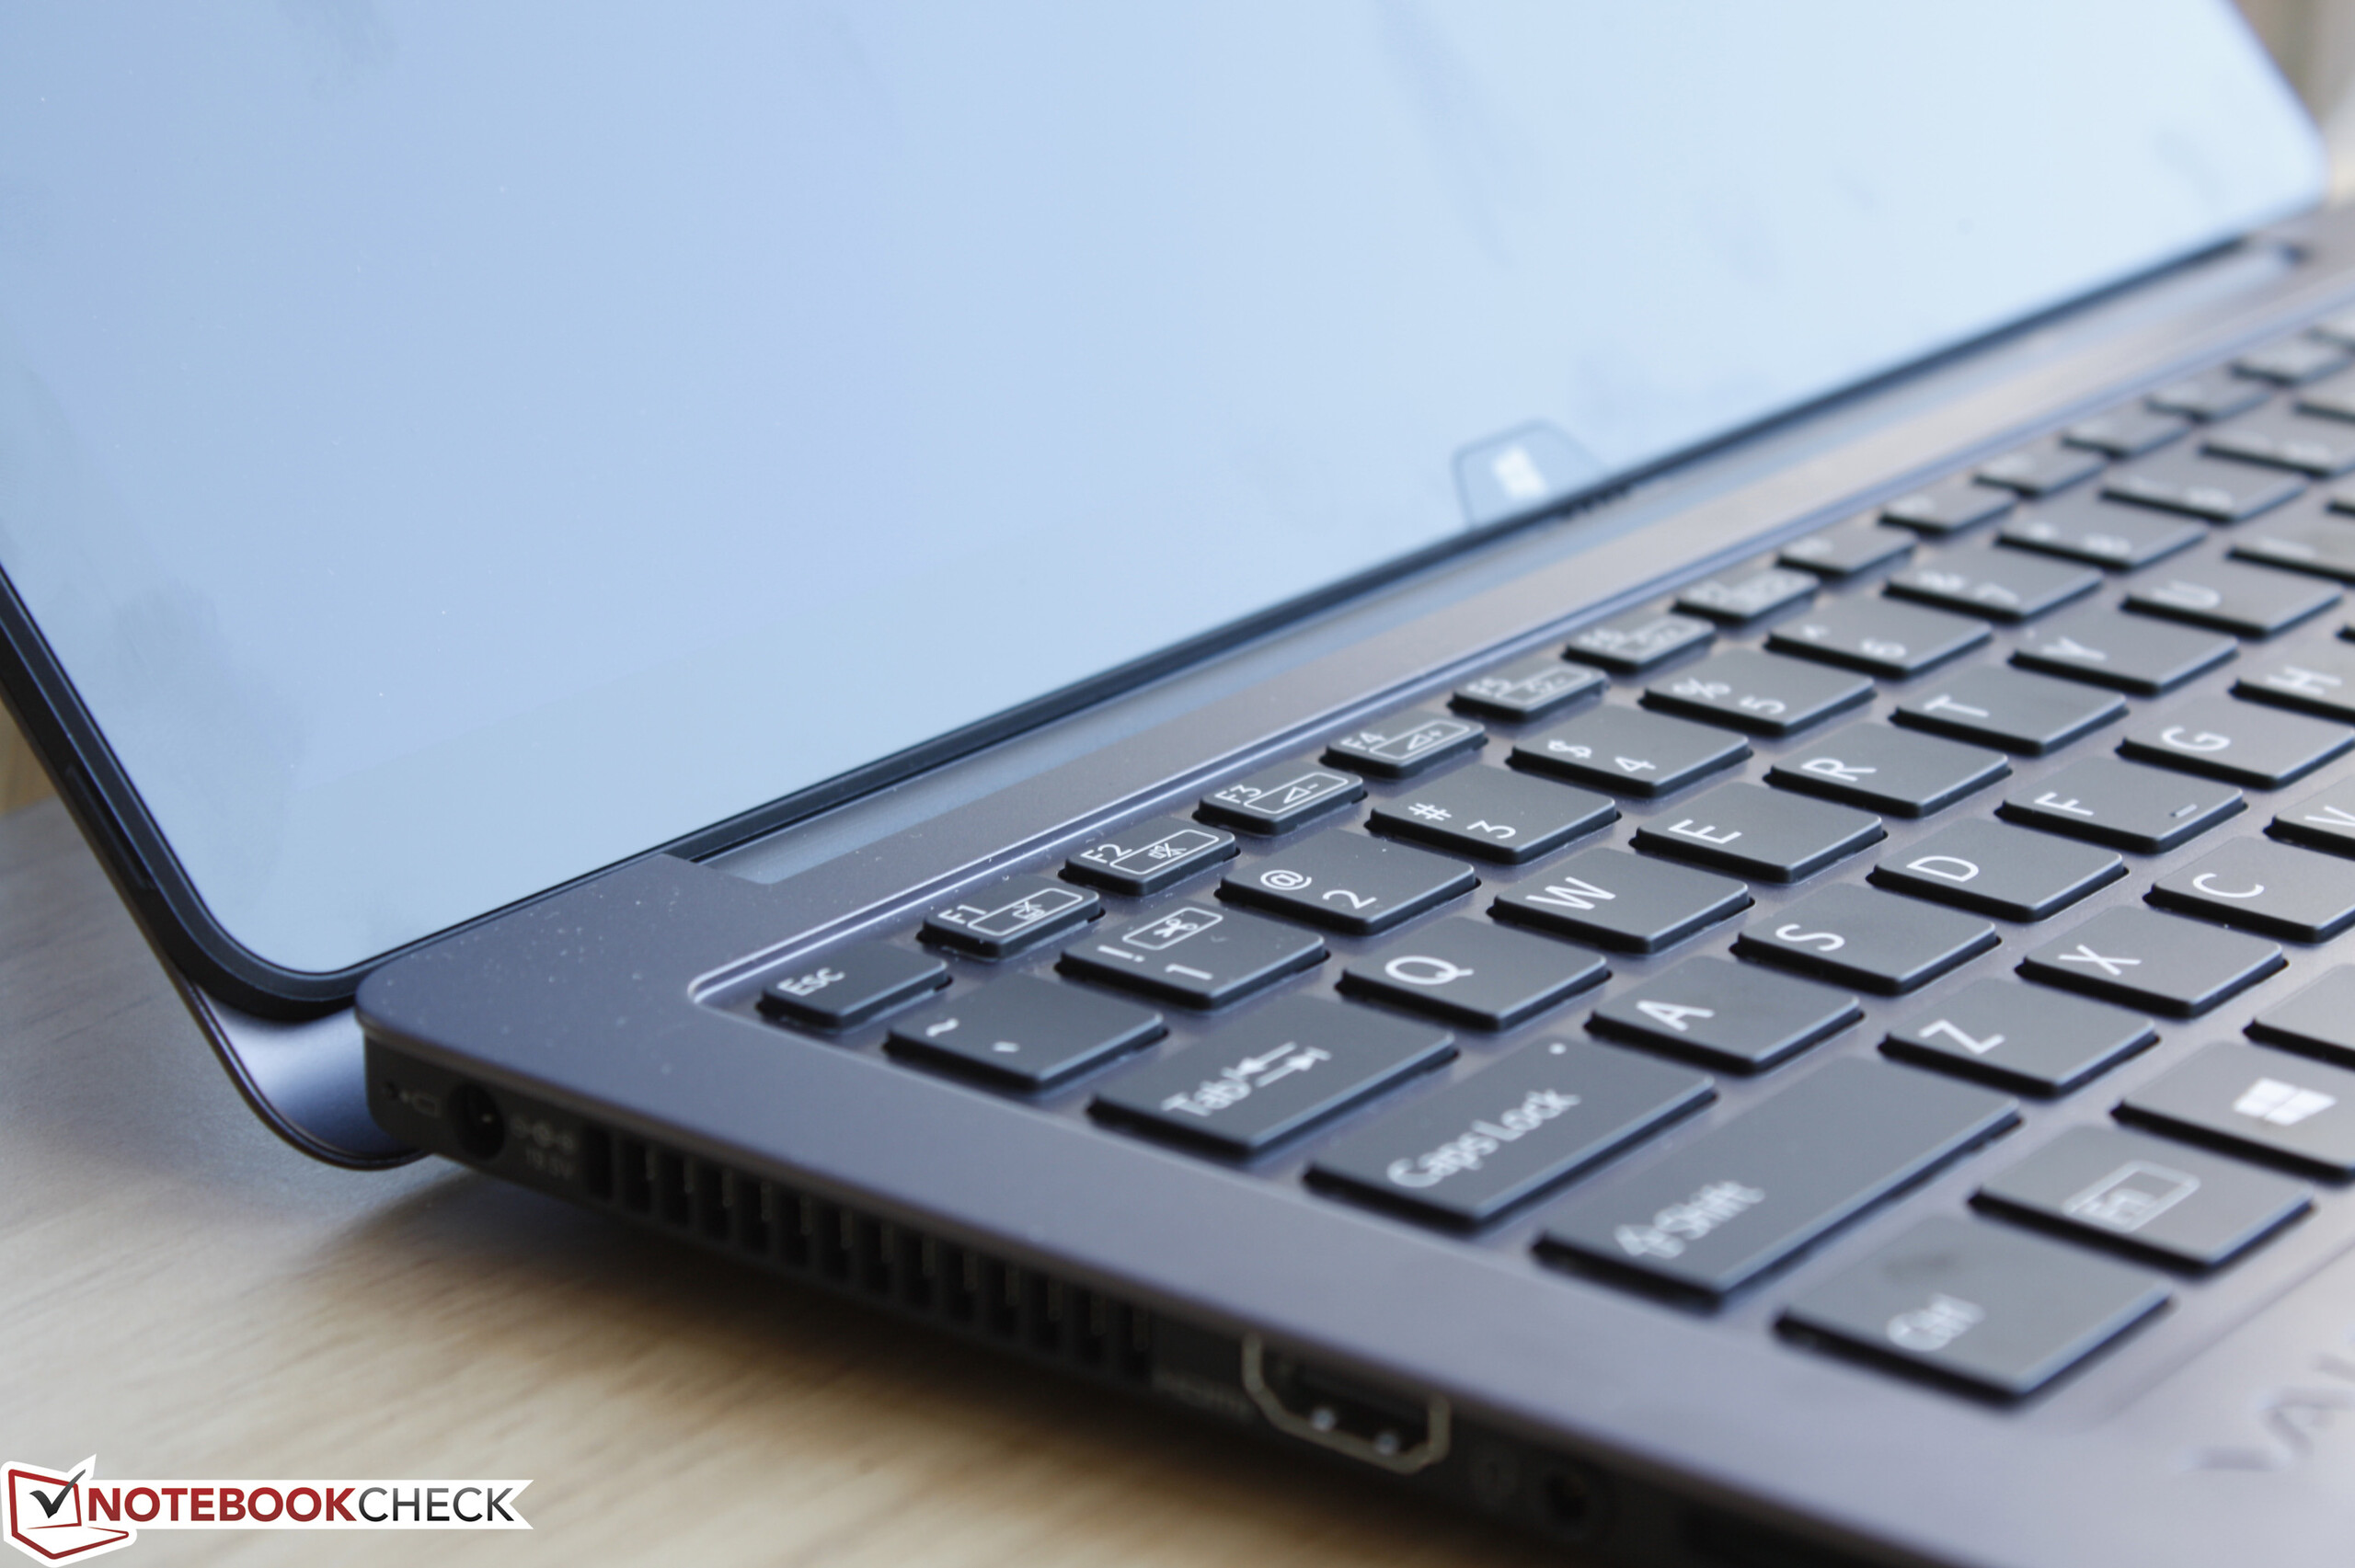
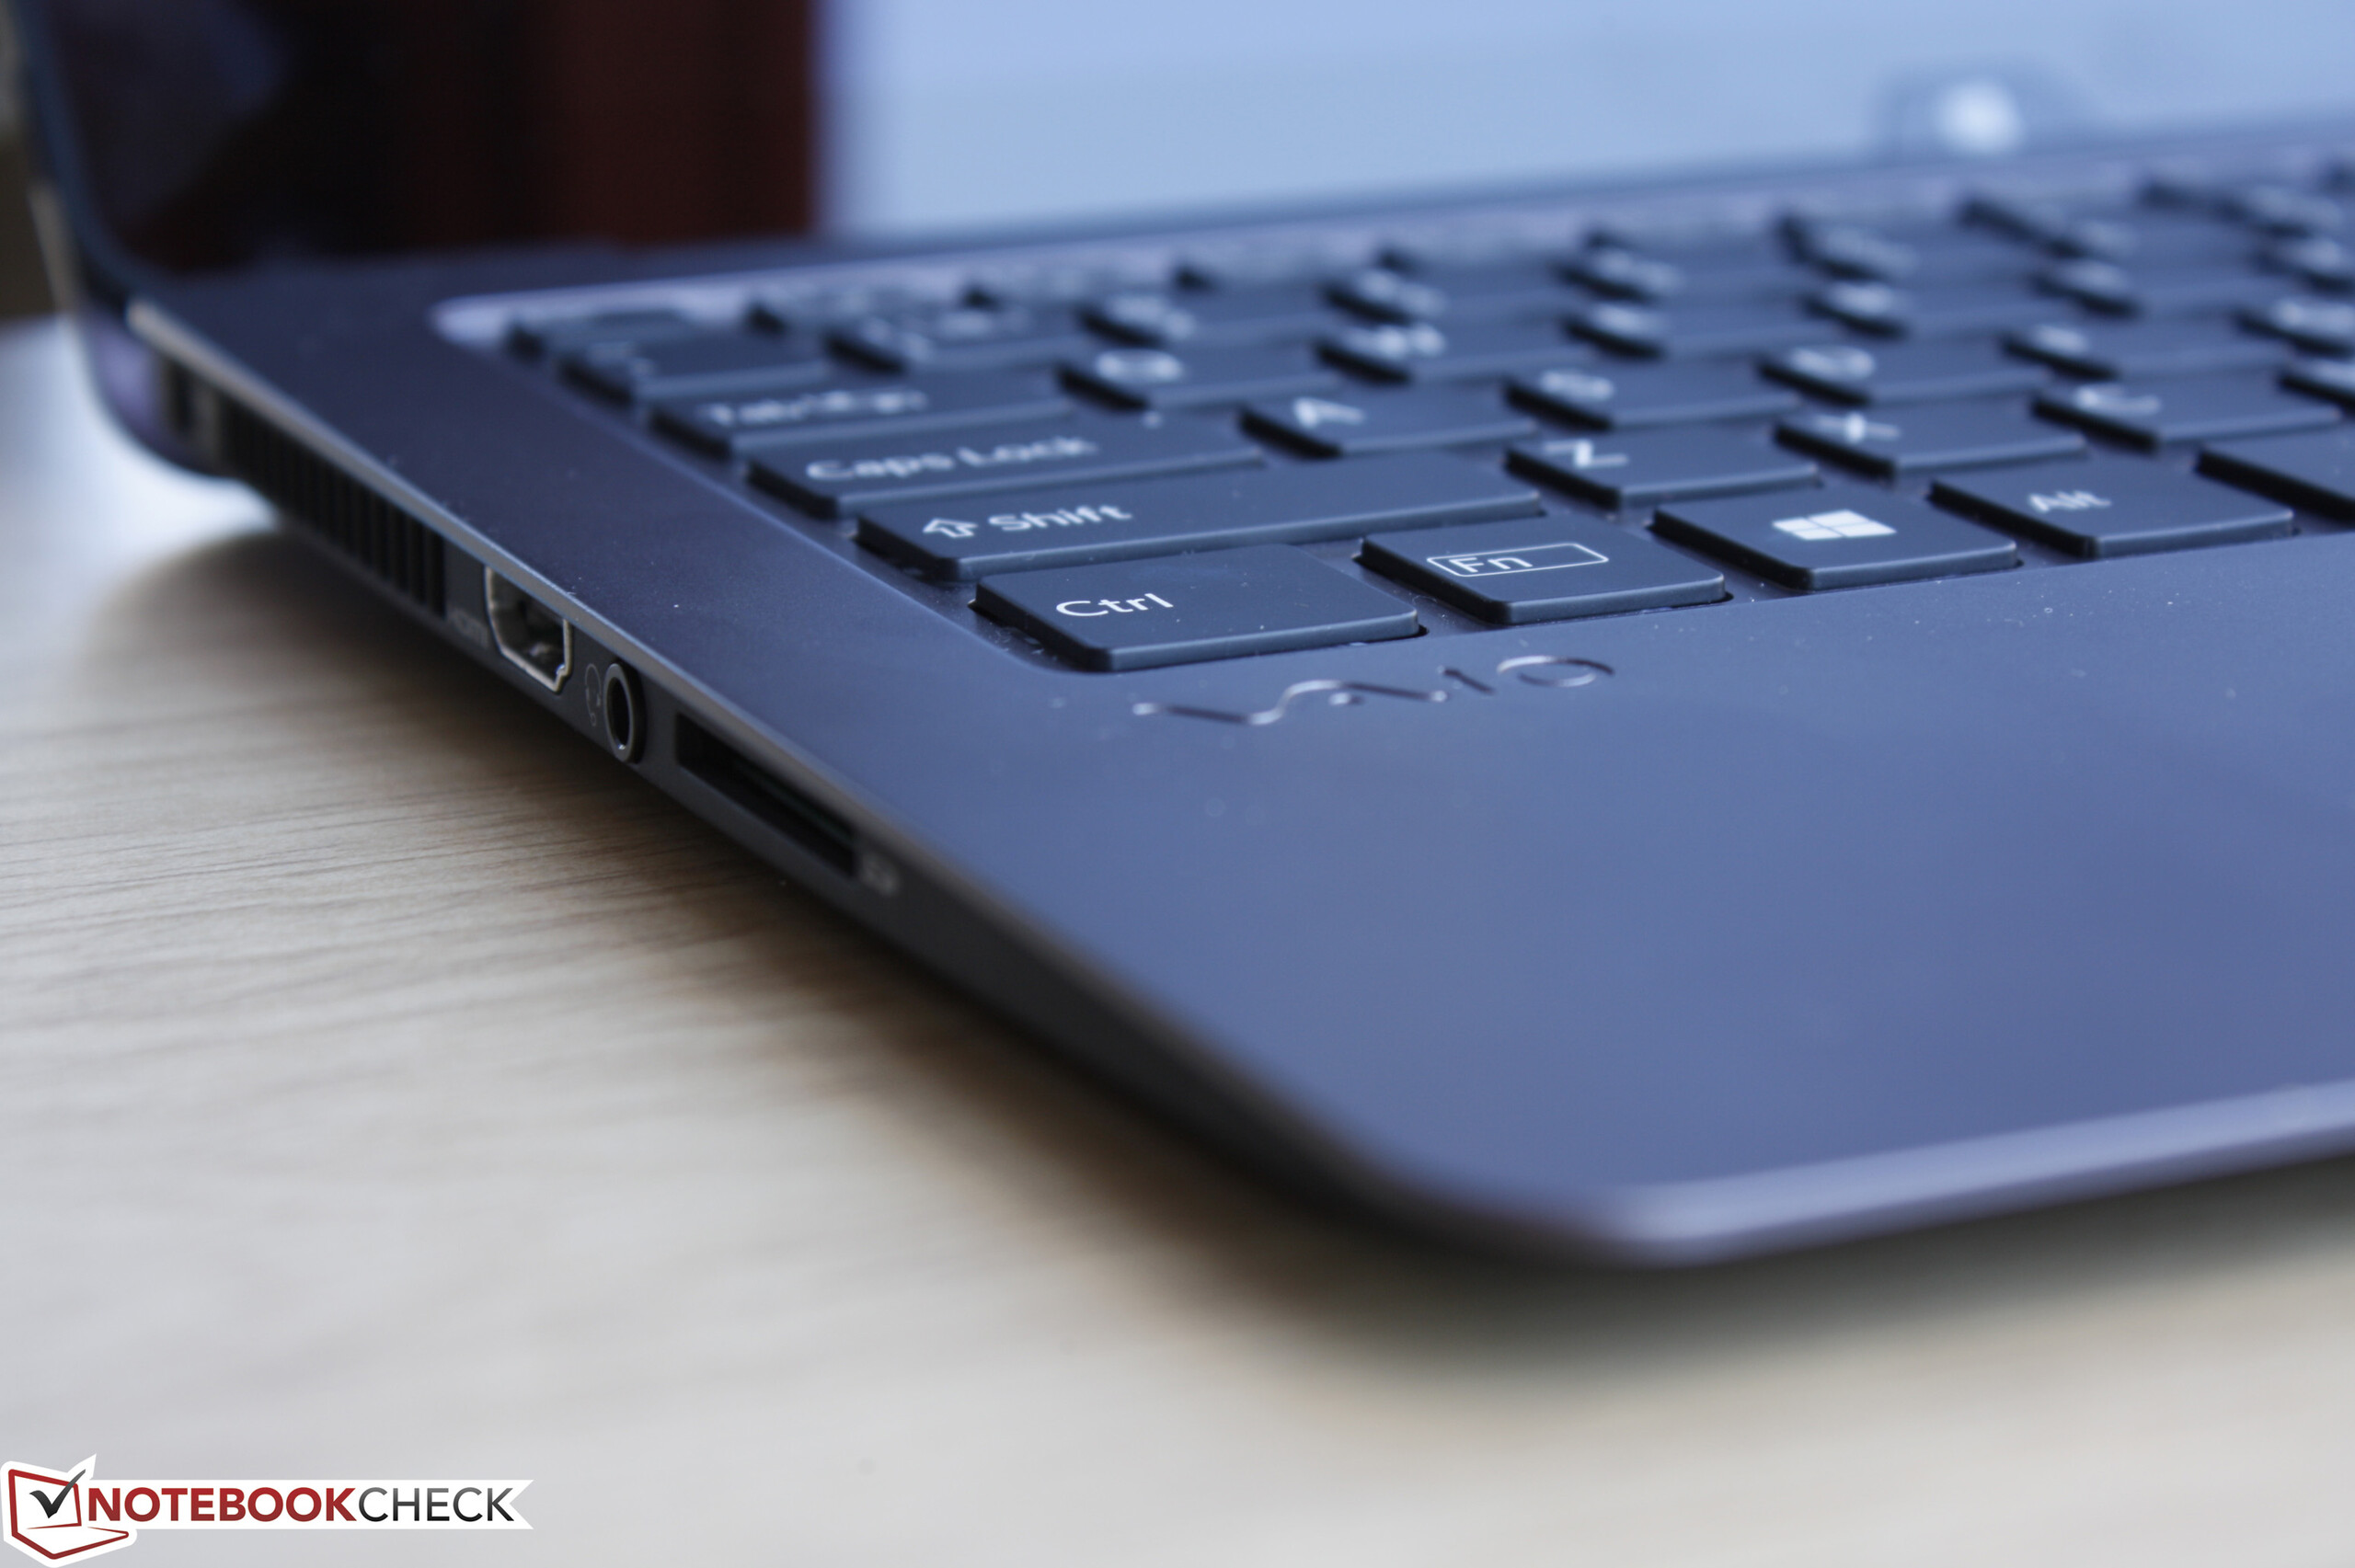
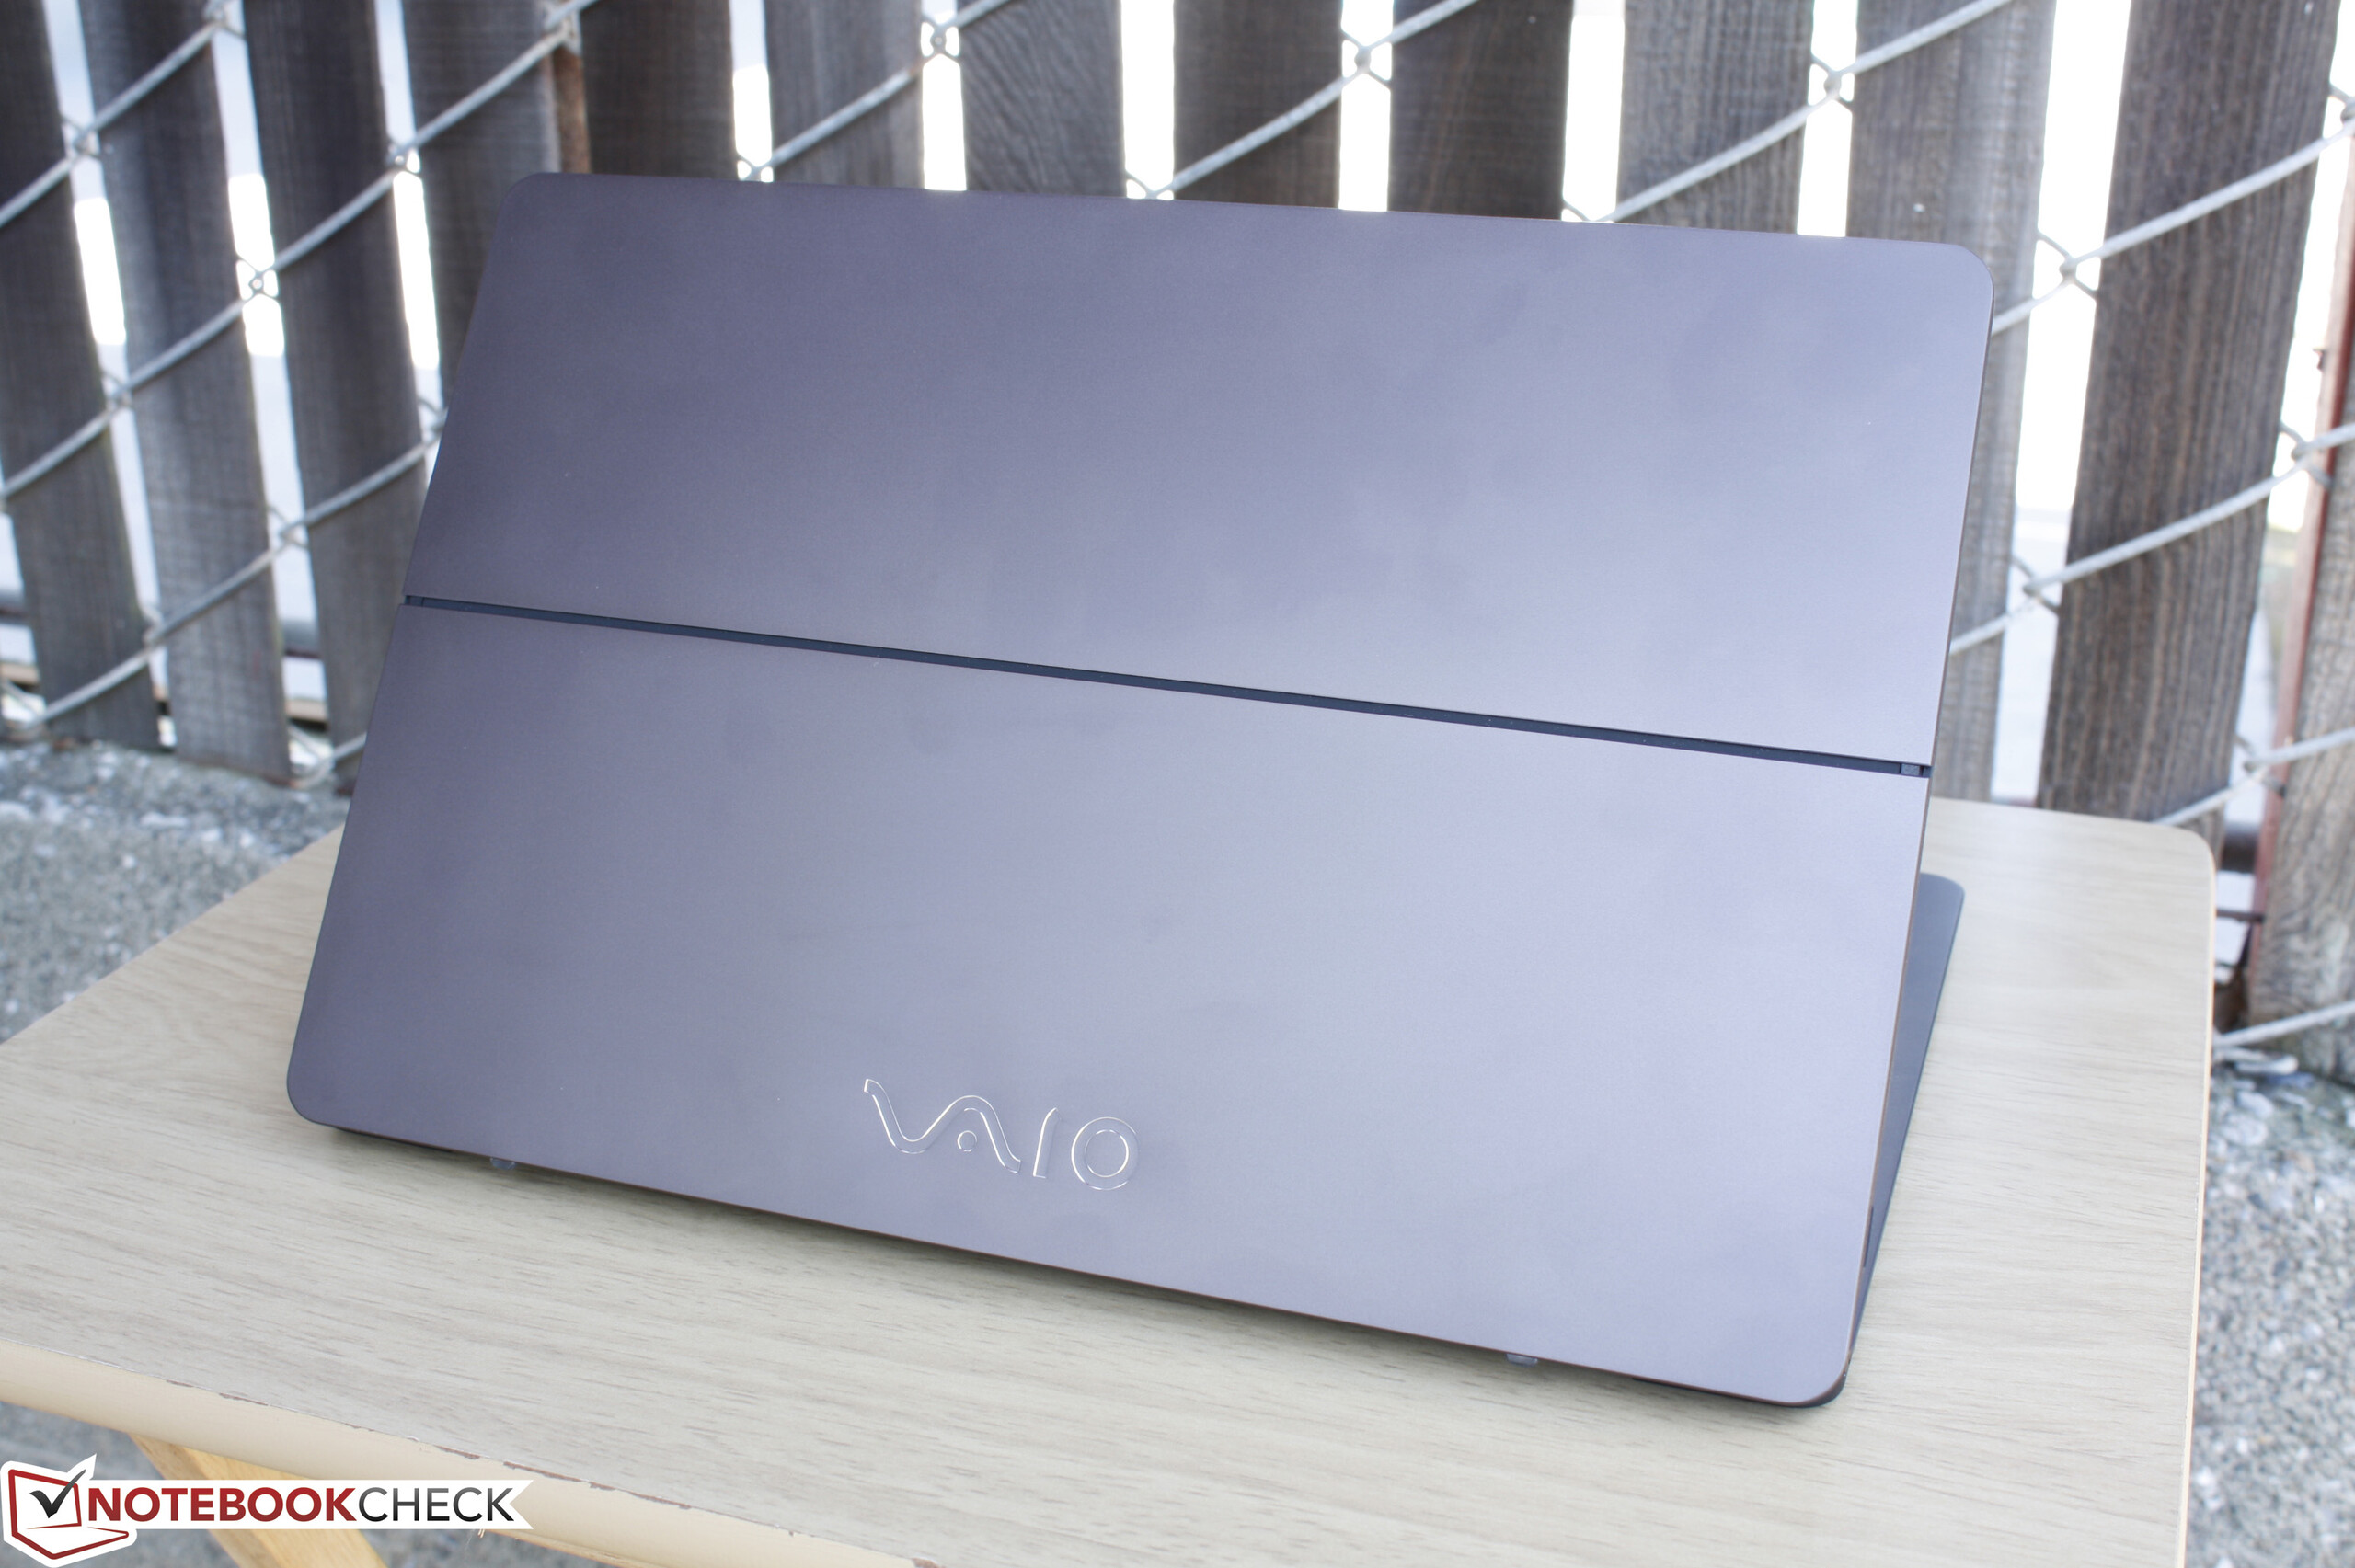
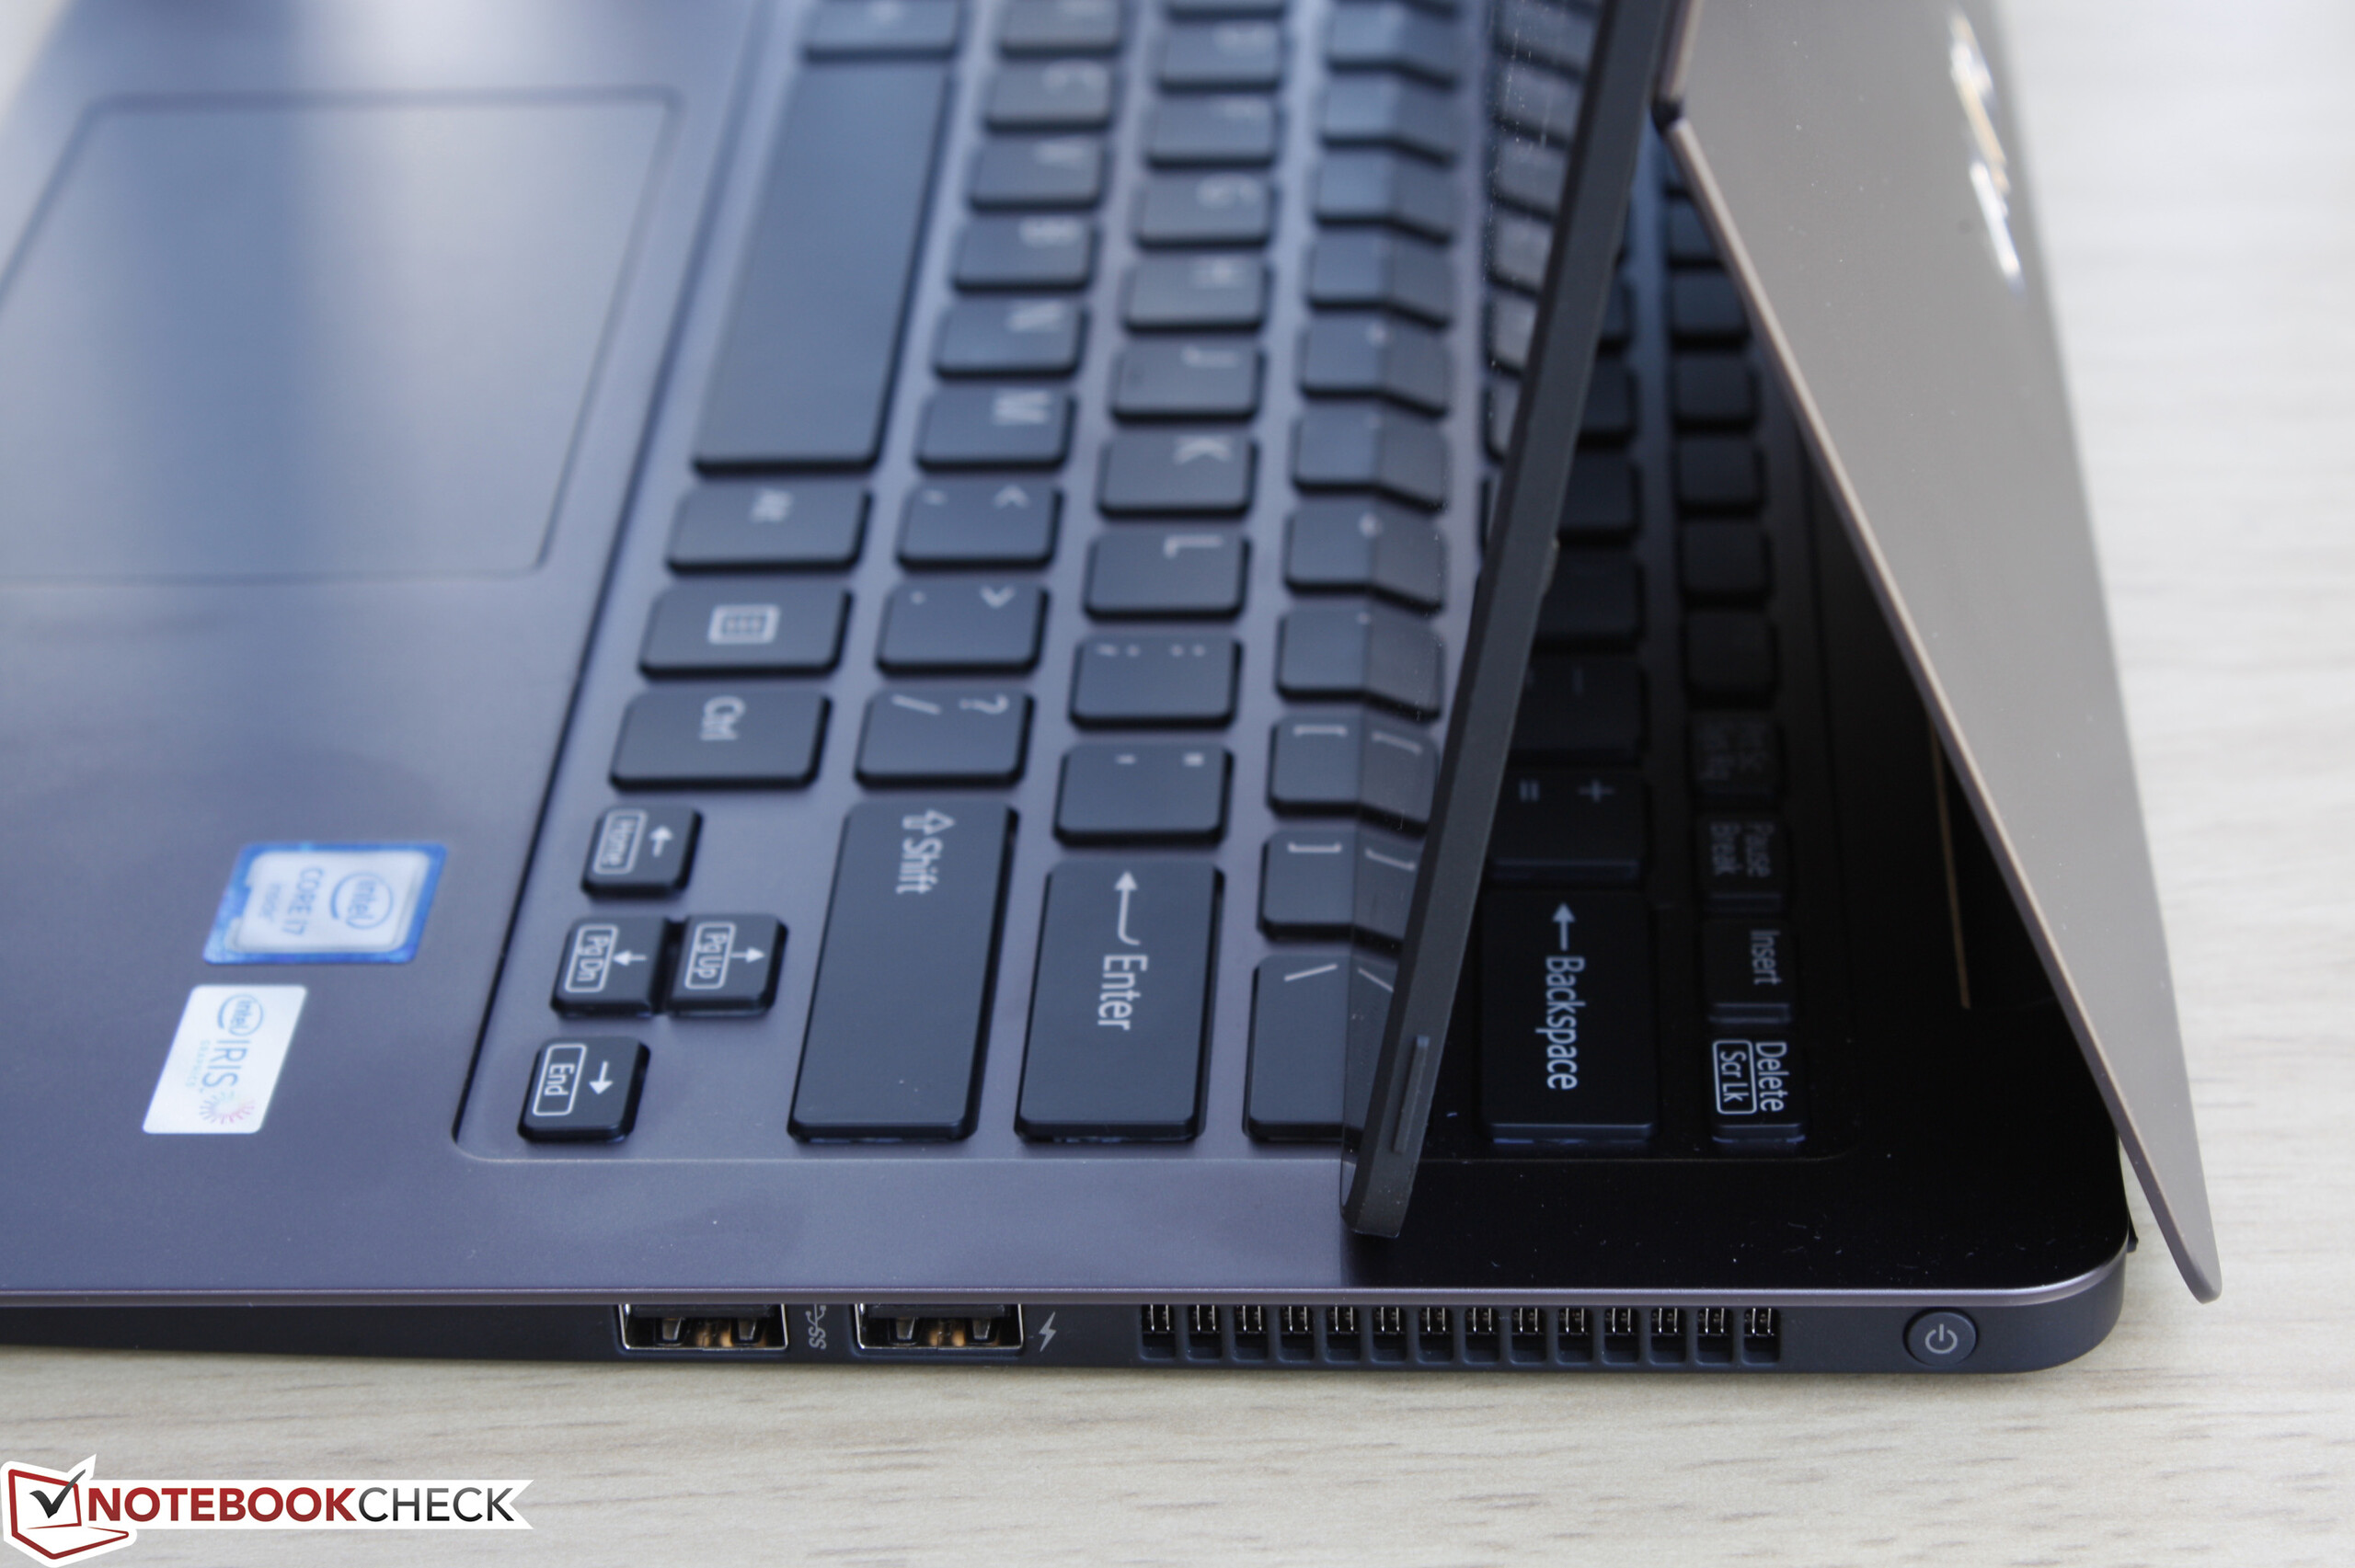
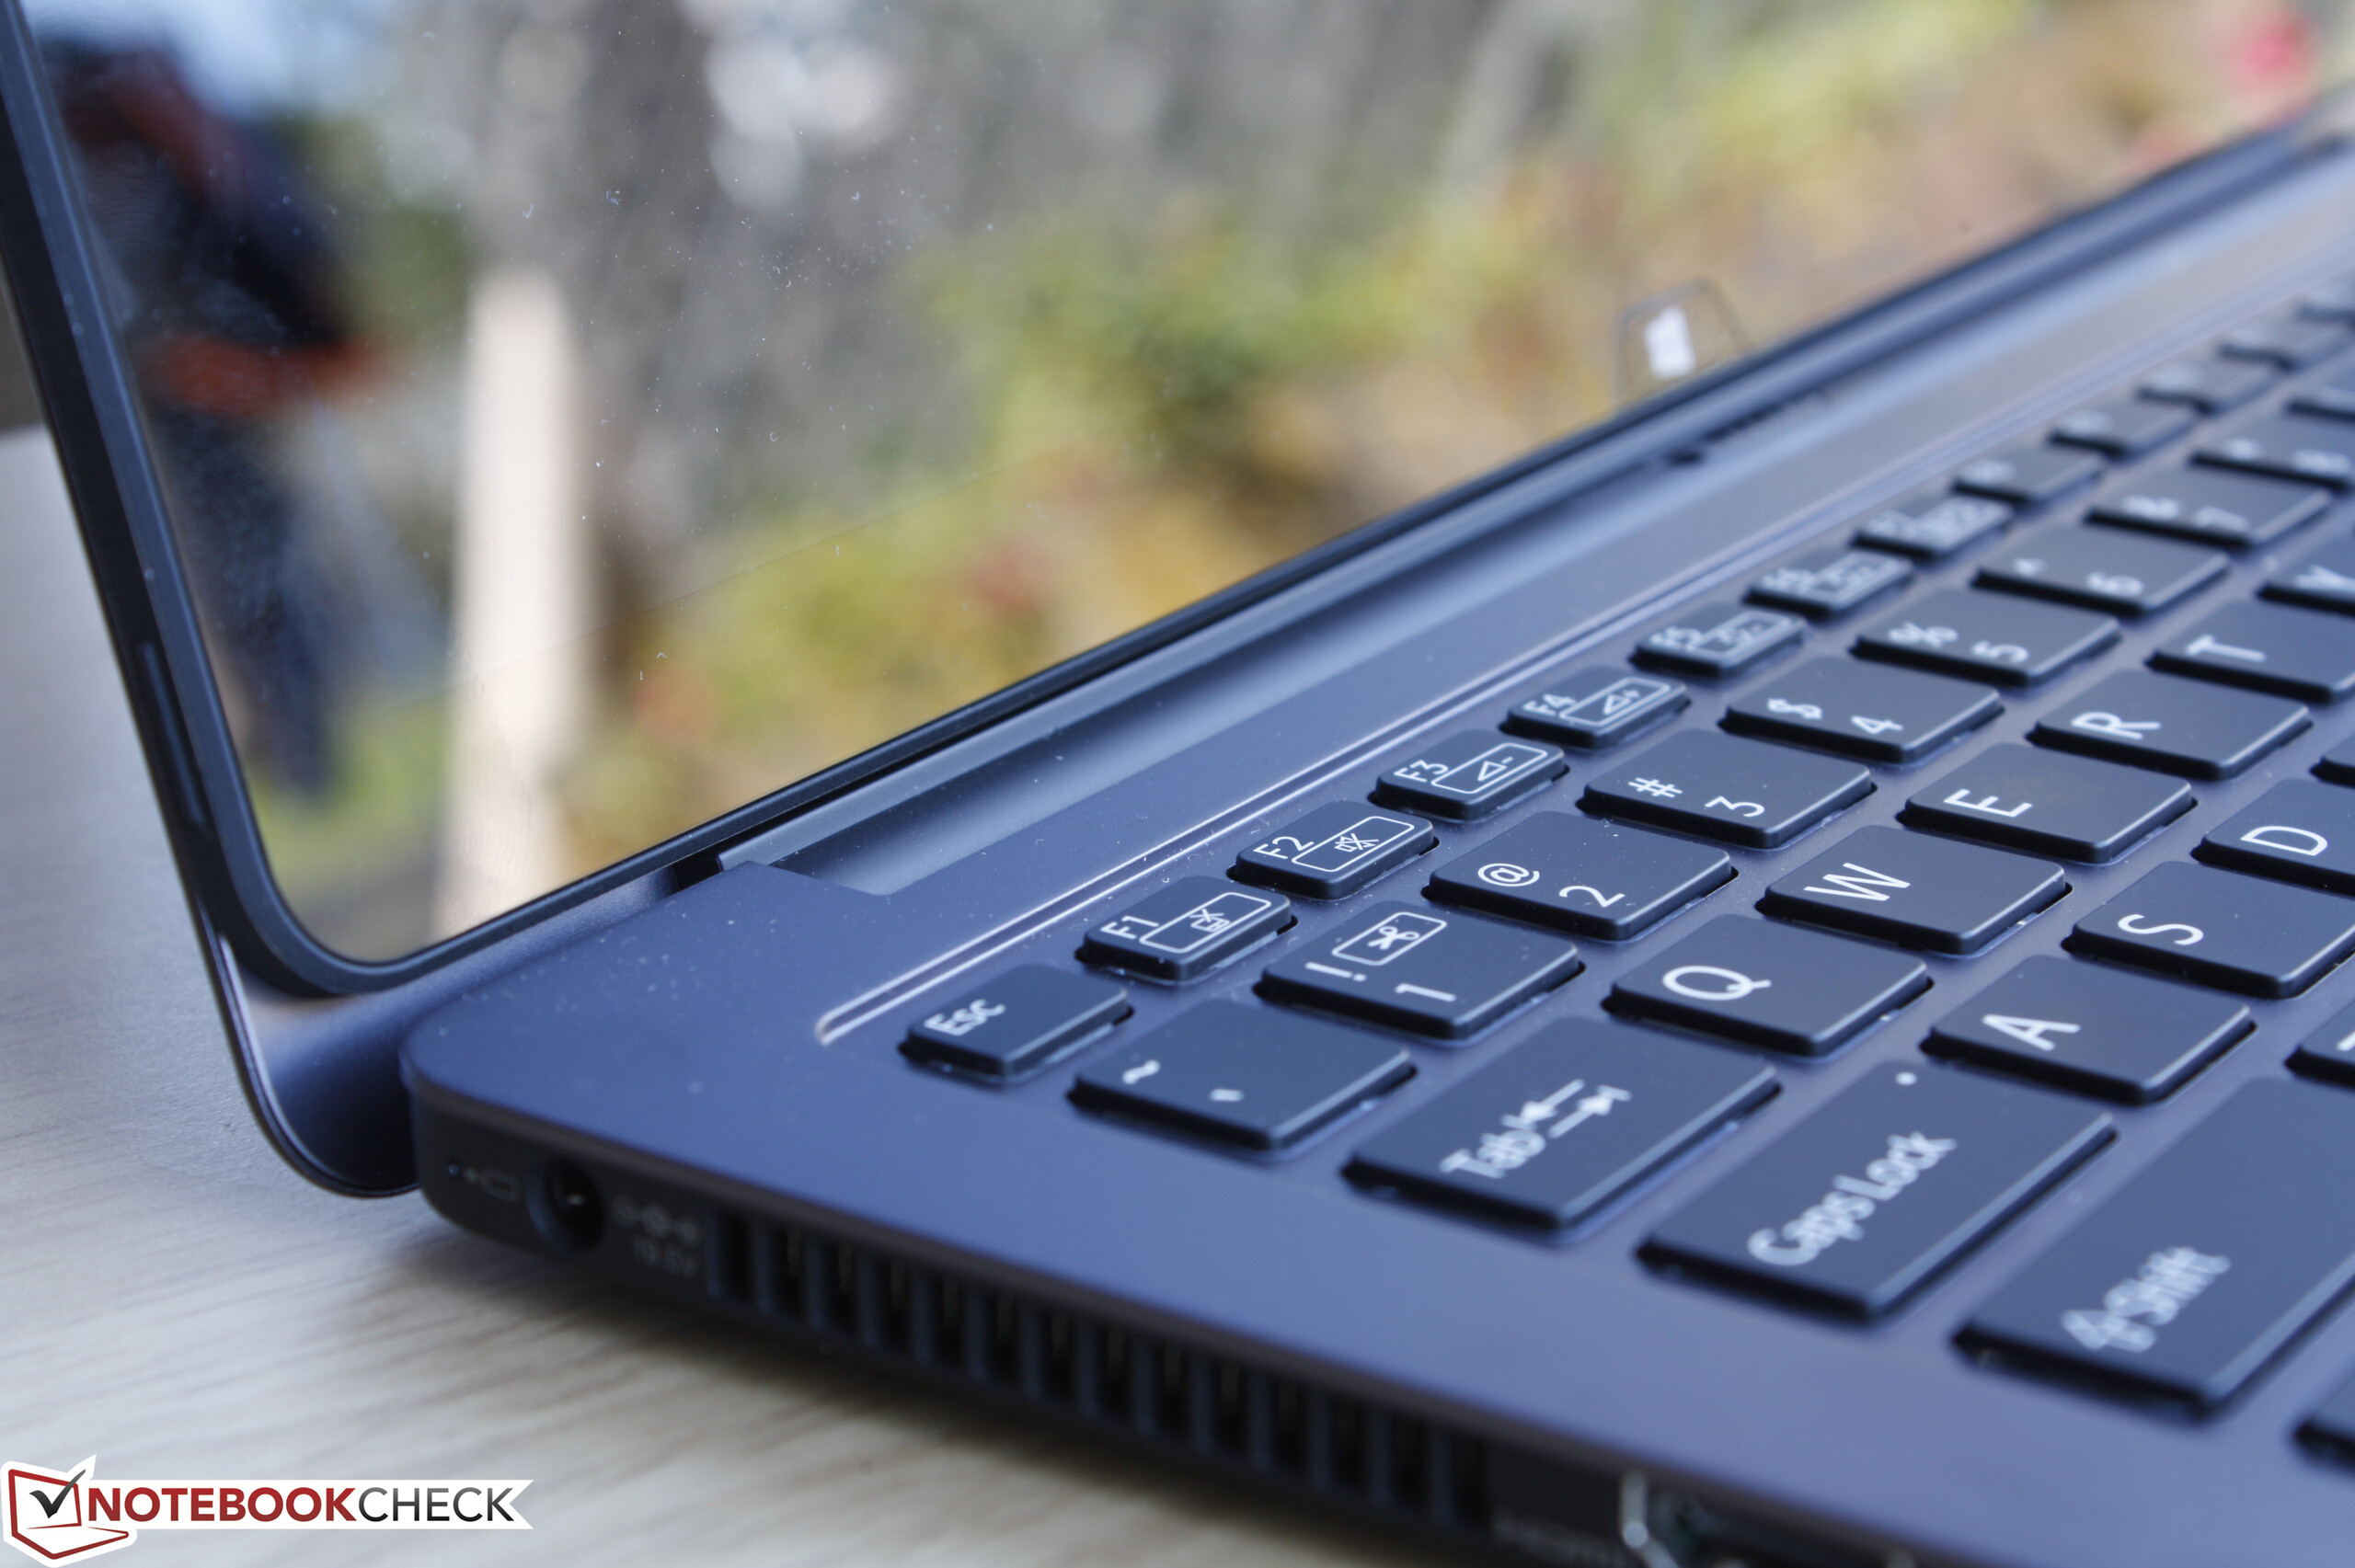
对于超级本和变形本来说我们的要求并不高。但是,如果一台13.3寸设备起售价达到了1800美元(约11635人民币),用户就需要一些额外的功能或特性来填补它和其他售价只有一半的同类产品的价差了。从这一点出发,Vaio Z Flip明显缺少USB-C,Thunderbolt,NFC,DDR4,WWAN和安全功能。一些位置的坚固性不足让它经典的材质和外观显得只是徒有其表。它较软的键盘按键,缺少内置手写笔存放位置,缺少平板模式下的旋转锁定按键也都很让人失望。
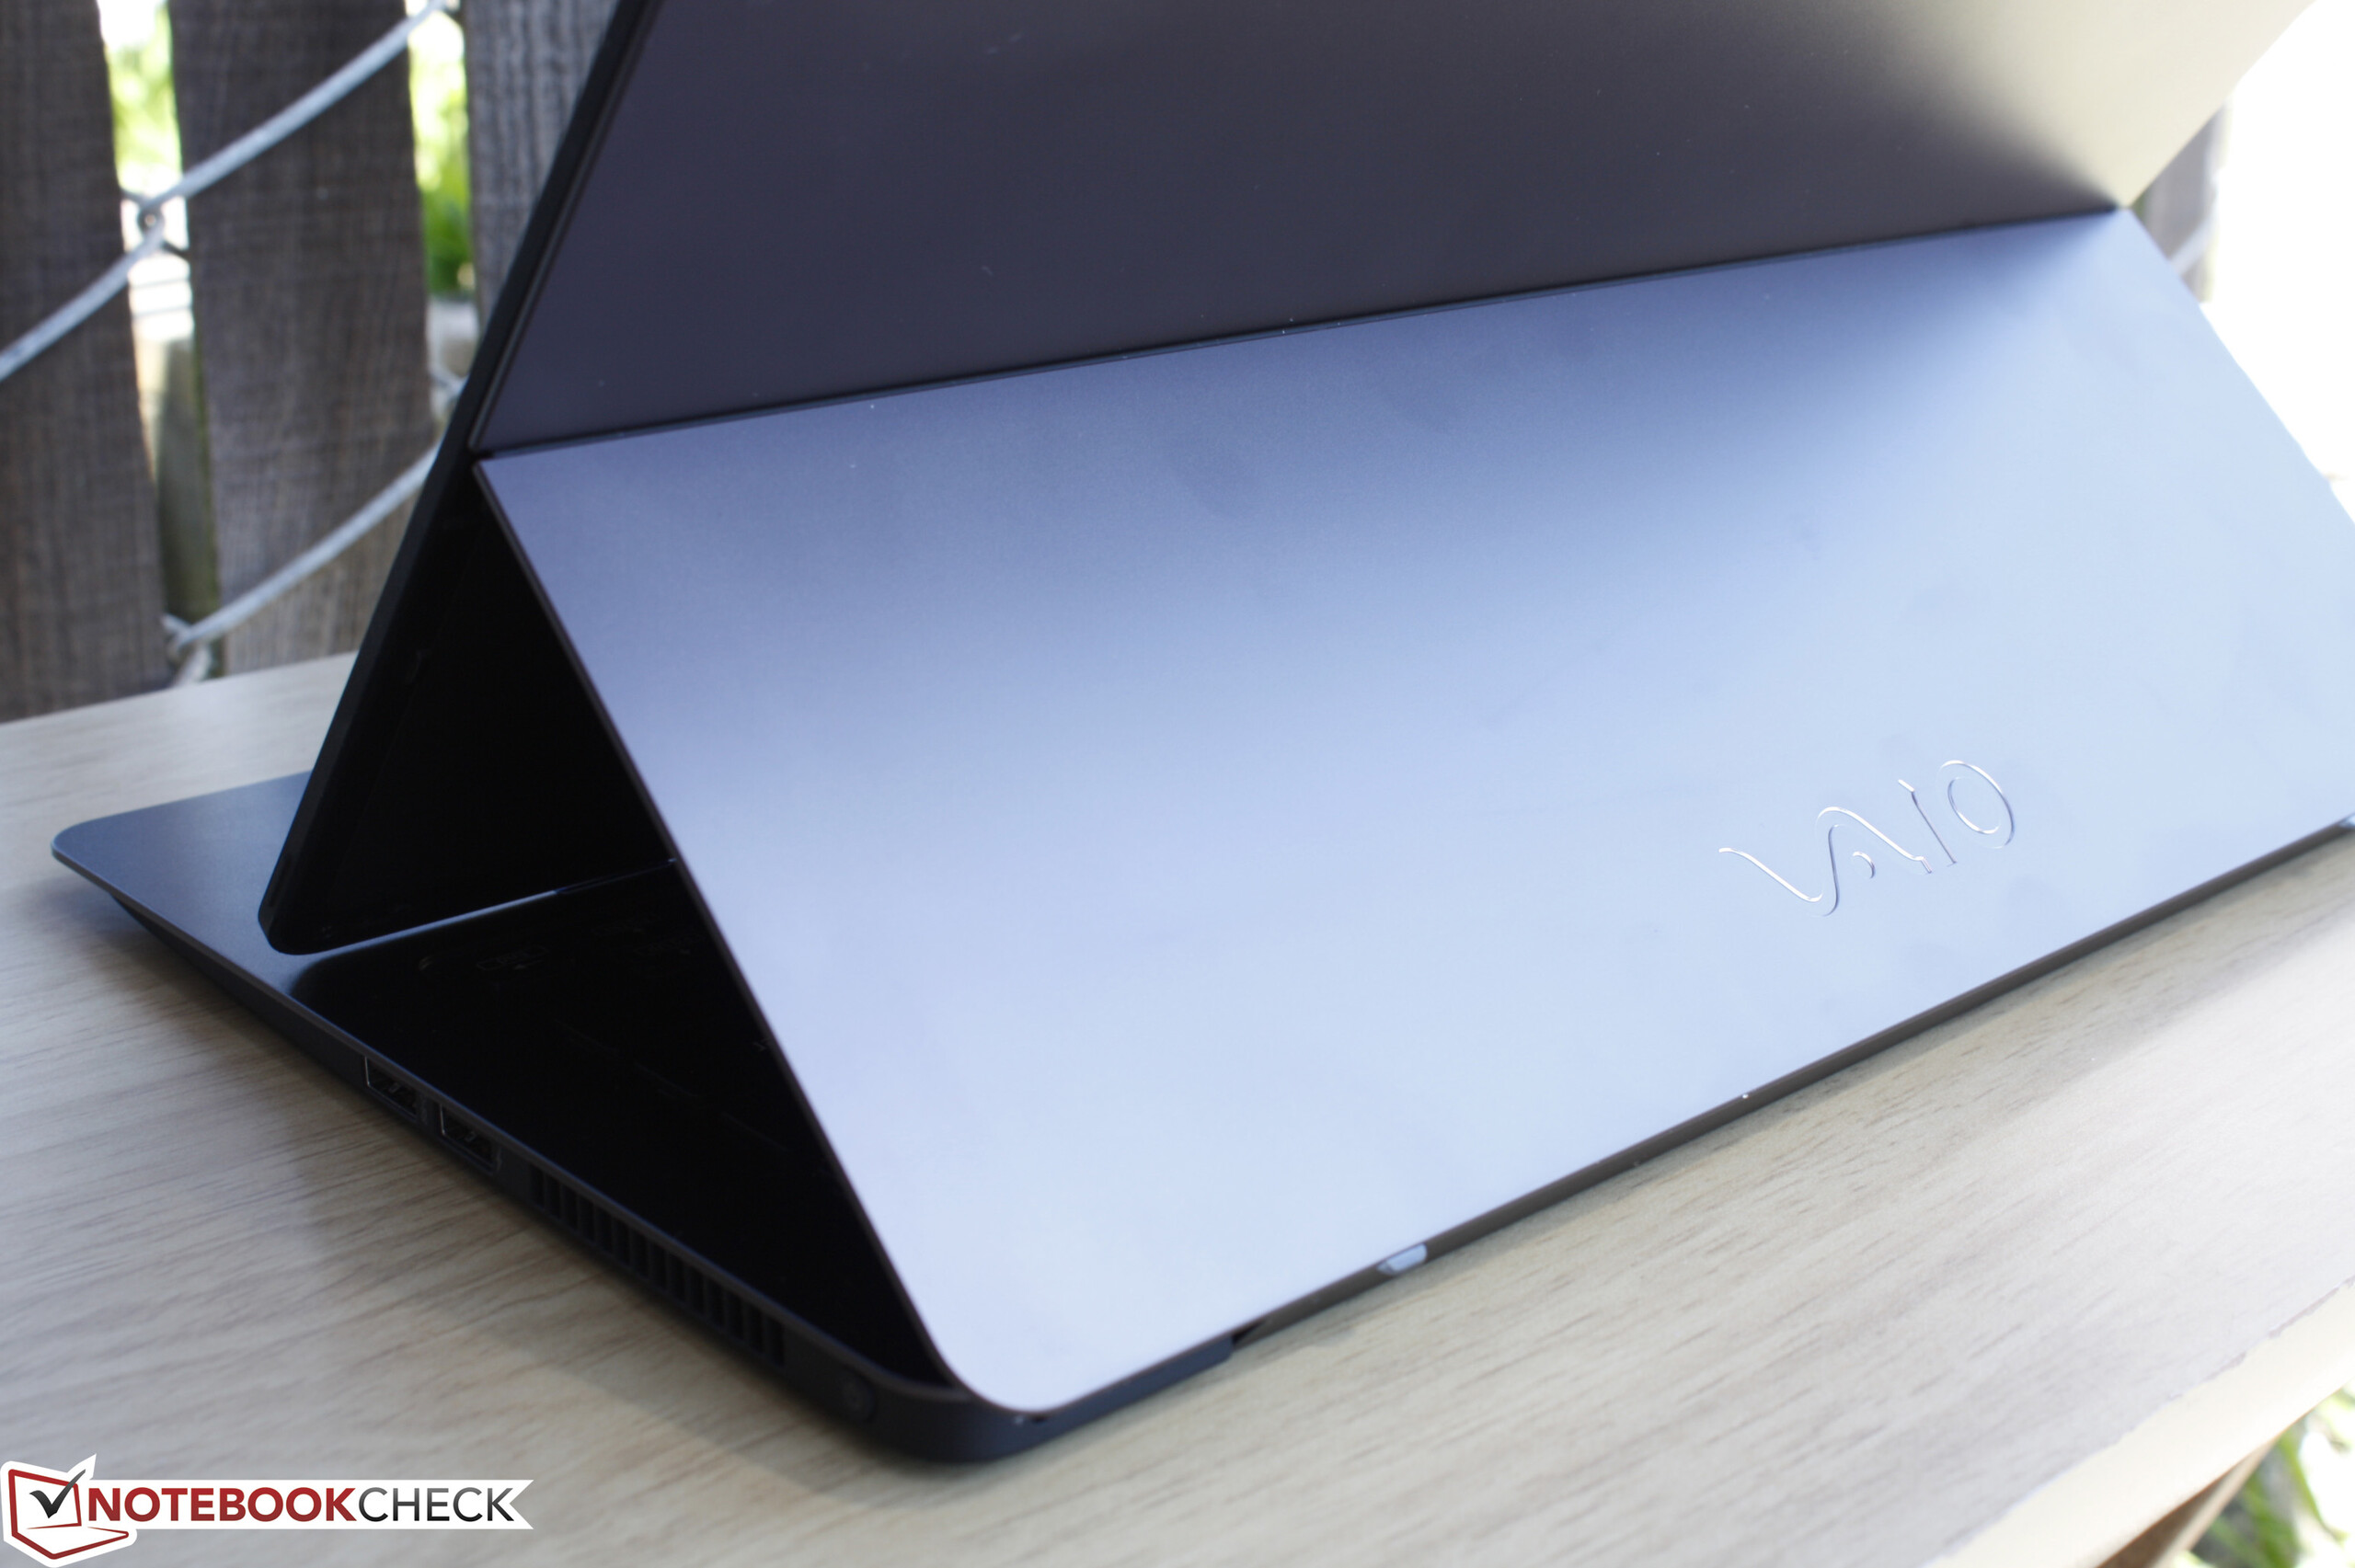
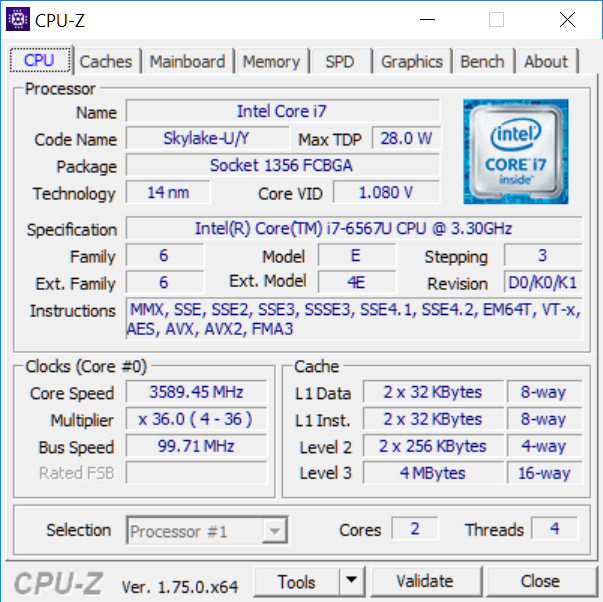
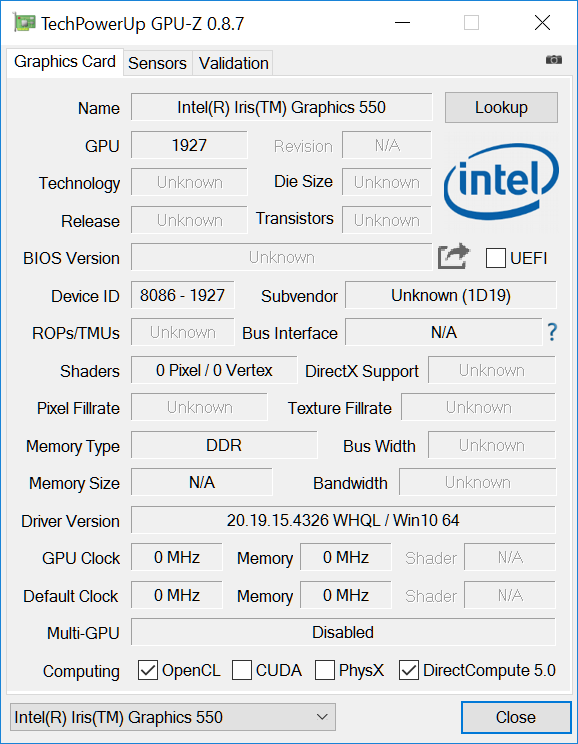
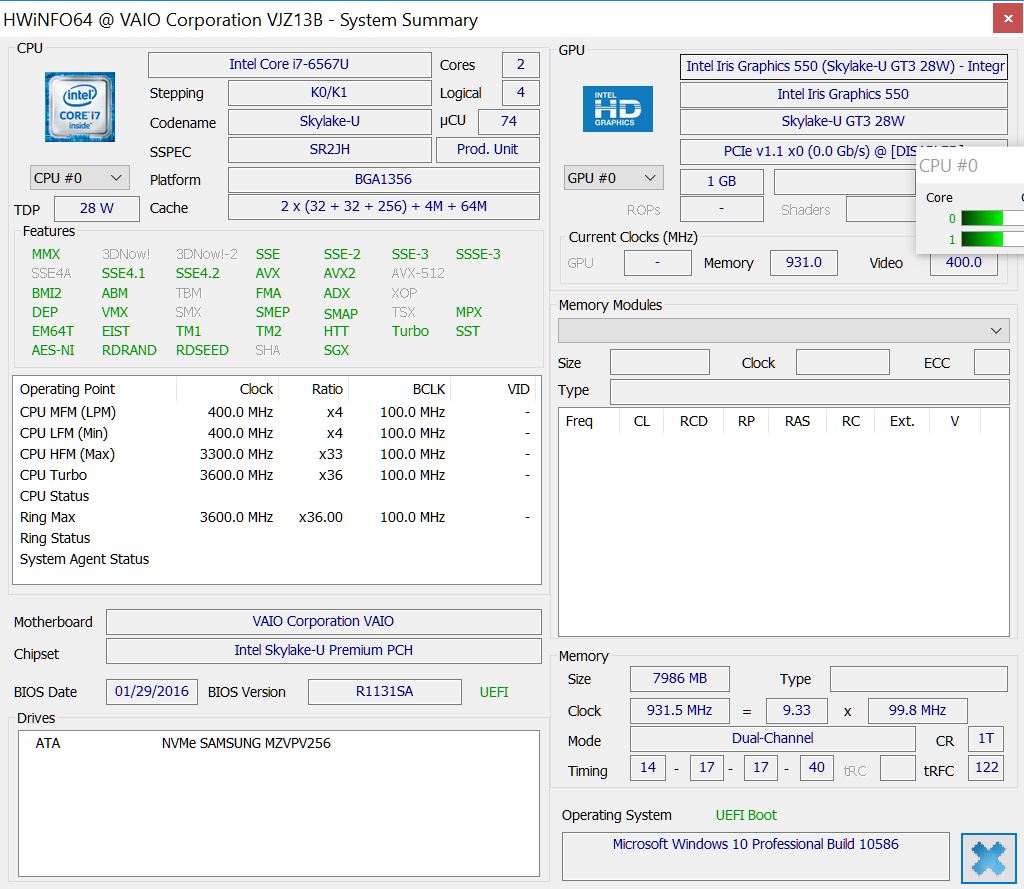
除了这些遗憾,Vaio Z Flip是一款设计合理的优秀变形本,在目前的竞争中不甘落后。它的明亮屏幕在色彩准确度方面尤其出色,属于同尺寸屏幕中的佼佼者。考虑到28瓦的热设计功率和优秀的电池续航时间,酷睿i7-6567U和集成Iris Graphics 550的性能都十分不错,但是在高负载下它的处理器核心温度和风扇噪音都相比其他变形本更高。
尽管Vaio Z Flip是一款强劲、独特又诱人,它更高的售价并没有带来更多的优势。如果用户有充足的预算,则可以享受Vaio旗舰机型的高性能、长电池续航、高品质屏幕和优雅外观。
注:本文是基于完整评测的缩减版本,阅读完整的英文评测,请点击这里
Sony Vaio Z Flip
- 04/18/2016 v5.1 (old)
Allen Ngo
Price comparison
