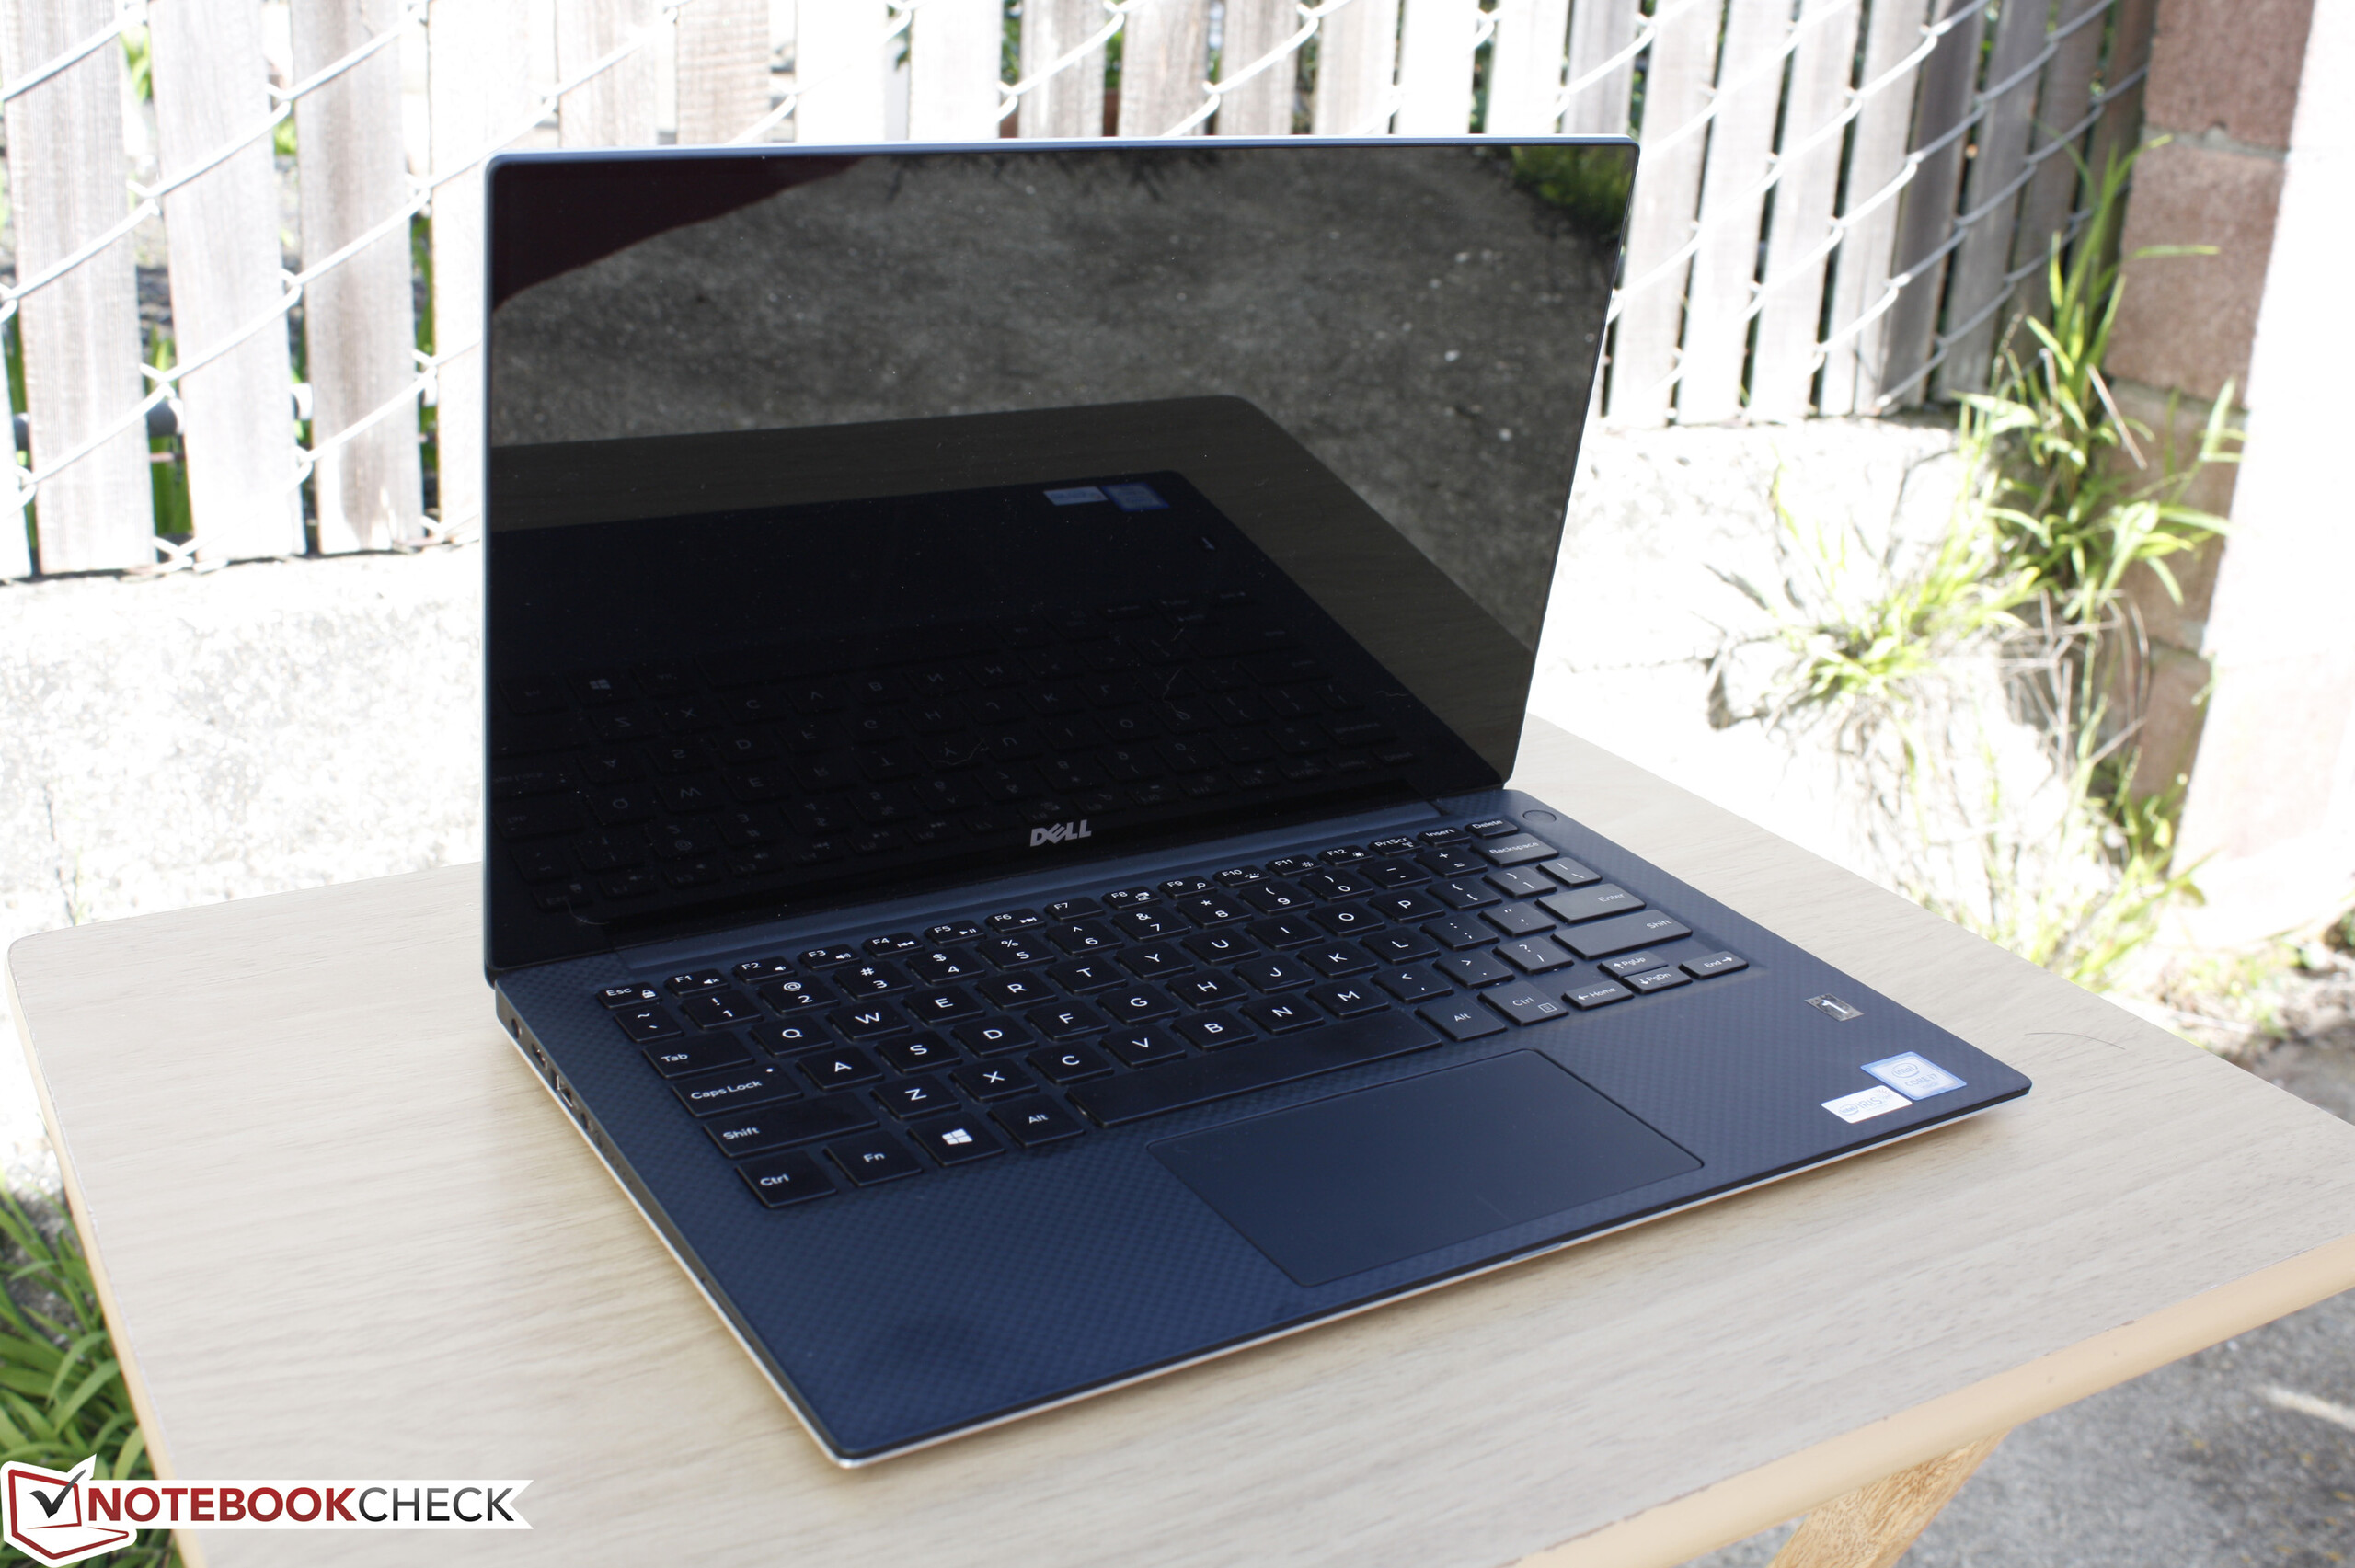
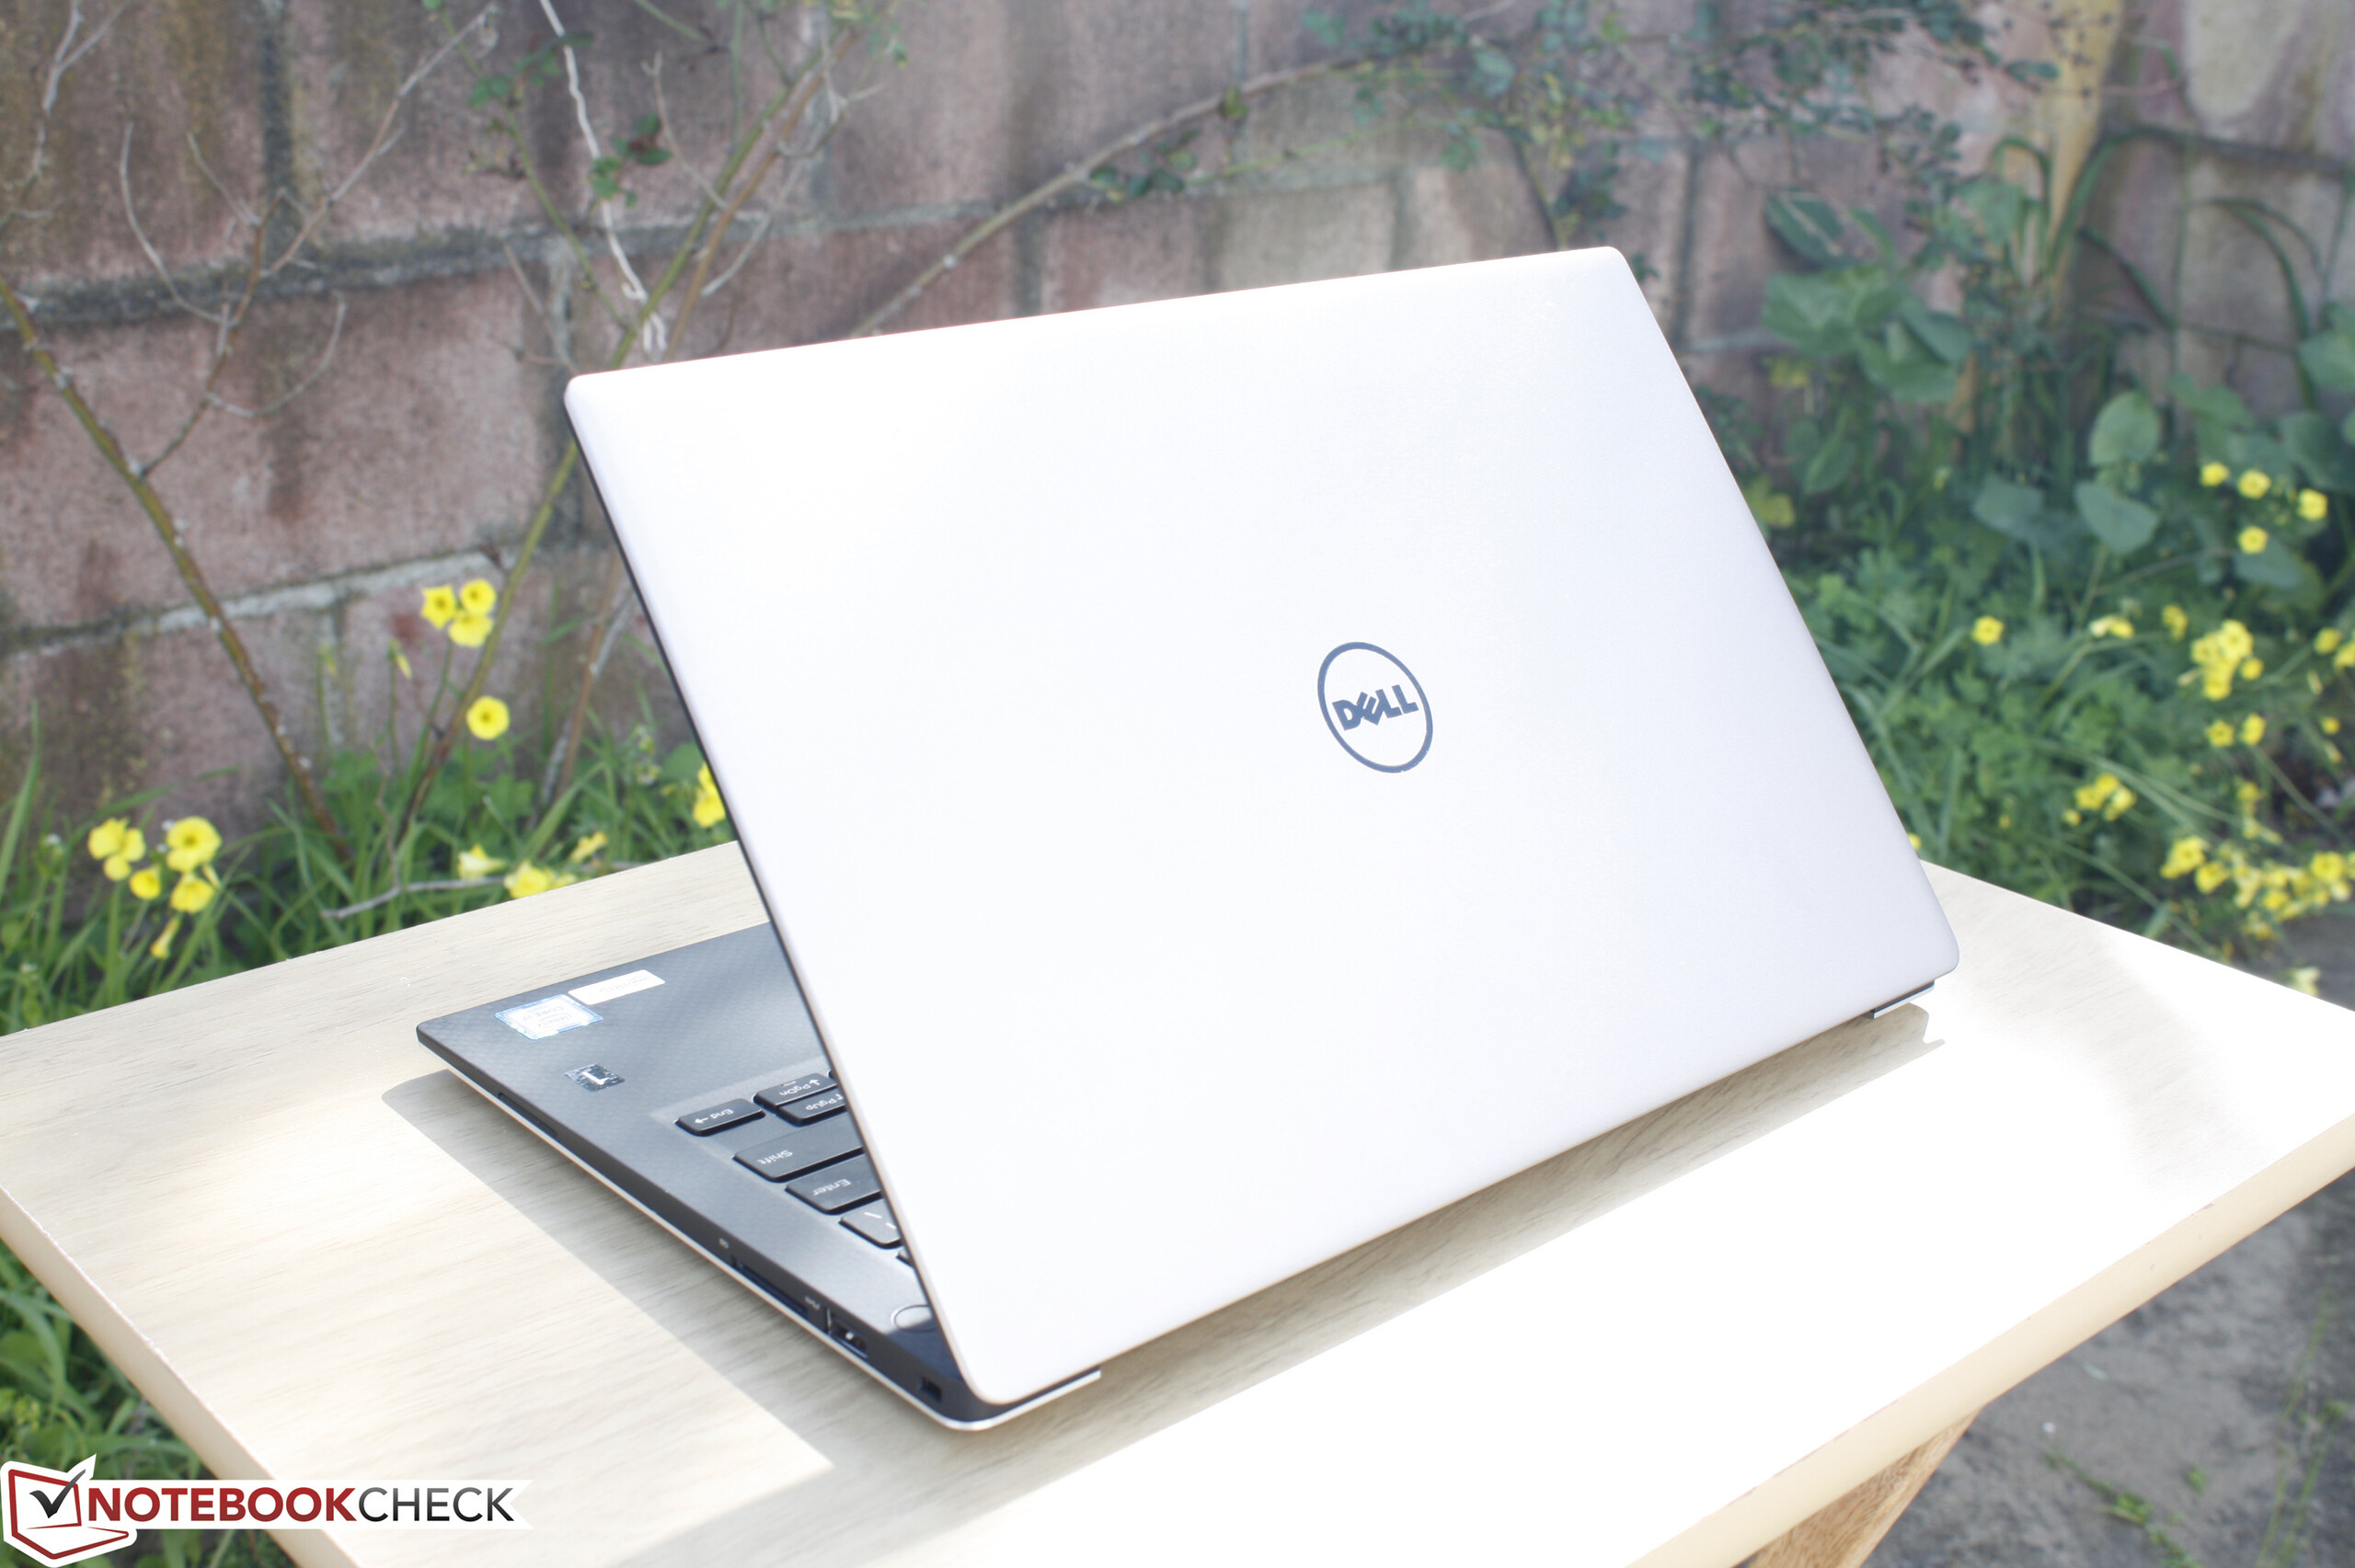
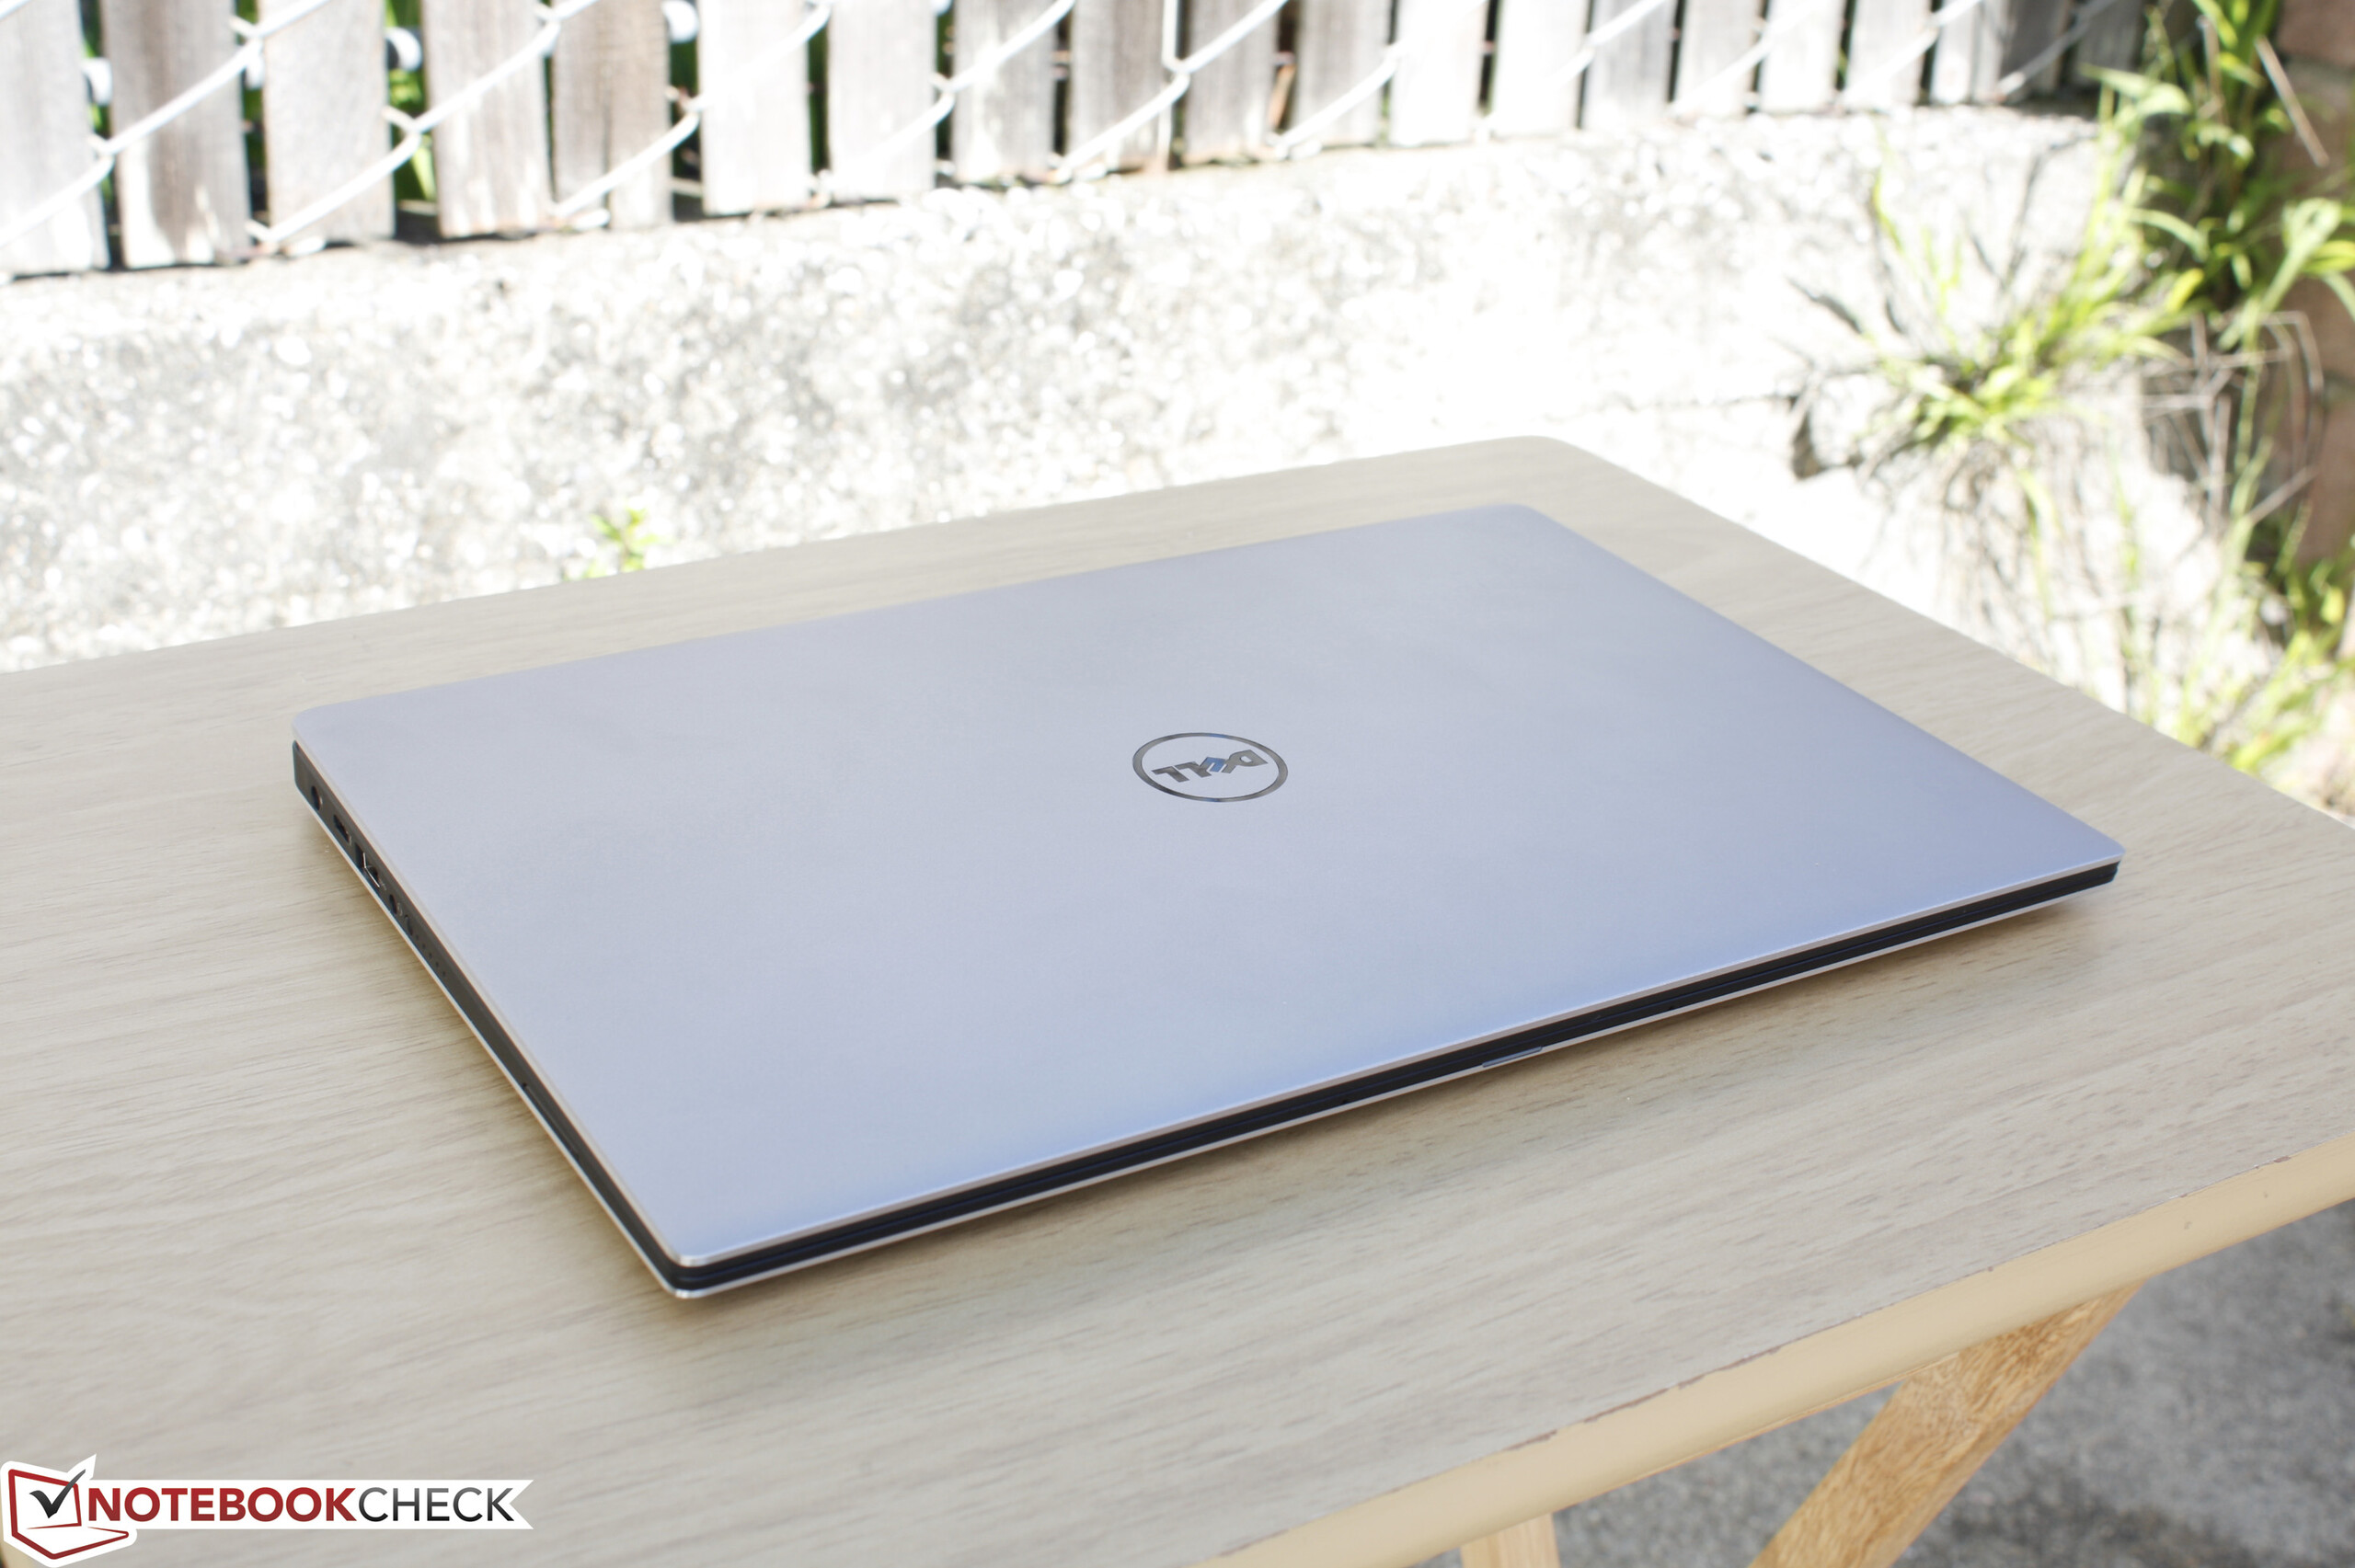
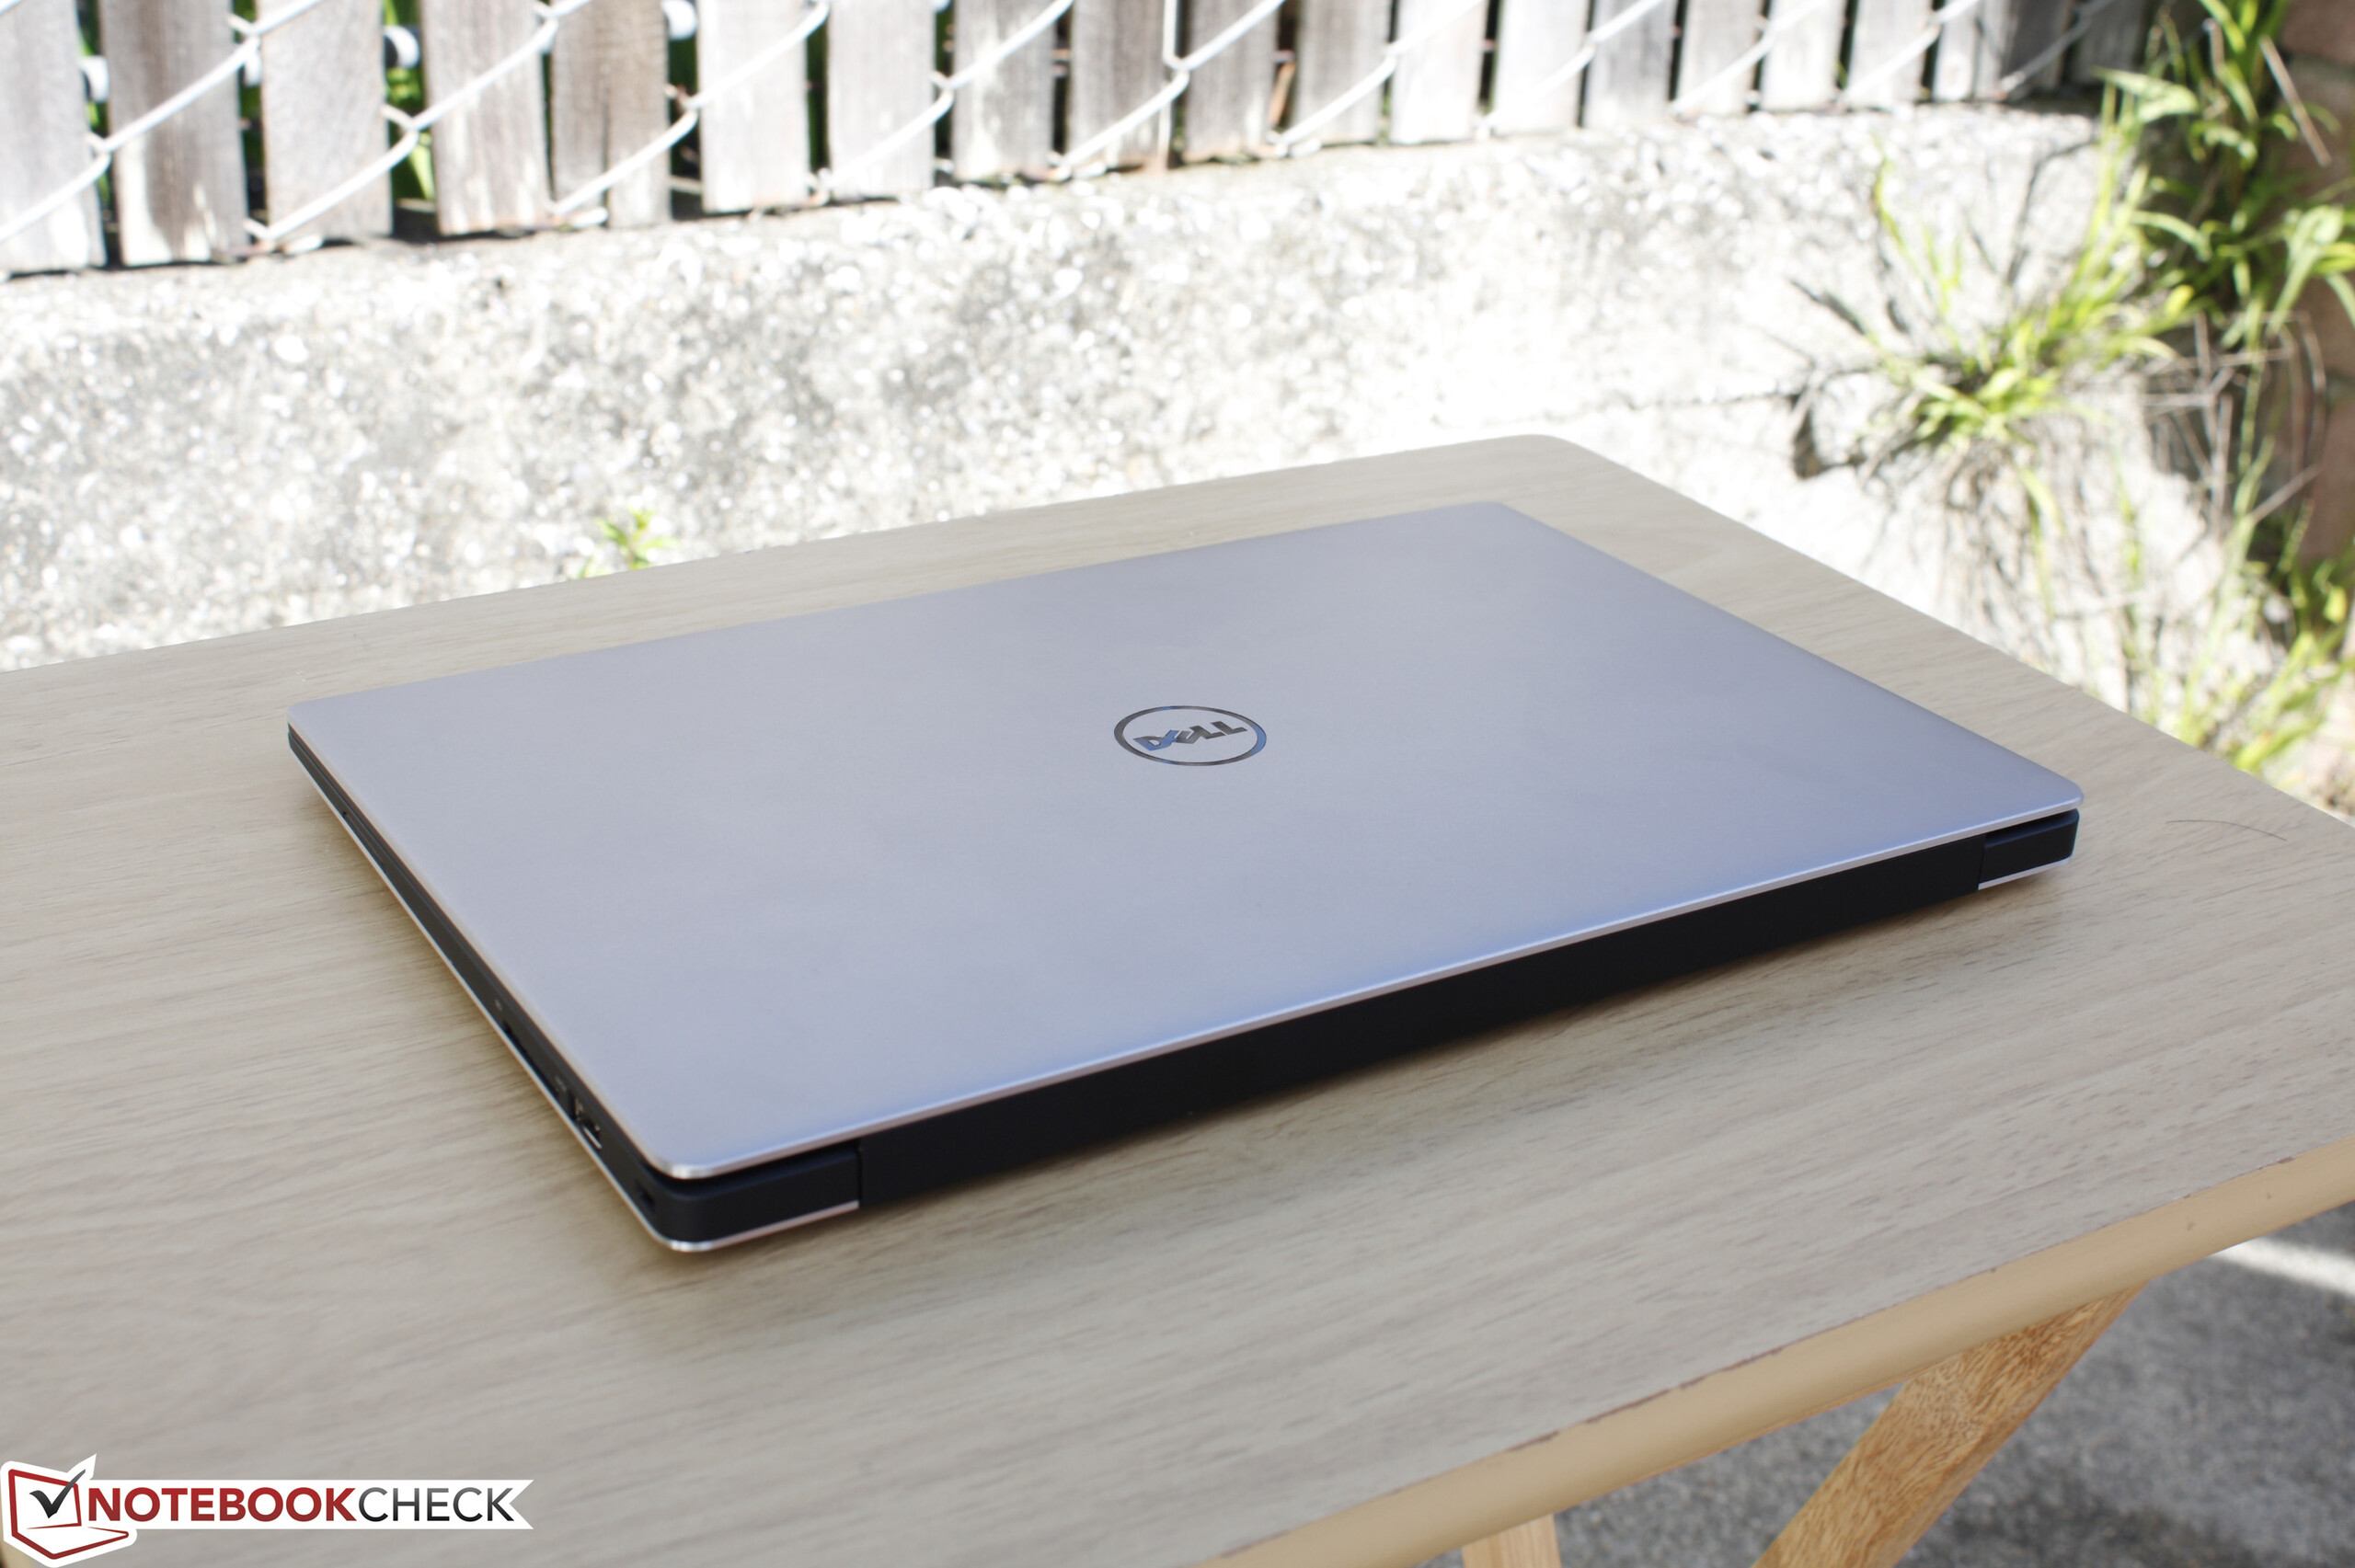
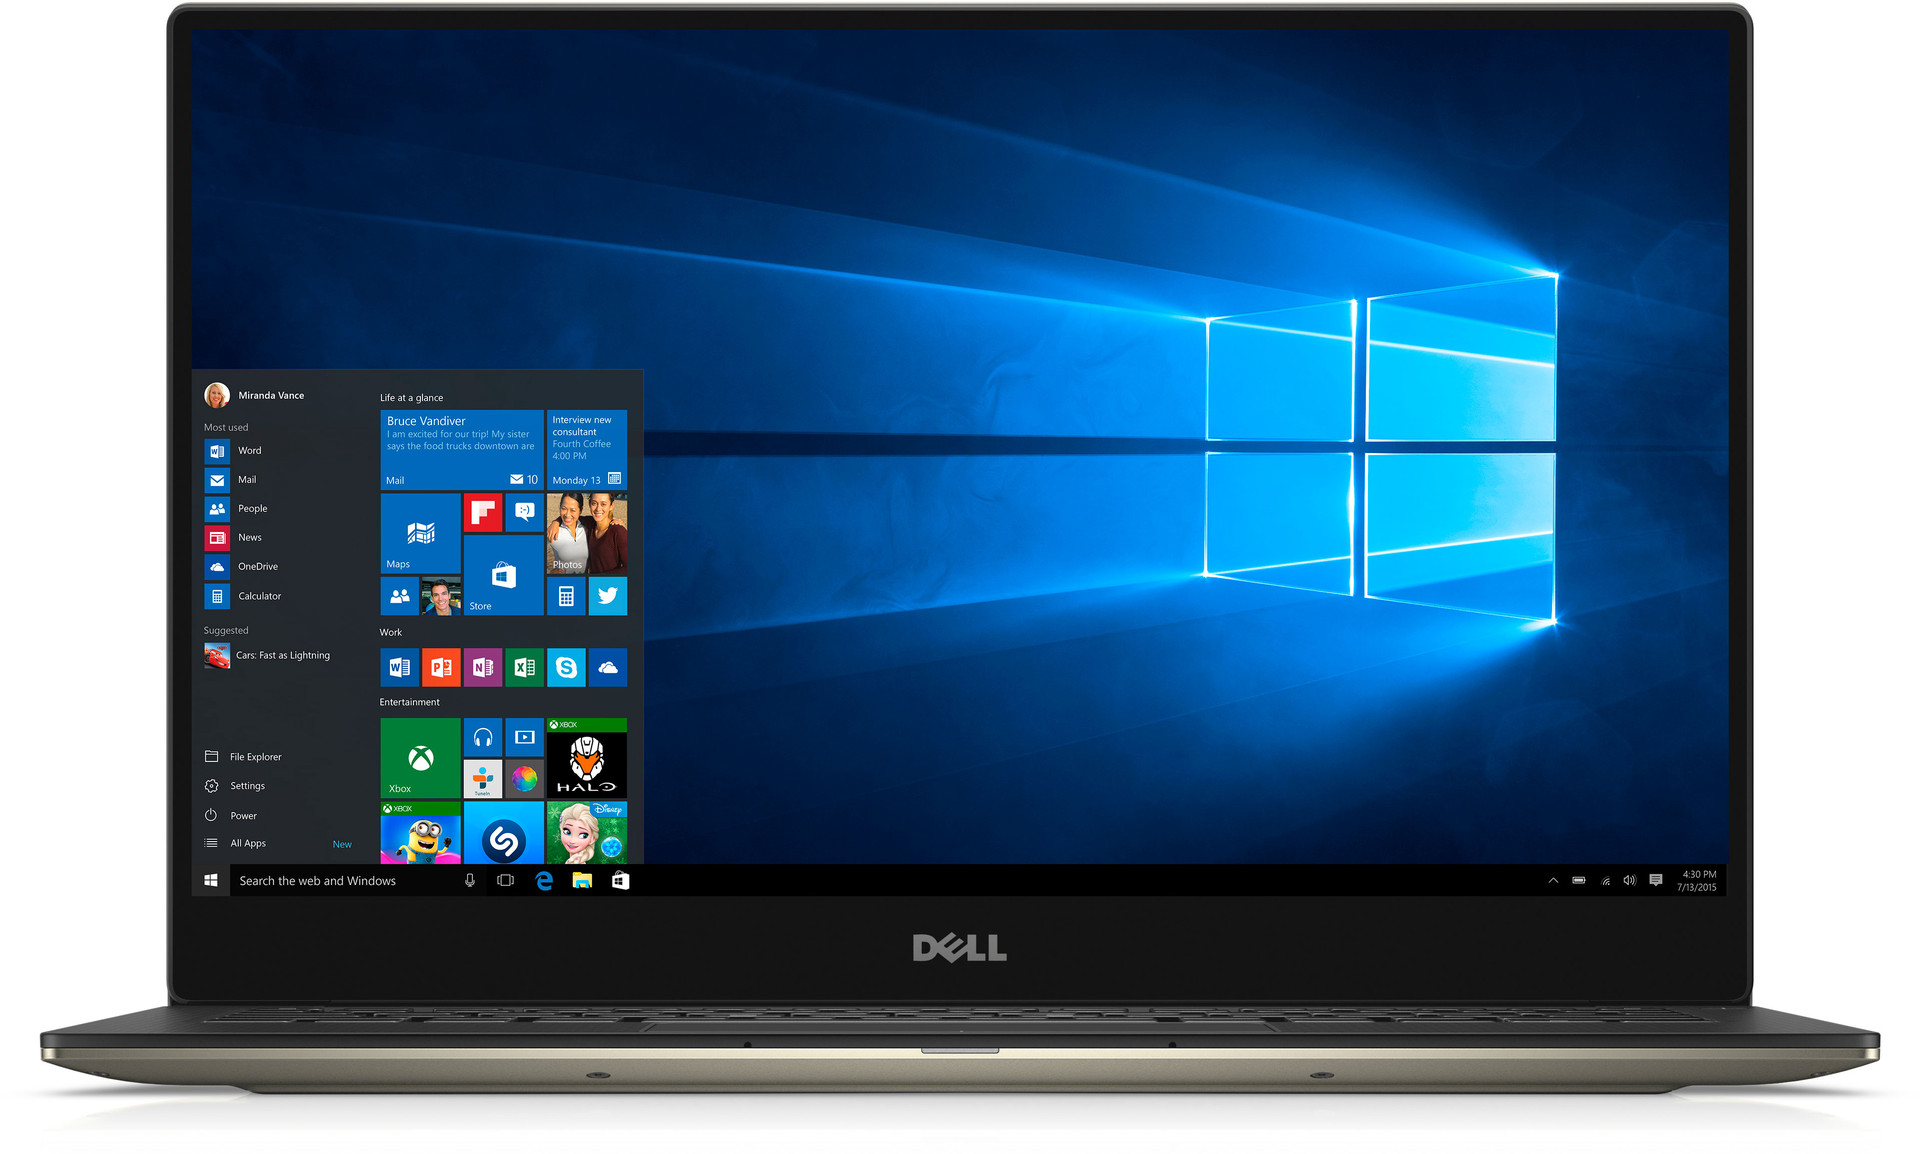
戴尔 XPS 13 9350 (i7-6560U, QHD+) 超极本简短评测
XPS 13 9350-4811 (XPS 13 Series)
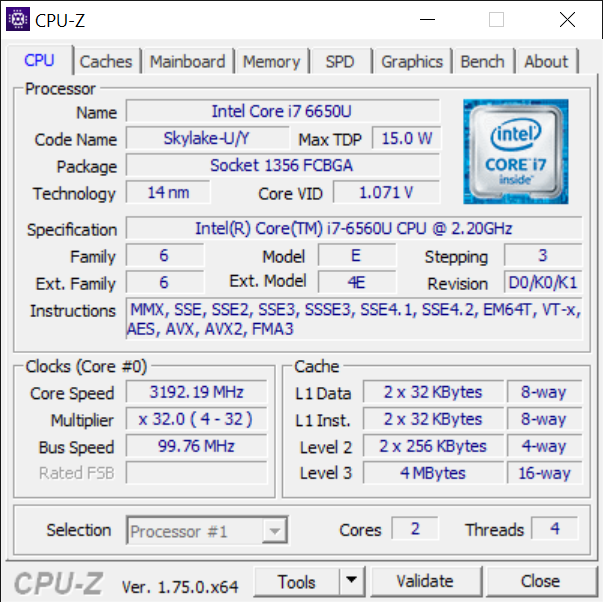
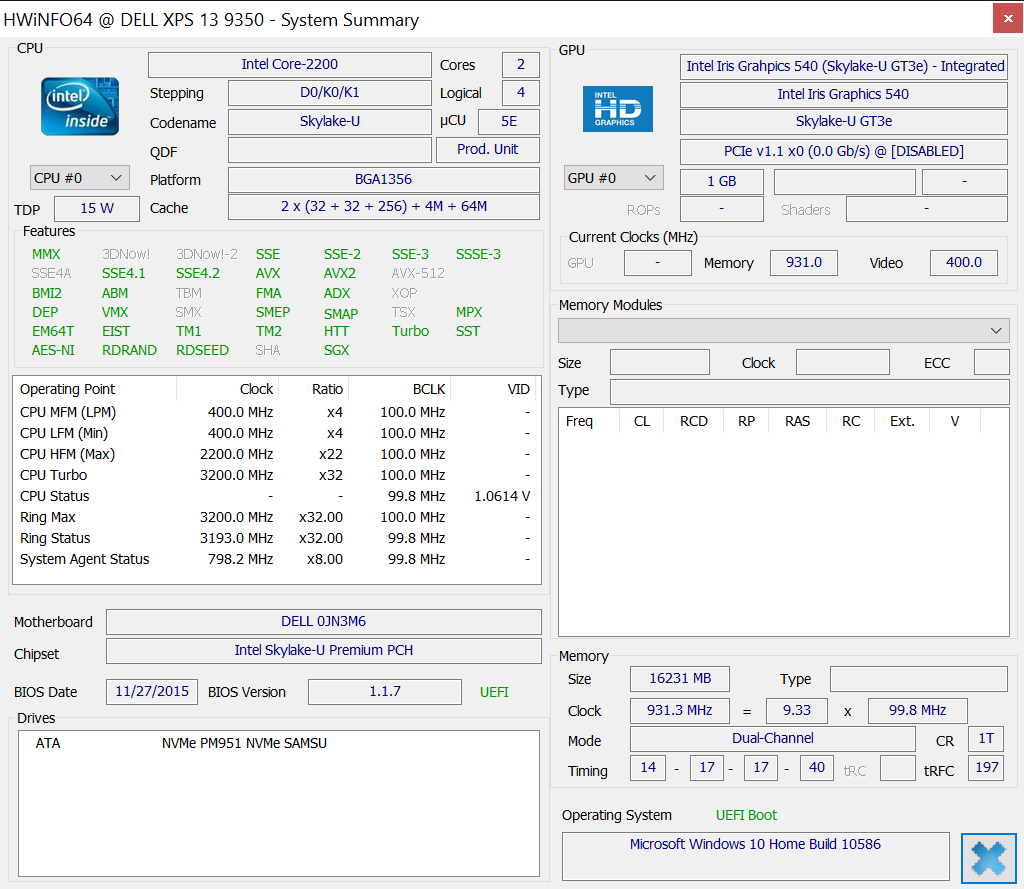
Processor
Intel Core i7-6560U 2c/4t 2 x 2.2 - 3.2 GHz, Skylake
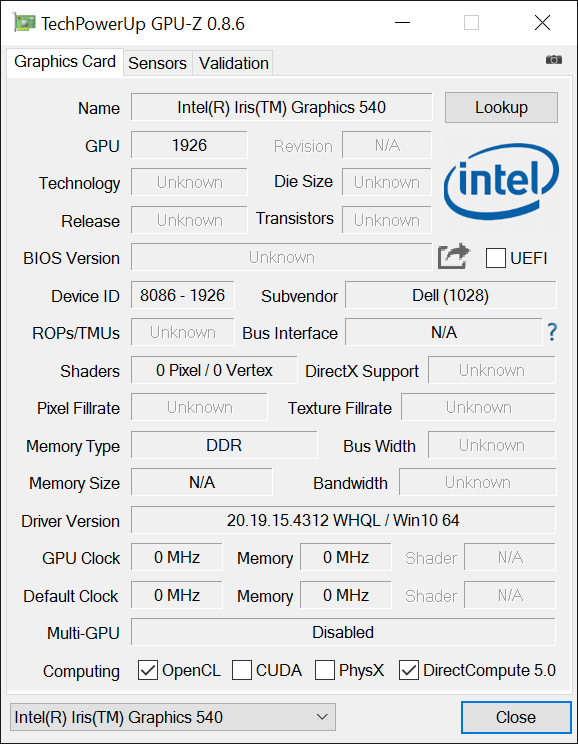
Graphics adapter
Intel Iris Graphics 540, 20.19.15.4312
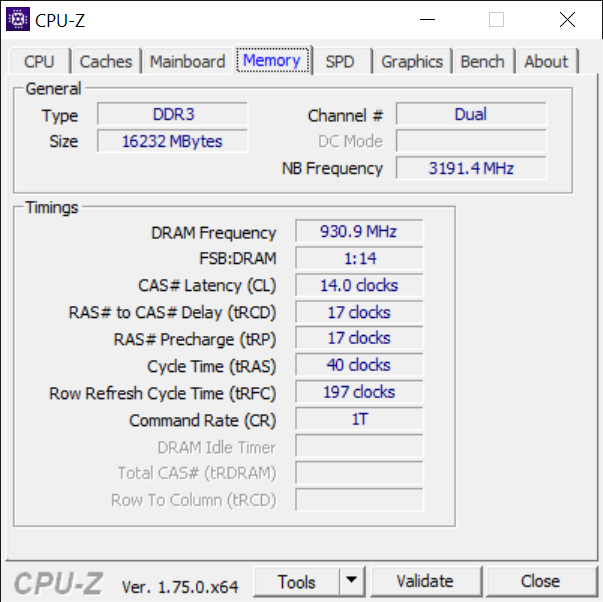
Memory
16 GB
, 930.8 MHz, 14-17-17-40, 双通道
Display
13.30 inch 16:9, 3200 x 1800 pixel, 电容式, IPS, 屏幕 ID: 夏普 SHP144A, 型号: Dell RXN49 LQ133Z1, glossy: yes
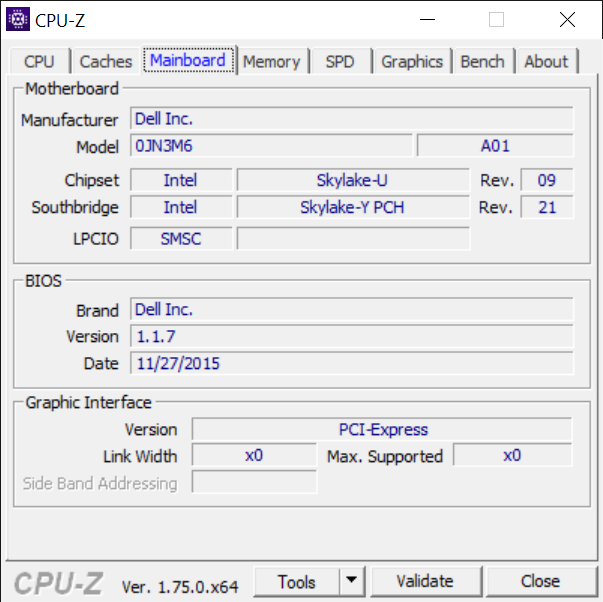
Mainboard
Intel Skylake-U Premium PCH
Storage
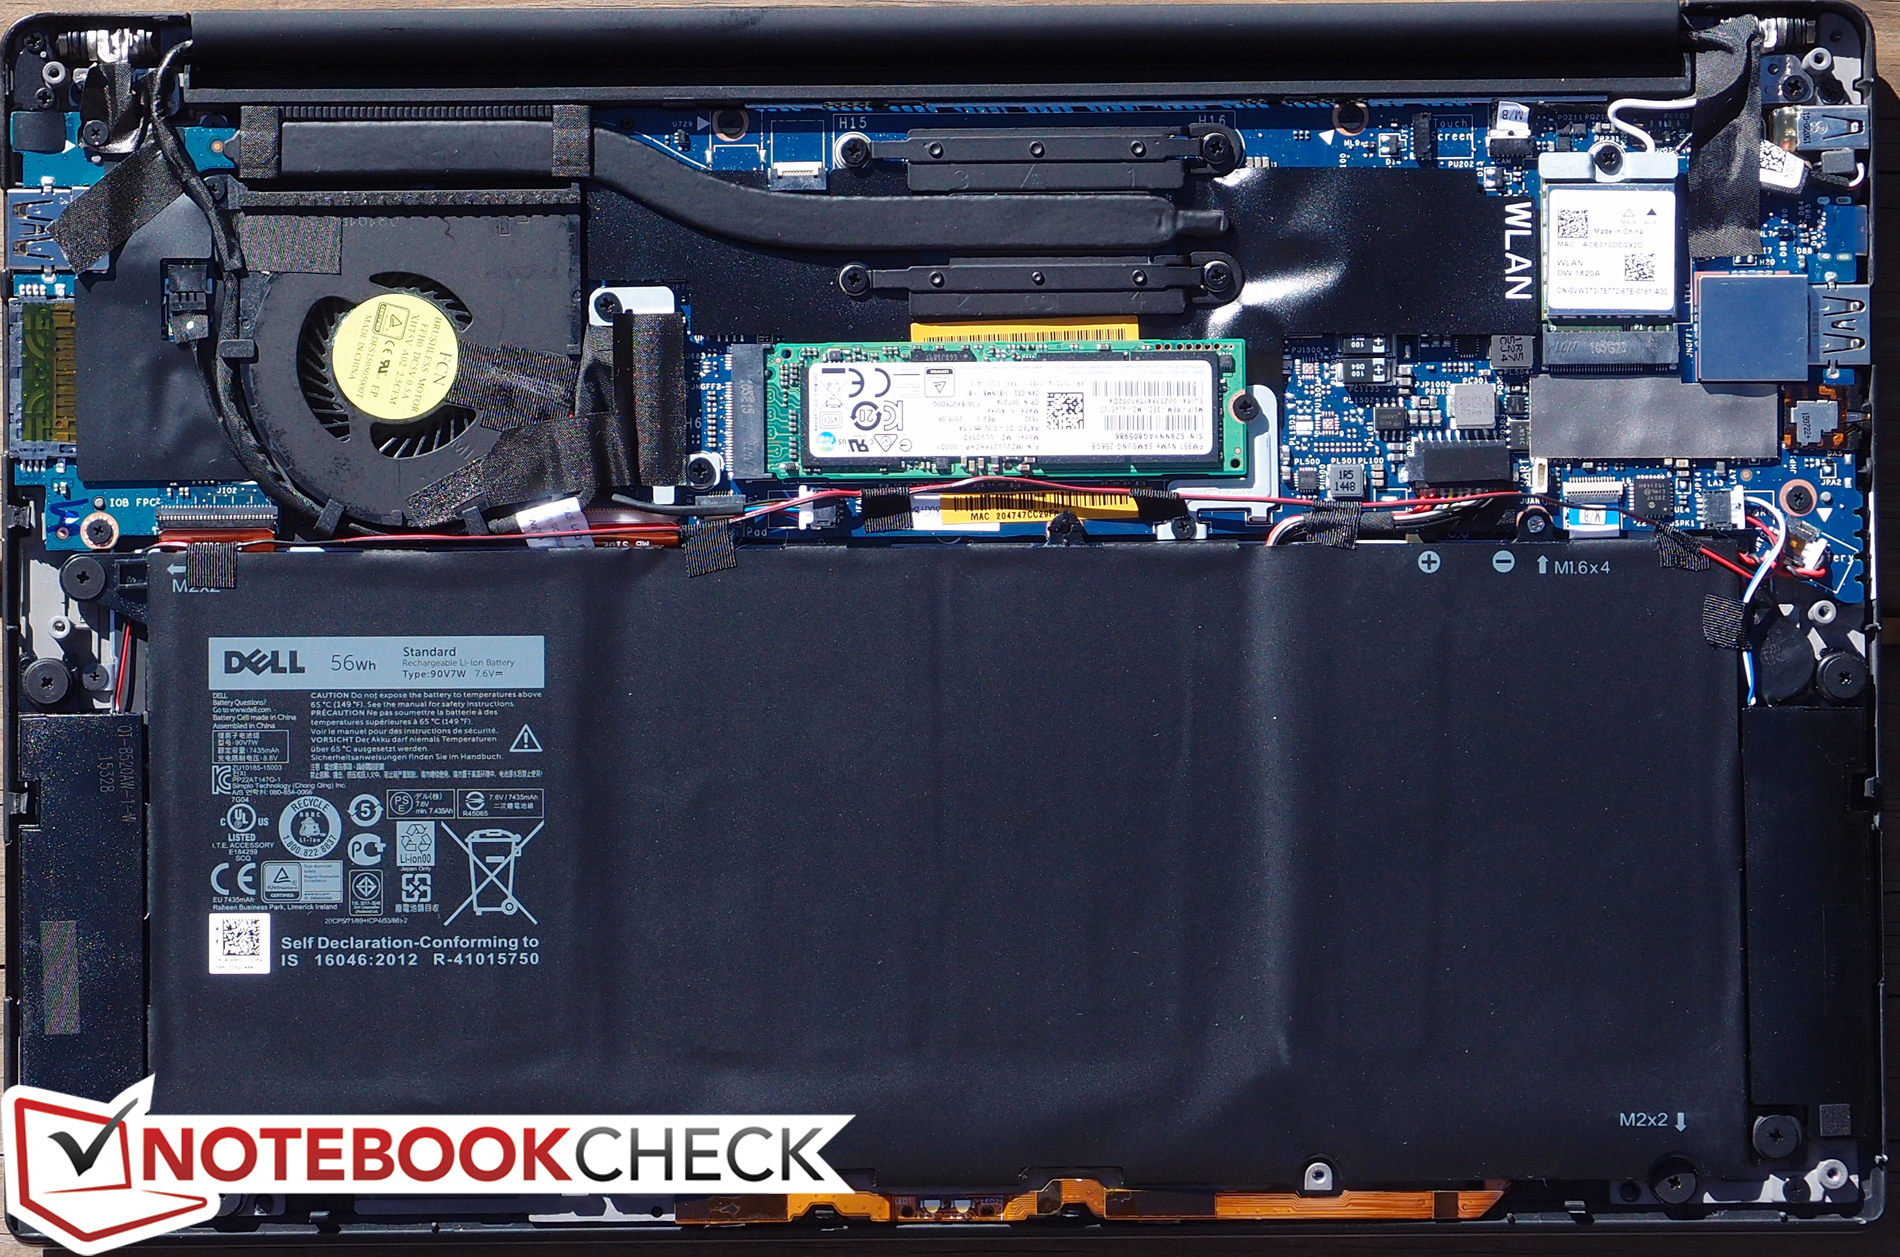
Samsung PM951 NVMe 512 GB, 512 GB
Weight
1.325 kg, Power Supply: 240 g
Price
1300 USD
Note: The manufacturer may use components from different suppliers including display panels, drives or memory sticks with similar specifications.
| |||||||||||||||||||||||||
tested with X-Rite i1Pro Basic 2
Maximum: 307.5 cd/m² (Nits) Average: 297.2 cd/m² Minimum: 13.5 cd/m²Brightness Distribution: 92 %
Center on Battery: 307.5 cd/m²
Contrast: 1486:1 (Black: 0.207 cd/m²)
ΔE ColorChecker Calman: 4.18 | ∀{0.5-29.43 Ø4.71}
ΔE Greyscale Calman: 4.94 | ∀{0.09-98 Ø4.96}
92% sRGB (Argyll 1.6.3 3D)
59% AdobeRGB 1998 (Argyll 1.6.3 3D)
65.4% AdobeRGB 1998 (Argyll 3D)
92.3% sRGB (Argyll 3D)
63.6% Display P3 (Argyll 3D)
Gamma: 2.31
CCT: 7645 K
| Dell XPS 13 9350 WQXGA 13.3", 3200x1800 | HP ProBook 430 G3 P5T00ES 13.3", 1366x768 | Asus Zenbook UX303UB-DH74T 13.3", 3200x1800 | Apple MacBook Air 13 inch 2015-03 13.3", 1440x900 | Lenovo Yoga 900-13ISK 80MK 13.3", 3200x1800 | HP Spectre x360 13-4104ng 13.3", 2560x1440 | |
|---|---|---|---|---|---|---|
| Display | -43% | -5% | -36% | -2% | 3% | |
| Display P3 Coverage (%) | 63.6 | 35.87 -44% | 60.9 -4% | 40.1 -37% | 63.2 -1% | 66.8 5% |
| sRGB Coverage (%) | 92.3 | 54 -41% | 85.4 -7% | 59.8 -35% | 88.7 -4% | 92.8 1% |
| AdobeRGB 1998 Coverage (%) | 65.4 | 37.06 -43% | 62.5 -4% | 41.51 -37% | 64.9 -1% | 67.3 3% |
| Response Times | -9% | -5% | 24% | 45% | ||
| Response Time Grey 50% / Grey 80% * (ms) | 50.8 ? | 54.4 ? -7% | 44.4 ? 13% | 38.8 ? 24% | 24 ? 53% | |
| Response Time Black / White * (ms) | 29.6 ? | 32.8 ? -11% | 36 ? -22% | 22.4 ? 24% | 19 ? 36% | |
| PWM Frequency (Hz) | 192 ? | 1389 | 1316 | |||
| Screen | -92% | -56% | -17% | -33% | -9% | |
| Brightness middle (cd/m²) | 307.5 | 212 -31% | 291.4 -5% | 329 7% | 319.8 4% | 324 5% |
| Brightness (cd/m²) | 297 | 205 -31% | 270 -9% | 310 4% | 302 2% | 324 9% |
| Brightness Distribution (%) | 92 | 90 -2% | 84 -9% | 82 -11% | 88 -4% | 90 -2% |
| Black Level * (cd/m²) | 0.207 | 0.71 -243% | 0.954 -361% | 0.405 -96% | 0.835 -303% | 0.34 -64% |
| Contrast (:1) | 1486 | 299 -80% | 305 -79% | 812 -45% | 383 -74% | 953 -36% |
| Colorchecker dE 2000 * | 4.18 | 12.06 -189% | 4.63 -11% | 3.96 5% | 2.68 36% | 4.36 -4% |
| Colorchecker dE 2000 max. * | 7.84 | 7.51 4% | ||||
| Greyscale dE 2000 * | 4.94 | 13.41 -171% | 5.65 -14% | 3.51 29% | 2.35 52% | 4.62 6% |
| Gamma | 2.31 95% | 2.41 91% | 2.16 102% | 3.83 57% | 2.09 105% | 2.18 101% |
| CCT | 7645 85% | 15382 42% | 6320 103% | 6711 97% | 6975 93% | 6857 95% |
| Color Space (Percent of AdobeRGB 1998) (%) | 59 | 34.3 -42% | 55.2 -6% | 38.4 -35% | 57 -3% | 60 2% |
| Color Space (Percent of sRGB) (%) | 92 | 54.2 -41% | 85.2 -7% | 59.8 -35% | 88 -4% | 93 1% |
| Total Average (Program / Settings) | -48% /
-70% | -22% /
-38% | -27% /
-22% | -4% /
-18% | 13% /
1% |
* ... smaller is better
Display Response Times
ℹ
Display response times show how fast the screen is able to change from one color to the next. Slow response times can lead to afterimages and can cause moving objects to appear blurry (ghosting). Gamers of fast-paced 3D titles should pay special attention to fast response times.| ↔ Response Time Black to White | ||
|---|---|---|
| 29.6 ms ... rise ↗ and fall ↘ combined | ↗ 6 ms rise | 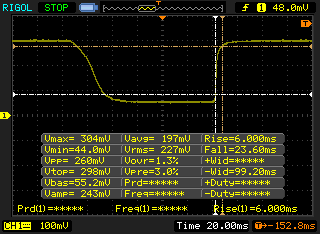 |
| ↘ 23.6 ms fall | ||
| The screen shows relatively slow response rates in our tests and may be too slow for gamers. In comparison, all tested devices range from 0.1 (minimum) to 240 (maximum) ms. » 79 % of all devices are better. This means that the measured response time is worse than the average of all tested devices (19.8 ms). | ||
| ↔ Response Time 50% Grey to 80% Grey | ||
| 50.8 ms ... rise ↗ and fall ↘ combined | ↗ 18.4 ms rise | 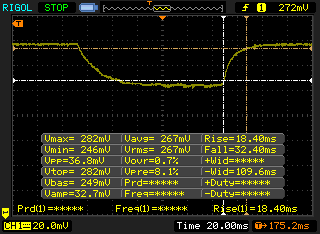 |
| ↘ 32.4 ms fall | ||
| The screen shows slow response rates in our tests and will be unsatisfactory for gamers. In comparison, all tested devices range from 0.165 (minimum) to 636 (maximum) ms. » 87 % of all devices are better. This means that the measured response time is worse than the average of all tested devices (31 ms). | ||
Screen Flickering / PWM (Pulse-Width Modulation)
ℹ
To dim the screen, some notebooks will simply cycle the backlight on and off in rapid succession - a method called Pulse Width Modulation (PWM) . This cycling frequency should ideally be undetectable to the human eye. If said frequency is too low, users with sensitive eyes may experience strain or headaches or even notice the flickering altogether.| Screen flickering / PWM not detected | 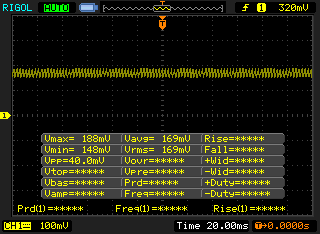 | ||
In comparison: 52 % of all tested devices do not use PWM to dim the display. If PWM was detected, an average of 7754 (minimum: 5 - maximum: 343500) Hz was measured. | |||
| Cinebench R15 | |
| CPU Single 64Bit (sort by value) | |
| Dell XPS 13 9350 WQXGA | |
| Eurocom Shark 4 | |
| Microsoft Surface Pro 4 Core i7 | |
| Asus Zenbook UX303UB-DH74T | |
| Microsoft Surface Book Core i5 | |
| Lenovo ThinkPad T560-20FH001FGE | |
| CPU Multi 64Bit (sort by value) | |
| Dell XPS 13 9350 WQXGA | |
| Eurocom Shark 4 | |
| Microsoft Surface Pro 4 Core i7 | |
| Asus Zenbook UX303UB-DH74T | |
| Microsoft Surface Book Core i5 | |
| Lenovo ThinkPad T560-20FH001FGE | |
| Cinebench R11.5 | |
| CPU Single 64Bit (sort by value) | |
| Dell XPS 13 9350 WQXGA | |
| Eurocom Shark 4 | |
| Microsoft Surface Pro 4 Core i7 | |
| Asus Zenbook UX303UB-DH74T | |
| Microsoft Surface Book Core i5 | |
| Lenovo ThinkPad T560-20FH001FGE | |
| CPU Multi 64Bit (sort by value) | |
| Dell XPS 13 9350 WQXGA | |
| Eurocom Shark 4 | |
| Microsoft Surface Pro 4 Core i7 | |
| Asus Zenbook UX303UB-DH74T | |
| Microsoft Surface Book Core i5 | |
| Lenovo ThinkPad T560-20FH001FGE | |
| Cinebench R10 | |
| Rendering Single CPUs 64Bit (sort by value) | |
| Eurocom Shark 4 | |
| Microsoft Surface Pro 4 Core i7 | |
| Microsoft Surface Book Core i5 | |
| Lenovo ThinkPad T560-20FH001FGE | |
| Rendering Multiple CPUs 64Bit (sort by value) | |
| Eurocom Shark 4 | |
| Microsoft Surface Pro 4 Core i7 | |
| Microsoft Surface Book Core i5 | |
| Lenovo ThinkPad T560-20FH001FGE | |
| wPrime 2.10 - 1024m (sort by value) | |
| Dell XPS 13 9350 WQXGA | |
| Eurocom Shark 4 | |
| Microsoft Surface Pro 4 Core i7 | |
| Asus Zenbook UX303UB-DH74T | |
| Microsoft Surface Book Core i5 | |
| Super Pi Mod 1.5 XS 32M - 32M (sort by value) | |
| Dell XPS 13 9350 WQXGA | |
| Eurocom Shark 4 | |
| Microsoft Surface Pro 4 Core i7 | |
| Asus Zenbook UX303UB-DH74T | |
| Microsoft Surface Book Core i5 | |
| Lenovo ThinkPad T560-20FH001FGE | |
* ... smaller is better
| PCMark 7 - Score (sort by value) | |
| Dell XPS 13 9350 WQXGA | |
| Lenovo Yoga 900-13ISK 80MK | |
| Apple MacBook Air 13 inch 2015-03 | |
| Asus Zenbook UX303UB-DH74T | |
| HP ProBook 430 G3 P5T00ES | |
| PCMark 8 | |
| Home Score Accelerated v2 (sort by value) | |
| Dell XPS 13 9350 WQXGA | |
| Lenovo Yoga 900-13ISK 80MK | |
| Apple MacBook Air 13 inch 2015-03 | |
| Asus Zenbook UX303UB-DH74T | |
| HP ProBook 430 G3 P5T00ES | |
| Work Score Accelerated v2 (sort by value) | |
| Dell XPS 13 9350 WQXGA | |
| Lenovo Yoga 900-13ISK 80MK | |
| Apple MacBook Air 13 inch 2015-03 | |
| Asus Zenbook UX303UB-DH74T | |
| HP ProBook 430 G3 P5T00ES | |
| Creative Score Accelerated v2 (sort by value) | |
| Dell XPS 13 9350 WQXGA | |
| Lenovo Yoga 900-13ISK 80MK | |
| Apple MacBook Air 13 inch 2015-03 | |
| Asus Zenbook UX303UB-DH74T | |
| HP ProBook 430 G3 P5T00ES | |
| PCMark 7 Score | 5672 points | |
| PCMark 8 Home Score Accelerated v2 | 2928 points | |
| PCMark 8 Creative Score Accelerated v2 | 4470 points | |
| PCMark 8 Work Score Accelerated v2 | 3438 points | |
Help | ||
| Dell XPS 13 9350 WQXGA Iris Graphics 540, 6560U, Samsung PM951 NVMe 512 GB | HP ProBook 430 G2 L3Q21EA HD Graphics 5500, 5200U, Samsung SSD PM851 128 GB MZ7TE128HMGR | Asus Zenbook UX303UB-DH74T GeForce 940M, 6500U, CUK Cyclone SSD 1TB | Apple MacBook Air 13 inch 2015-03 HD Graphics 6000, 5650U, Apple SSD SD0256F | Lenovo Yoga 900-13ISK 80MK HD Graphics 520, 6500U, Samsung SSD PM871 MZNLN512HCJH | Dell XPS 13-9333 HD Graphics 4400, 4200U, Liteonit LMT-128M6M | |
|---|---|---|---|---|---|---|
| AS SSD | -74% | -63% | -68% | -42% | -63% | |
| Copy Game MB/s (MB/s) | 753 | 110.3 -85% | 392.8 -48% | 479.3 -36% | 298.7 -60% | |
| Copy Program MB/s (MB/s) | 271.8 | 105 -61% | 233.7 -14% | 245 -10% | 249.6 -8% | |
| Copy ISO MB/s (MB/s) | 1041 | 136.3 -87% | 382.5 -63% | 643 -38% | 364.5 -65% | |
| Score Total (Points) | 3158 | 838 -73% | 882 -72% | 2383 -25% | 1129 -64% | 902 -71% |
| Score Write (Points) | 664 | 218 -67% | 373 -44% | 463 -30% | 429 -35% | 337 -49% |
| Score Read (Points) | 1679 | 415 -75% | 333 -80% | 1281 -24% | 458 -73% | 373 -78% |
| Access Time Write * (ms) | 0.031 | 0.042 -35% | 0.051 -65% | 0.155 -400% | 0.039 -26% | 0.065 -110% |
| Access Time Read * (ms) | 0.046 | 0.141 -207% | 0.14 -204% | 0.171 -272% | 0.054 -17% | 0.078 -70% |
| 4K-64 Write (MB/s) | 492 | 111.1 -77% | 261.1 -47% | 338.9 -31% | 303 -38% | 249.5 -49% |
| 4K-64 Read (MB/s) | 1497 | 342.6 -77% | 256.9 -83% | 1140 -24% | 374.8 -75% | 294.2 -80% |
| 4K Write (MB/s) | 116.5 | 93.5 -20% | 71.3 -39% | 23.73 -80% | 80.6 -31% | 57.6 -51% |
| 4K Read (MB/s) | 38.29 | 26.84 -30% | 25.99 -32% | 19.16 -50% | 32.29 -16% | 29.32 -23% |
| Seq Write (MB/s) | 559 | 130.5 -77% | 409.8 -27% | 1001 79% | 454.6 -19% | 302.2 -46% |
| Seq Read (MB/s) | 1442 | 459 -68% | 505 -65% | 1212 -16% | 505 -65% | 492.7 -66% |
* ... smaller is better

Samsung PM951 NVMe 512 GB
Transfer Rate Minimum:
715 MB/s
Transfer Rate Maximum:
945 MB/s
Transfer Rate Average:
889 MB/s
Access Time:
0 ms
Burst Rate:
189.3 MB/s
CPU Usage:
9.1 %
| 3DMark 11 | |
| 1280x720 Performance (sort by value) | |
| Dell XPS 13 9350 WQXGA | |
| Microsoft Surface Pro 4 Core i7 | |
| MSI GT72 | |
| HP Spectre x360 15-ap011dx | |
| HP Spectre x2 12-a003ng K3D42EA | |
| Fujitsu Lifebook E544 | |
| 1280x720 Performance Combined (sort by value) | |
| Dell XPS 13 9350 WQXGA | |
| Microsoft Surface Pro 4 Core i7 | |
| MSI GT72 | |
| HP Spectre x360 15-ap011dx | |
| HP Spectre x2 12-a003ng K3D42EA | |
| Fujitsu Lifebook E544 | |
| 1280x720 Performance GPU (sort by value) | |
| Dell XPS 13 9350 WQXGA | |
| Microsoft Surface Pro 4 Core i7 | |
| MSI GT72 | |
| HP Spectre x360 15-ap011dx | |
| HP Spectre x2 12-a003ng K3D42EA | |
| Fujitsu Lifebook E544 | |
| 3DMark | |
| 1920x1080 Fire Strike Score (sort by value) | |
| Dell XPS 13 9350 WQXGA | |
| Microsoft Surface Pro 4 Core i7 | |
| MSI GT72 | |
| HP Spectre x360 15-ap011dx | |
| HP Spectre x2 12-a003ng K3D42EA | |
| 1280x720 Cloud Gate Standard Score (sort by value) | |
| Dell XPS 13 9350 WQXGA | |
| Microsoft Surface Pro 4 Core i7 | |
| MSI GT72 | |
| HP Spectre x360 15-ap011dx | |
| HP Spectre x2 12-a003ng K3D42EA | |
| Fujitsu Lifebook E544 | |
| 1280x720 Ice Storm Standard Score (sort by value) | |
| Dell XPS 13 9350 WQXGA | |
| Microsoft Surface Pro 4 Core i7 | |
| MSI GT72 | |
| HP Spectre x360 15-ap011dx | |
| HP Spectre x2 12-a003ng K3D42EA | |
| Fujitsu Lifebook E544 | |
| Fire Strike Extreme Graphics (sort by value) | |
| Dell XPS 13 9350 WQXGA | |
| Microsoft Surface Pro 4 Core i7 | |
| HP Spectre x360 15-ap011dx | |
| Fire Strike Extreme Combined (sort by value) | |
| Dell XPS 13 9350 WQXGA | |
| Microsoft Surface Pro 4 Core i7 | |
| HP Spectre x360 15-ap011dx | |
| 1280x720 Cloud Gate Standard Graphics (sort by value) | |
| Dell XPS 13 9350 WQXGA | |
| Microsoft Surface Pro 4 Core i7 | |
| MSI GT72 | |
| HP Spectre x360 15-ap011dx | |
| HP Spectre x2 12-a003ng K3D42EA | |
| Fujitsu Lifebook E544 | |
| 3DMark 11 Performance | 2039 points | |
| 3DMark Ice Storm Standard Score | 58948 points | |
| 3DMark Cloud Gate Standard Score | 6730 points | |
| 3DMark Fire Strike Score | 1114 points | |
| 3DMark Fire Strike Extreme Score | 503 points | |
Help | ||
| Tomb Raider - 1366x768 Normal Preset AA:FX AF:4x (sort by value) | |
| Dell XPS 13 9350 WQXGA | |
| Asus Zenbook UX303UB-DH74T | |
| Lenovo U31-70 80M5003EGE | |
| Asus Zenbook UX303UA-FN121T | |
| Lenovo IdeaPad Miix 700 | |
| Lenovo ThinkPad L440 20AT004QGE | |
| low | med. | high | ultra | |
|---|---|---|---|---|
| Tomb Raider (2013) | 85 | 49.2 | 33.3 | |
| Metro: Last Light (2013) | 28.1 | 23 | 15.8 | |
| Thief (2014) | 23.3 | 15.7 | 13.7 | |
| Metal Gear Solid V (2015) | 48.6 | 28.9 | 13.9 |
| Dell XPS 13 9350 WQXGA Iris Graphics 540, 6560U, Samsung PM951 NVMe 512 GB | HP ProBook 430 G3 P5T00ES HD Graphics 520, 6200U, Hitachi Travelstar Z7K500 HTS725050A7E630 | Asus Zenbook UX303UB-DH74T GeForce 940M, 6500U, CUK Cyclone SSD 1TB | Apple MacBook Air 13 inch 2015-03 HD Graphics 6000, 5650U, Apple SSD SD0256F | Lenovo Yoga 900-13ISK 80MK HD Graphics 520, 6500U, Samsung SSD PM871 MZNLN512HCJH | HP Spectre x360 13-4104ng HD Graphics 520, 6200U, Samsung SSD PM851 256 GB MZNTE256HMHP | |
|---|---|---|---|---|---|---|
| Noise | -7% | -11% | -15% | -6% | -10% | |
| off / environment * (dB) | 29.2 | |||||
| Idle Minimum * (dB) | 29.2 | 29.8 -2% | 29.8 -2% | 29.2 -0% | 29.7 -2% | 29.6 -1% |
| Idle Average * (dB) | 29.2 | 29.8 -2% | 29.8 -2% | 29.2 -0% | 29.8 -2% | 29.6 -1% |
| Idle Maximum * (dB) | 29.2 | 30.9 -6% | 29.8 -2% | 29.2 -0% | 30 -3% | 34.6 -18% |
| Load Average * (dB) | 31.4 | 33.3 -6% | 37.4 -19% | 40.2 -28% | 32 -2% | 34.7 -11% |
| Load Maximum * (dB) | 31.4 | 37.4 -19% | 40.3 -28% | 46.3 -47% | 38.5 -23% | 37.9 -21% |
* ... smaller is better
Noise level
| Idle |
| 29.2 / 29.2 / 29.2 dB(A) |
| Load |
| 31.4 / 31.4 dB(A) |
 | ||
30 dB silent 40 dB(A) audible 50 dB(A) loud |
||
min: | ||
(+) The average temperature for the upper side under maximal load is 30.8 °C / 87 F, compared to the average of 30.8 °C / 87 F for the devices in the class Subnotebook.
(±) The maximum temperature on the upper side is 41.4 °C / 107 F, compared to the average of 35.9 °C / 97 F, ranging from 21.4 to 59 °C for the class Subnotebook.
(-) The bottom heats up to a maximum of 49.2 °C / 121 F, compared to the average of 39.2 °C / 103 F
(+) In idle usage, the average temperature for the upper side is 26.7 °C / 80 F, compared to the device average of 30.8 °C / 87 F.
(+) The palmrests and touchpad are cooler than skin temperature with a maximum of 28.7 °C / 83.7 F and are therefore cool to the touch.
(±) The average temperature of the palmrest area of similar devices was 28.2 °C / 82.8 F (-0.5 °C / -0.9 F).
Power Consumption
| Off / Standby | |
| Idle | |
| Load |
|
Key:
min: | |
| Dell XPS 13 9350 WQXGA 56 Wh | HP ProBook 430 G3 P5T00ES 44 Wh | Asus Zenbook UX303UB-DH74T 50 Wh | Apple MacBook Air 13 inch 2015-03 54 Wh | Lenovo Yoga 900-13ISK 80MK 66 Wh | HP Spectre x360 13-4104ng 56 Wh | |
|---|---|---|---|---|---|---|
| Battery runtime | -3% | -2% | 78% | 23% | 60% | |
| Reader / Idle (h) | 10.1 | 7.5 -26% | 10.3 2% | 26.2 159% | 14.1 40% | |
| WiFi v1.3 (h) | 5.2 | 6.3 21% | 5.7 10% | 10.3 98% | 6.7 29% | 8.3 60% |
| Load (h) | 2.1 | 2 -5% | 1.7 -19% | 1.6 -24% | 2.1 0% |
Pros
+ 非常便携;紧凑设计
+ 高品质屏幕;明亮的背光
+ 高sRGB覆盖(高于90%)
+ 无闪烁亮度控制;不错的响应速度
+ 风扇噪音低
+ 512 GB NVMe固态硬盘
Cons
- 高核心温度
- 机身表面温度较高
- 处理器降频的可能性
- 扬声器较弱的低音还原
- 一般的电池续航
- 键盘键程短,反馈弱
XPS 13除了超紧凑设计之外的优势包括了安静的风扇和顶级屏幕。酷睿i7-6560U和集成的Iris Graphics 540将系统性能推向了更高水平,而没有在风扇噪音上作出牺牲,这经常是高性能的双刃剑。它不仅性能有了提高,表面和核心温度也相比更高,处理器将会在游戏中有过热降频的可能。它的电池续航由于QHD+屏幕和更高功率的处理器而有所退步。它的整体性能略低于Surface Pro 4中的酷睿i7-6650U,特别是在显卡性能上。
不需要更强的Iris Graphics 540显卡而可以接受Graphics 520的用户可以选择配置略低的型号,同时也可以得到更长的续航时间。如果显卡性能更佳重要,则可以考虑尺寸稍大的Zenbook UX303,它搭配了Nvidia独立显卡,用户不需在便携性上牺牲太多就可以得到更强的图形性能。
注:本文是基于完整评测的缩减版本,阅读完整的英文评测,请点击这里。
Dell XPS 13 9350 WQXGA
- 02/26/2016 v5 (old)
Allen Ngo
Subnotebook - Weighted Average
Price comparison
