联想 IdeaPad 500s-14ISK 笔记本电脑简短评测
| |||||||||||||||||||||||||
Brightness Distribution: 87 %
Center on Battery: 249 cd/m²
Contrast: 566:1 (Black: 0.44 cd/m²)
ΔE ColorChecker Calman: 9.47 | ∀{0.5-29.43 Ø4.71}
ΔE Greyscale Calman: 10.22 | ∀{0.09-98 Ø4.96}
57% sRGB (Argyll 1.6.3 3D)
39% AdobeRGB 1998 (Argyll 1.6.3 3D)
42.15% AdobeRGB 1998 (Argyll 3D)
60.6% sRGB (Argyll 3D)
40.74% Display P3 (Argyll 3D)
Gamma: 2.34
CCT: 11451 K
| Lenovo Ideapad 500s-14ISK TN, 14", 1920x1080 | Asus Zenbook UX303UB-R4100T IPS, 13.3", 1920x1080 | Microsoft Surface Book Core i7 IPS, 13.5", 3000x2000 | HP EliteBook 745 G3 IPS-Panel, 14", 2560x1440 | Dell XPS 13 2016 i7 256GB QHD IGZO , 13.3", 3200x1800 | |
|---|---|---|---|---|---|
| Display | 59% | 61% | 74% | 55% | |
| Display P3 Coverage (%) | 40.74 | 66.9 64% | 66.3 63% | 75.7 86% | 63.6 56% |
| sRGB Coverage (%) | 60.6 | 92.3 52% | 96 58% | 95.8 58% | 93.6 54% |
| AdobeRGB 1998 Coverage (%) | 42.15 | 67.6 60% | 68 61% | 74.5 77% | 65.5 55% |
| Response Times | -55% | -20% | -10% | -12% | |
| Response Time Grey 50% / Grey 80% * (ms) | 43 ? | 68 ? -58% | 39 ? 9% | 46.8 ? -9% | 40 ? 7% |
| Response Time Black / White * (ms) | 23 ? | 35 ? -52% | 34 ? -48% | 25.2 ? -10% | 30 ? -30% |
| PWM Frequency (Hz) | 178 ? | 4900 ? | |||
| Screen | 48% | 76% | 41% | 54% | |
| Brightness middle (cd/m²) | 249 | 385 55% | 438 76% | 319 28% | 285 14% |
| Brightness (cd/m²) | 235 | 394 68% | 414 76% | 301 28% | 281 20% |
| Brightness Distribution (%) | 87 | 89 2% | 88 1% | 74 -15% | 90 3% |
| Black Level * (cd/m²) | 0.44 | 0.41 7% | 0.25 43% | 0.29 34% | 0.18 59% |
| Contrast (:1) | 566 | 939 66% | 1752 210% | 1100 94% | 1583 180% |
| Colorchecker dE 2000 * | 9.47 | 3.84 59% | 2.06 78% | 7.23 24% | 4.89 48% |
| Colorchecker dE 2000 max. * | 15.41 | ||||
| Greyscale dE 2000 * | 10.22 | 3.79 63% | 2.87 72% | 6 41% | 5.16 50% |
| Gamma | 2.34 94% | 2.23 99% | 2.44 90% | 2.14 103% | 2.15 102% |
| CCT | 11451 57% | 6499 100% | 6820 95% | 6904 94% | 7106 91% |
| Color Space (Percent of AdobeRGB 1998) (%) | 39 | 60 54% | 64 64% | 65.8 69% | 59 51% |
| Color Space (Percent of sRGB) (%) | 57 | 92 61% | 96 68% | 95.3 67% | 93 63% |
| Total Average (Program / Settings) | 17% /
36% | 39% /
59% | 35% /
41% | 32% /
45% |
* ... smaller is better
Display Response Times
| ↔ Response Time Black to White | ||
|---|---|---|
| 23 ms ... rise ↗ and fall ↘ combined | ↗ 8 ms rise | 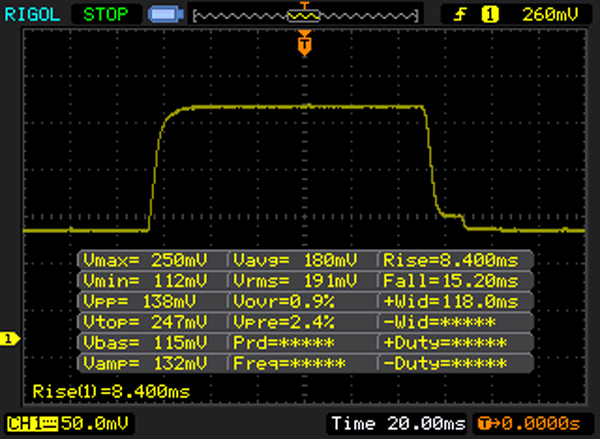 |
| ↘ 15 ms fall | ||
| The screen shows good response rates in our tests, but may be too slow for competitive gamers. In comparison, all tested devices range from 0.1 (minimum) to 240 (maximum) ms. » 52 % of all devices are better. This means that the measured response time is worse than the average of all tested devices (19.8 ms). | ||
| ↔ Response Time 50% Grey to 80% Grey | ||
| 43 ms ... rise ↗ and fall ↘ combined | ↗ 22 ms rise | 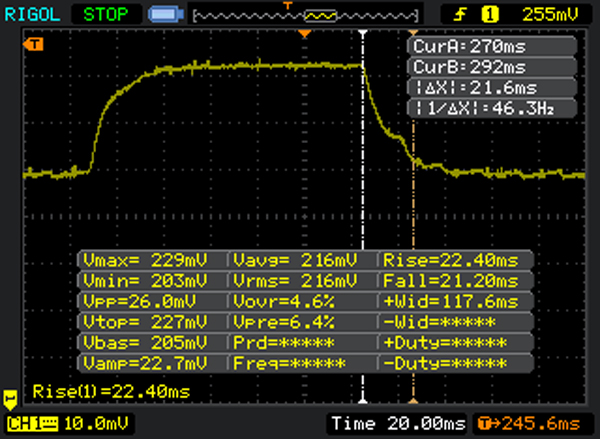 |
| ↘ 21 ms fall | ||
| The screen shows slow response rates in our tests and will be unsatisfactory for gamers. In comparison, all tested devices range from 0.165 (minimum) to 636 (maximum) ms. » 71 % of all devices are better. This means that the measured response time is worse than the average of all tested devices (31 ms). | ||
Screen Flickering / PWM (Pulse-Width Modulation)
| Screen flickering / PWM not detected | ||
In comparison: 52 % of all tested devices do not use PWM to dim the display. If PWM was detected, an average of 7754 (minimum: 5 - maximum: 343500) Hz was measured. | ||
| Cinebench R15 | |
| CPU Multi 64Bit (sort by value) | |
| Lenovo Ideapad 500s-14ISK | |
| Asus Zenbook UX303UB-R4100T | |
| Microsoft Surface Book Core i7 | |
| HP EliteBook 745 G3 | |
| Dell XPS 13 2016 i7 256GB QHD | |
| CPU Single 64Bit (sort by value) | |
| Lenovo Ideapad 500s-14ISK | |
| Asus Zenbook UX303UB-R4100T | |
| Microsoft Surface Book Core i7 | |
| HP EliteBook 745 G3 | |
| Dell XPS 13 2016 i7 256GB QHD | |
| Cinebench R11.5 | |
| CPU Multi 64Bit (sort by value) | |
| Lenovo Ideapad 500s-14ISK | |
| Asus Zenbook UX303UB-R4100T | |
| Microsoft Surface Book Core i7 | |
| HP EliteBook 745 G3 | |
| Dell XPS 13 2016 i7 256GB QHD | |
| CPU Single 64Bit (sort by value) | |
| Lenovo Ideapad 500s-14ISK | |
| Asus Zenbook UX303UB-R4100T | |
| Microsoft Surface Book Core i7 | |
| HP EliteBook 745 G3 | |
| Dell XPS 13 2016 i7 256GB QHD | |
| Cinebench R10 | |
| Rendering Multiple CPUs 32Bit (sort by value) | |
| Lenovo Ideapad 500s-14ISK | |
| Asus Zenbook UX303UB-R4100T | |
| Microsoft Surface Book Core i7 | |
| HP EliteBook 745 G3 | |
| Dell XPS 13 2016 i7 256GB QHD | |
| Rendering Single 32Bit (sort by value) | |
| Lenovo Ideapad 500s-14ISK | |
| Asus Zenbook UX303UB-R4100T | |
| Microsoft Surface Book Core i7 | |
| HP EliteBook 745 G3 | |
| Dell XPS 13 2016 i7 256GB QHD | |
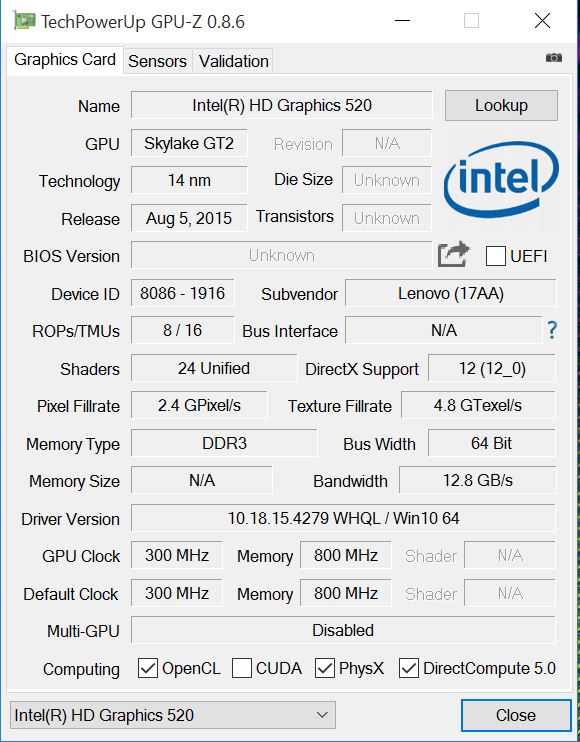
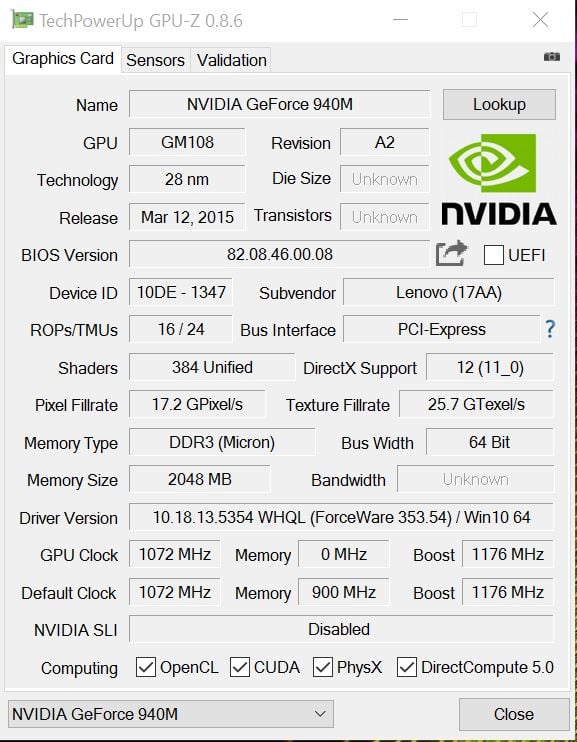
| Lenovo Ideapad 500s-14ISK 6500U, GeForce 940M, Samsung PM871 MZYLN256HCHP | Asus Zenbook UX303UB-R4100T 6500U, GeForce 940M, Micron M600 MTFDDAK512MBF | Microsoft Surface Book Core i7 6600U, Maxwell GPU (940M, GDDR5), Samsung MZFLV512 NVMe | HP EliteBook 745 G3 Pro A12-8800B, Radeon R7 (Carrizo), Samsung SSD PM851 256 GB MZNTE256HMHP | Dell XPS 13 2016 i7 256GB QHD 6500U, HD Graphics 520, Samsung PM951 NVMe MZ-VLV256D | |
|---|---|---|---|---|---|
| PCMark 7 | |||||
| Score (Points) | 4811 | 5162 7% | 5178 8% | 3407 -29% | 4977 3% |
| PCMark 8 | 10% | -1% | -20% | -7% | |
| Home Score Accelerated v2 (Points) | 3006 | 3320 10% | 2947 -2% | 2445 -19% | 2822 -6% |
| Creative Score Accelerated v2 (Points) | 3592 | 4042 13% | 3755 5% | 2652 -26% | |
| Work Score Accelerated v2 (Points) | 4064 | 4353 7% | 3782 -7% | 3424 -16% | 3735 -8% |
| Total Average (Program / Settings) | 9% /
9% | 4% /
1% | -25% /
-23% | -2% /
-4% |
| PCMark 7 Score | 4811 points | |
| PCMark 8 Home Score Accelerated v2 | 3006 points | |
| PCMark 8 Creative Score Accelerated v2 | 3592 points | |
| PCMark 8 Work Score Accelerated v2 | 4064 points | |
Help | ||

| 3DMark | |
| 1920x1080 Fire Strike Score (sort by value) | |
| Lenovo Ideapad 500s-14ISK | |
| Asus Zenbook UX303UB-R4100T | |
| Microsoft Surface Book Core i7 | |
| HP EliteBook 745 G3 | |
| Dell XPS 13 2016 i7 256GB QHD | |
| 1280x720 Cloud Gate Standard Score (sort by value) | |
| Lenovo Ideapad 500s-14ISK | |
| Asus Zenbook UX303UB-R4100T | |
| Microsoft Surface Book Core i7 | |
| HP EliteBook 745 G3 | |
| Dell XPS 13 2016 i7 256GB QHD | |
| 3DMark 11 - 1280x720 Performance (sort by value) | |
| Lenovo Ideapad 500s-14ISK | |
| Asus Zenbook UX303UB-R4100T | |
| Microsoft Surface Book Core i7 | |
| HP EliteBook 745 G3 | |
| Dell XPS 13 2016 i7 256GB QHD | |
| 3DMark 11 Performance | 2423 points | |
| 3DMark Ice Storm Standard Score | 41492 points | |
| 3DMark Cloud Gate Standard Score | 5816 points | |
| 3DMark Fire Strike Score | 1376 points | |
Help | ||
| low | med. | high | ultra | |
|---|---|---|---|---|
| The Witcher 3 (2015) | 31.4 | 18.8 | 10.2 | |
| Fallout 4 (2015) | 36.2 | 22.4 | 11.9 | |
| Rise of the Tomb Raider (2016) | 25.6 | 19.2 | 11.3 |
Noise level
| Idle |
| 31.3 / 31.7 / 31.8 dB(A) |
| Load |
| 36.7 / 39.4 dB(A) |
 | ||
30 dB silent 40 dB(A) audible 50 dB(A) loud |
||
min: | ||
| Lenovo Ideapad 500s-14ISK 6500U, GeForce 940M | Asus Zenbook UX303UB-R4100T 6500U, GeForce 940M | Microsoft Surface Book Core i7 6600U, Maxwell GPU (940M, GDDR5) | HP EliteBook 745 G3 Pro A12-8800B, Radeon R7 (Carrizo) | Dell XPS 13 2016 i7 256GB QHD 6500U, HD Graphics 520 | |
|---|---|---|---|---|---|
| Noise | 1% | -1% | 6% | 1% | |
| off / environment * (dB) | 31.3 | 31.3 -0% | |||
| Idle Minimum * (dB) | 31.3 | 31.5 -1% | 31.3 -0% | 29 7% | 31.8 -2% |
| Idle Average * (dB) | 31.7 | 31.5 1% | 31.3 1% | 29 9% | 31.8 -0% |
| Idle Maximum * (dB) | 31.8 | 31.5 1% | 31.3 2% | 31.1 2% | 34.8 -9% |
| Load Average * (dB) | 36.7 | 35.9 2% | 38 -4% | 35.6 3% | 34.8 5% |
| Load Maximum * (dB) | 39.4 | 38.2 3% | 40.5 -3% | 35.6 10% | 34.8 12% |
* ... smaller is better
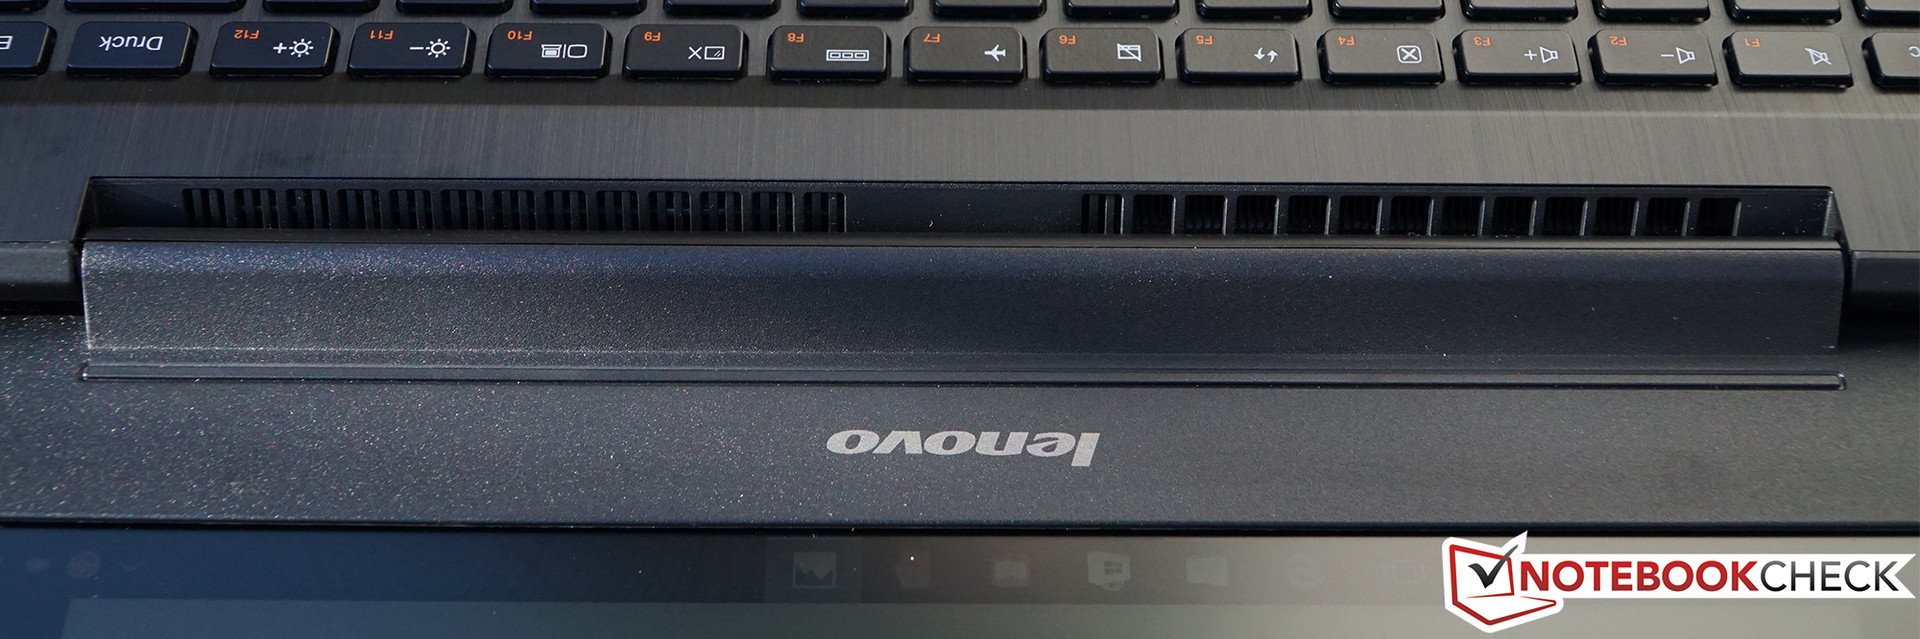
(±) The maximum temperature on the upper side is 42 °C / 108 F, compared to the average of 36.8 °C / 98 F, ranging from 21 to 71 °C for the class Multimedia.
(-) The bottom heats up to a maximum of 51.1 °C / 124 F, compared to the average of 39.1 °C / 102 F
(+) In idle usage, the average temperature for the upper side is 24.6 °C / 76 F, compared to the device average of 31.3 °C / 88 F.
(+) The palmrests and touchpad are cooler than skin temperature with a maximum of 29.4 °C / 84.9 F and are therefore cool to the touch.
(±) The average temperature of the palmrest area of similar devices was 28.7 °C / 83.7 F (-0.7 °C / -1.2 F).
| Lenovo Ideapad 500s-14ISK 6500U, GeForce 940M | Asus Zenbook UX303UB-R4100T 6500U, GeForce 940M | Microsoft Surface Book Core i7 6600U, Maxwell GPU (940M, GDDR5) | HP EliteBook 745 G3 Pro A12-8800B, Radeon R7 (Carrizo) | Dell XPS 13 2016 i7 256GB QHD 6500U, HD Graphics 520 | |
|---|---|---|---|---|---|
| Heat | -5% | -6% | -7% | -24% | |
| Maximum Upper Side * (°C) | 42 | 56.6 -35% | 47.4 -13% | 39.5 6% | 57 -36% |
| Maximum Bottom * (°C) | 51.1 | 54.3 -6% | 50.2 2% | 43 16% | 56 -10% |
| Idle Upper Side * (°C) | 26.2 | 24 8% | 30.4 -16% | 32.9 -26% | 34.1 -30% |
| Idle Bottom * (°C) | 28.5 | 24.2 15% | 27.4 4% | 35 -23% | 34.3 -20% |
* ... smaller is better
| Off / Standby | |
| Idle | |
| Load |
|
Key:
min: | |
| Lenovo Ideapad 500s-14ISK 6500U, GeForce 940M | Asus Zenbook UX303UB-R4100T 6500U, GeForce 940M | Microsoft Surface Book Core i7 6600U, Maxwell GPU (940M, GDDR5) | HP EliteBook 745 G3 Pro A12-8800B, Radeon R7 (Carrizo) | Dell XPS 13 2016 i7 256GB QHD 6500U, HD Graphics 520 | |
|---|---|---|---|---|---|
| Power Consumption | -4% | -28% | -38% | -19% | |
| Idle Minimum * (Watt) | 3.8 | 3.2 16% | 4.5 -18% | 6.2 -63% | 6.8 -79% |
| Idle Average * (Watt) | 7.2 | 7.6 -6% | 9.8 -36% | 9.4 -31% | 10 -39% |
| Idle Maximum * (Watt) | 7.6 | 8 -5% | 12.2 -61% | 14.8 -95% | 10.5 -38% |
| Load Average * (Watt) | 40 | 47 -18% | 46 -15% | 44.8 -12% | 30.2 24% |
| Load Maximum * (Watt) | 52 | 55 -6% | 56 -8% | 45.2 13% | 33.6 35% |
* ... smaller is better
| Lenovo Ideapad 500s-14ISK 30 Wh | Asus Zenbook UX303UB-R4100T 50 Wh | Microsoft Surface Book Core i7 78 Wh | HP EliteBook 745 G3 46 Wh | Dell XPS 13 2016 i7 256GB QHD 56 Wh | |
|---|---|---|---|---|---|
| Battery runtime | 99% | 151% | 1% | 83% | |
| Reader / Idle (h) | 5.8 | 16.6 186% | 7.4 28% | 13.1 126% | |
| H.264 (h) | 4.1 | 6.9 68% | 3.5 -15% | ||
| WiFi v1.3 (h) | 4.3 | 6.8 58% | 10.8 151% | 3.1 -28% | 7.2 67% |
| Load (h) | 1.1 | 2 82% | 1.3 18% | 1.7 55% |
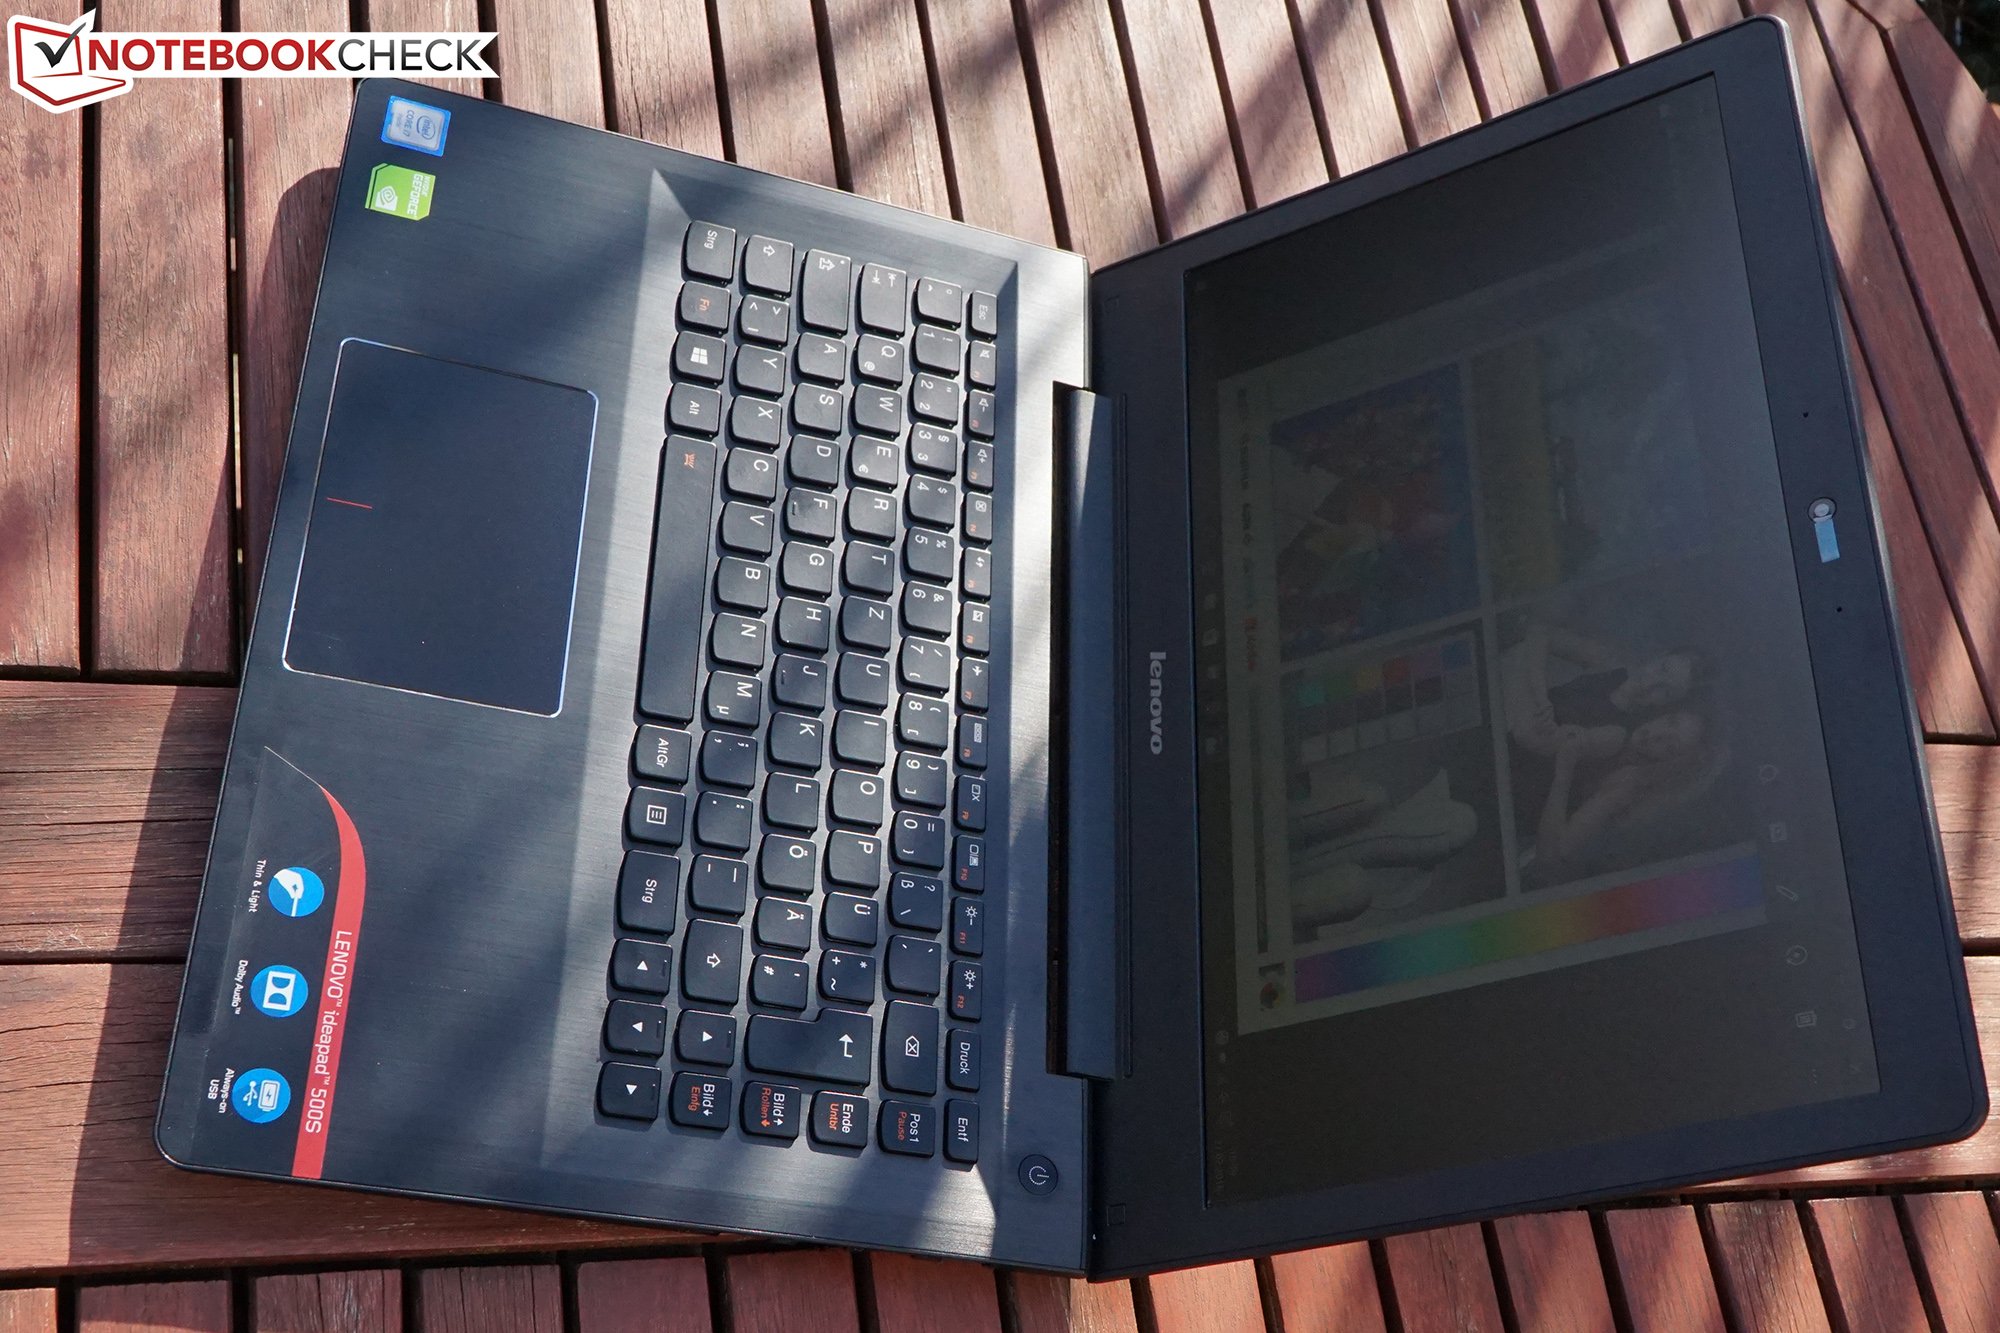
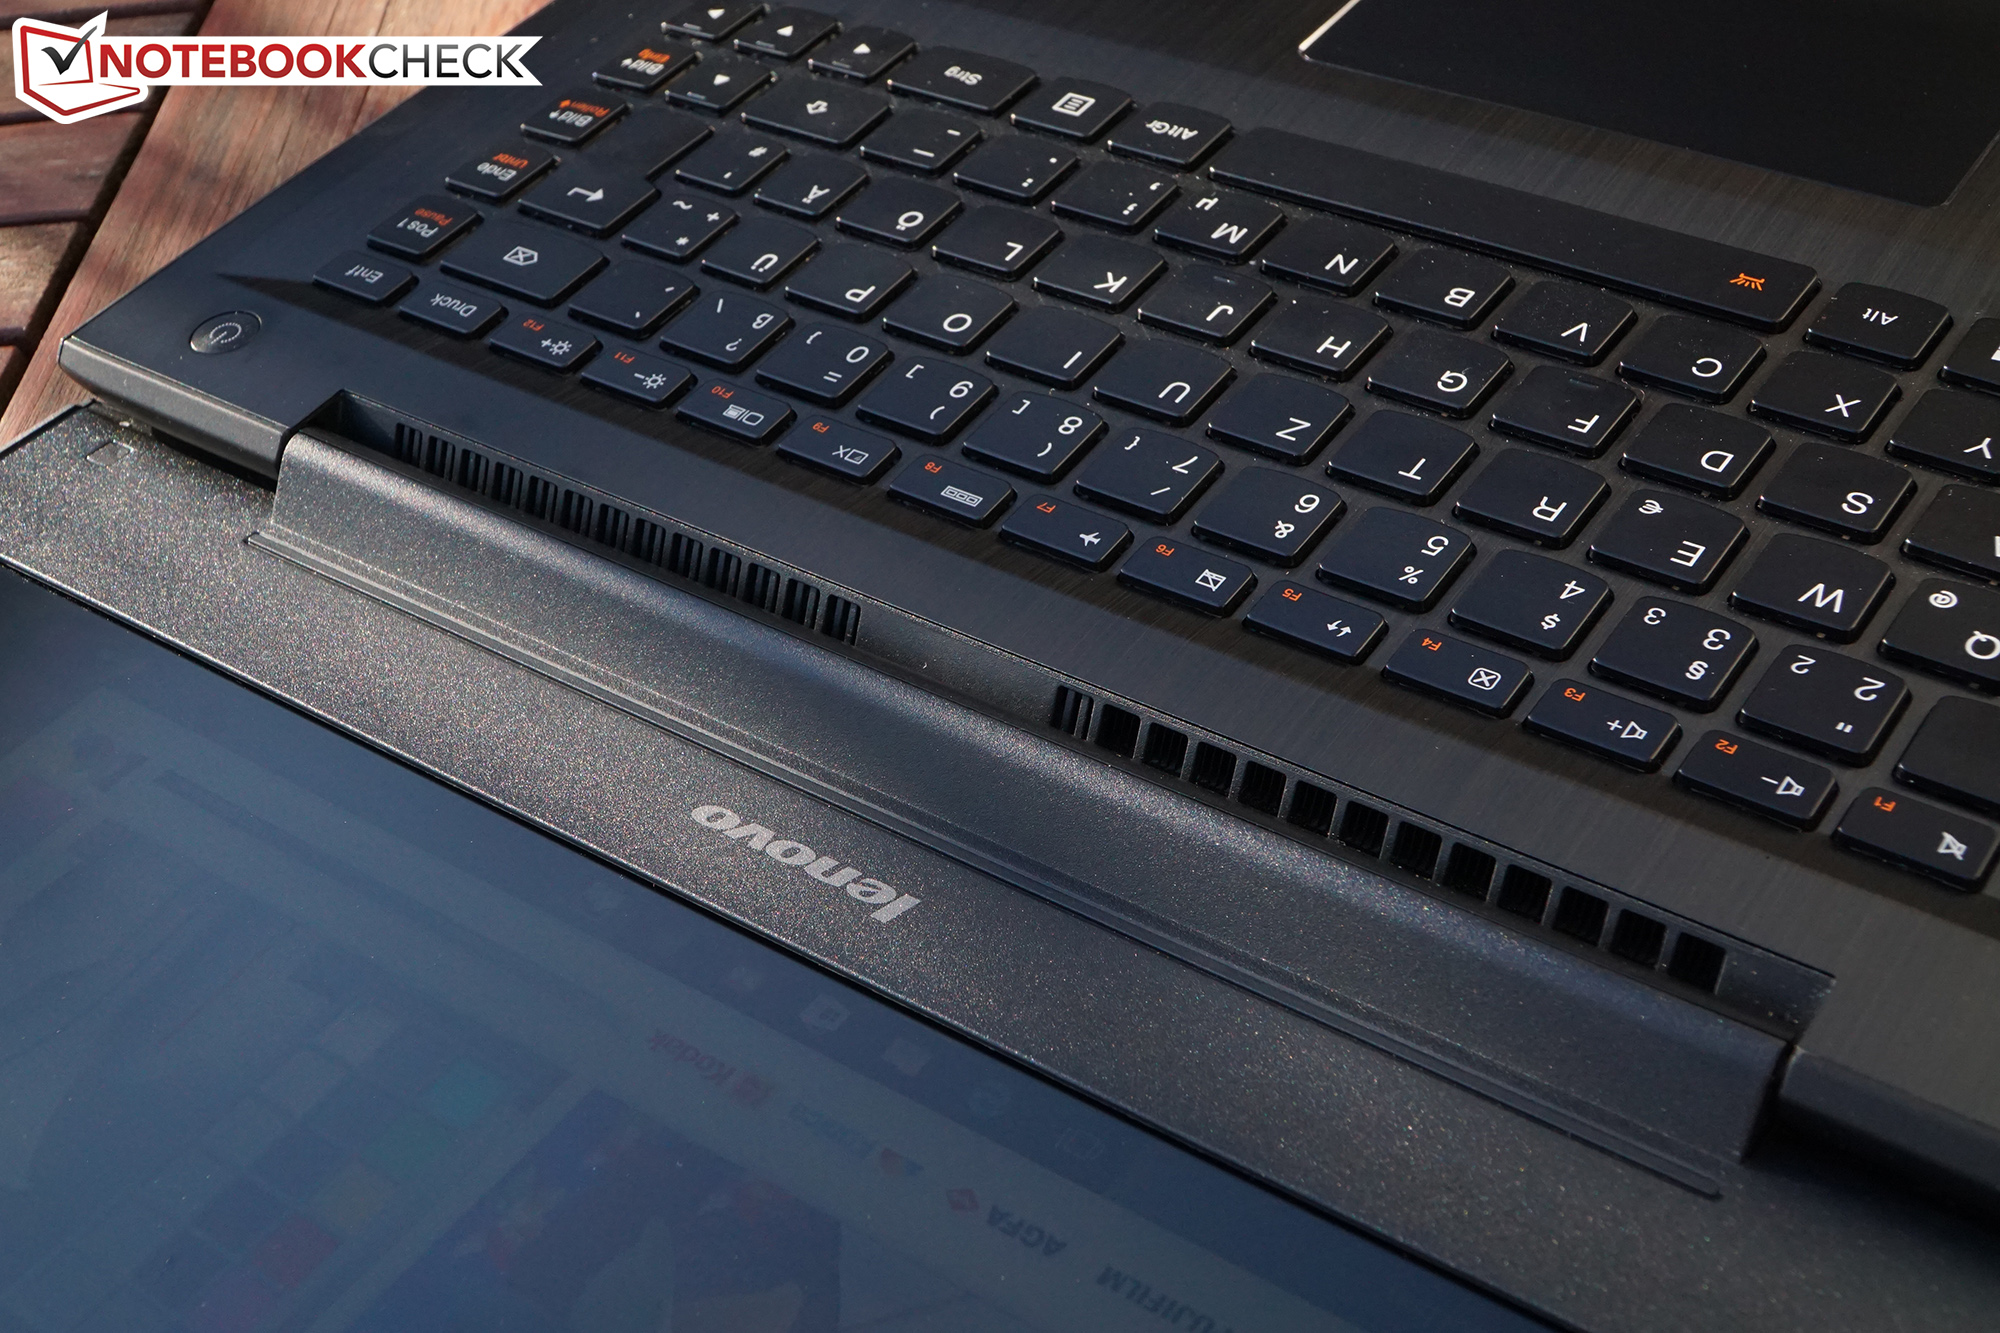
有时候笔记本电脑生产商的策略让人难以理解。联想在IdeaPad 500s-14ISK的设计中在很多方面都做得不错。
从机身品质到输入设备、噪音散热,系统性能的优秀表现而言,这台IdeaPad是一台紧凑的全能设备,它在很多方面都可以与ZenBook,XPS 13等设备竞争。
不过,联想很明显在两个方面节省了成本,从而让它无法得到很好的总分。它的TN屏幕很明显低于平均水平。尽管我们经常对实惠型设备的屏幕品质挑刺,但它的表现甚至还更逊一筹。而且,尽管功耗较低,但30瓦时的小容量电池很明显无法保证长时间的电池续航。
IdeaPad 500s-14ISK的售价约1000欧元(约7291人民币),低于配置相似的华硕 ZenBook UX303UB-R4100T超过250欧元(约1822人民币),它们在各方面的得分也十分接近。如果联想能够在屏幕和电池上做出改进的话,它应该会是一款价格实惠同时性能出色的设备。但是从事实出发,我们建议对预算没有那么敏感的用户仔细考虑一下同类产品。一块出色的屏幕和长续航时间也非常重要,特别是对于移动使用来说(例如户外)。只需多付一个合理的差额,你就能两者兼顾。
注:本文是基于完整评测的缩减版本,阅读完整的英文评测,请点击这里。
Lenovo Ideapad 500s-14ISK
- 03/08/2016 v5 (old)
Oliver Moebel