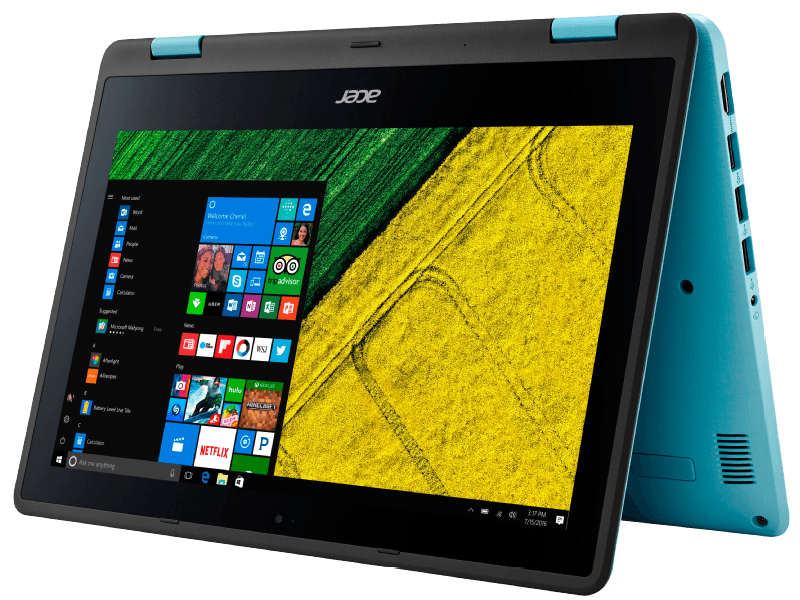
宏碁 Spin 1 (N3450, FHD) 变形本简短评测
Connections
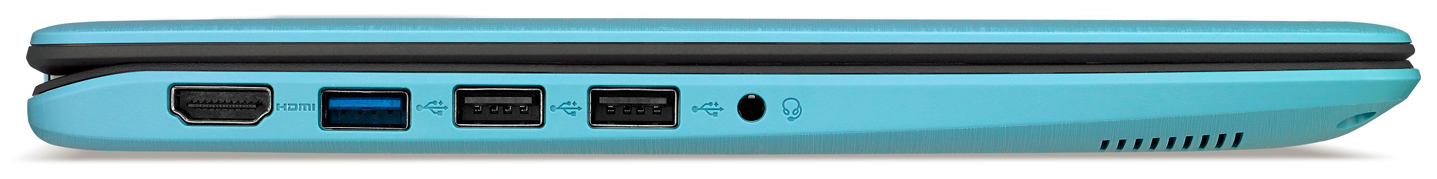
| SD Card Reader | |
| maximum SDCardreader Maximum Transfer Rate | |
| average SDCardreader Average Transfer Rate |
| Networking | |
| iperf3 transmit AX12 | |
| Dell Latitude 3189 | |
| Asus VivoBook Flip 12 TP203NAH-BP049T | |
| Acer Spin 1 SP111-31-C79E | |
| iperf3 receive AX12 | |
| Dell Latitude 3189 | |
| Asus VivoBook Flip 12 TP203NAH-BP049T | |
| Acer Spin 1 SP111-31-C79E | |
| |||||||||||||||||||||||||
Brightness Distribution: 86 %
Center on Battery: 251 cd/m²
Contrast: 1195:1 (Black: 0.21 cd/m²)
ΔE ColorChecker Calman: 4.27 | ∀{0.5-29.43 Ø4.71}
ΔE Greyscale Calman: 3.77 | ∀{0.09-98 Ø4.96}
72% sRGB (Argyll 1.6.3 3D)
47% AdobeRGB 1998 (Argyll 1.6.3 3D)
51.4% AdobeRGB 1998 (Argyll 3D)
72.6% sRGB (Argyll 3D)
49.67% Display P3 (Argyll 3D)
Gamma: 2.26
CCT: 6524 K
| Acer Spin 1 SP111-31-C79E IPS, 1920x1080, 11.6" | Asus VivoBook Flip 12 TP203NAH-BP049T IPS, 1366x768, 11.6" | Dell Latitude 3189 IPS, 1366x768, 11.6" | Medion Akoya E2215T IPS, 1920x1080, 11.6" | HP Pavilion 11-k103ng x360 IPS, 1366x768, 11.6" | |
|---|---|---|---|---|---|
| Display | -10% | -9% | -2% | -8% | |
| Display P3 Coverage (%) | 49.67 | 44.23 -11% | 44.96 -9% | 48.12 -3% | 45.21 -9% |
| sRGB Coverage (%) | 72.6 | 66.3 -9% | 67.3 -7% | 71.7 -1% | 67.8 -7% |
| AdobeRGB 1998 Coverage (%) | 51.4 | 45.73 -11% | 46.49 -10% | 49.78 -3% | 46.73 -9% |
| Response Times | -6% | -19% | 3% | 26% | |
| Response Time Grey 50% / Grey 80% * (ms) | 36 ? | 39 ? -8% | 40 ? -11% | 31 ? 14% | 18.8 ? 48% |
| Response Time Black / White * (ms) | 24 ? | 25 ? -4% | 30.4 ? -27% | 26 ? -8% | 23.2 ? 3% |
| PWM Frequency (Hz) | 50 ? | ||||
| Screen | 10% | 18% | -2% | 2% | |
| Brightness middle (cd/m²) | 251 | 253 1% | 291 16% | 338 35% | 194 -23% |
| Brightness (cd/m²) | 247 | 245 -1% | 284 15% | 309 25% | 186 -25% |
| Brightness Distribution (%) | 86 | 65 -24% | 92 7% | 76 -12% | 86 0% |
| Black Level * (cd/m²) | 0.21 | 0.17 19% | 0.16 24% | 0.39 -86% | 0.22 -5% |
| Contrast (:1) | 1195 | 1488 25% | 1819 52% | 867 -27% | 882 -26% |
| Colorchecker dE 2000 * | 4.27 | 3.17 26% | 3.4 20% | 3.94 8% | 3.06 28% |
| Colorchecker dE 2000 max. * | 11 | 8.13 26% | 9.6 13% | 9.96 9% | 8.81 20% |
| Greyscale dE 2000 * | 3.77 | 2 47% | 1.8 52% | 2.54 33% | 1.42 62% |
| Gamma | 2.26 97% | 2.43 91% | 2.14 103% | 2.38 92% | 2.34 94% |
| CCT | 6524 100% | 6850 95% | 6544 99% | 6902 94% | 6432 101% |
| Color Space (Percent of AdobeRGB 1998) (%) | 47 | 42 -11% | 42.8 -9% | 46 -2% | 42.98 -9% |
| Color Space (Percent of sRGB) (%) | 72 | 66 -8% | 67 -7% | 71 -1% | 67.56 -6% |
| Total Average (Program / Settings) | -2% /
4% | -3% /
8% | -0% /
-1% | 7% /
3% |
* ... smaller is better
Screen Flickering / PWM (Pulse-Width Modulation)
| Screen flickering / PWM not detected | ||
In comparison: 52 % of all tested devices do not use PWM to dim the display. If PWM was detected, an average of 7754 (minimum: 5 - maximum: 343500) Hz was measured. | ||
Display Response Times
| ↔ Response Time Black to White | ||
|---|---|---|
| 24 ms ... rise ↗ and fall ↘ combined | ↗ 14 ms rise | 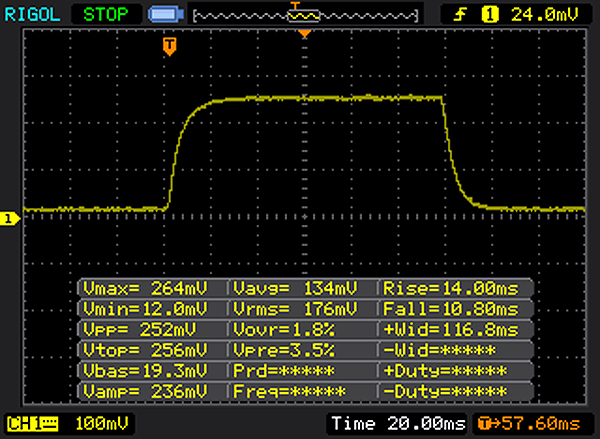 |
| ↘ 10 ms fall | ||
| The screen shows good response rates in our tests, but may be too slow for competitive gamers. In comparison, all tested devices range from 0.1 (minimum) to 240 (maximum) ms. » 54 % of all devices are better. This means that the measured response time is worse than the average of all tested devices (19.8 ms). | ||
| ↔ Response Time 50% Grey to 80% Grey | ||
| 36 ms ... rise ↗ and fall ↘ combined | ↗ 19 ms rise | 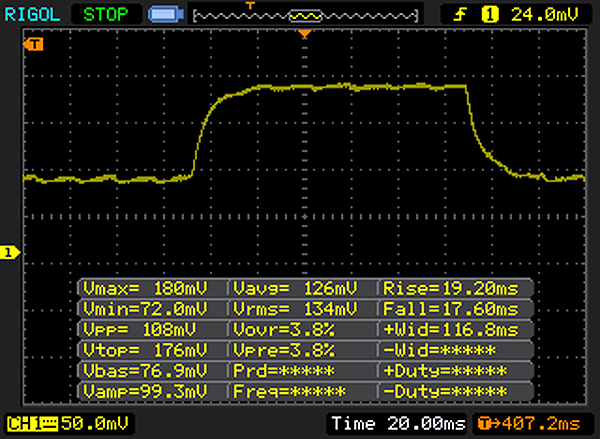 |
| ↘ 17 ms fall | ||
| The screen shows slow response rates in our tests and will be unsatisfactory for gamers. In comparison, all tested devices range from 0.165 (minimum) to 636 (maximum) ms. » 51 % of all devices are better. This means that the measured response time is worse than the average of all tested devices (31 ms). | ||
| Cinebench R15 | |
| CPU Single 64Bit | |
| Asus VivoBook Flip 12 TP203NAH-BP049T | |
| Dell Latitude 3189 | |
| Acer Spin 1 SP111-31-C79E | |
| Acer TravelMate B117-M-P16Q | |
| Acer Swift 1 SF114-31-P6F6 | |
| Acer Aspire ES1-731G-P5UR | |
| HP Pavilion 11-k103ng x360 | |
| CPU Multi 64Bit | |
| Dell Latitude 3189 | |
| Asus VivoBook Flip 12 TP203NAH-BP049T | |
| Acer Swift 1 SF114-31-P6F6 | |
| Acer TravelMate B117-M-P16Q | |
| Acer Aspire ES1-731G-P5UR | |
| Acer Spin 1 SP111-31-C79E | |
| HP Pavilion 11-k103ng x360 | |
| Cinebench R10 | |
| Rendering Multiple CPUs 32Bit | |
| Dell Latitude 3189 | |
| Acer Swift 1 SF114-31-P6F6 | |
| Asus VivoBook Flip 12 TP203NAH-BP049T | |
| Acer TravelMate B117-M-P16Q | |
| Acer Spin 1 SP111-31-C79E | |
| Acer Aspire ES1-731G-P5UR | |
| Medion Akoya E2215T | |
| Rendering Single 32Bit | |
| Asus VivoBook Flip 12 TP203NAH-BP049T | |
| Dell Latitude 3189 | |
| Acer Spin 1 SP111-31-C79E | |
| Acer Swift 1 SF114-31-P6F6 | |
| Acer TravelMate B117-M-P16Q | |
| Acer Aspire ES1-731G-P5UR | |
| Medion Akoya E2215T | |
| Geekbench 4.0 | |
| 64 Bit Multi-Core Score | |
| Asus VivoBook Flip 12 TP203NAH-BP049T | |
| Acer Spin 1 SP111-31-C79E | |
| Acer Swift 1 SF114-31-P6F6 | |
| 64 Bit Single-Core Score | |
| Asus VivoBook Flip 12 TP203NAH-BP049T | |
| Acer Spin 1 SP111-31-C79E | |
| Acer Swift 1 SF114-31-P6F6 | |
| Geekbench 4.4 | |
| 64 Bit Multi-Core Score | |
| Asus VivoBook Flip 12 TP203NAH-BP049T | |
| Acer Spin 1 SP111-31-C79E | |
| 64 Bit Single-Core Score | |
| Asus VivoBook Flip 12 TP203NAH-BP049T | |
| Acer Spin 1 SP111-31-C79E | |
| JetStream 1.1 - 1.1 Total | |
| Asus VivoBook Flip 12 TP203NAH-BP049T | |
| Dell Latitude 3189 | |
| Acer Spin 1 SP111-31-C79E | |
| Acer Swift 1 SF114-31-P6F6 | |
| HP Pavilion 11-k103ng x360 | |
| Medion Akoya E2215T | |
| Acer TravelMate B117-M-P16Q | |
| PCMark 8 Home Score Accelerated v2 | 1530 points | |
| PCMark 10 Score | 1181 points | |
Help | ||
| PCMark 8 - Home Score Accelerated v2 | |
| Dell Latitude 3189 | |
| Asus VivoBook Flip 12 TP203NAH-BP049T | |
| HP Pavilion 11-k103ng x360 | |
| Acer Spin 1 SP111-31-C79E | |
| Medion Akoya E2215T | |

| Acer Spin 1 SP111-31-C79E Toshiba MQ01ABF050 | Asus VivoBook Flip 12 TP203NAH-BP049T Seagate Mobile HDD 1TB ST1000LM035 | Dell Latitude 3189 Liteonit CV3-8D128 | Medion Akoya E2215T 64 GB eMMC Flash | HP Pavilion 11-k103ng x360 Hitachi Travelstar Z5K500 HTS545050A7E680 | |
|---|---|---|---|---|---|
| CrystalDiskMark 3.0 | -28% | 3912% | 729% | -7% | |
| Read Seq (MB/s) | 109.1 | 53.9 -51% | 408.4 274% | 169.6 55% | 106 -3% |
| Write Seq (MB/s) | 107.3 | 66.4 -38% | 214.3 100% | 39.77 -63% | 106.1 -1% |
| Read 512 (MB/s) | 35.89 | 22.62 -37% | 243.7 579% | 155.3 333% | 33.53 -7% |
| Write 512 (MB/s) | 45.28 | 67.3 49% | 170.6 277% | 27.45 -39% | 39.03 -14% |
| Read 4k (MB/s) | 0.482 | 0.378 -22% | 8.864 1739% | 13.09 2616% | 0.407 -16% |
| Write 4k (MB/s) | 1.037 | 0.263 -75% | 49.14 4639% | 7.915 663% | 1.026 -1% |
| Read 4k QD32 (MB/s) | 1.003 | 0.998 0% | 132.2 13080% | 15.11 1406% | 0.898 -10% |
| Write 4k QD32 (MB/s) | 1.043 | 0.518 -50% | 111.7 10609% | 10.05 864% | 1.003 -4% |
| 3DMark 11 Performance | 414 points | |
Help | ||
| 3DMark 11 - 1280x720 Performance GPU | |
| Dell Latitude 3189 | |
| Asus VivoBook Flip 12 TP203NAH-BP049T | |
| Acer Swift 1 SF114-31-P6F6 | |
| Acer TravelMate B117-M-P16Q | |
| HP 250 G5 Y1V08UT | |
| HP Pavilion 11-k103ng x360 | |
| Acer Spin 1 SP111-31-C79E | |
| Medion Akoya E2215T | |
| low | med. | high | ultra | |
|---|---|---|---|---|
| Dirt 3 (2011) | 40.1 | 14.7 | ||
| Deus Ex Human Revolution (2011) | 22.9 | 11.1 | ||
| The Elder Scrolls V: Skyrim (2011) | 11.2 | 7.6 | ||
| Anno 2070 (2011) | 27.8 | 12.2 | ||
| Dead Space 3 (2013) | 19.3 | 9.1 | ||
| Tomb Raider (2013) | 21.5 | 9.3 | ||
| BioShock Infinite (2013) | 16.2 | 8.8 | 7.9 | |
| GRID 2 (2013) | 29.3 | 14.4 | ||
| GRID: Autosport (2014) | 43.8 | 19.1 | ||
| Risen 3: Titan Lords (2014) | 10 | 6.3 | ||
| Sims 4 (2014) | 71.6 | 13.7 | ||
| F1 2014 (2014) | 22 | 16 | ||
| Dirt Rally (2015) | 28.5 | 12.5 | ||
| Metal Gear Solid V (2015) | 16.4 | 9.7 | ||
| Rocket League (2017) | 18.1 | 6.2 | ||
| Dirt 4 (2017) | 10 | 5.6 |
Noise level
| Idle |
| 30.3 / 30.6 / 30.6 dB(A) |
| HDD |
| 31.1 dB(A) |
| Load |
| 30.6 / 30.6 dB(A) |
 | ||
30 dB silent 40 dB(A) audible 50 dB(A) loud |
||
min: | ||
(+) The maximum temperature on the upper side is 38.5 °C / 101 F, compared to the average of 35.4 °C / 96 F, ranging from 19.6 to 60 °C for the class Convertible.
(-) The bottom heats up to a maximum of 46.4 °C / 116 F, compared to the average of 36.9 °C / 98 F
(+) In idle usage, the average temperature for the upper side is 27.4 °C / 81 F, compared to the device average of 30.3 °C / 87 F.
(+) The palmrests and touchpad are cooler than skin temperature with a maximum of 26.9 °C / 80.4 F and are therefore cool to the touch.
(±) The average temperature of the palmrest area of similar devices was 28 °C / 82.4 F (+1.1 °C / 2 F).
Acer Spin 1 SP111-31-C79E audio analysis
(-) | not very loud speakers (68 dB)
Bass 100 - 315 Hz
(±) | reduced bass - on average 13.2% lower than median
(+) | bass is linear (6.2% delta to prev. frequency)
Mids 400 - 2000 Hz
(+) | balanced mids - only 2.9% away from median
(+) | mids are linear (6% delta to prev. frequency)
Highs 2 - 16 kHz
(+) | balanced highs - only 4.3% away from median
(+) | highs are linear (6.4% delta to prev. frequency)
Overall 100 - 16.000 Hz
(±) | linearity of overall sound is average (17.5% difference to median)
Compared to same class
» 34% of all tested devices in this class were better, 8% similar, 58% worse
» The best had a delta of 6%, average was 20%, worst was 57%
Compared to all devices tested
» 34% of all tested devices were better, 8% similar, 58% worse
» The best had a delta of 4%, average was 23%, worst was 134%
Apple MacBook 12 (Early 2016) 1.1 GHz audio analysis
(+) | speakers can play relatively loud (83.6 dB)
Bass 100 - 315 Hz
(±) | reduced bass - on average 11.3% lower than median
(±) | linearity of bass is average (14.2% delta to prev. frequency)
Mids 400 - 2000 Hz
(+) | balanced mids - only 2.4% away from median
(+) | mids are linear (5.5% delta to prev. frequency)
Highs 2 - 16 kHz
(+) | balanced highs - only 2% away from median
(+) | highs are linear (4.5% delta to prev. frequency)
Overall 100 - 16.000 Hz
(+) | overall sound is linear (10.2% difference to median)
Compared to same class
» 7% of all tested devices in this class were better, 2% similar, 90% worse
» The best had a delta of 5%, average was 18%, worst was 53%
Compared to all devices tested
» 5% of all tested devices were better, 1% similar, 94% worse
» The best had a delta of 4%, average was 23%, worst was 134%
| Off / Standby | |
| Idle | |
| Load |
|
Key:
min: | |
| Battery Runtime - WiFi Websurfing | |
| Acer Spin 1 SP111-31-C79E | |
| Medion Akoya E2215T | |
| Asus VivoBook Flip 12 TP203NAH-BP049T | |
| HP Pavilion 11-k103ng x360 | |
Pros
Cons
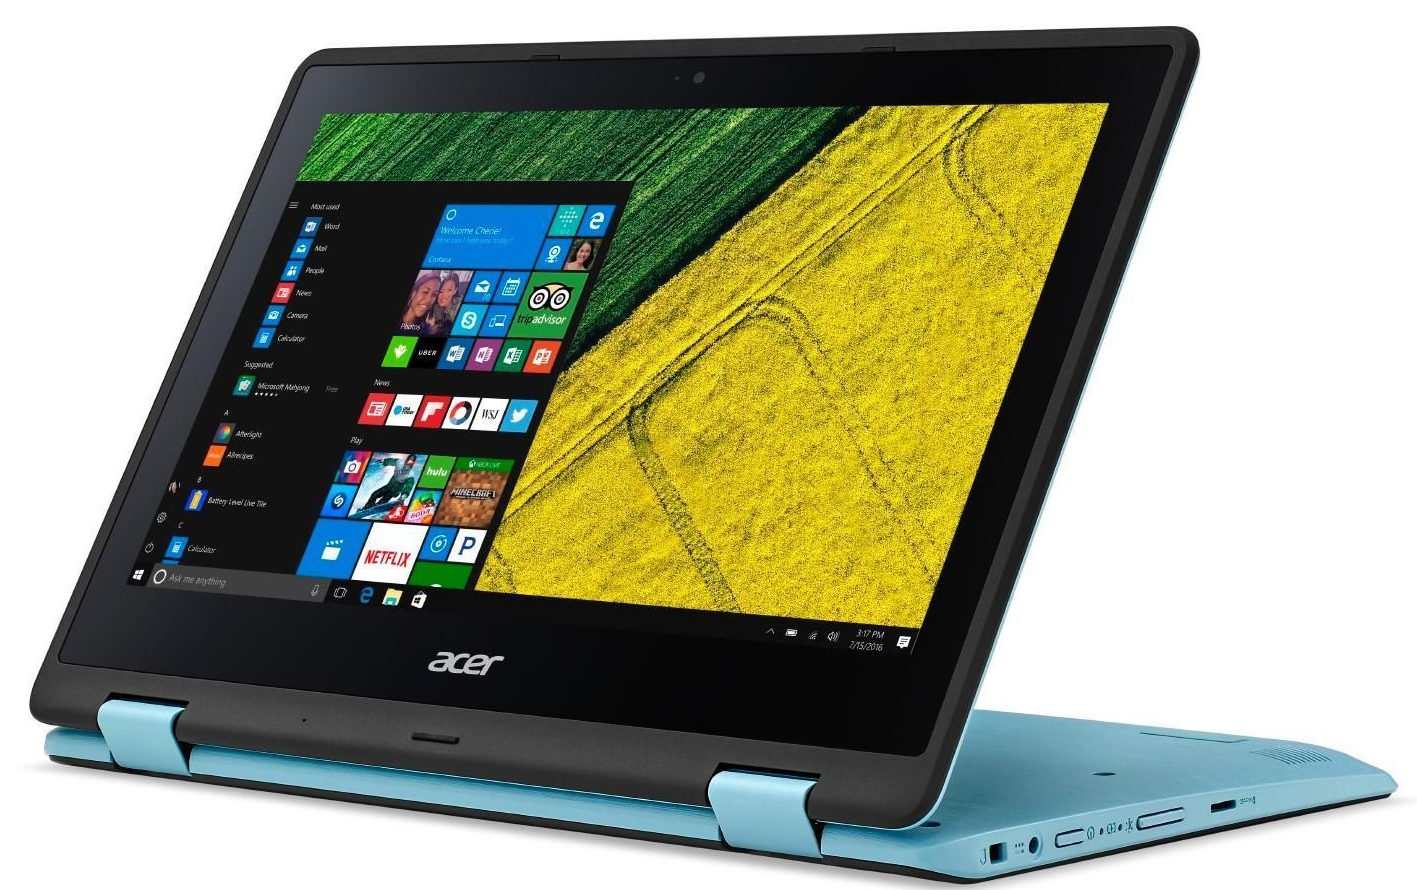
Spin 1所搭载的 Appllo Lake 四核处理器为办公工作及上网冲浪提供了足够的性能。其GPU自带的解码器使得所有常见格式的视频能够播放。
它并不缺乏储存空间,宏碁提供了500GB的机械硬盘。若想将机械硬盘换为固态硬盘,则需要打开外壳。因为宏碁并没有预留维修窗。
Spin 1 是一台持久的写作及上网设备。
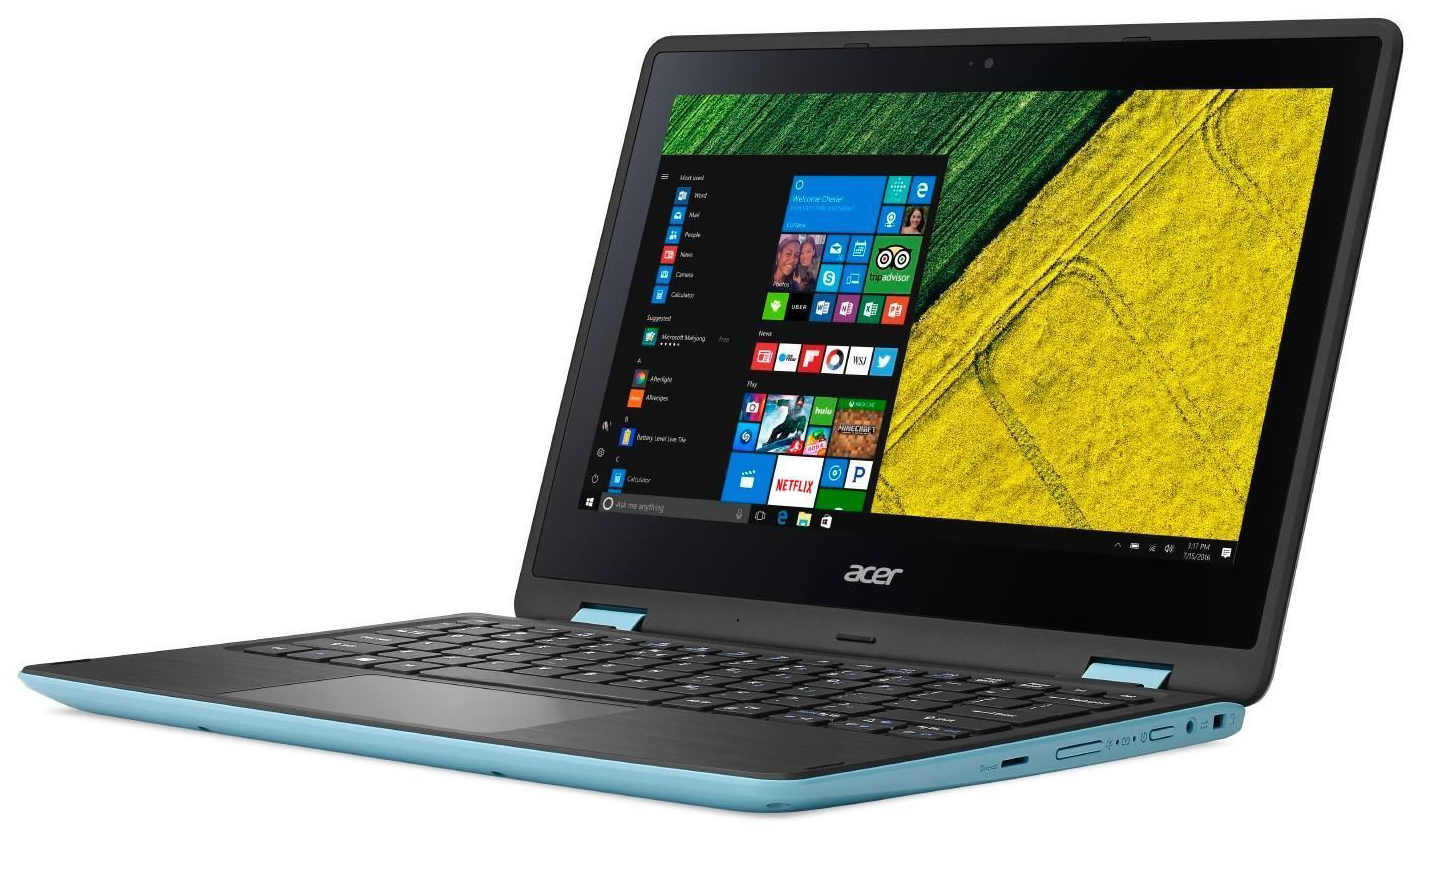
小尺寸笔记本常常能够在电池续航时间上找到发光点。在我们的模拟现实WLAN测试中,这台变形本取得了9.5小时的续航时间。内置键盘给我们留下了很好的印象也合适很频繁的打字操作。全高清屏幕有着出色的视角,优秀的对比度,以及极其出色的色彩还原能力。但其亮度略有不足。
注:本文是基于完整评测的缩减版本,阅读完整的英文评测,请点击这里。
Acer Spin 1 SP111-31-C79E
- 07/05/2017 v6 (old)
Sascha Mölck