惠普 ProBook 430 G4 (酷睿 i7, 全高清) 笔记本电脑简短评测
| SD Card Reader | |
| average JPG Copy Test (av. of 3 runs) | |
| Dell XPS 13 9360 FHD i5 | |
| Acer Aspire S 13 S5-371-71QZ | |
| HP ProBook 430 G4-Y8B47EA | |
| Lenovo IdeaPad 710S-13ISK | |
| Lenovo ThinkPad 13-20GKS01100 | |
| maximum AS SSD Seq Read Test (1GB) | |
| Dell XPS 13 9360 FHD i5 | |
| HP ProBook 430 G4-Y8B47EA | |
| Acer Aspire S 13 S5-371-71QZ | |
| Lenovo IdeaPad 710S-13ISK | |
| Lenovo ThinkPad 13-20GKS01100 | |
| Networking | |
| iperf Server (receive) TCP 1 m | |
| HP ProBook 450 G4 Y8B60EA | |
| HP ProBook 440 G4-Y8B51EA | |
| HP ProBook 430 G4-Y8B47EA | |
| Acer Aspire S 13 S5-371-71QZ | |
| iperf Client (transmit) TCP 1 m | |
| HP ProBook 450 G4 Y8B60EA | |
| HP ProBook 440 G4-Y8B51EA | |
| HP ProBook 430 G4-Y8B47EA | |
| Acer Aspire S 13 S5-371-71QZ | |
Screen Flickering / PWM (Pulse-Width Modulation)
| Screen flickering / PWM not detected | ||
In comparison: 52 % of all tested devices do not use PWM to dim the display. If PWM was detected, an average of 7754 (minimum: 5 - maximum: 343500) Hz was measured. | ||
| |||||||||||||||||||||||||
Brightness Distribution: 92 %
Center on Battery: 252 cd/m²
Contrast: 791:1 (Black: 0.32 cd/m²)
ΔE ColorChecker Calman: 5.28 | ∀{0.5-29.43 Ø4.71}
ΔE Greyscale Calman: 3.8 | ∀{0.09-98 Ø4.96}
57.6% sRGB (Argyll 1.6.3 3D)
36.7% AdobeRGB 1998 (Argyll 1.6.3 3D)
39.85% AdobeRGB 1998 (Argyll 3D)
57.8% sRGB (Argyll 3D)
38.55% Display P3 (Argyll 3D)
Gamma: 2.3
CCT: 6646 K
| HP ProBook 430 G4-Y8B47EA LGD052D, , 1920x1080, 13.3" | Acer Aspire S 13 S5-371-71QZ AUO B133HAN04.1, , 1920x1080, 13.3" | Dell XPS 13 9360 FHD i5 Sharp SHP1449 LQ133M1, , 1920x1080, 13.3" | Lenovo IdeaPad 710S-13ISK Sharp SHP 1447 / LQ133M1JW15, , 1920x1080, 13.3" | Lenovo ThinkPad 13-20GKS01100 LP133WF2-SPL1, , 1920x1080, 13.3" | HP ProBook 430 G3 P5T00ES Samsung, , 1366x768, 13.3" | |
|---|---|---|---|---|---|---|
| Display | 27% | 71% | -1% | -7% | ||
| Display P3 Coverage (%) | 38.55 | 48.94 27% | 66.4 72% | 38.35 -1% | 35.87 -7% | |
| sRGB Coverage (%) | 57.8 | 73.3 27% | 97.5 69% | 57.4 -1% | 54 -7% | |
| AdobeRGB 1998 Coverage (%) | 39.85 | 50.5 27% | 68.4 72% | 39.66 0% | 37.06 -7% | |
| Response Times | -15% | -2% | -7% | -2% | -26% | |
| Response Time Grey 50% / Grey 80% * (ms) | 42.4 ? | 50 ? -18% | 32.8 ? 23% | 52.4 ? -24% | 43.2 ? -2% | 54.4 ? -28% |
| Response Time Black / White * (ms) | 26.4 ? | 29.6 ? -12% | 33.2 ? -26% | 23.6 ? 11% | 26.8 ? -2% | 32.8 ? -24% |
| PWM Frequency (Hz) | 220 ? | 192 ? | ||||
| Screen | 24% | 22% | 18% | 3% | -68% | |
| Brightness middle (cd/m²) | 253 | 375 48% | 351.2 39% | 344 36% | 233 -8% | 212 -16% |
| Brightness (cd/m²) | 249 | 358 44% | 325 31% | 326 31% | 227 -9% | 205 -18% |
| Brightness Distribution (%) | 92 | 87 -5% | 89 -3% | 87 -5% | 86 -7% | 90 -2% |
| Black Level * (cd/m²) | 0.32 | 0.39 -22% | 0.195 39% | 0.36 -13% | 0.22 31% | 0.71 -122% |
| Contrast (:1) | 791 | 962 22% | 1801 128% | 956 21% | 1059 34% | 299 -62% |
| Colorchecker dE 2000 * | 5.28 | 4.6 13% | 7.4 -40% | 6.09 -15% | 5.41 -2% | 12.06 -128% |
| Colorchecker dE 2000 max. * | 13.66 | 8.8 36% | 9.08 34% | 10 27% | 13.61 -0% | |
| Greyscale dE 2000 * | 3.8 | 4 -5% | 6.71 -77% | 5.36 -41% | 4.15 -9% | 13.41 -253% |
| Gamma | 2.3 96% | 2.34 94% | 2.74 80% | 2.01 109% | 2.45 90% | 2.41 91% |
| CCT | 6646 98% | 7304 89% | 7222 90% | 7230 90% | 6773 96% | 15382 42% |
| Color Space (Percent of AdobeRGB 1998) (%) | 36.7 | 57.9 58% | 50.48 38% | 62.25 70% | 36.52 0% | 34.3 -7% |
| Color Space (Percent of sRGB) (%) | 57.6 | 88.7 54% | 73.31 27% | 97.54 69% | 57.16 -1% | 54.2 -6% |
| Total Average (Program / Settings) | 5% /
18% | 16% /
20% | 27% /
25% | 0% /
2% | -34% /
-49% |
* ... smaller is better
Display Response Times
| ↔ Response Time Black to White | ||
|---|---|---|
| 26.4 ms ... rise ↗ and fall ↘ combined | ↗ 6.4 ms rise | 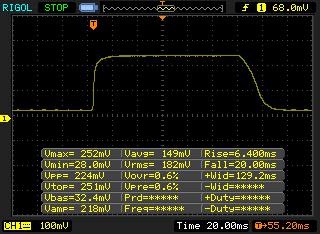 |
| ↘ 20 ms fall | ||
| The screen shows relatively slow response rates in our tests and may be too slow for gamers. In comparison, all tested devices range from 0.1 (minimum) to 240 (maximum) ms. » 66 % of all devices are better. This means that the measured response time is worse than the average of all tested devices (19.8 ms). | ||
| ↔ Response Time 50% Grey to 80% Grey | ||
| 42.4 ms ... rise ↗ and fall ↘ combined | ↗ 15.6 ms rise | 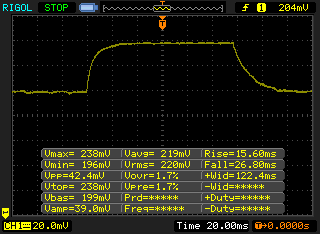 |
| ↘ 26.8 ms fall | ||
| The screen shows slow response rates in our tests and will be unsatisfactory for gamers. In comparison, all tested devices range from 0.165 (minimum) to 636 (maximum) ms. » 70 % of all devices are better. This means that the measured response time is worse than the average of all tested devices (31 ms). | ||
| HP ProBook 430 G4-Y8B47EA SanDisk SD8SNAT256G1002 | Acer Aspire S 13 S5-371-71QZ LiteOn CV1-8B512 | Dell XPS 13 9360 FHD i5 Toshiba NVMe THNSN5256GPUK | Lenovo IdeaPad 710S-13ISK Samsung PM951 NVMe MZVLV256 | Lenovo ThinkPad 13-20GKS01100 Samsung SSD PM871 MZNLN256HCHP | |
|---|---|---|---|---|---|
| CrystalDiskMark 3.0 | 27% | 109% | 92% | 26% | |
| Read Seq (MB/s) | 505 | 502 -1% | 1233 144% | 1193 136% | 461.7 -9% |
| Write Seq (MB/s) | 328.9 | 418.9 27% | 733 123% | 309.6 -6% | 297.8 -9% |
| Read 512 (MB/s) | 313.6 | 341.3 9% | 1036 230% | 613 95% | 351.6 12% |
| Write 512 (MB/s) | 301 | 389.7 29% | 439.9 46% | 311 3% | 298.4 -1% |
| Read 4k (MB/s) | 21.69 | 29.69 37% | 29.31 35% | 42.43 96% | 31.85 47% |
| Write 4k (MB/s) | 80.4 | 86.8 8% | 116.9 45% | 144.9 80% | 68.5 -15% |
| Read 4k QD32 (MB/s) | 132.2 | 301.3 128% | 479.2 262% | 549 315% | 360.9 173% |
| Write 4k QD32 (MB/s) | 258.8 | 211.2 -18% | 218.3 -16% | 311.3 20% | 276.2 7% |

| PCMark 7 Score | 5333 points | |
| PCMark 8 Home Score Accelerated v2 | 3554 points | |
| PCMark 8 Creative Score Accelerated v2 | 4588 points | |
| PCMark 8 Work Score Accelerated v2 | 4717 points | |
Help | ||
| 3DMark 11 - 1280x720 Performance GPU | |
| HP ProBook 440 G4-Y8B51EA | |
| Lenovo IdeaPad 710S-13ISK | |
| Lenovo Ideapad 310-15ISK | |
| Dell XPS 13 9360 FHD i5 | |
| HP ProBook 430 G4-Y8B47EA | |
| Acer Aspire S 13 S5-371-71QZ | |
| Lenovo ThinkPad 13-20GKS01100 | |
| 3DMark | |
| 1280x720 Cloud Gate Standard Graphics | |
| Lenovo IdeaPad 710S-13ISK | |
| HP ProBook 440 G4-Y8B51EA | |
| Dell XPS 13 9360 FHD i5 | |
| HP ProBook 430 G4-Y8B47EA | |
| Lenovo ThinkPad 13-20GKS01100 | |
| 1920x1080 Fire Strike Graphics | |
| HP ProBook 440 G4-Y8B51EA | |
| Dell XPS 13 9360 FHD i5 | |
| Acer Aspire S 13 S5-371-71QZ | |
| HP ProBook 430 G4-Y8B47EA | |
| Lenovo ThinkPad 13-20GKS01100 | |
| 3DMark 11 Performance | 1569 points | |
| 3DMark Cloud Gate Standard Score | 5520 points | |
| 3DMark Fire Strike Score | 719 points | |
Help | ||
| low | med. | high | ultra | |
|---|---|---|---|---|
| Tomb Raider (2013) | 67.6 | 34.3 | 20 | 9.8 |
| BioShock Infinite (2013) | 42.6 | 25.1 | 20.3 | 6.5 |
| The Witcher 3 (2015) | 13.3 |
Noise level
| Idle |
| 29.1 / 29.1 / 29.1 dB(A) |
| HDD |
| 29.8 dB(A) |
| Load |
| 33.4 / 36 dB(A) |
 | ||
30 dB silent 40 dB(A) audible 50 dB(A) loud |
||
min: | ||
(+) The maximum temperature on the upper side is 38.7 °C / 102 F, compared to the average of 34.3 °C / 94 F, ranging from 21.2 to 62.5 °C for the class Office.
(+) The bottom heats up to a maximum of 39.4 °C / 103 F, compared to the average of 36.8 °C / 98 F
(+) In idle usage, the average temperature for the upper side is 27.2 °C / 81 F, compared to the device average of 29.5 °C / 85 F.
(+) The palmrests and touchpad are cooler than skin temperature with a maximum of 26.8 °C / 80.2 F and are therefore cool to the touch.
(±) The average temperature of the palmrest area of similar devices was 27.5 °C / 81.5 F (+0.7 °C / 1.3 F).
HP ProBook 430 G4-Y8B47EA audio analysis
(+) | speakers can play relatively loud (84.6 dB)
Bass 100 - 315 Hz
(-) | nearly no bass - on average 19.7% lower than median
(±) | linearity of bass is average (13.1% delta to prev. frequency)
Mids 400 - 2000 Hz
(+) | balanced mids - only 3.8% away from median
(+) | mids are linear (6.8% delta to prev. frequency)
Highs 2 - 16 kHz
(±) | higher highs - on average 5.7% higher than median
(+) | highs are linear (5.4% delta to prev. frequency)
Overall 100 - 16.000 Hz
(±) | linearity of overall sound is average (18.9% difference to median)
Compared to same class
» 36% of all tested devices in this class were better, 7% similar, 57% worse
» The best had a delta of 7%, average was 21%, worst was 53%
Compared to all devices tested
» 44% of all tested devices were better, 8% similar, 48% worse
» The best had a delta of 4%, average was 23%, worst was 134%
Acer Aspire S 13 S5-371-71QZ audio analysis
(±) | speaker loudness is average but good (80 dB)
Bass 100 - 315 Hz
(±) | reduced bass - on average 9.8% lower than median
(±) | linearity of bass is average (11.9% delta to prev. frequency)
Mids 400 - 2000 Hz
(±) | higher mids - on average 6.2% higher than median
(±) | linearity of mids is average (7.6% delta to prev. frequency)
Highs 2 - 16 kHz
(+) | balanced highs - only 3.1% away from median
(+) | highs are linear (4.6% delta to prev. frequency)
Overall 100 - 16.000 Hz
(±) | linearity of overall sound is average (17.2% difference to median)
Compared to same class
» 44% of all tested devices in this class were better, 9% similar, 47% worse
» The best had a delta of 5%, average was 18%, worst was 53%
Compared to all devices tested
» 32% of all tested devices were better, 8% similar, 60% worse
» The best had a delta of 4%, average was 23%, worst was 134%
| Off / Standby | |
| Idle | |
| Load |
|
Key:
min: | |
| HP ProBook 430 G4-Y8B47EA i7-7500U, HD Graphics 620 | Acer Aspire S 13 S5-371-71QZ 6500U, HD Graphics 520 | Dell XPS 13 9360 FHD i5 i5-7200U, HD Graphics 620 | Lenovo IdeaPad 710S-13ISK 6560U, Iris Graphics 540 | Lenovo ThinkPad 13-20GKS01100 6200U, HD Graphics 520 | |
|---|---|---|---|---|---|
| Power Consumption | 2% | 24% | -7% | 18% | |
| Idle Minimum * (Watt) | 4.2 | 4.1 2% | 4.1 2% | 3.3 21% | 3.1 26% |
| Idle Average * (Watt) | 6.5 | 6.7 -3% | 4.2 35% | 7.4 -14% | 5.5 15% |
| Idle Maximum * (Watt) | 7.2 | 7.4 -3% | 5.1 29% | 8.2 -14% | 6 17% |
| Load Average * (Watt) | 28.7 | 32.4 -13% | 22.1 23% | 36.5 -27% | 25.8 10% |
| Load Maximum * (Watt) | 43.5 | 32.4 26% | 29.4 32% | 43.7 -0% | 33.6 23% |
* ... smaller is better
| HP ProBook 430 G4-Y8B47EA i7-7500U, HD Graphics 620, 48 Wh | Acer Aspire S 13 S5-371-71QZ 6500U, HD Graphics 520, 45 Wh | Dell XPS 13 9360 FHD i5 i5-7200U, HD Graphics 620, 60 Wh | Lenovo IdeaPad 710S-13ISK 6560U, Iris Graphics 540, 46 Wh | Lenovo ThinkPad 13-20GKS01100 6200U, HD Graphics 520, 42 Wh | HP ProBook 430 G3 P5T00ES 6200U, HD Graphics 520, 44 Wh | |
|---|---|---|---|---|---|---|
| Battery runtime | -7% | 29% | -18% | -12% | -33% | |
| Reader / Idle (h) | 15.9 | 17.1 8% | 21.6 36% | 13.5 -15% | 15.7 -1% | 7.5 -53% |
| H.264 (h) | 8.7 | 8.1 -7% | 7.8 -10% | 5.6 -36% | ||
| WiFi v1.3 (h) | 7.2 | 7.9 10% | 11.3 57% | 7 -3% | 6.2 -14% | 6.3 -12% |
| Load (h) | 2.8 | 1.7 -39% | 2.6 -7% | 1.5 -46% | 2.2 -21% | 2 -29% |
Pros
Cons
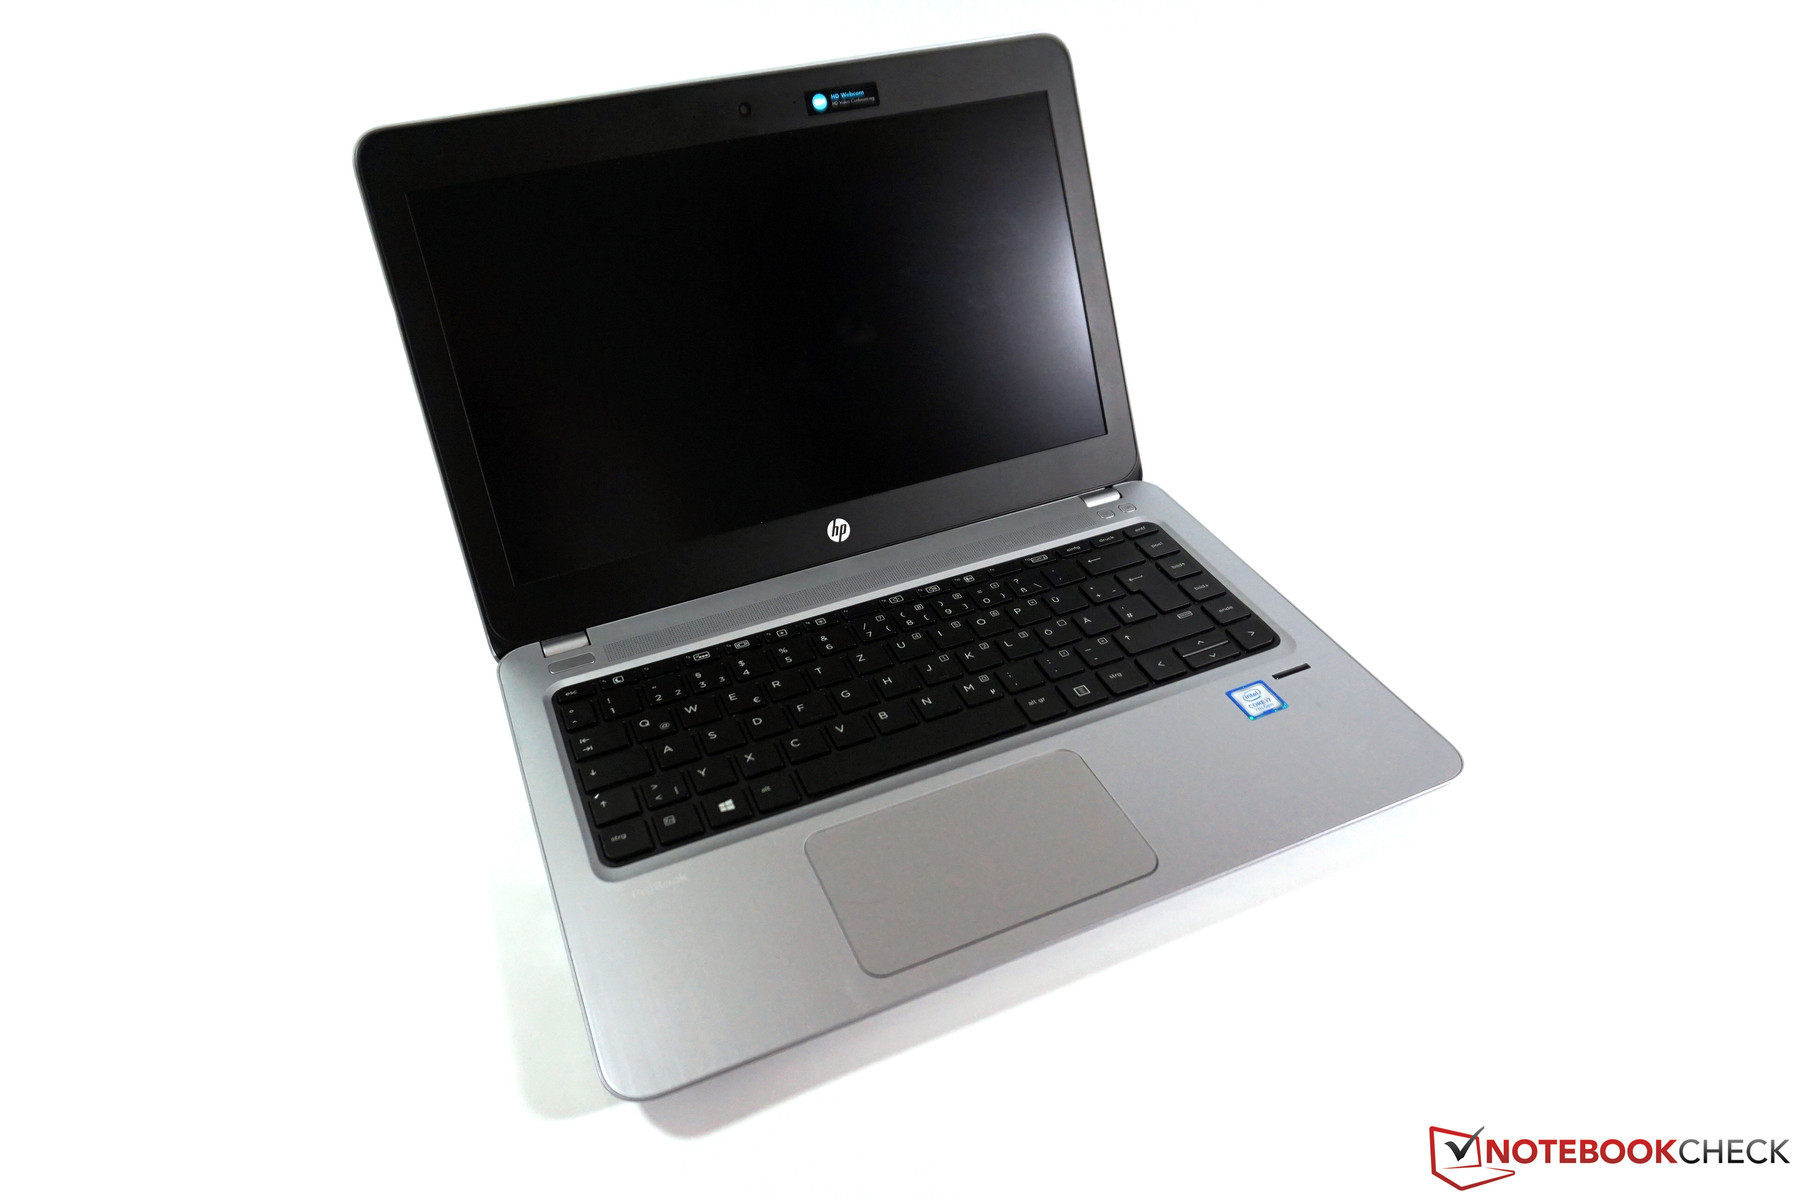
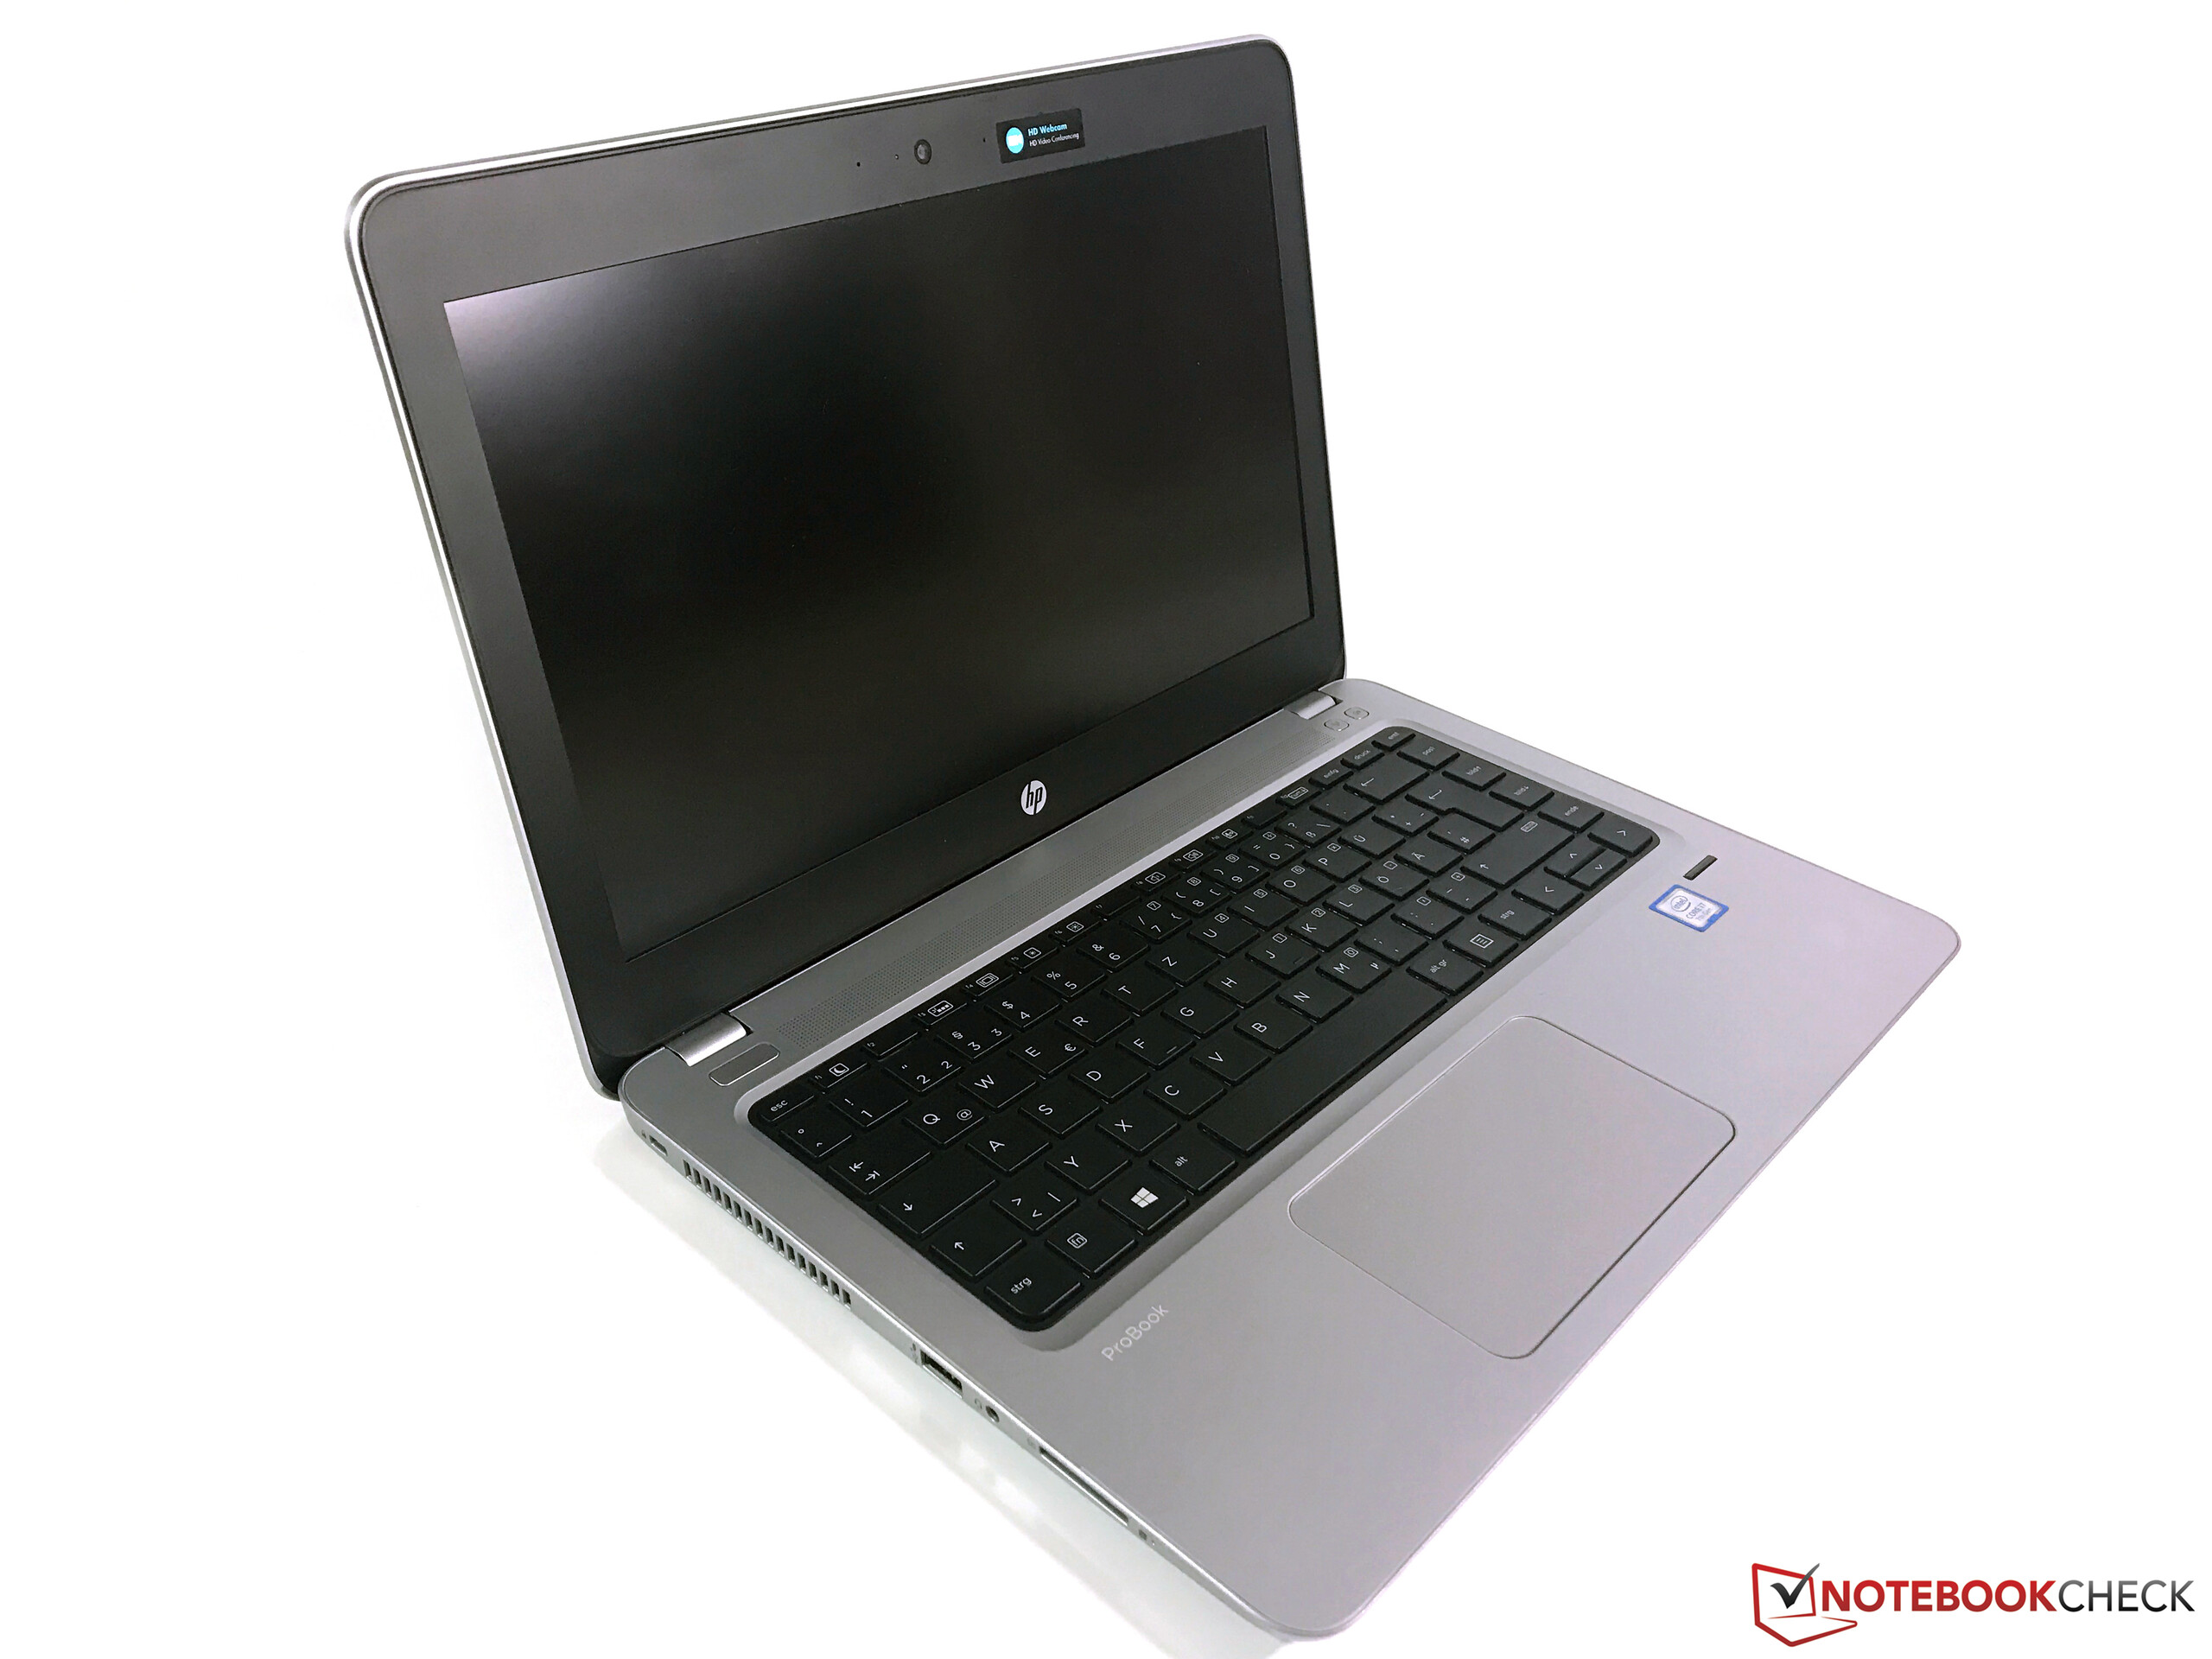
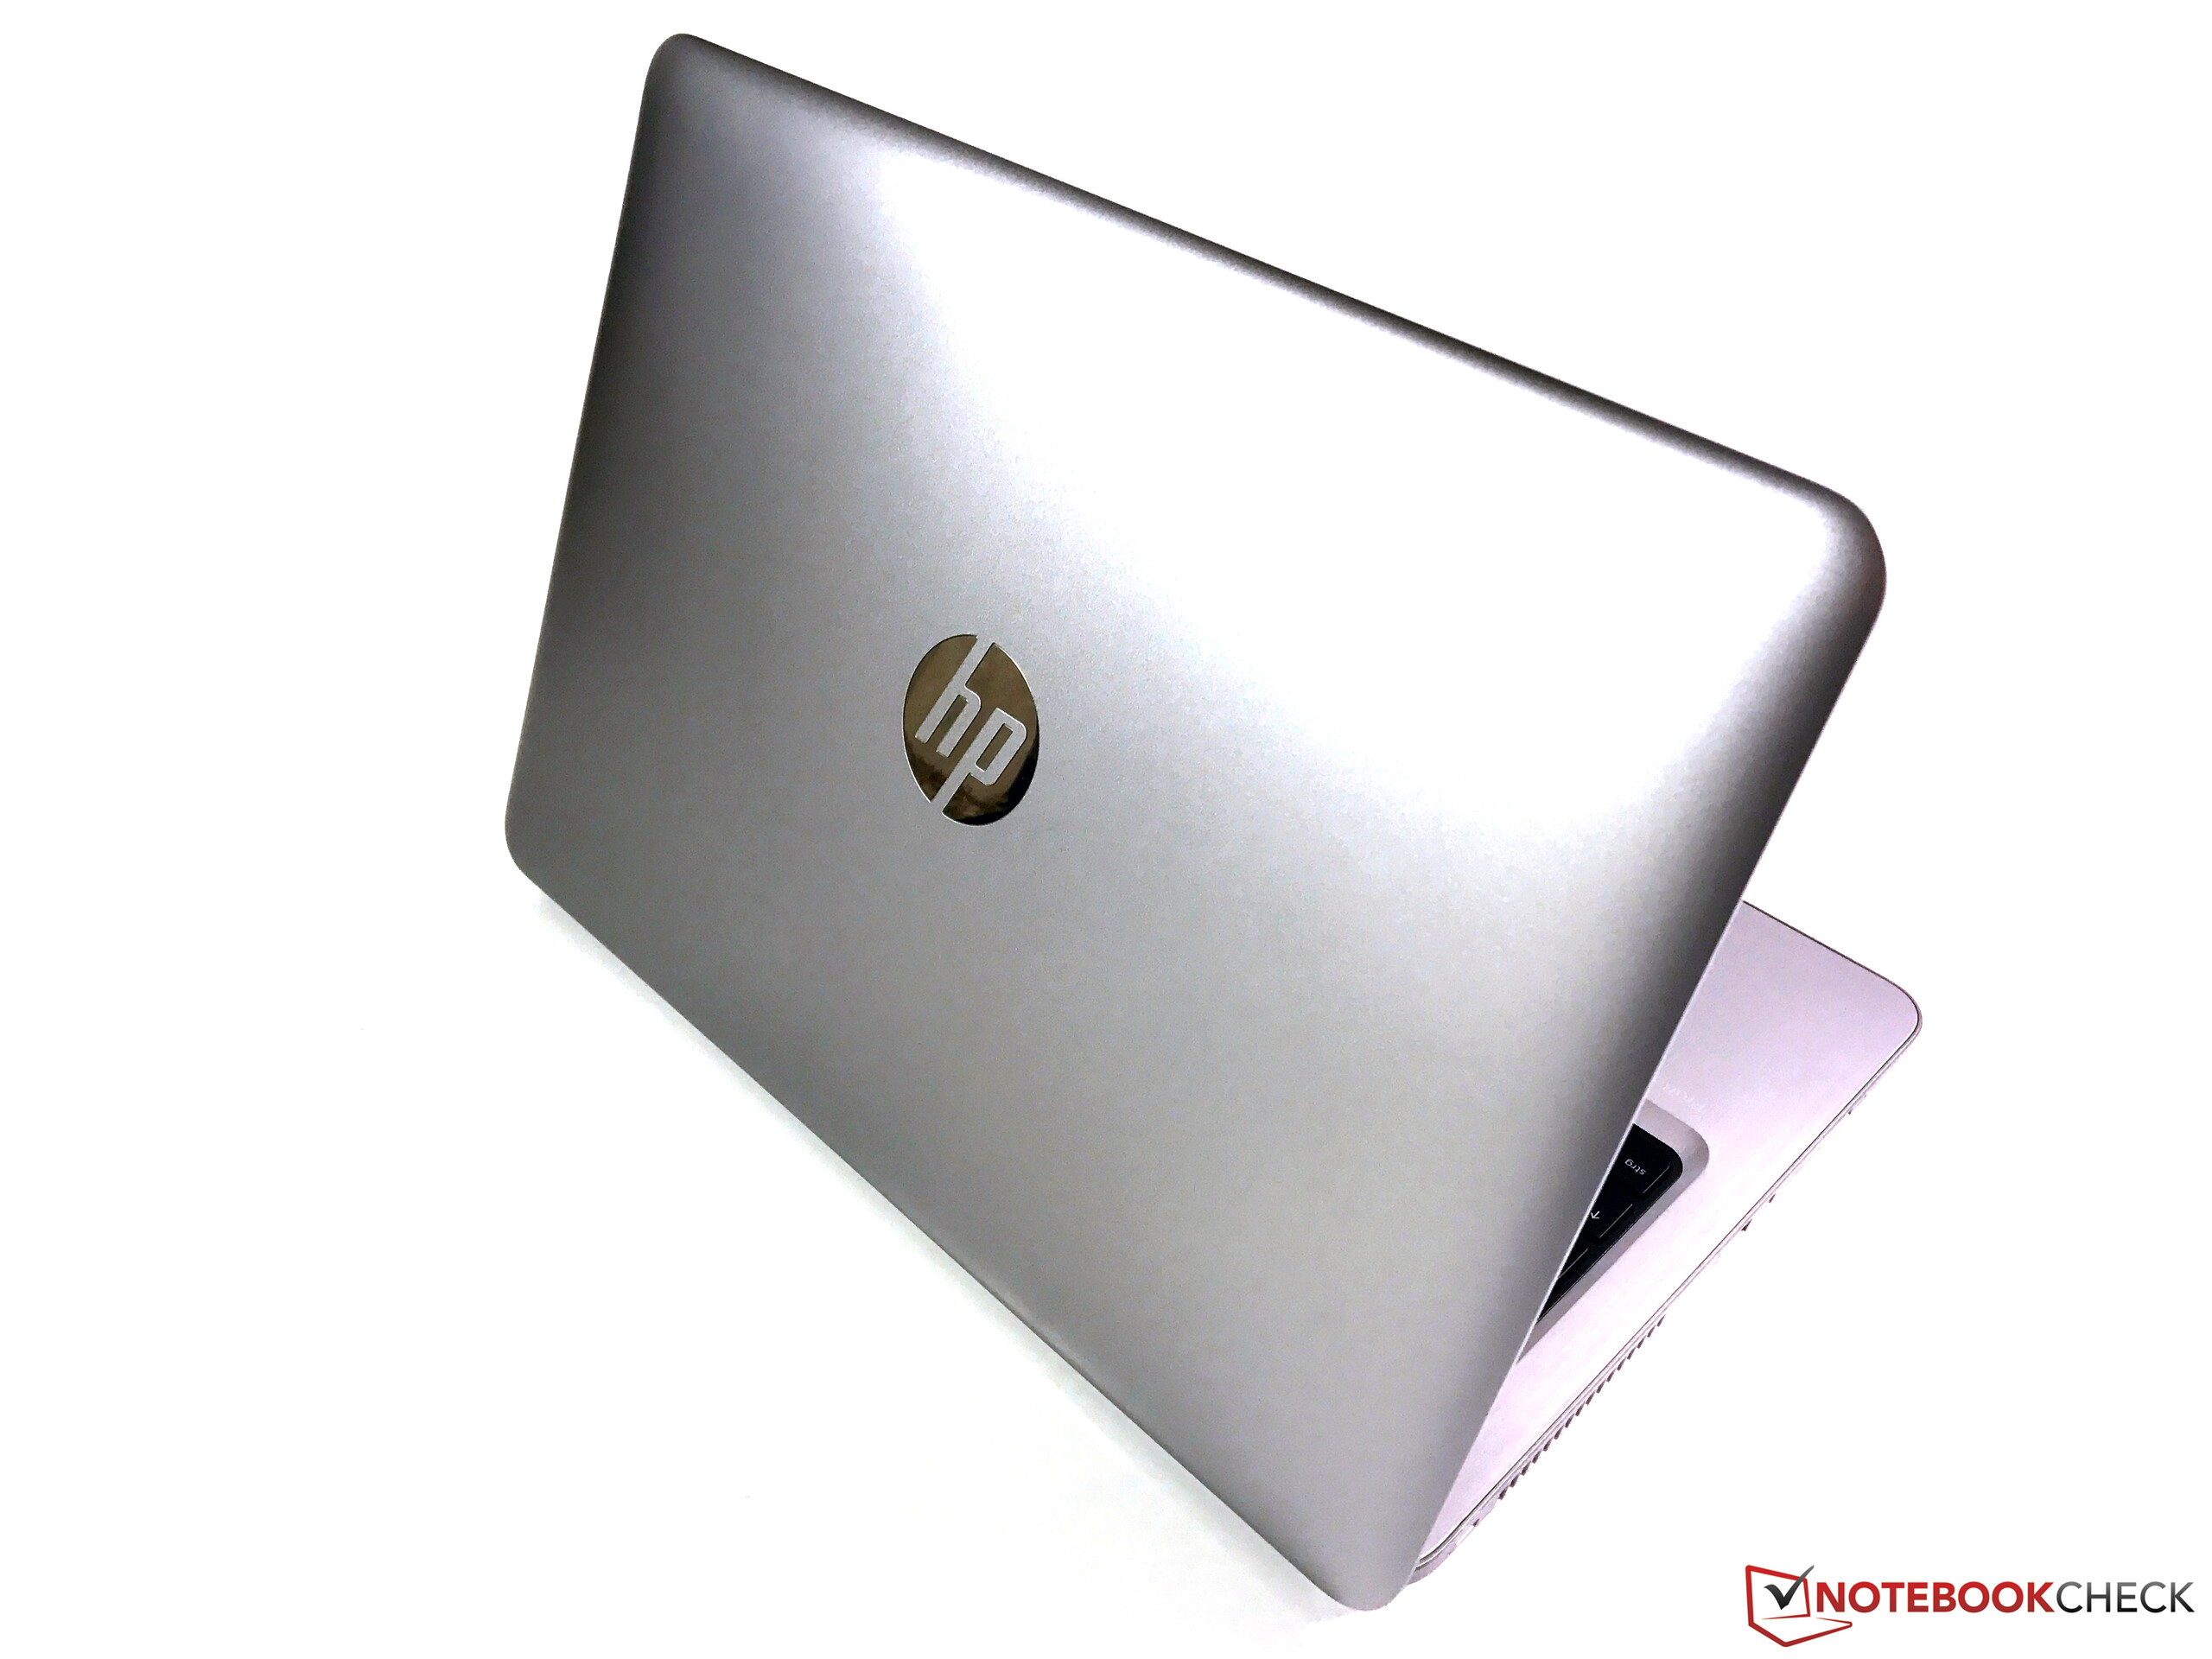
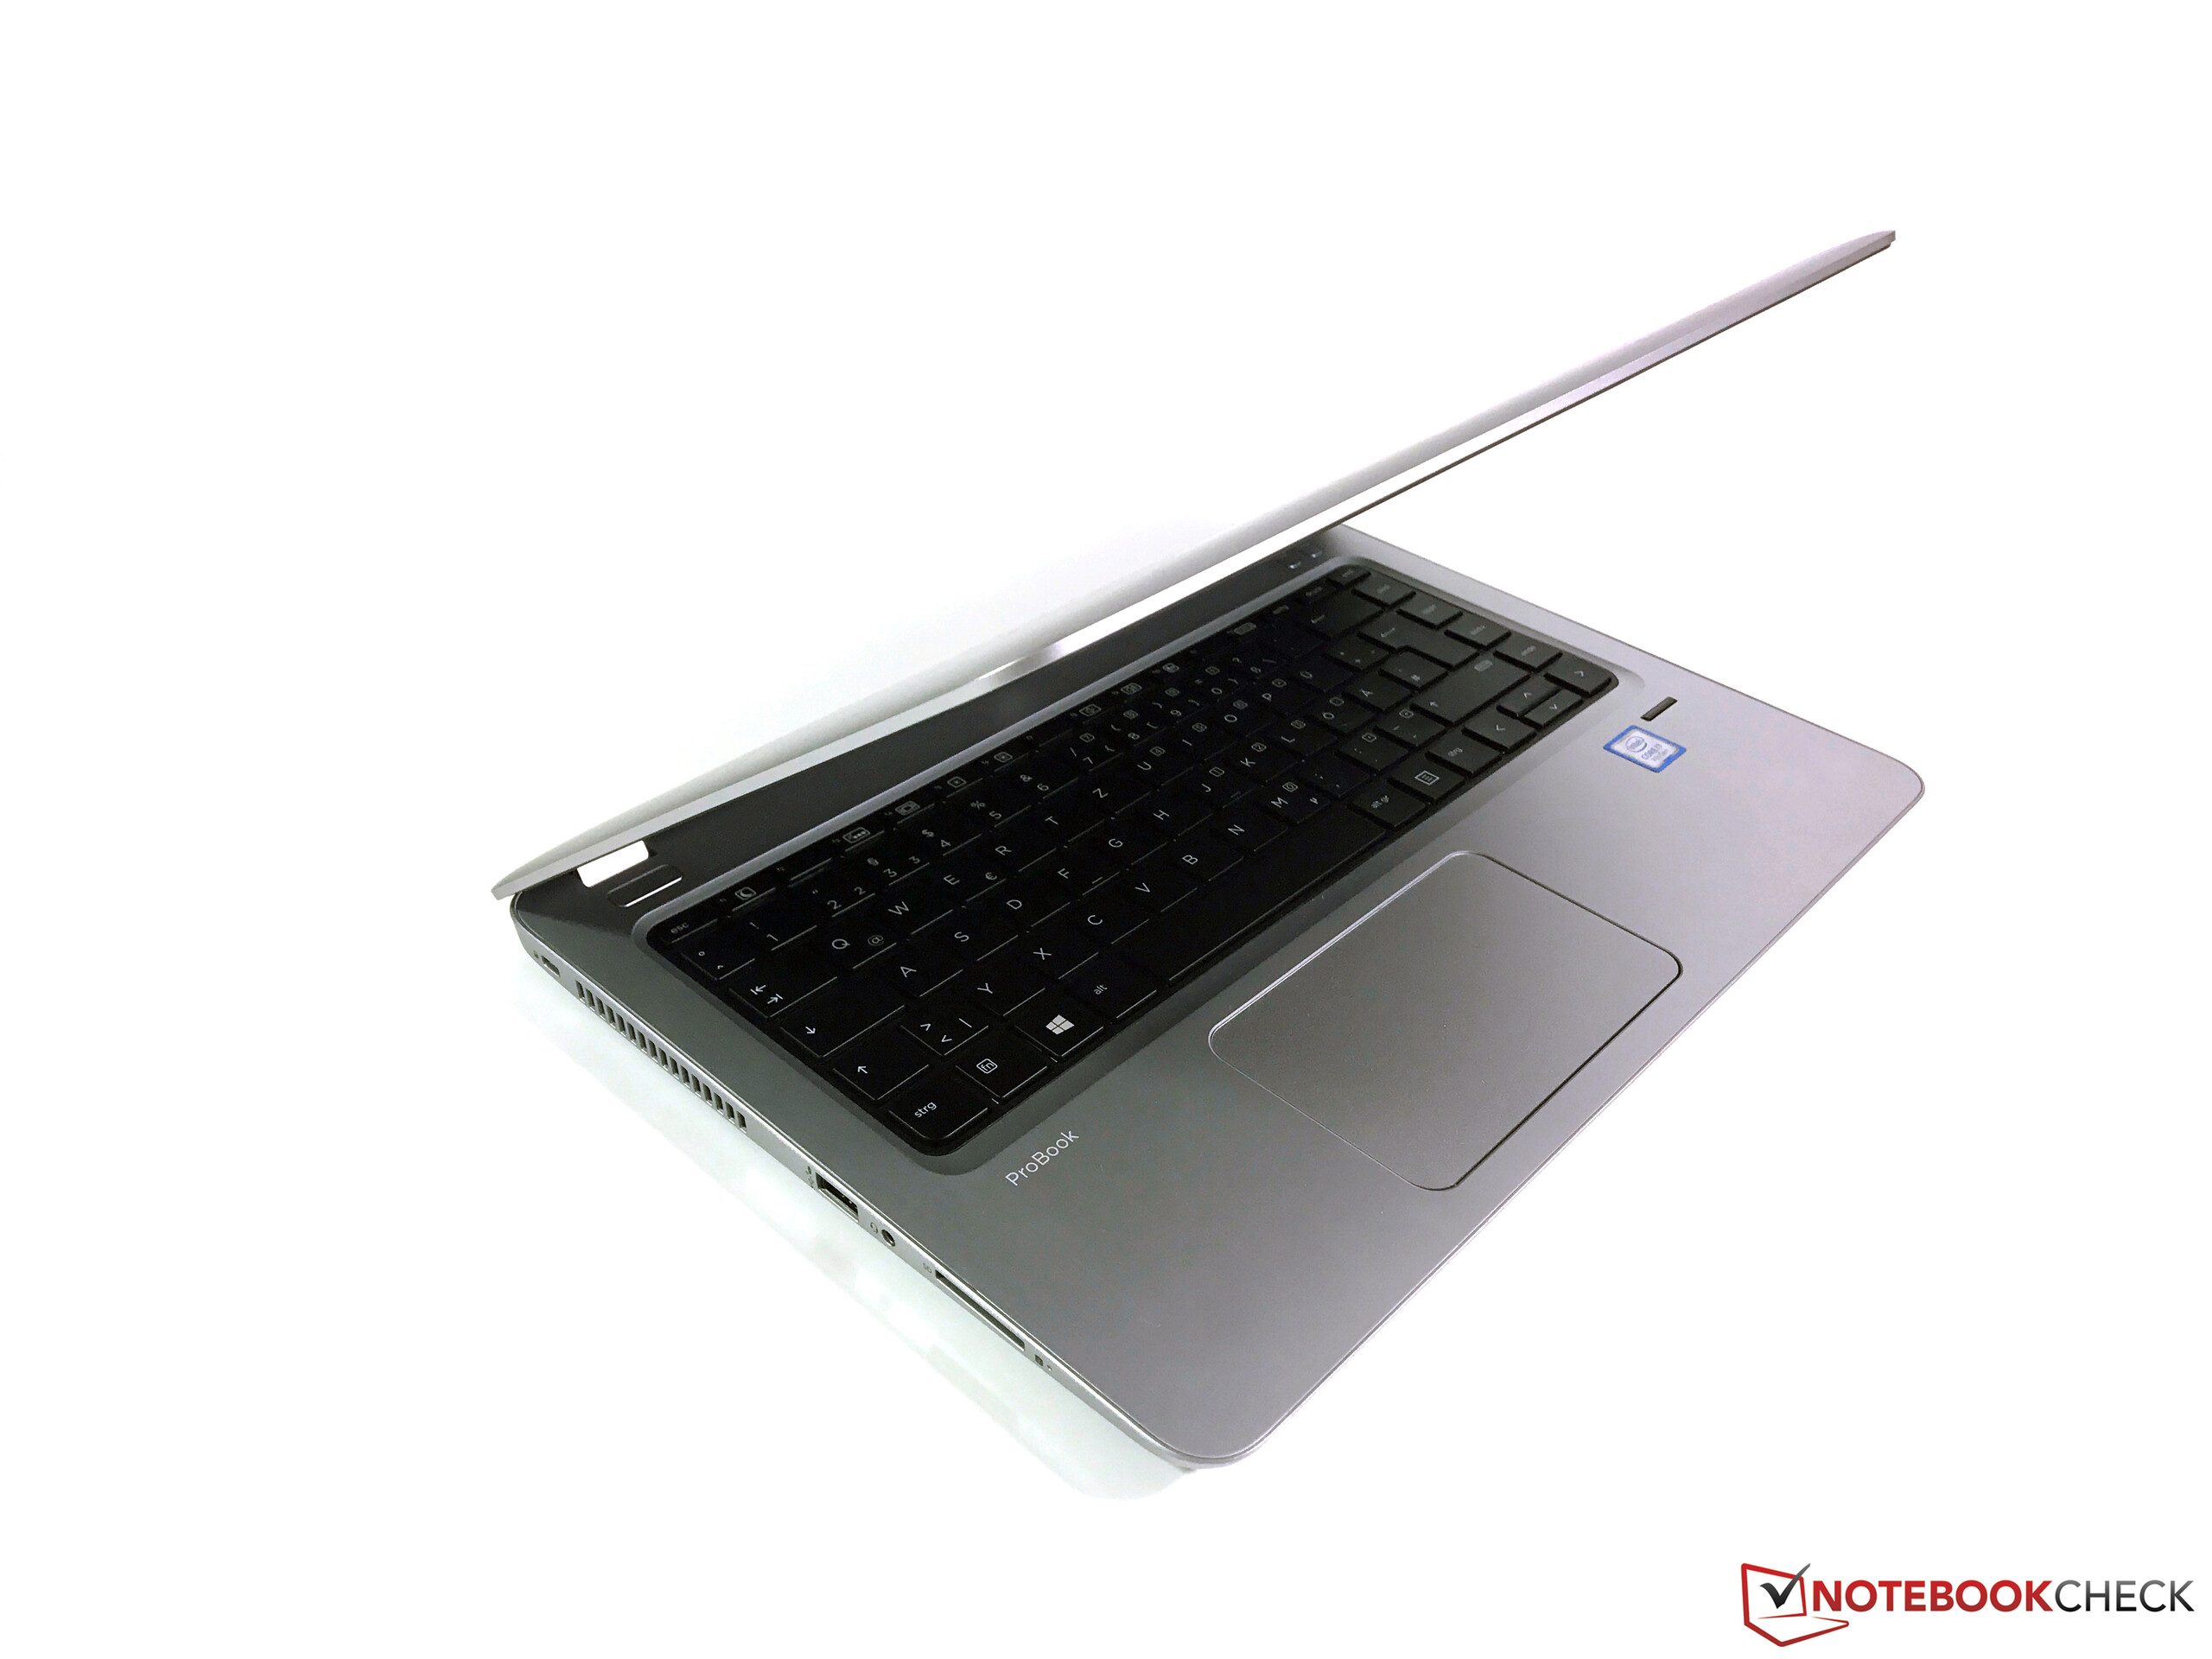
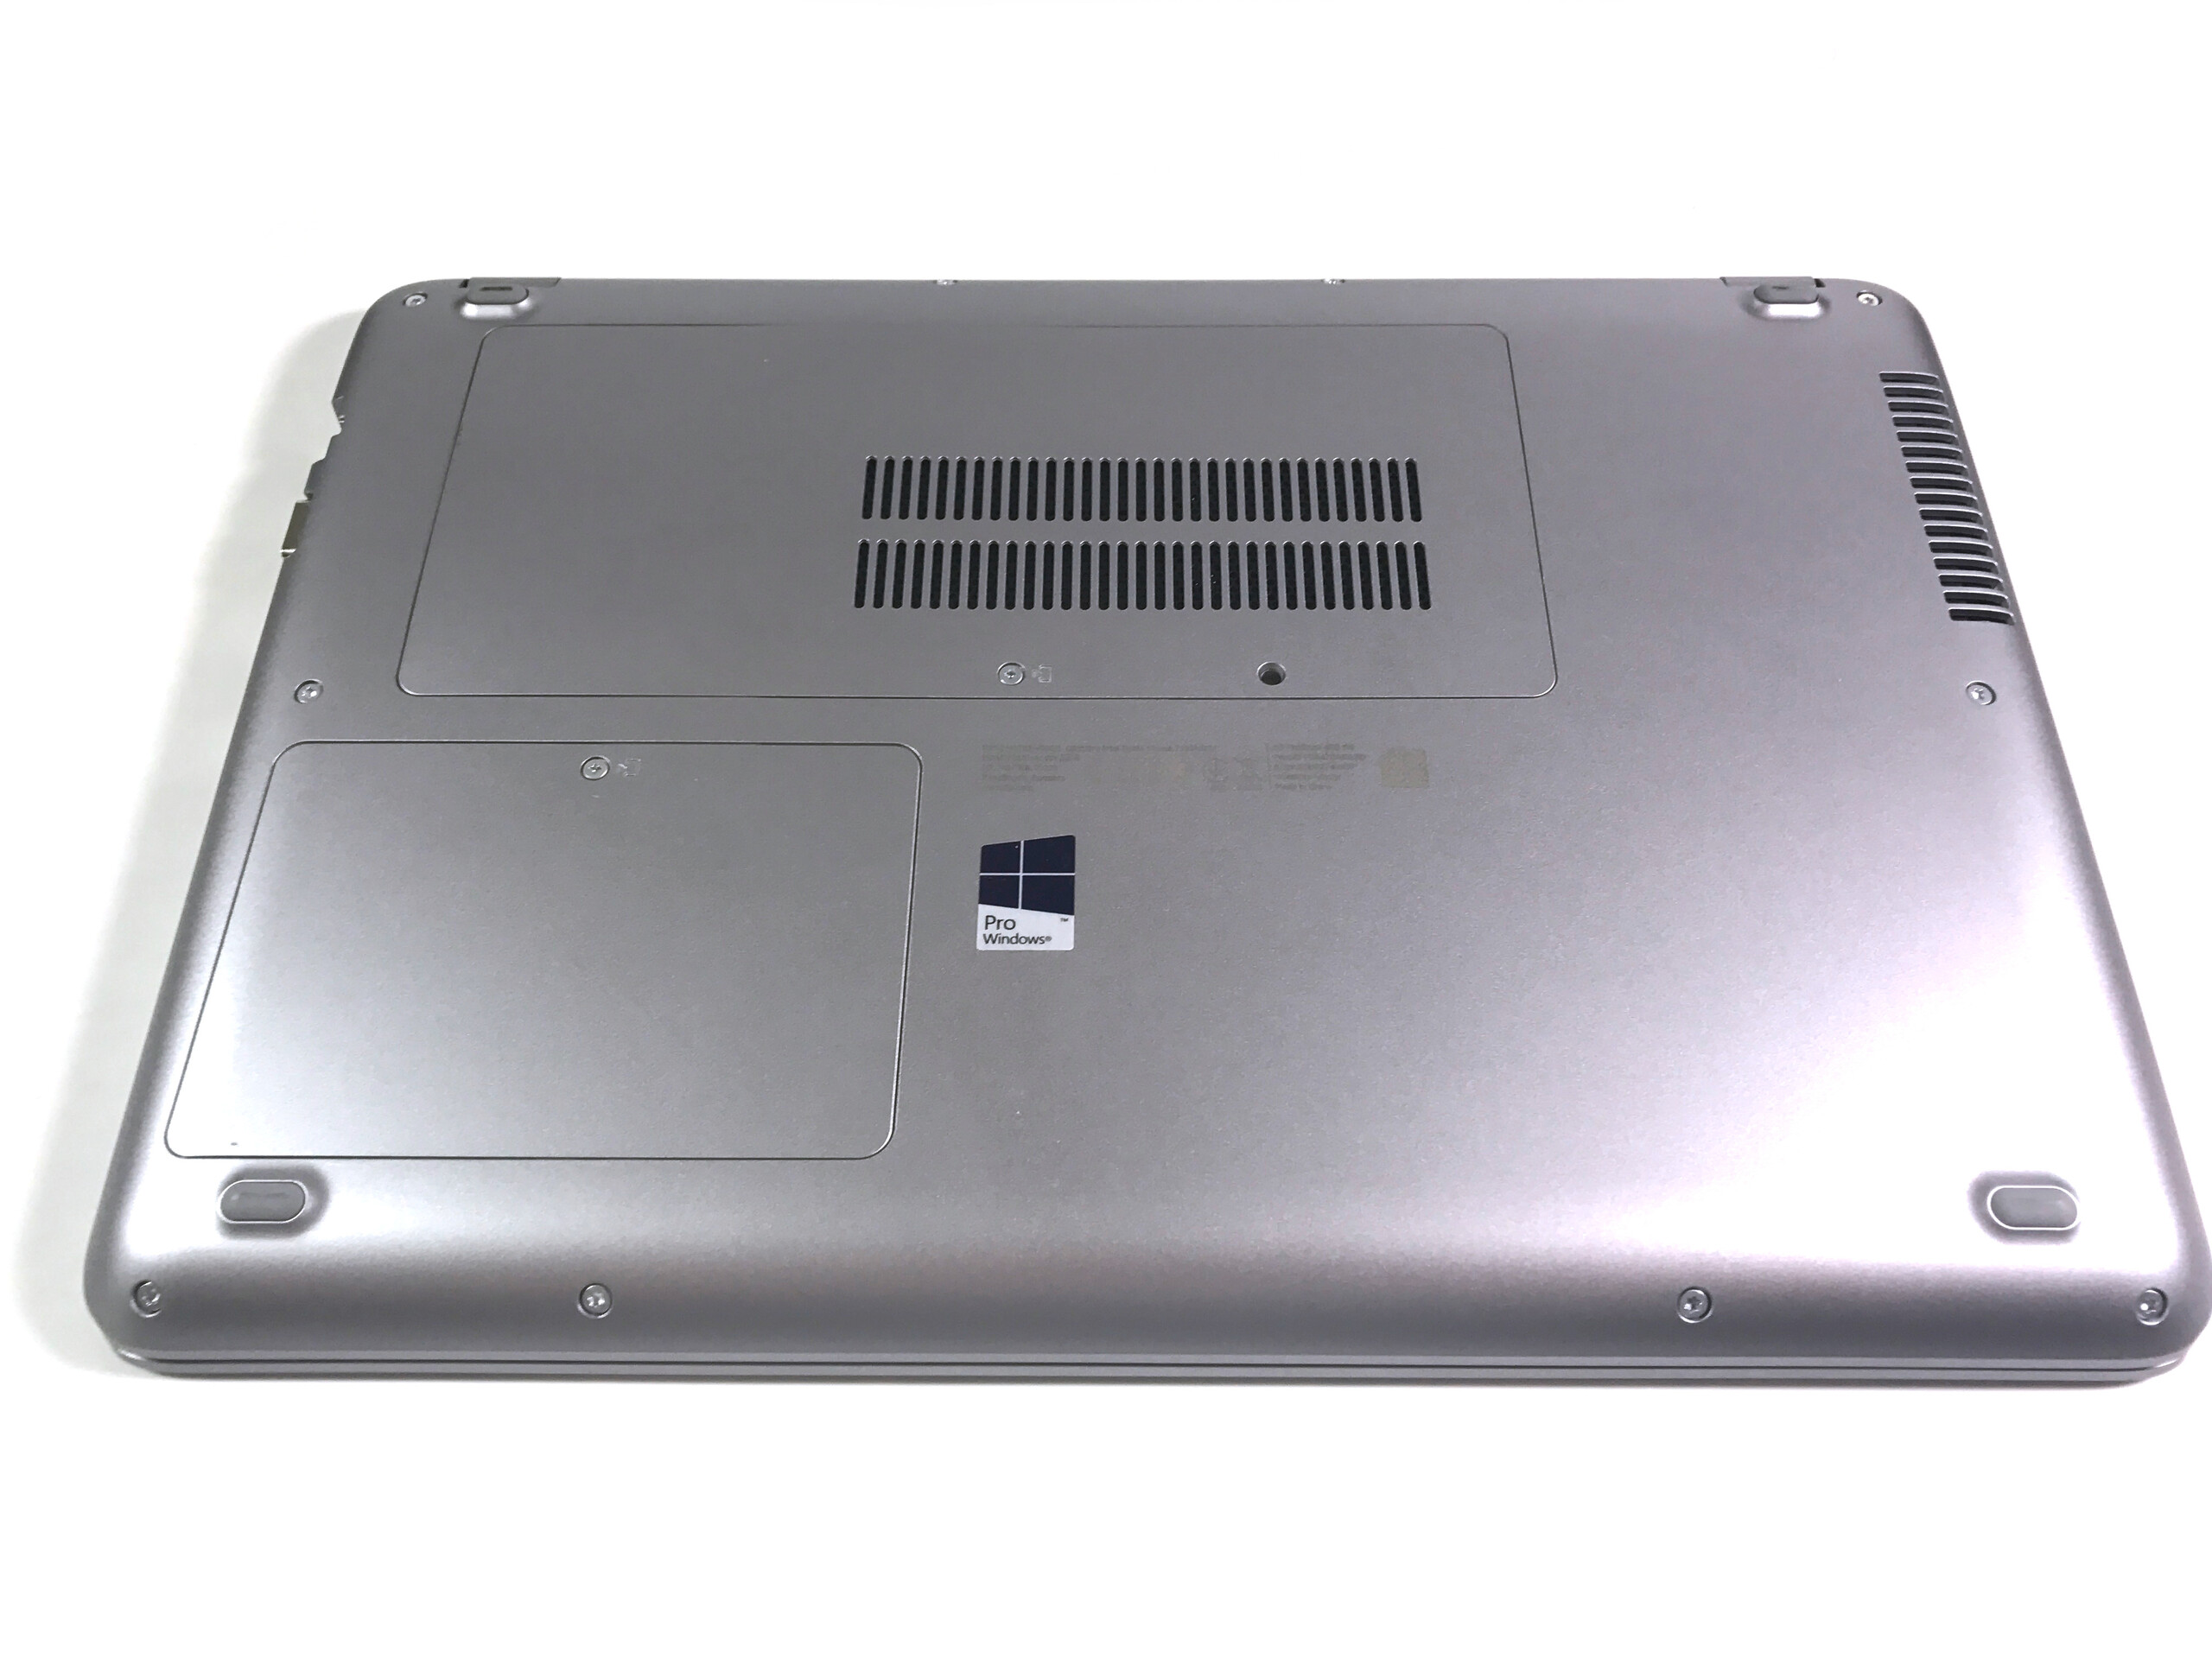
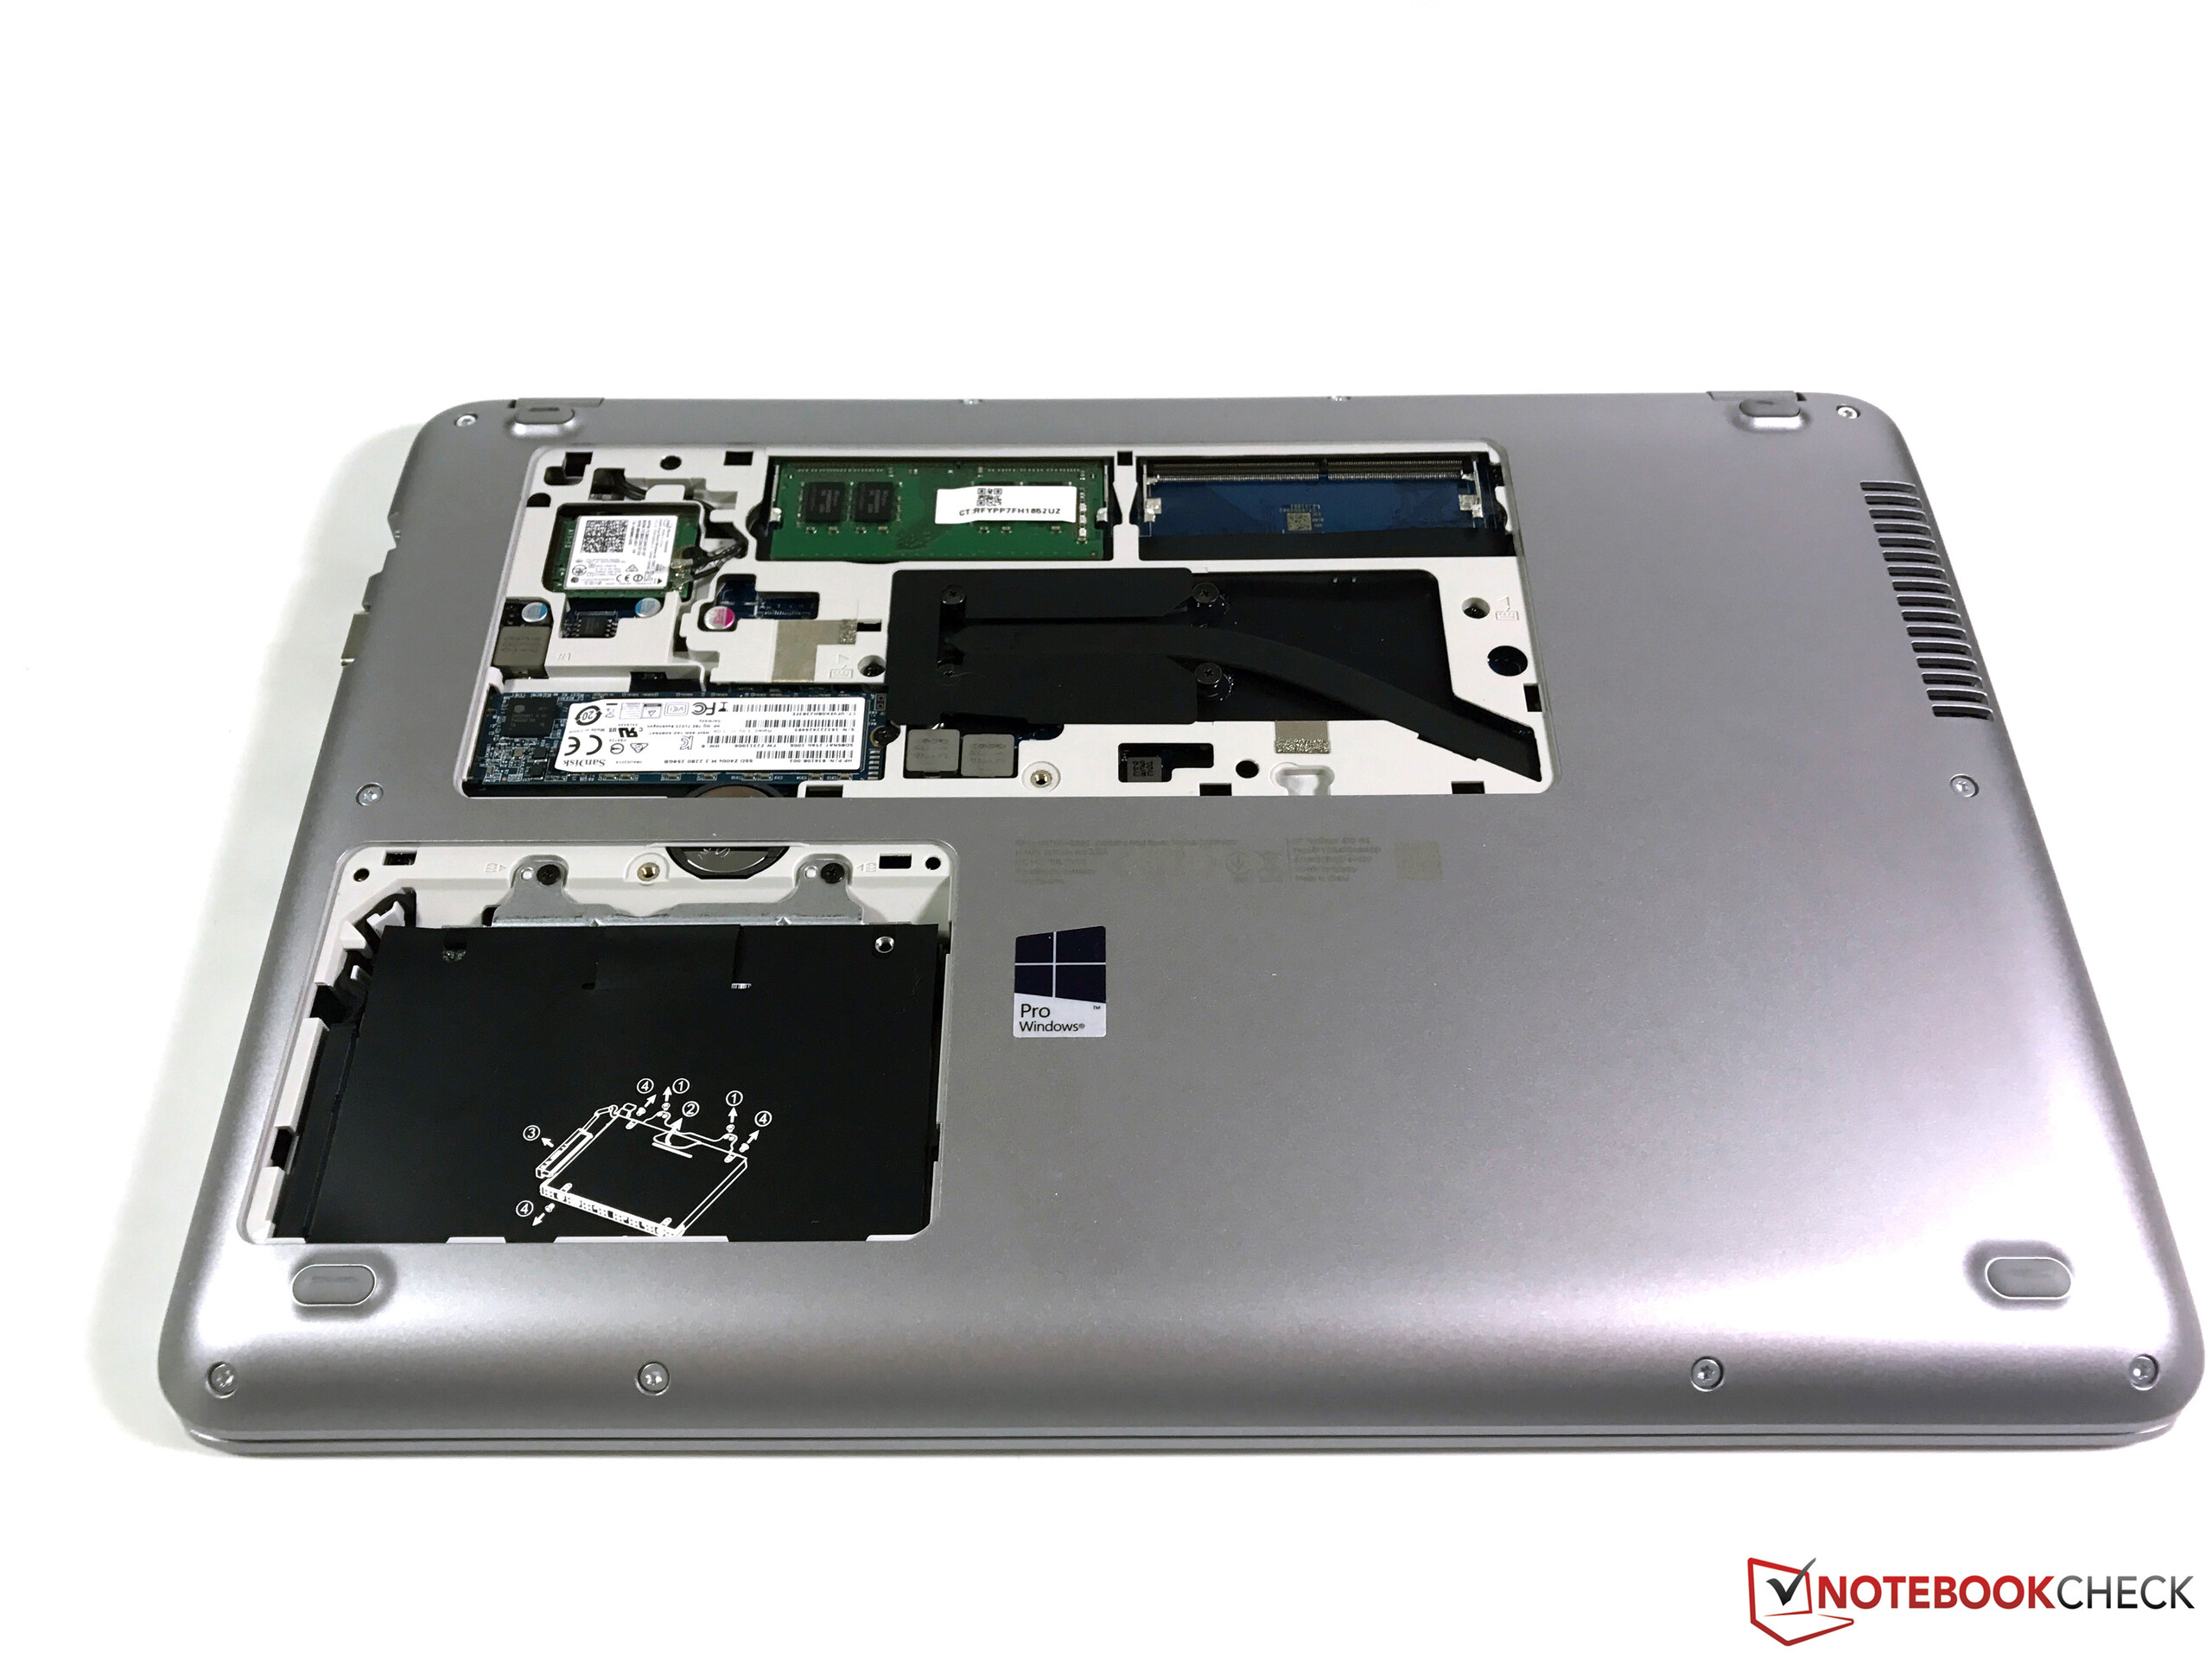
第四代的ProBook 430是一台不错的设备,不过依然是延续了惠普13.3寸商务本的保守设计。生产商没有在机身、性能、电池续航或(可选)IPS屏幕等各方面作出妥协。
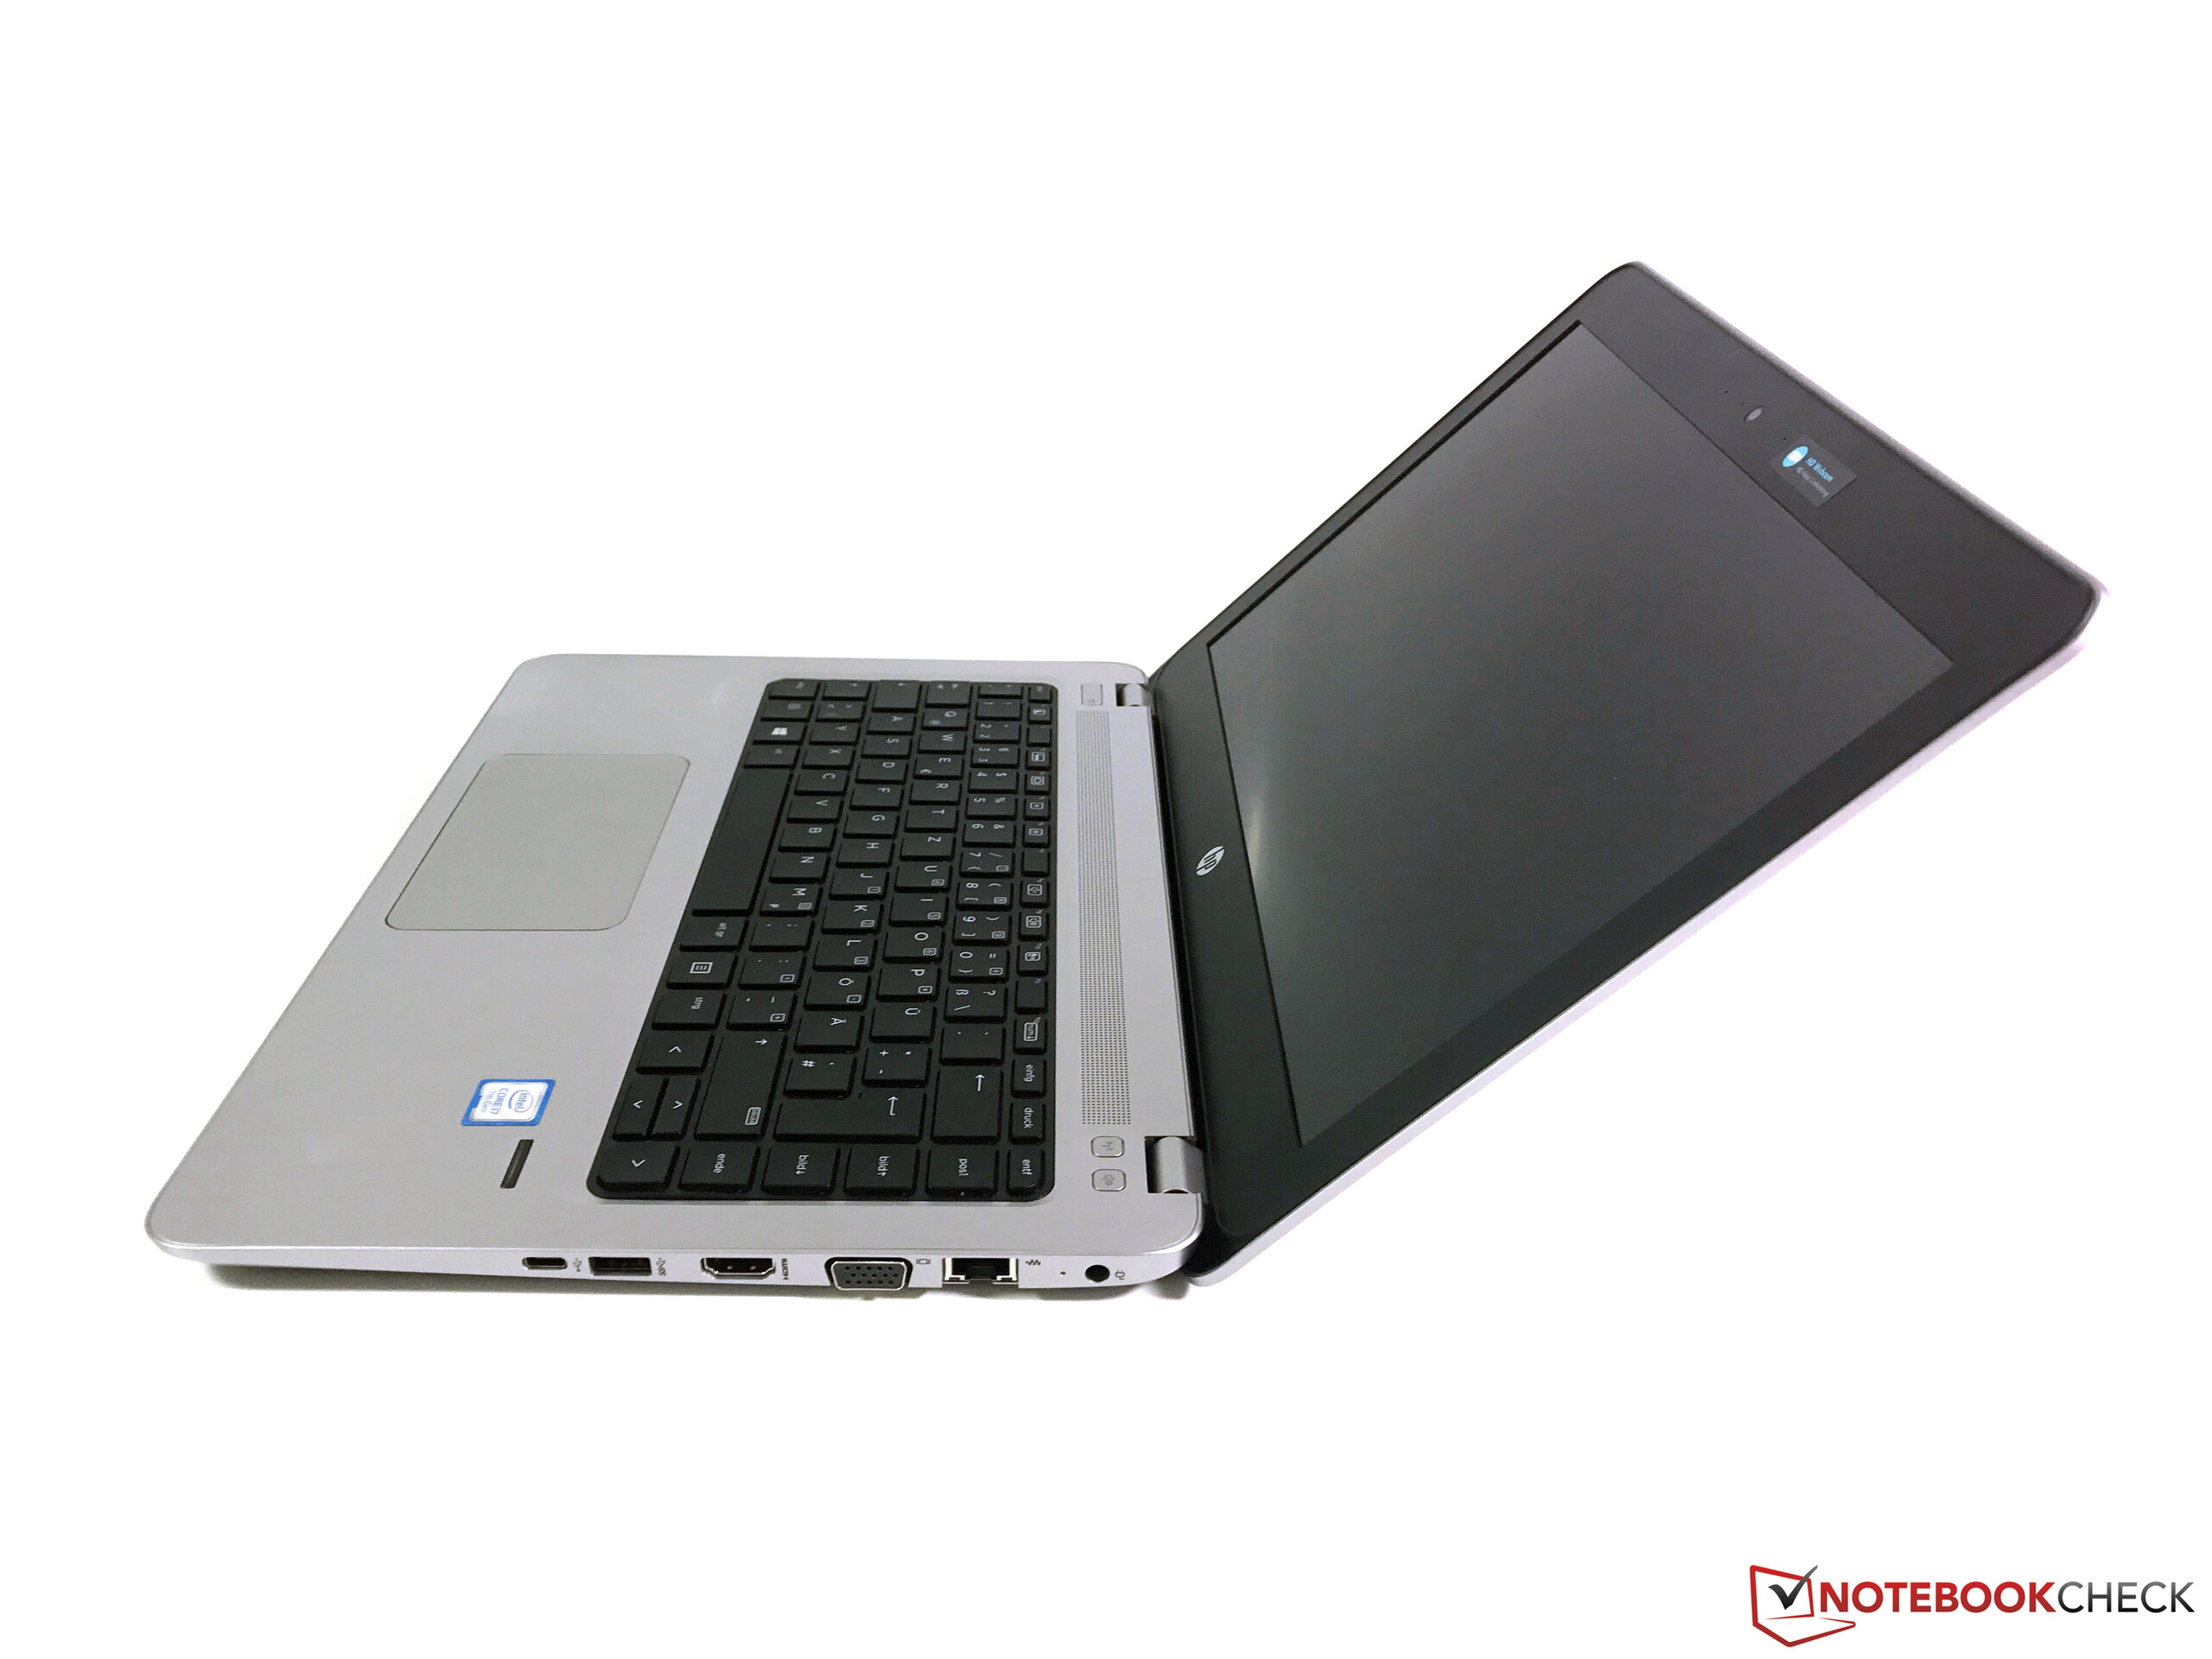
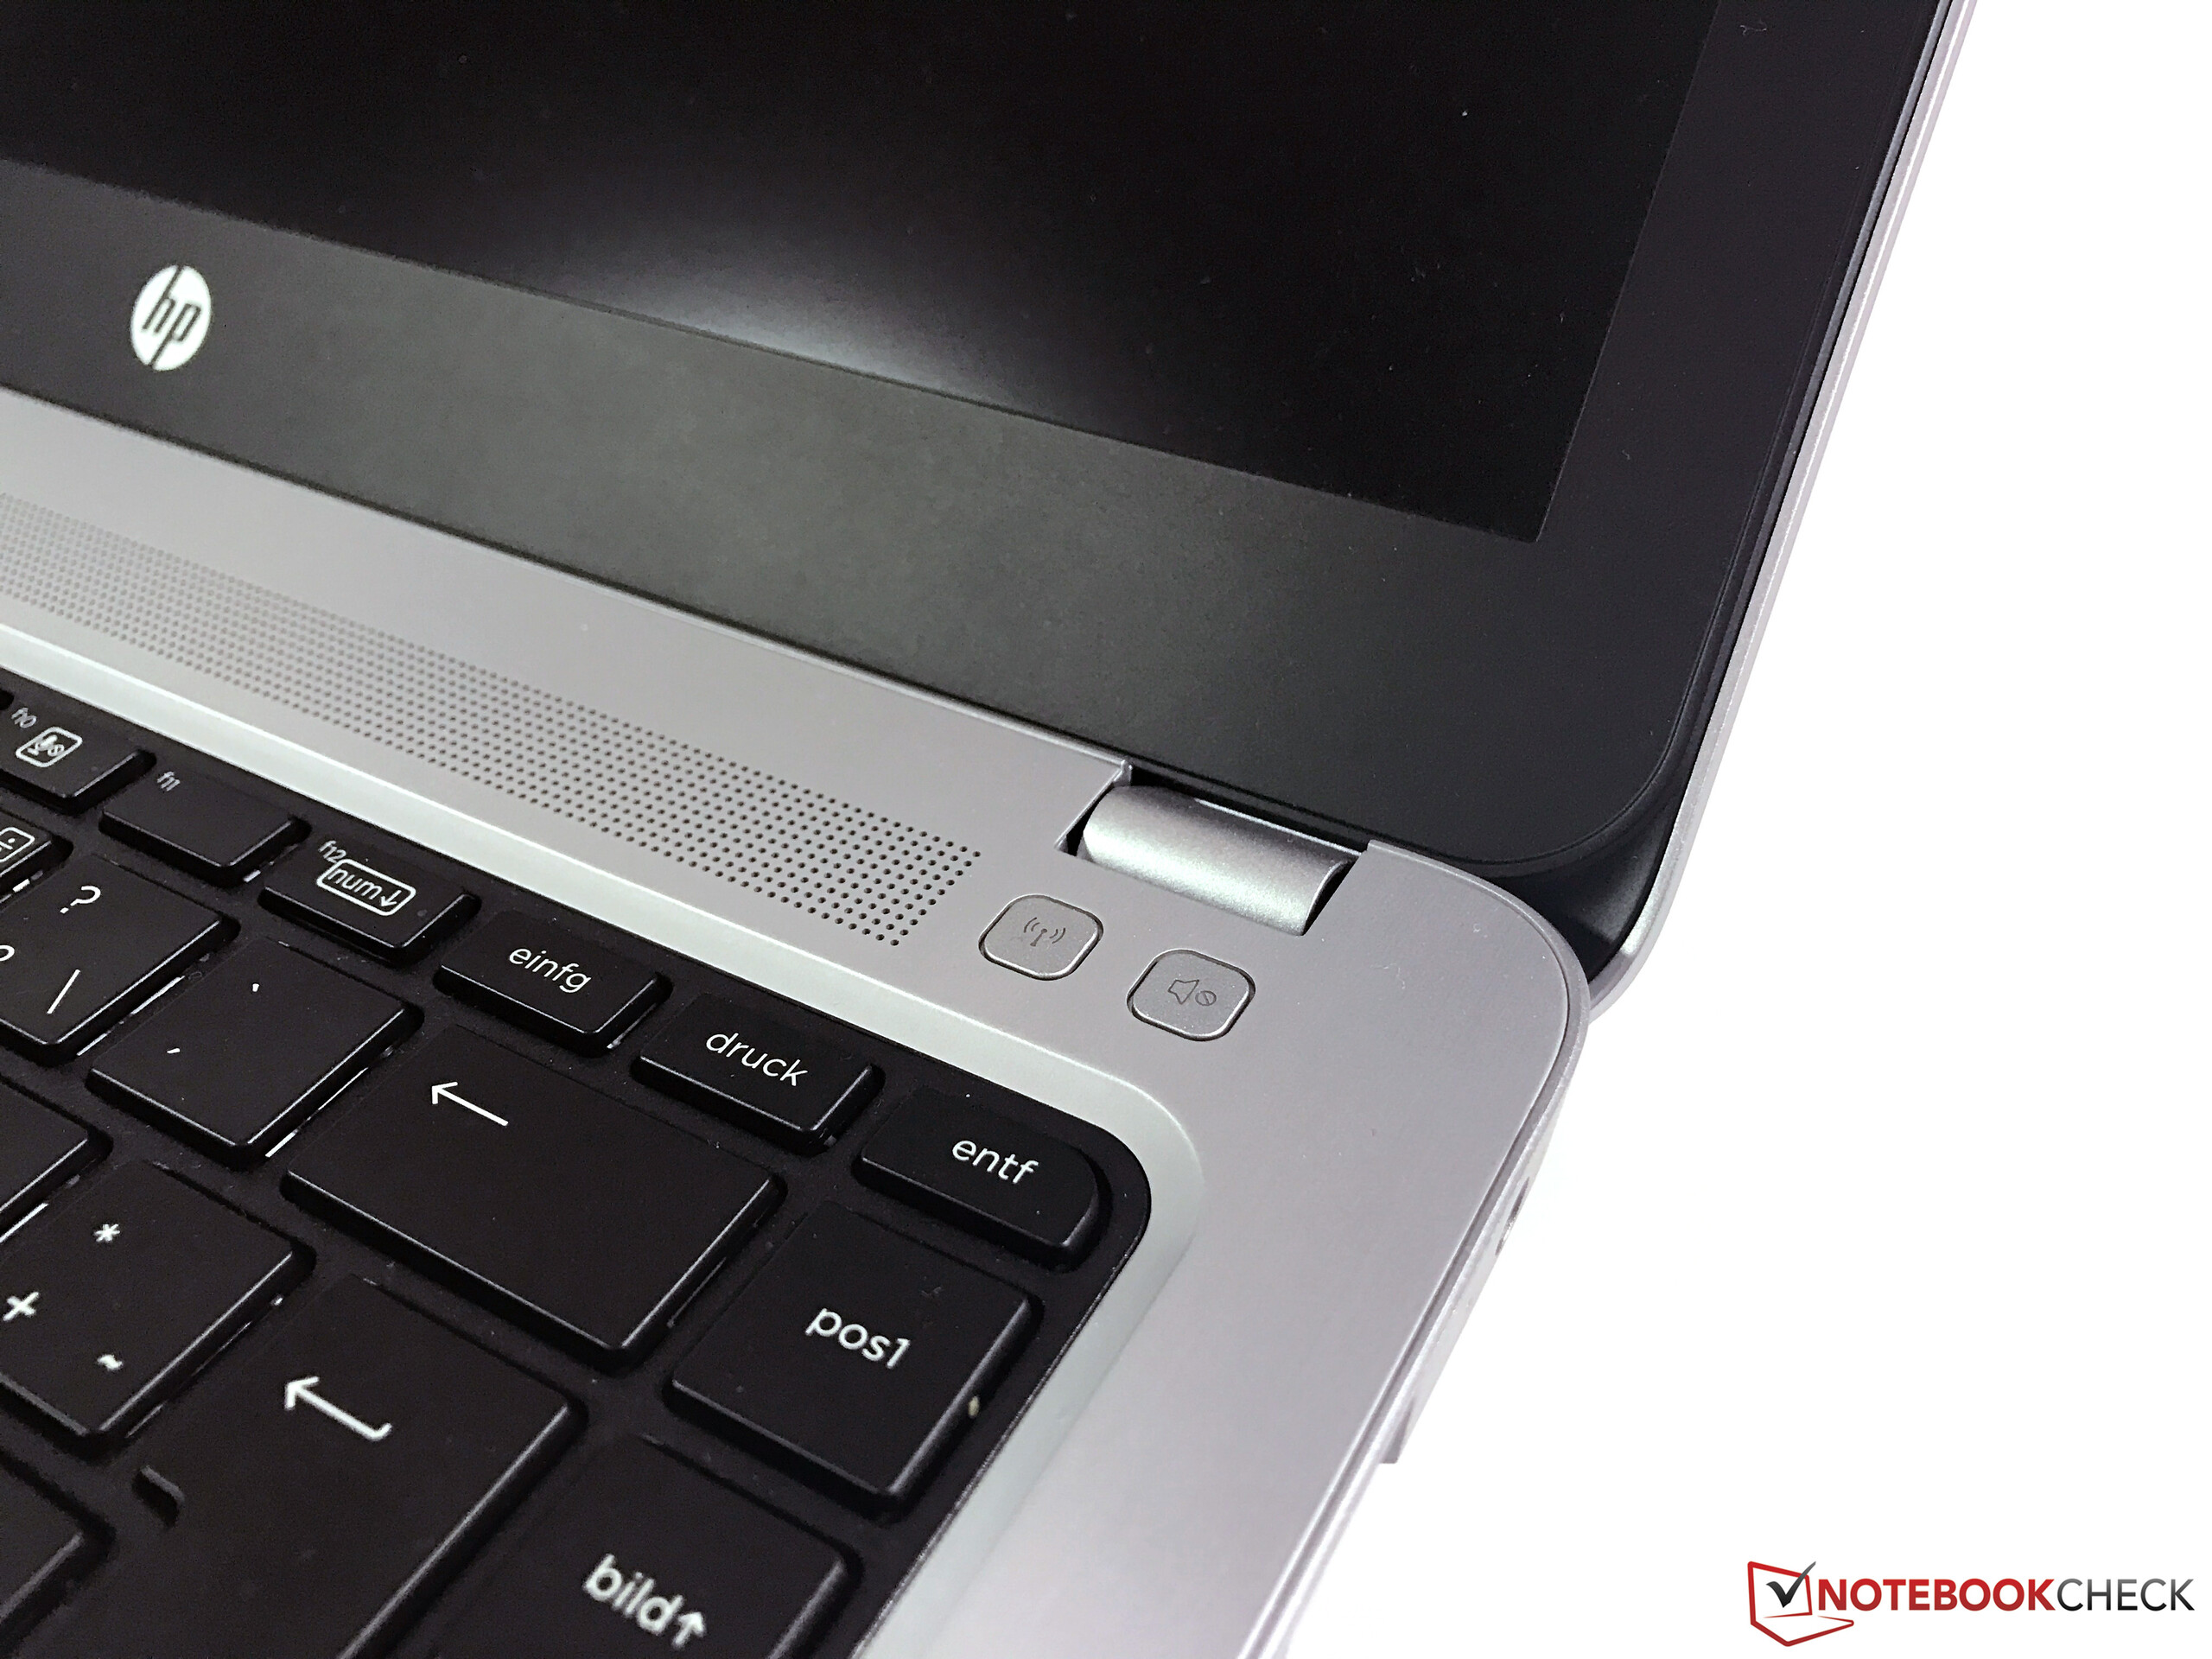
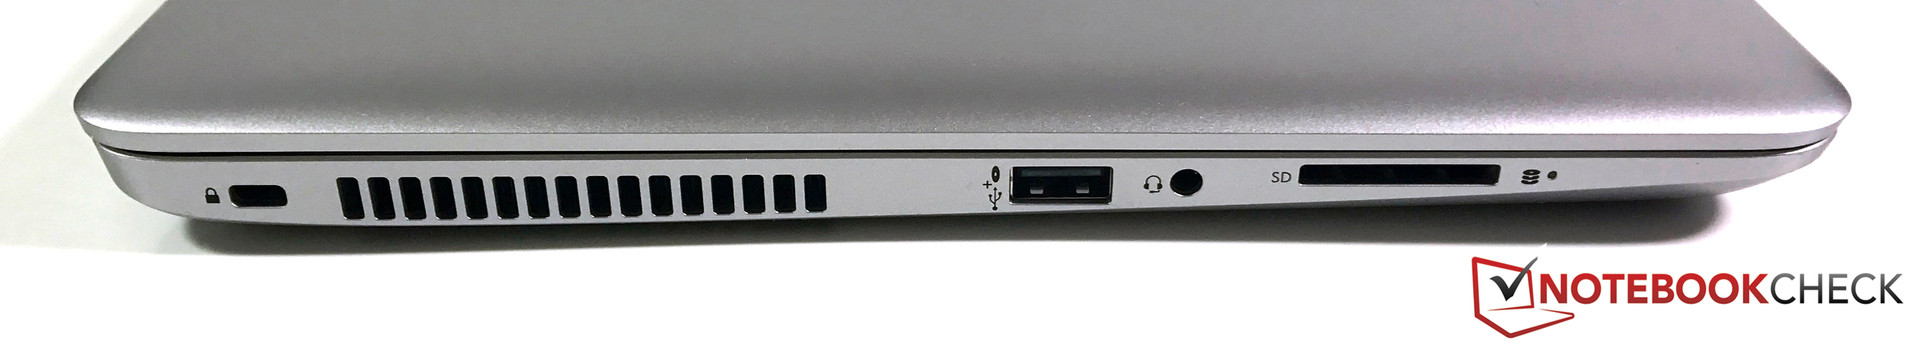
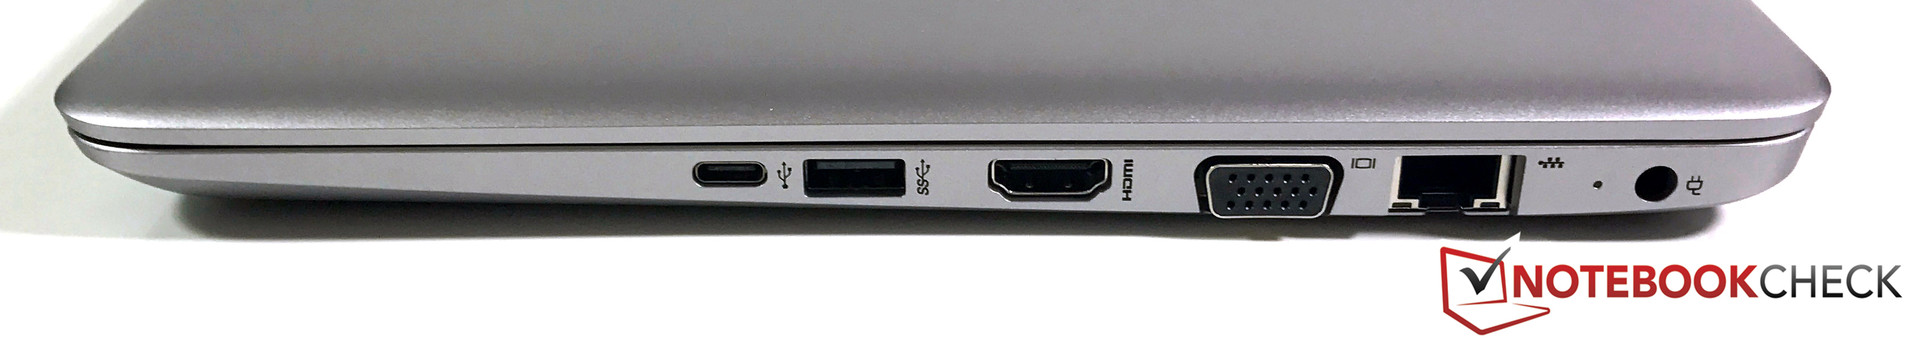
它的接口配备直观地预示了它入门级商务本的定位。惠普为它搭配了一个USB-C接口,不过仅支持3.0标准。不过它没有扩展坞接口,这可能让它较难融入办公环境。同时它也缺少智能卡接口。
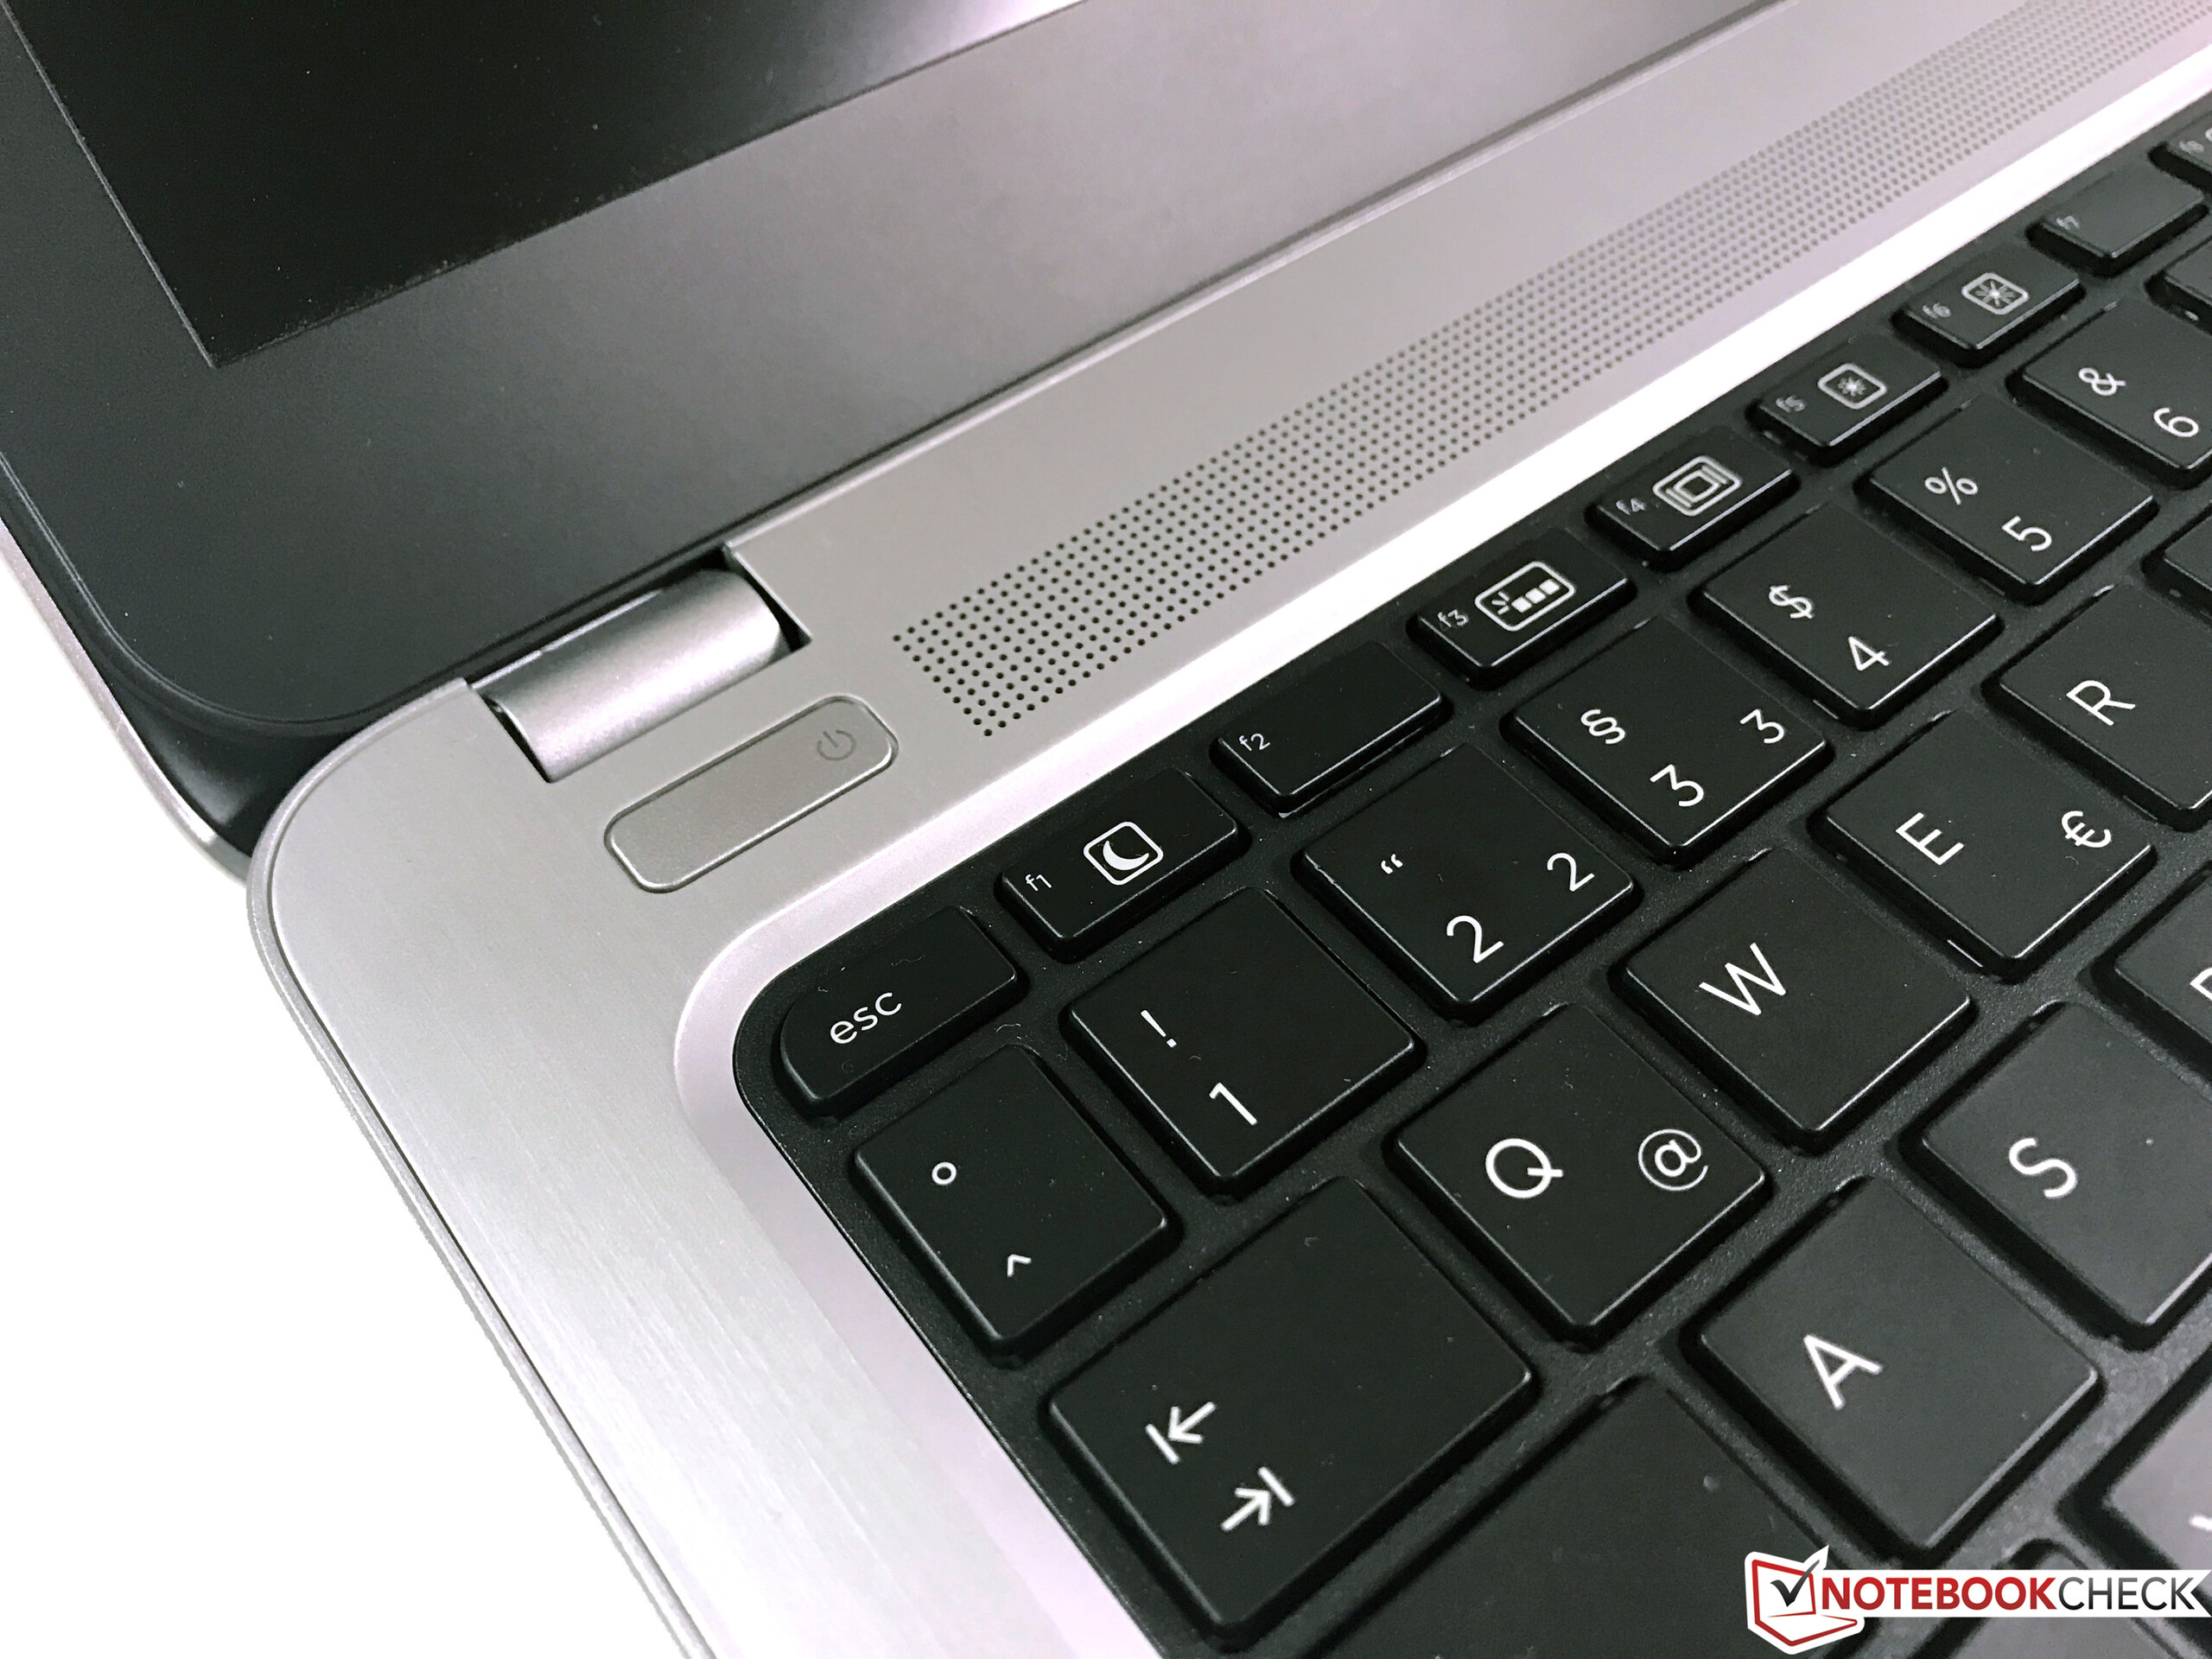
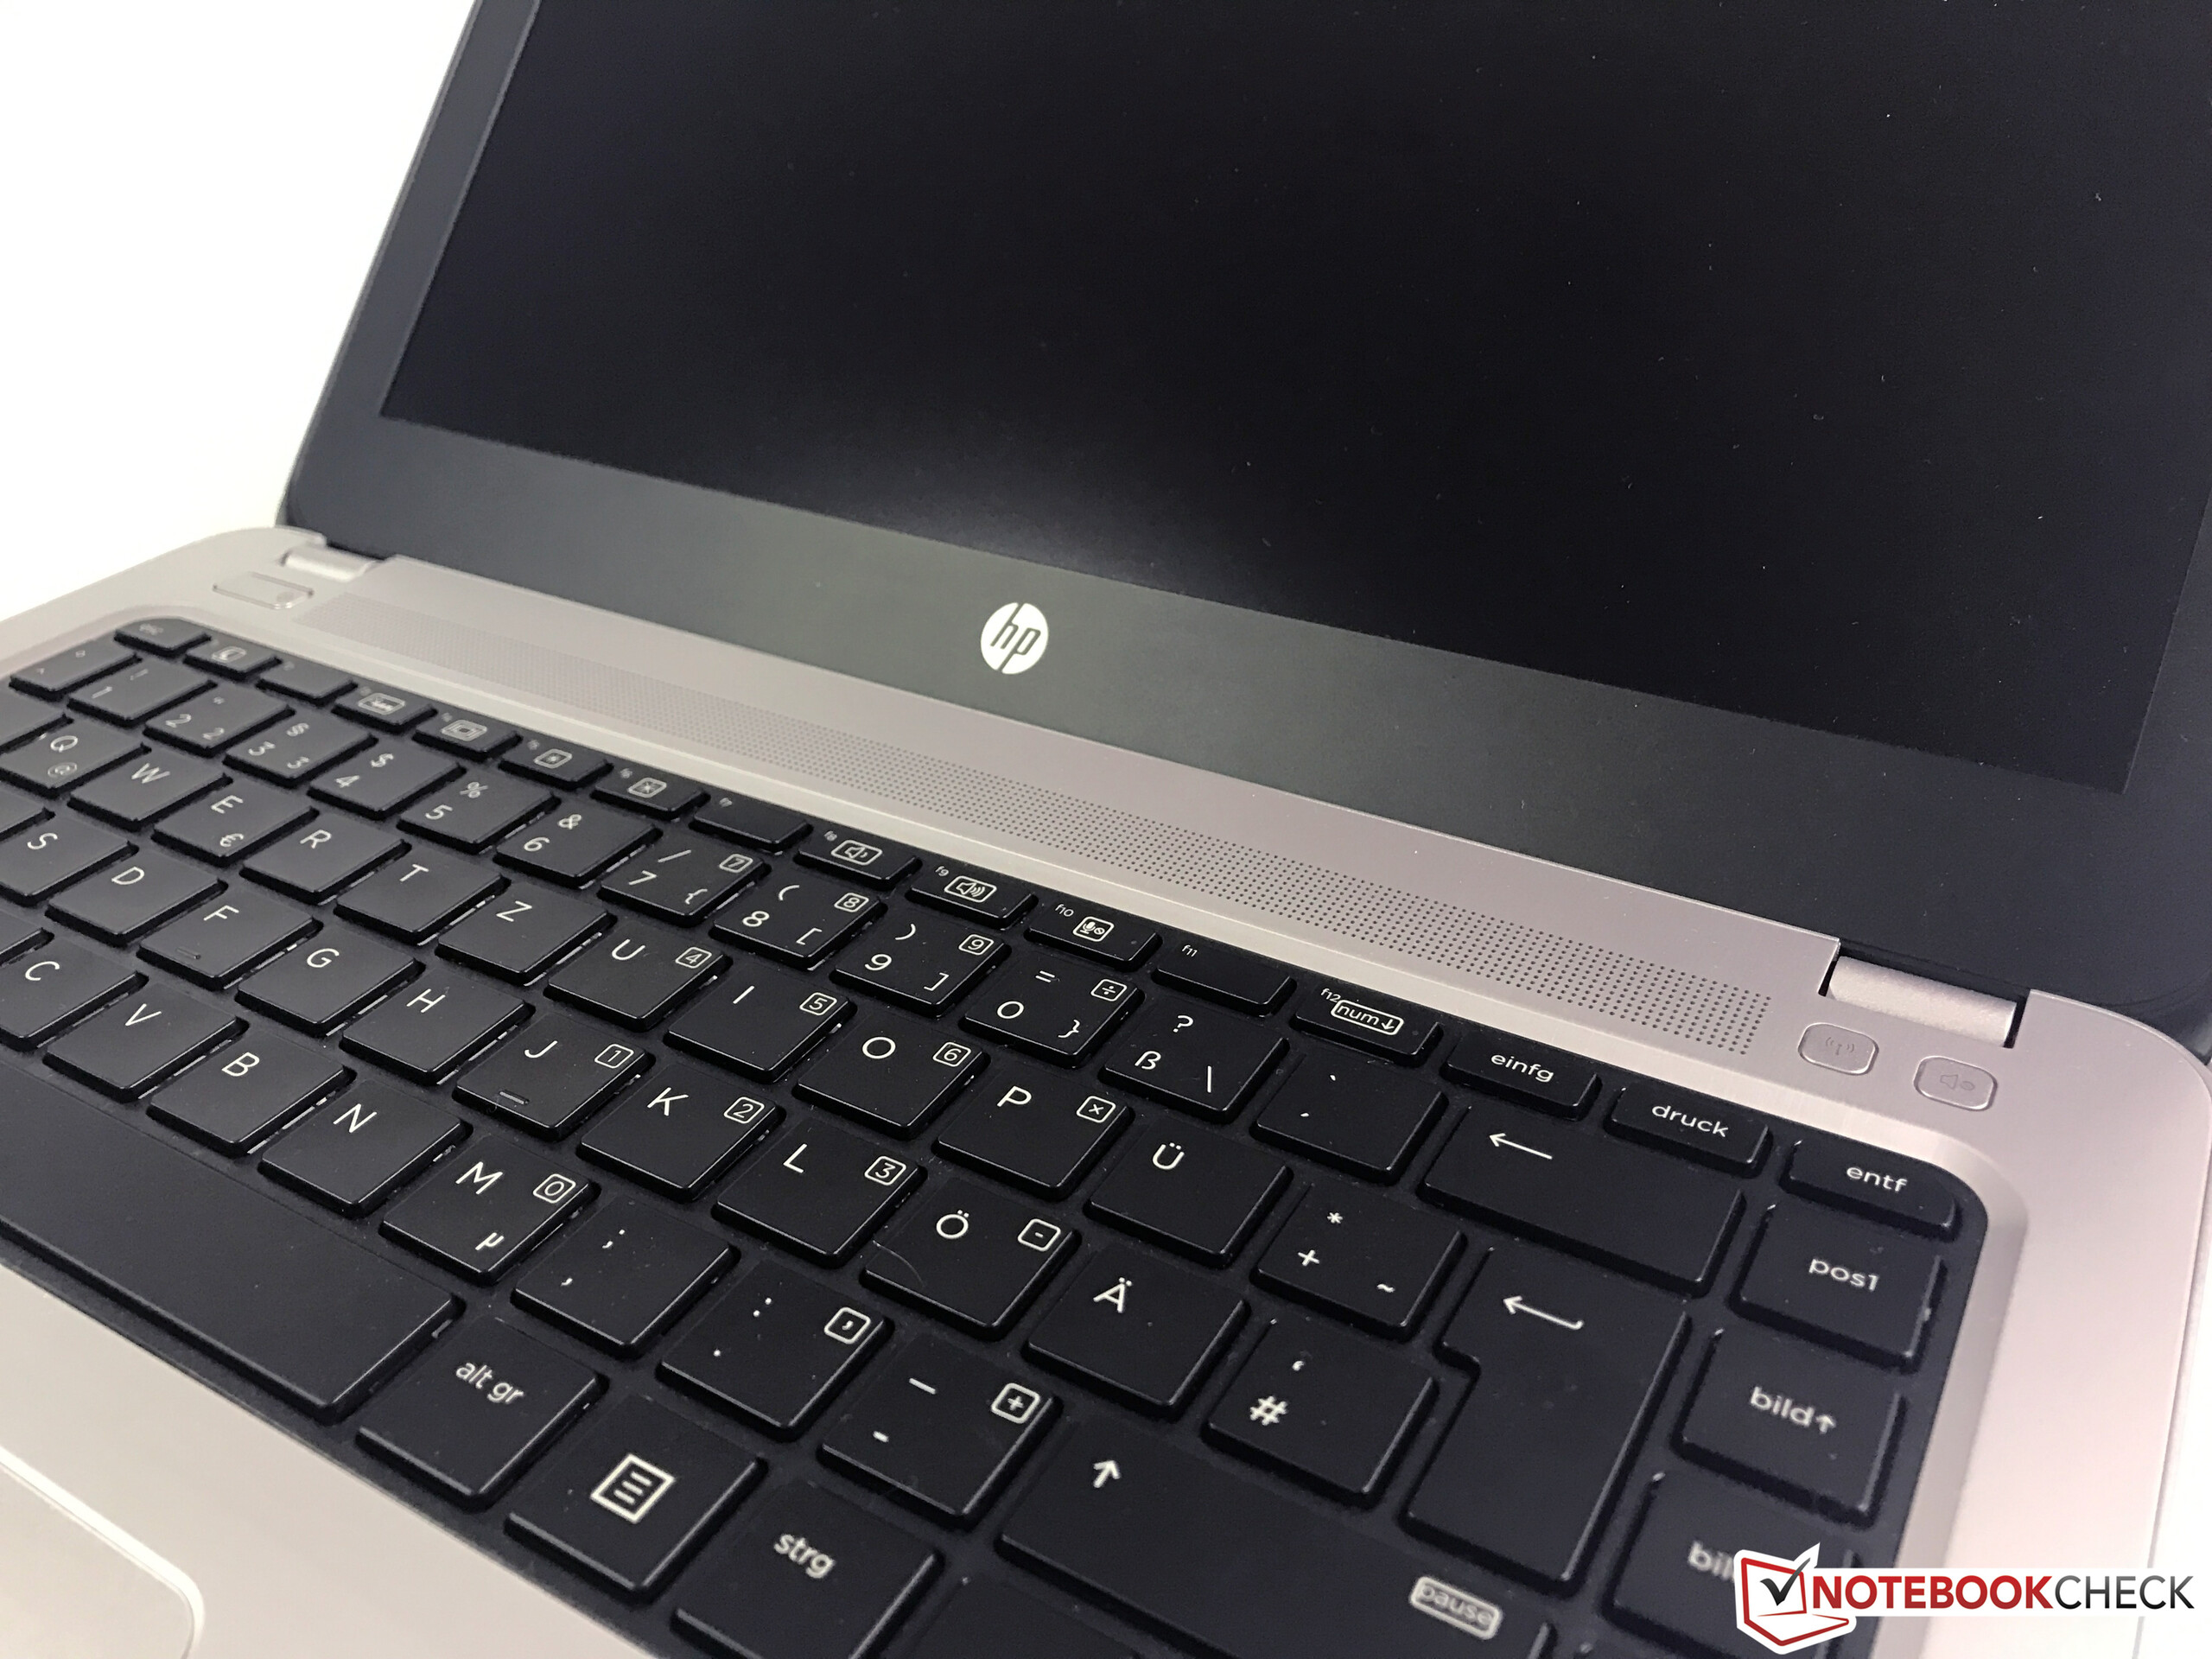
Kaby Lake架构处理器,优秀的屏幕,舒适的键盘——惠普ProBook 430 G4是这个13.3寸亚笔记本系列的成功更新。它在一些方面还有不足,同时价位也并不便宜。
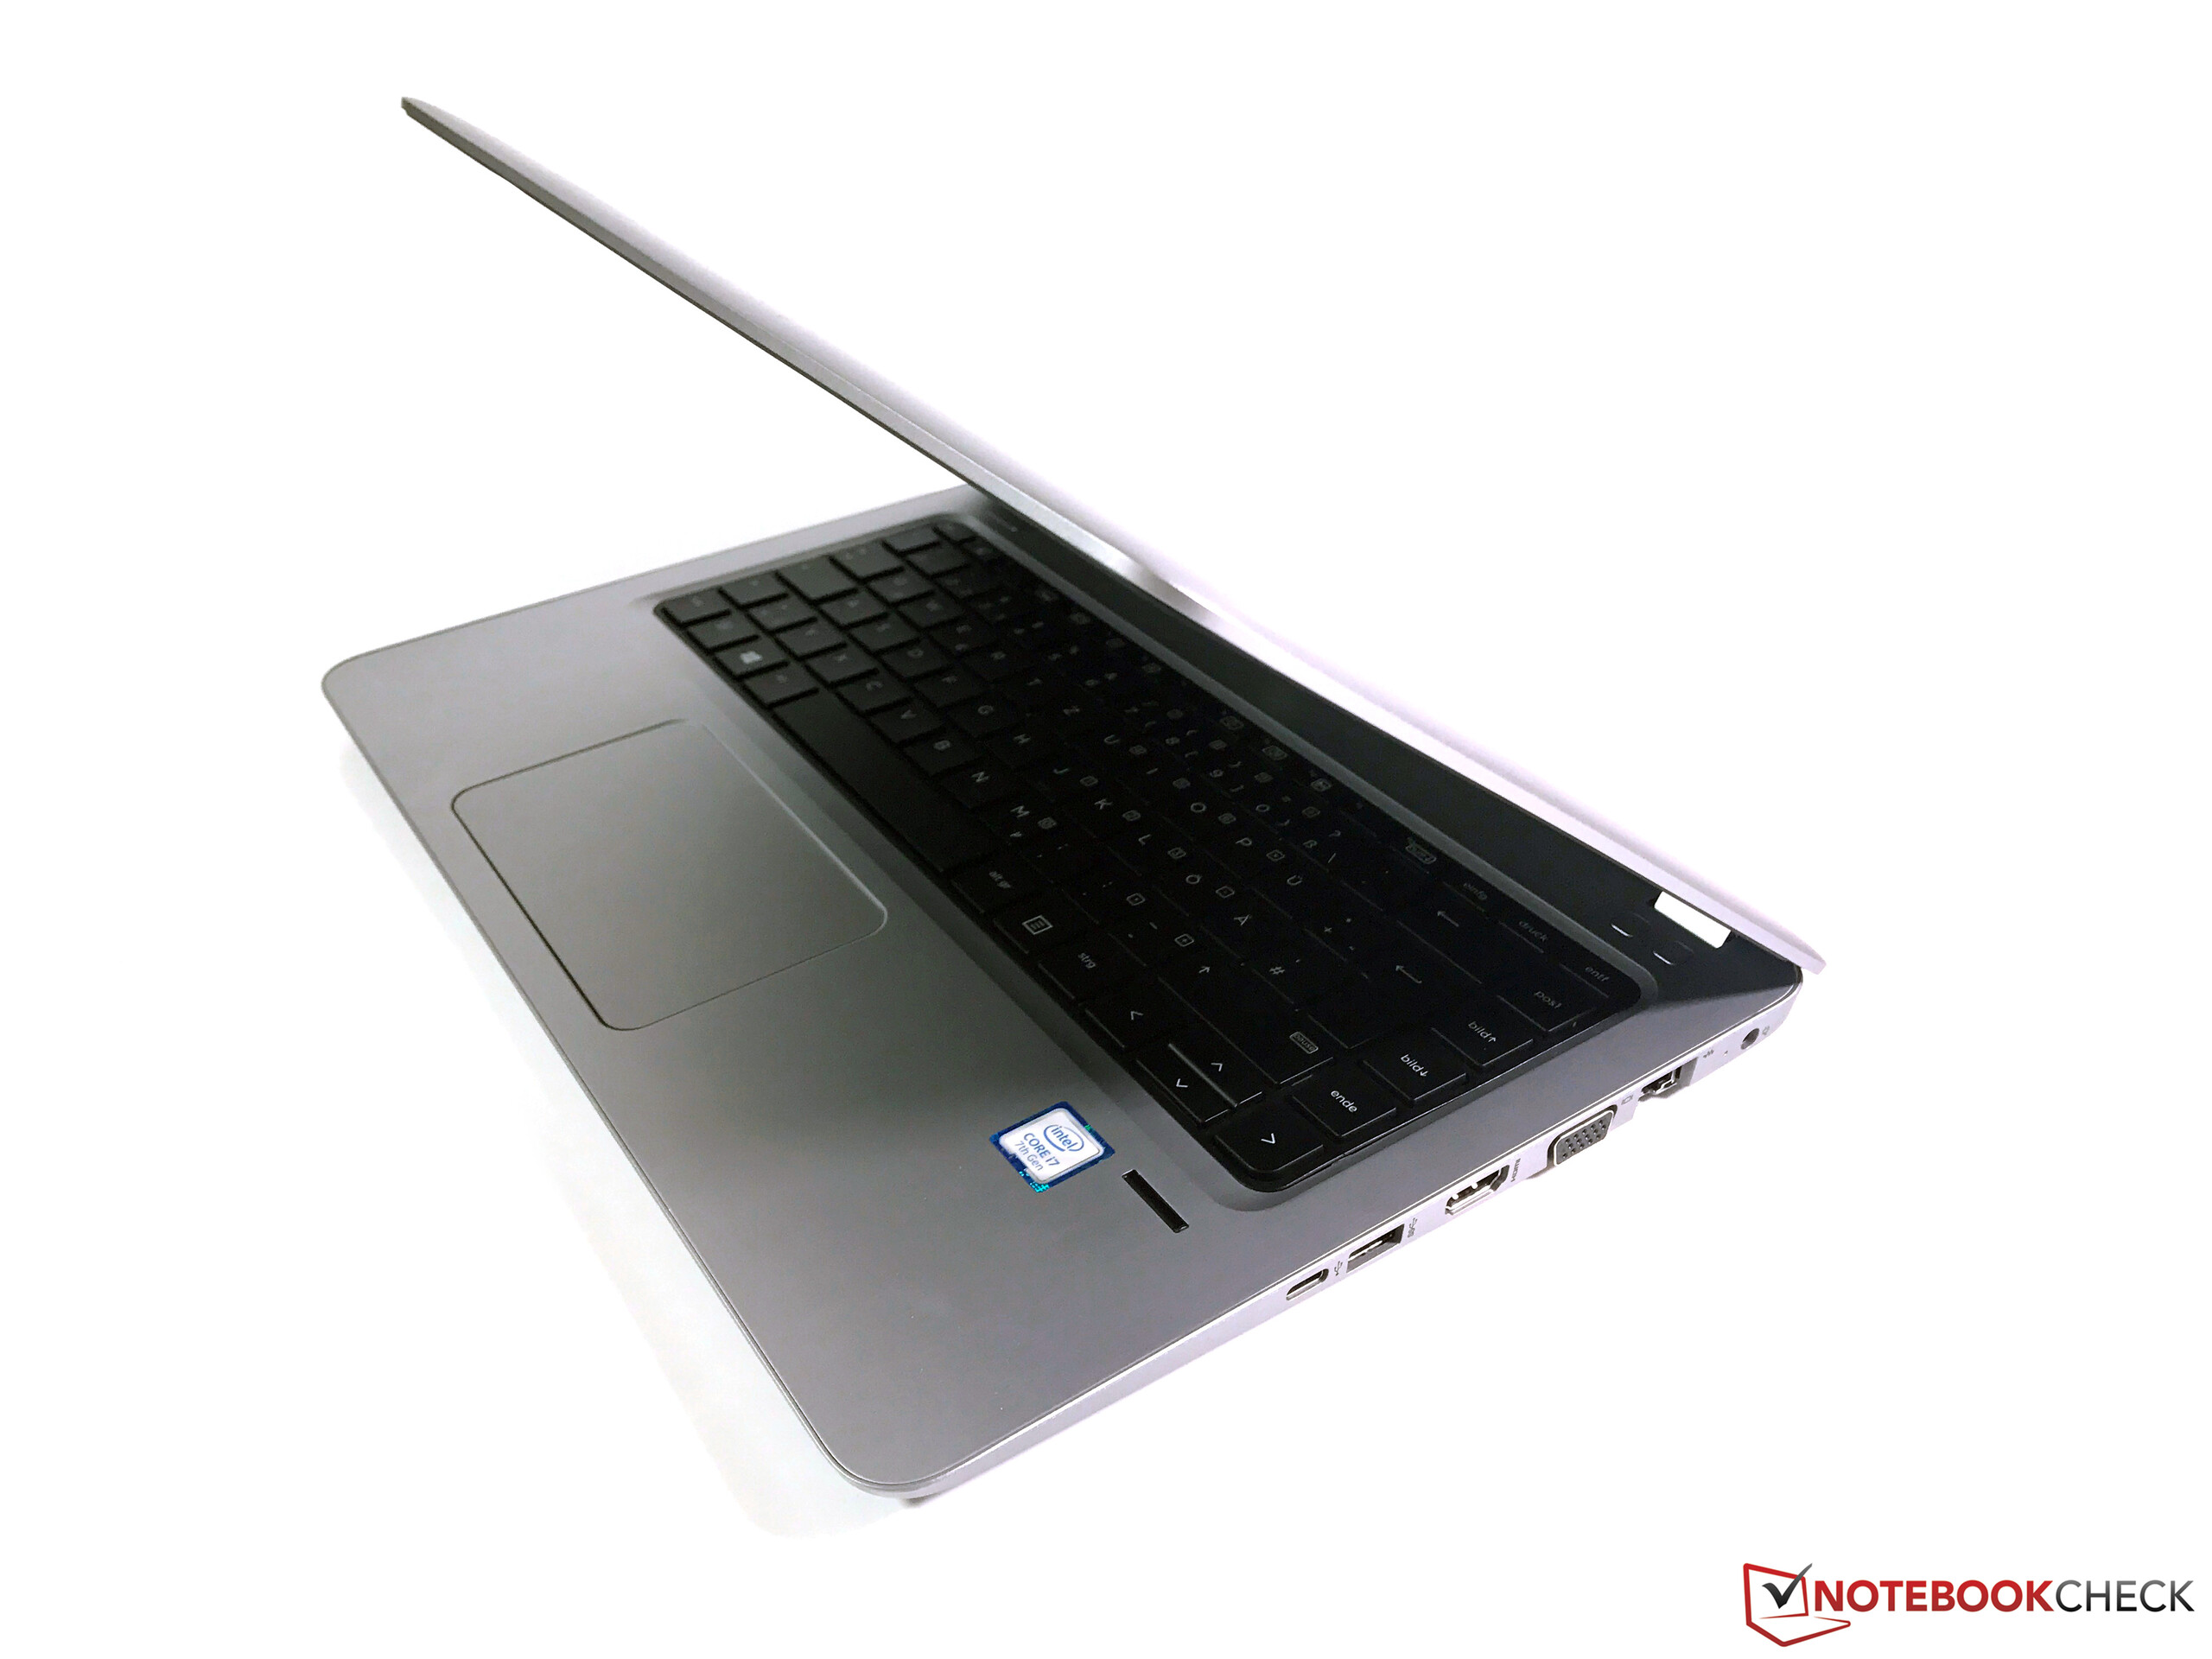
它的竞争机型仍然还没有更新到Kaby Lake架构,所以现在还无法作出直接的比较。我们这台测试机属于ProBook的高端配置,因此它在和消费市场机型对比时会处于劣势。在高于1000欧元的价位上,你可以找到更薄的、搭配更新接口和更好屏幕的设备,不过也需要舍弃一些安全功能和舒适的键盘。
注:本文是基于完整评测的缩减版本,阅读完整的英文评测,请点击这里。
HP ProBook 430 G4-Y8B47EA
- 12/26/2016 v6 (old)
Andreas Osthoff
Price comparison
