联想 ThinkPad 13 超极本简短评测
Screen Flickering / PWM (Pulse-Width Modulation)
| Screen flickering / PWM not detected | ||
In comparison: 52 % of all tested devices do not use PWM to dim the display. If PWM was detected, an average of 7754 (minimum: 5 - maximum: 343500) Hz was measured. | ||
| |||||||||||||||||||||||||
Brightness Distribution: 86 %
Center on Battery: 233 cd/m²
Contrast: 1059:1 (Black: 0.22 cd/m²)
ΔE ColorChecker Calman: 5.41 | ∀{0.5-29.43 Ø4.71}
ΔE Greyscale Calman: 4.15 | ∀{0.09-98 Ø4.96}
57.16% sRGB (Argyll 1.6.3 3D)
36.52% AdobeRGB 1998 (Argyll 1.6.3 3D)
39.66% AdobeRGB 1998 (Argyll 3D)
57.4% sRGB (Argyll 3D)
38.35% Display P3 (Argyll 3D)
Gamma: 2.45
CCT: 6773 K
| Lenovo ThinkPad 13-20GKS01100 1920x1080, LP133WF2-SPL1 | Lenovo ThinkPad T460-20FN003LGE IPS, 1920x1080, Lenovo LEN40A9 / N140HCE-EAA | Acer TravelMate P238-M-5575 TN LED, 1366x768, AU Optronics B133XTN01.6 | Asus Zenbook UX303UA-FN121T TN LED, 1366x768, BOE HF HB133WX1-402 | Acer Aspire S 13 S5-371-71QZ IPS, 1920x1080, AUO B133HAN04.1 | Dell XPS 13-9350 IPS, 1920x1080, SHP1420 | Lenovo ThinkPad T460s-20F9003SGE IPS, 1920x1080, N140HCE-EAA, LEN40A9 | |
|---|---|---|---|---|---|---|---|
| Display | 9% | -3% | 12% | 16% | 8% | ||
| Display P3 Coverage (%) | 38.35 | 42.09 10% | 37.25 -3% | 43.08 12% | 44.53 16% | 41.65 9% | |
| sRGB Coverage (%) | 57.4 | 62 8% | 56.1 -2% | 64.8 13% | 66.8 16% | 61.6 7% | |
| AdobeRGB 1998 Coverage (%) | 39.66 | 43.6 10% | 38.49 -3% | 44.52 12% | 45.97 16% | 43.14 9% | |
| Response Times | 5% | -1% | 46% | -13% | -3% | ||
| Response Time Grey 50% / Grey 80% * (ms) | 43.2 ? | 42.4 ? 2% | 42 ? 3% | 23 ? 47% | 50 ? -16% | 42 ? 3% | |
| Response Time Black / White * (ms) | 26.8 ? | 24.8 ? 7% | 28 ? -4% | 15 ? 44% | 29.6 ? -10% | 29.2 ? -9% | |
| PWM Frequency (Hz) | 192 ? | ||||||
| Screen | -16% | -64% | -4% | 20% | 14% | -8% | |
| Brightness middle (cd/m²) | 233 | 230 -1% | 226 -3% | 203 -13% | 375 61% | 277.5 19% | 226 -3% |
| Brightness (cd/m²) | 227 | 216 -5% | 216 -5% | 193 -15% | 358 58% | 276 22% | 211 -7% |
| Brightness Distribution (%) | 86 | 85 -1% | 91 6% | 84 -2% | 87 1% | 88 2% | 89 3% |
| Black Level * (cd/m²) | 0.22 | 0.26 -18% | 0.49 -123% | 0.49 -123% | 0.39 -77% | 0.191 13% | 0.22 -0% |
| Contrast (:1) | 1059 | 885 -16% | 461 -56% | 414 -61% | 962 -9% | 1453 37% | 1027 -3% |
| Colorchecker dE 2000 * | 5.41 | 7.32 -35% | 13.15 -143% | 3.2 41% | 4.6 15% | 4.88 10% | 6.44 -19% |
| Colorchecker dE 2000 max. * | 13.61 | 18.14 -33% | 21.96 -61% | 4.13 70% | 8.8 35% | 17.18 -26% | |
| Greyscale dE 2000 * | 4.15 | 6.98 -68% | 14.47 -249% | 2.77 33% | 4 4% | 4.26 -3% | 5.87 -41% |
| Gamma | 2.45 90% | 2.5 88% | 2.73 81% | 2.46 89% | 2.34 94% | 2.59 85% | 2.37 93% |
| CCT | 6773 96% | 6683 97% | 19989 33% | 7176 91% | 7304 89% | 6562 99% | 6856 95% |
| Color Space (Percent of AdobeRGB 1998) (%) | 36.52 | 39.97 9% | 36 -1% | 41 12% | 57.9 59% | 41.6 14% | 39.58 8% |
| Color Space (Percent of sRGB) (%) | 57.16 | 61.55 8% | 56 -2% | 65 14% | 88.7 55% | 65.79 15% | 61.15 7% |
| Total Average (Program / Settings) | -1% /
-8% | -23% /
-43% | 18% /
6% | 4% /
15% | 15% /
15% | -1% /
-4% |
* ... smaller is better
Display Response Times
| ↔ Response Time Black to White | ||
|---|---|---|
| 26.8 ms ... rise ↗ and fall ↘ combined | ↗ 9.6 ms rise | |
| ↘ 17.2 ms fall | ||
| The screen shows relatively slow response rates in our tests and may be too slow for gamers. In comparison, all tested devices range from 0.1 (minimum) to 240 (maximum) ms. » 67 % of all devices are better. This means that the measured response time is worse than the average of all tested devices (19.8 ms). | ||
| ↔ Response Time 50% Grey to 80% Grey | ||
| 43.2 ms ... rise ↗ and fall ↘ combined | ↗ 19.6 ms rise | |
| ↘ 23.6 ms fall | ||
| The screen shows slow response rates in our tests and will be unsatisfactory for gamers. In comparison, all tested devices range from 0.165 (minimum) to 636 (maximum) ms. » 72 % of all devices are better. This means that the measured response time is worse than the average of all tested devices (31 ms). | ||
| PCMark 8 Home Score Accelerated v2 | 3024 points | |
| PCMark 8 Creative Score Accelerated v2 | 3651 points | |
| PCMark 8 Work Score Accelerated v2 | 4041 points | |
Help | ||

| Lenovo ThinkPad 13-20GKS01100 Samsung SSD PM871 MZNLN256HCHP | Lenovo ThinkPad T460-20FN003LGE Toshiba HG6 THNSFJ256GCSU | Acer TravelMate P238-M-5575 Samsung SSD PM871 MZNLN256HCHP | Acer Aspire S 13 S5-371-71QZ LiteOn CV1-8B512 | Dell XPS 13-9350 Samsung PM951 NVMe MZ-VLV256D | Lenovo ThinkPad T460s-20F9003SGE Samsung CM871 MZ7LF192HCGS | |
|---|---|---|---|---|---|---|
| CrystalDiskMark 3.0 | -4% | 3% | 7% | 31% | -51% | |
| Write 4k QD32 (MB/s) | 276.2 | 216 -22% | 234.4 -15% | 211.2 -24% | 151.5 -45% | 36.43 -87% |
| Read 4k QD32 (MB/s) | 360.9 | 369.9 2% | 235.6 -35% | 301.3 -17% | 244.7 -32% | 94.9 -74% |
| Write 4k (MB/s) | 68.5 | 72.9 6% | 85.2 24% | 86.8 27% | 113 65% | 35.47 -48% |
| Read 4k (MB/s) | 31.85 | 21.7 -32% | 33.03 4% | 29.69 -7% | 38.52 21% | 5.78 -82% |
| Write 512 (MB/s) | 298.4 | 232.7 -22% | 305.1 2% | 389.7 31% | 308.6 3% | 167.2 -44% |
| Read 512 (MB/s) | 351.6 | 371.3 6% | 459.9 31% | 341.3 -3% | 684 95% | 259.2 -26% |
| Write Seq (MB/s) | 297.8 | 394.4 32% | 307.6 3% | 418.9 41% | 307.7 3% | 171.1 -43% |
| Read Seq (MB/s) | 461.7 | 458.9 -1% | 517 12% | 502 9% | 1097 138% | 446.5 -3% |
| 3DMark 06 Standard Score | 7597 points | |
| 3DMark 11 Performance | 1372 points | |
| 3DMark Cloud Gate Standard Score | 4922 points | |
| 3DMark Fire Strike Score | 678 points | |
Help | ||
| low | med. | high | ultra | |
|---|---|---|---|---|
| Tomb Raider (2013) | 49.7 | 25.2 | 16.6 | |
| BioShock Infinite (2013) | 35.28 | 20.31 | 16.9 | |
| The Witcher 3 (2015) | 11.89 |
Noise level
| Idle |
| 29.1 / 29.1 / 29.1 dB(A) |
| Load |
| 31.5 / 33.5 dB(A) |
 | ||
30 dB silent 40 dB(A) audible 50 dB(A) loud |
||
min: | ||
| Lenovo ThinkPad 13-20GKS01100 6200U, HD Graphics 520 | Lenovo ThinkPad T460-20FN003LGE 6200U, HD Graphics 520 | Acer TravelMate P238-M-5575 6200U, HD Graphics 520 | Asus Zenbook UX303UA-FN121T 6200U, HD Graphics 520 | Acer Aspire S 13 S5-371-71QZ 6500U, HD Graphics 520 | Dell XPS 13-9350 6200U, HD Graphics 520 | Lenovo ThinkPad T460s-20F9003SGE 6200U, HD Graphics 520 | |
|---|---|---|---|---|---|---|---|
| Noise | -4% | -9% | -8% | -8% | 4% | -2% | |
| off / environment * (dB) | 29.1 | 29 -0% | 31.2 -7% | 31.2 -7% | 29.1 -0% | ||
| Idle Minimum * (dB) | 29.1 | 29 -0% | 31.2 -7% | 32.6 -12% | 31.2 -7% | 28.2 3% | 29.1 -0% |
| Idle Average * (dB) | 29.1 | 29 -0% | 31.2 -7% | 32.7 -12% | 31.2 -7% | 28.3 3% | 29.1 -0% |
| Idle Maximum * (dB) | 29.1 | 29 -0% | 31.2 -7% | 32.7 -12% | 31.5 -8% | 28.4 2% | 29.1 -0% |
| Load Average * (dB) | 31.5 | 34.2 -9% | 35.71 -13% | 33.4 -6% | 35.7 -13% | 30.2 4% | 32.3 -3% |
| Load Maximum * (dB) | 33.5 | 37.8 -13% | 38.1 -14% | 33.4 -0% | 35.8 -7% | 30.2 10% | 36.6 -9% |
* ... smaller is better
(±) The maximum temperature on the upper side is 43.7 °C / 111 F, compared to the average of 34.3 °C / 94 F, ranging from 21.2 to 62.5 °C for the class Office.
(±) The bottom heats up to a maximum of 44.2 °C / 112 F, compared to the average of 36.8 °C / 98 F
(+) In idle usage, the average temperature for the upper side is 28.5 °C / 83 F, compared to the device average of 29.5 °C / 85 F.
(+) The palmrests and touchpad are cooler than skin temperature with a maximum of 26.8 °C / 80.2 F and are therefore cool to the touch.
(±) The average temperature of the palmrest area of similar devices was 27.5 °C / 81.5 F (+0.7 °C / 1.3 F).
| Lenovo ThinkPad 13-20GKS01100 6200U, HD Graphics 520 | Lenovo ThinkPad T460-20FN003LGE 6200U, HD Graphics 520 | Acer TravelMate P238-M-5575 6200U, HD Graphics 520 | Asus Zenbook UX303UA-FN121T 6200U, HD Graphics 520 | Acer Aspire S 13 S5-371-71QZ 6500U, HD Graphics 520 | Dell XPS 13-9350 6200U, HD Graphics 520 | Lenovo ThinkPad T460s-20F9003SGE 6200U, HD Graphics 520 | |
|---|---|---|---|---|---|---|---|
| Heat | 7% | 20% | 14% | 8% | 0% | 10% | |
| Maximum Upper Side * (°C) | 43.7 | 37.3 15% | 34.2 22% | 39.7 9% | 38.5 12% | 45.2 -3% | 41.4 5% |
| Maximum Bottom * (°C) | 44.2 | 44.3 -0% | 31 30% | 34.8 21% | 47.7 -8% | 45.2 -2% | 41 7% |
| Idle Upper Side * (°C) | 31.4 | 29 8% | 27.1 14% | 27.4 13% | 27.2 13% | 30.4 3% | 26.7 15% |
| Idle Bottom * (°C) | 32.1 | 30.1 6% | 27.7 14% | 27.7 14% | 27.4 15% | 31.2 3% | 27.8 13% |
* ... smaller is better
| Off / Standby | |
| Idle | |
| Load |
|
Key:
min: | |
| Lenovo ThinkPad 13-20GKS01100 6200U, HD Graphics 520, 1920x1080 | Lenovo ThinkPad T460-20FN003LGE 6200U, HD Graphics 520, 1920x1080 | Acer TravelMate P238-M-5575 6200U, HD Graphics 520, 1366x768 | Asus Zenbook UX303UA-FN121T 6200U, HD Graphics 520, 1366x768 | Acer Aspire S 13 S5-371-71QZ 6500U, HD Graphics 520, 1920x1080 | Lenovo ThinkPad T460s-20F9003SGE 6200U, HD Graphics 520, 1920x1080 | |
|---|---|---|---|---|---|---|
| Power Consumption | -14% | -2% | -12% | -20% | -14% | |
| Idle Minimum * (Watt) | 3.1 | 3.5 -13% | 3.2 -3% | 4.2 -35% | 4.1 -32% | 3.7 -19% |
| Idle Average * (Watt) | 5.5 | 6.7 -22% | 5.5 -0% | 6.2 -13% | 6.7 -22% | 6.8 -24% |
| Idle Maximum * (Watt) | 6 | 7.3 -22% | 6 -0% | 6.4 -7% | 7.4 -23% | 7.3 -22% |
| Load Average * (Watt) | 25.8 | 28.2 -9% | 29.5 -14% | 29 -12% | 32.4 -26% | 26.3 -2% |
| Load Maximum * (Watt) | 33.6 | 34.6 -3% | 30.9 8% | 31 8% | 32.4 4% | 34.6 -3% |
* ... smaller is better
| Lenovo ThinkPad 13-20GKS01100 42 Wh | Lenovo ThinkPad T460-20FN003LGE 46 Wh | Acer TravelMate P238-M-5575 49.7 Wh | Asus Zenbook UX303UA-FN121T 50 Wh | Acer Aspire S 13 S5-371-71QZ 45 Wh | Dell XPS 13-9350 56 Wh | Lenovo ThinkPad T460s-20F9003SGE 49 Wh | |
|---|---|---|---|---|---|---|---|
| Battery runtime | -7% | 33% | 18% | 4% | 6% | 1% | |
| Reader / Idle (h) | 15.7 | 15.9 1% | 21.5 37% | 17.1 9% | 13 -17% | 15.3 -3% | |
| H.264 (h) | 7.8 | 8.5 9% | 9.3 19% | 8.9 14% | |||
| WiFi v1.3 (h) | 6.2 | 5.6 -10% | 10.1 63% | 7.3 18% | 7.9 27% | 7.5 21% | 6.6 6% |
| Load (h) | 2.2 | 1.6 -27% | 2.5 14% | 1.7 -23% | 2.5 14% | 1.9 -14% |
Pros
Cons
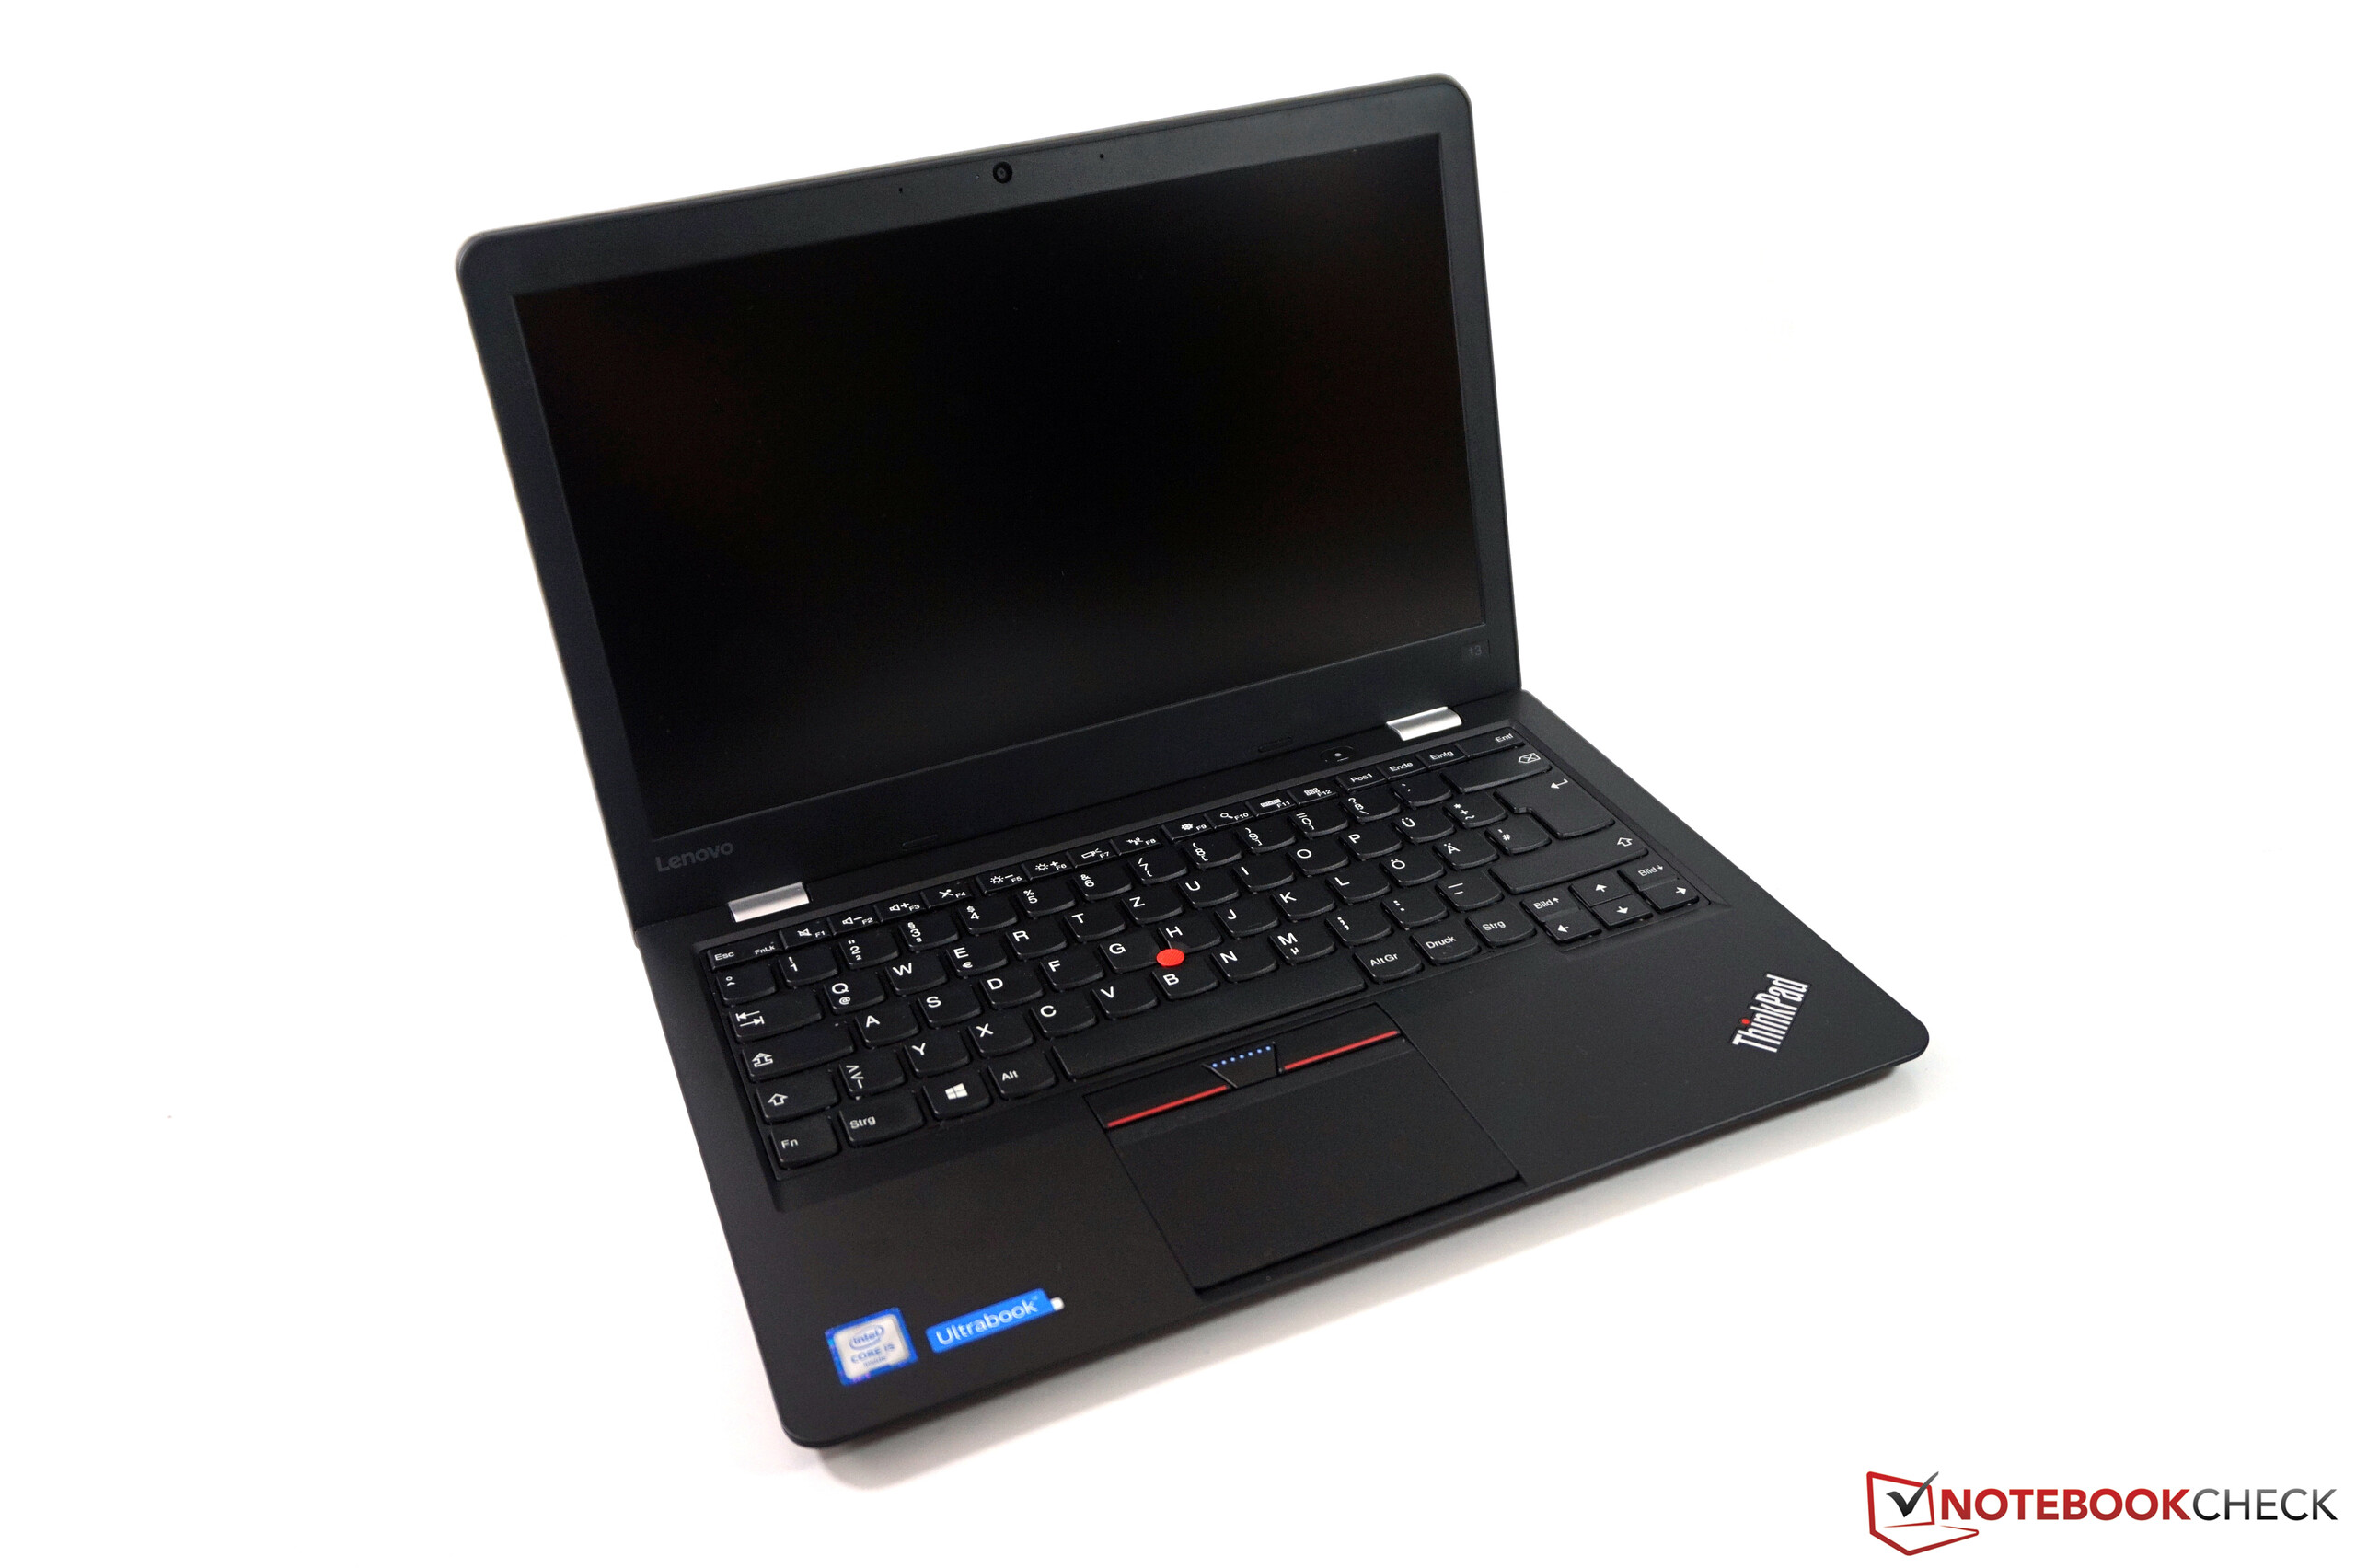
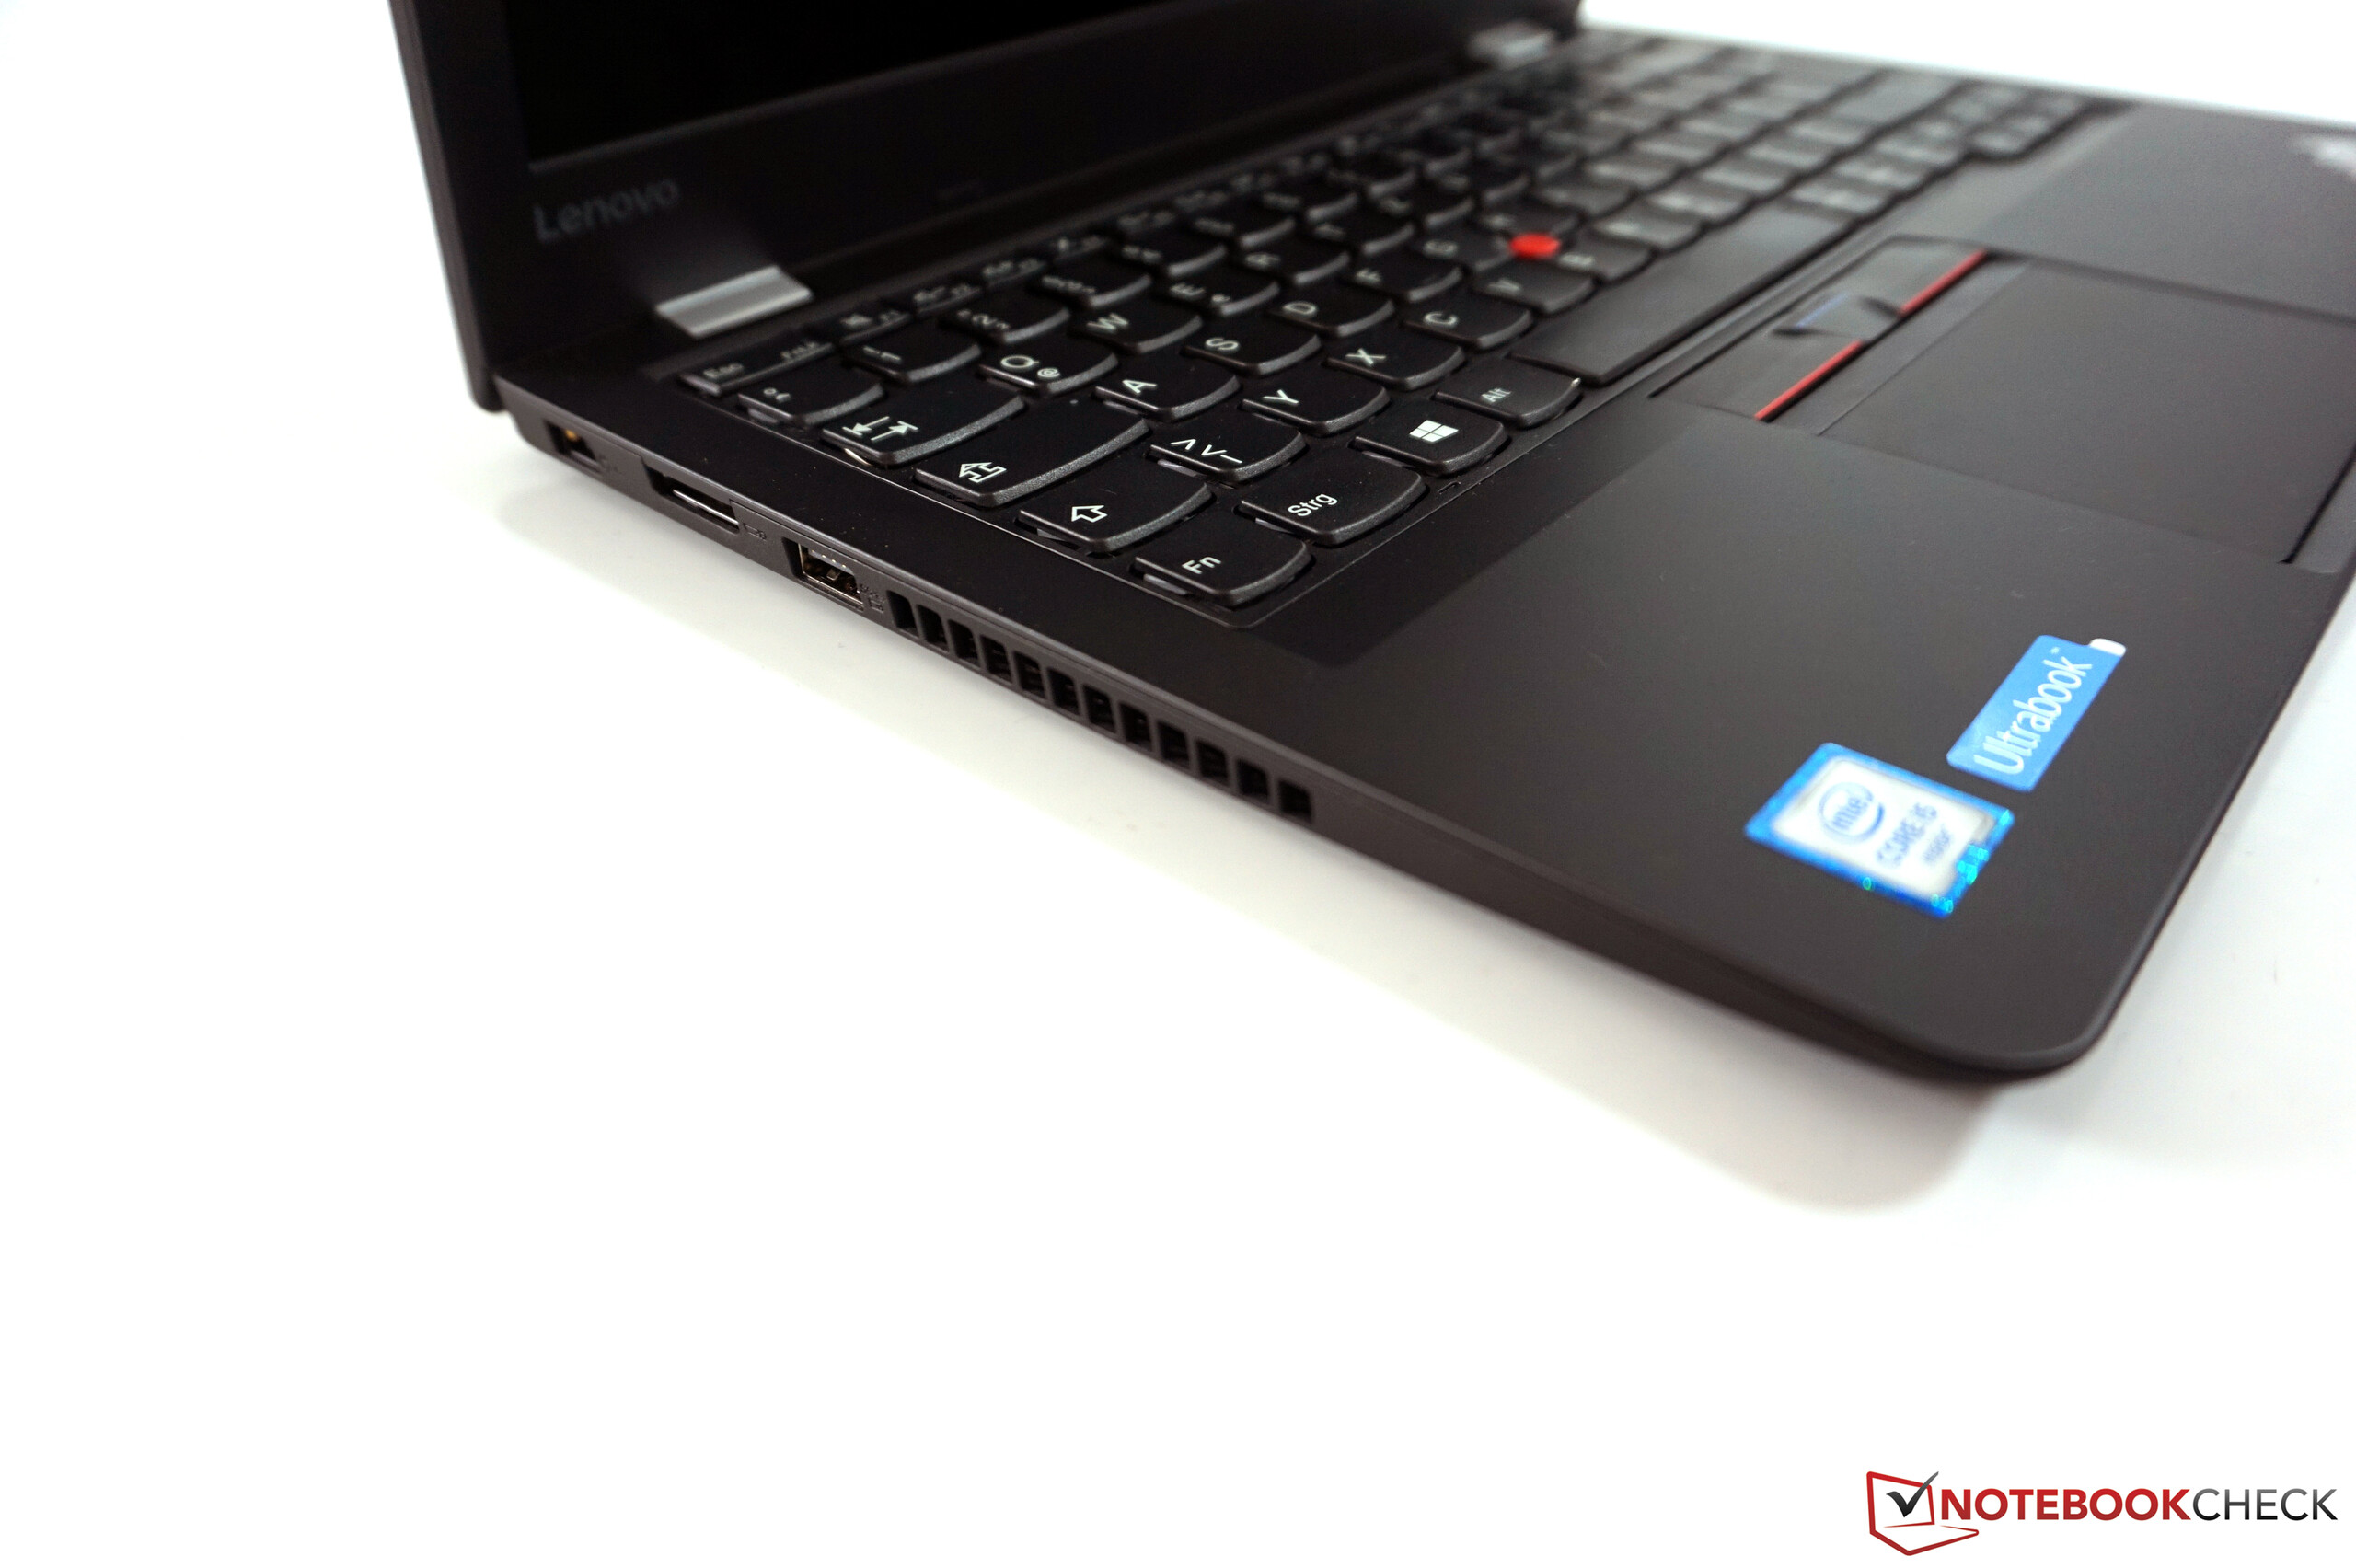
最新的ThinkPad 13是一台有趣的设备:它是采用了最新硬件和接口的超极本,在我们的测试中没有表现出任何严重问题。我们得到了一块不错的全高清IPS屏幕,不过它的亮度还要更高些才能适合户外使用。它的性能表现得力于固态硬盘的帮助也十分优秀,我们很喜欢它出色的ThinkPad键盘,尽管它没有提供背光。
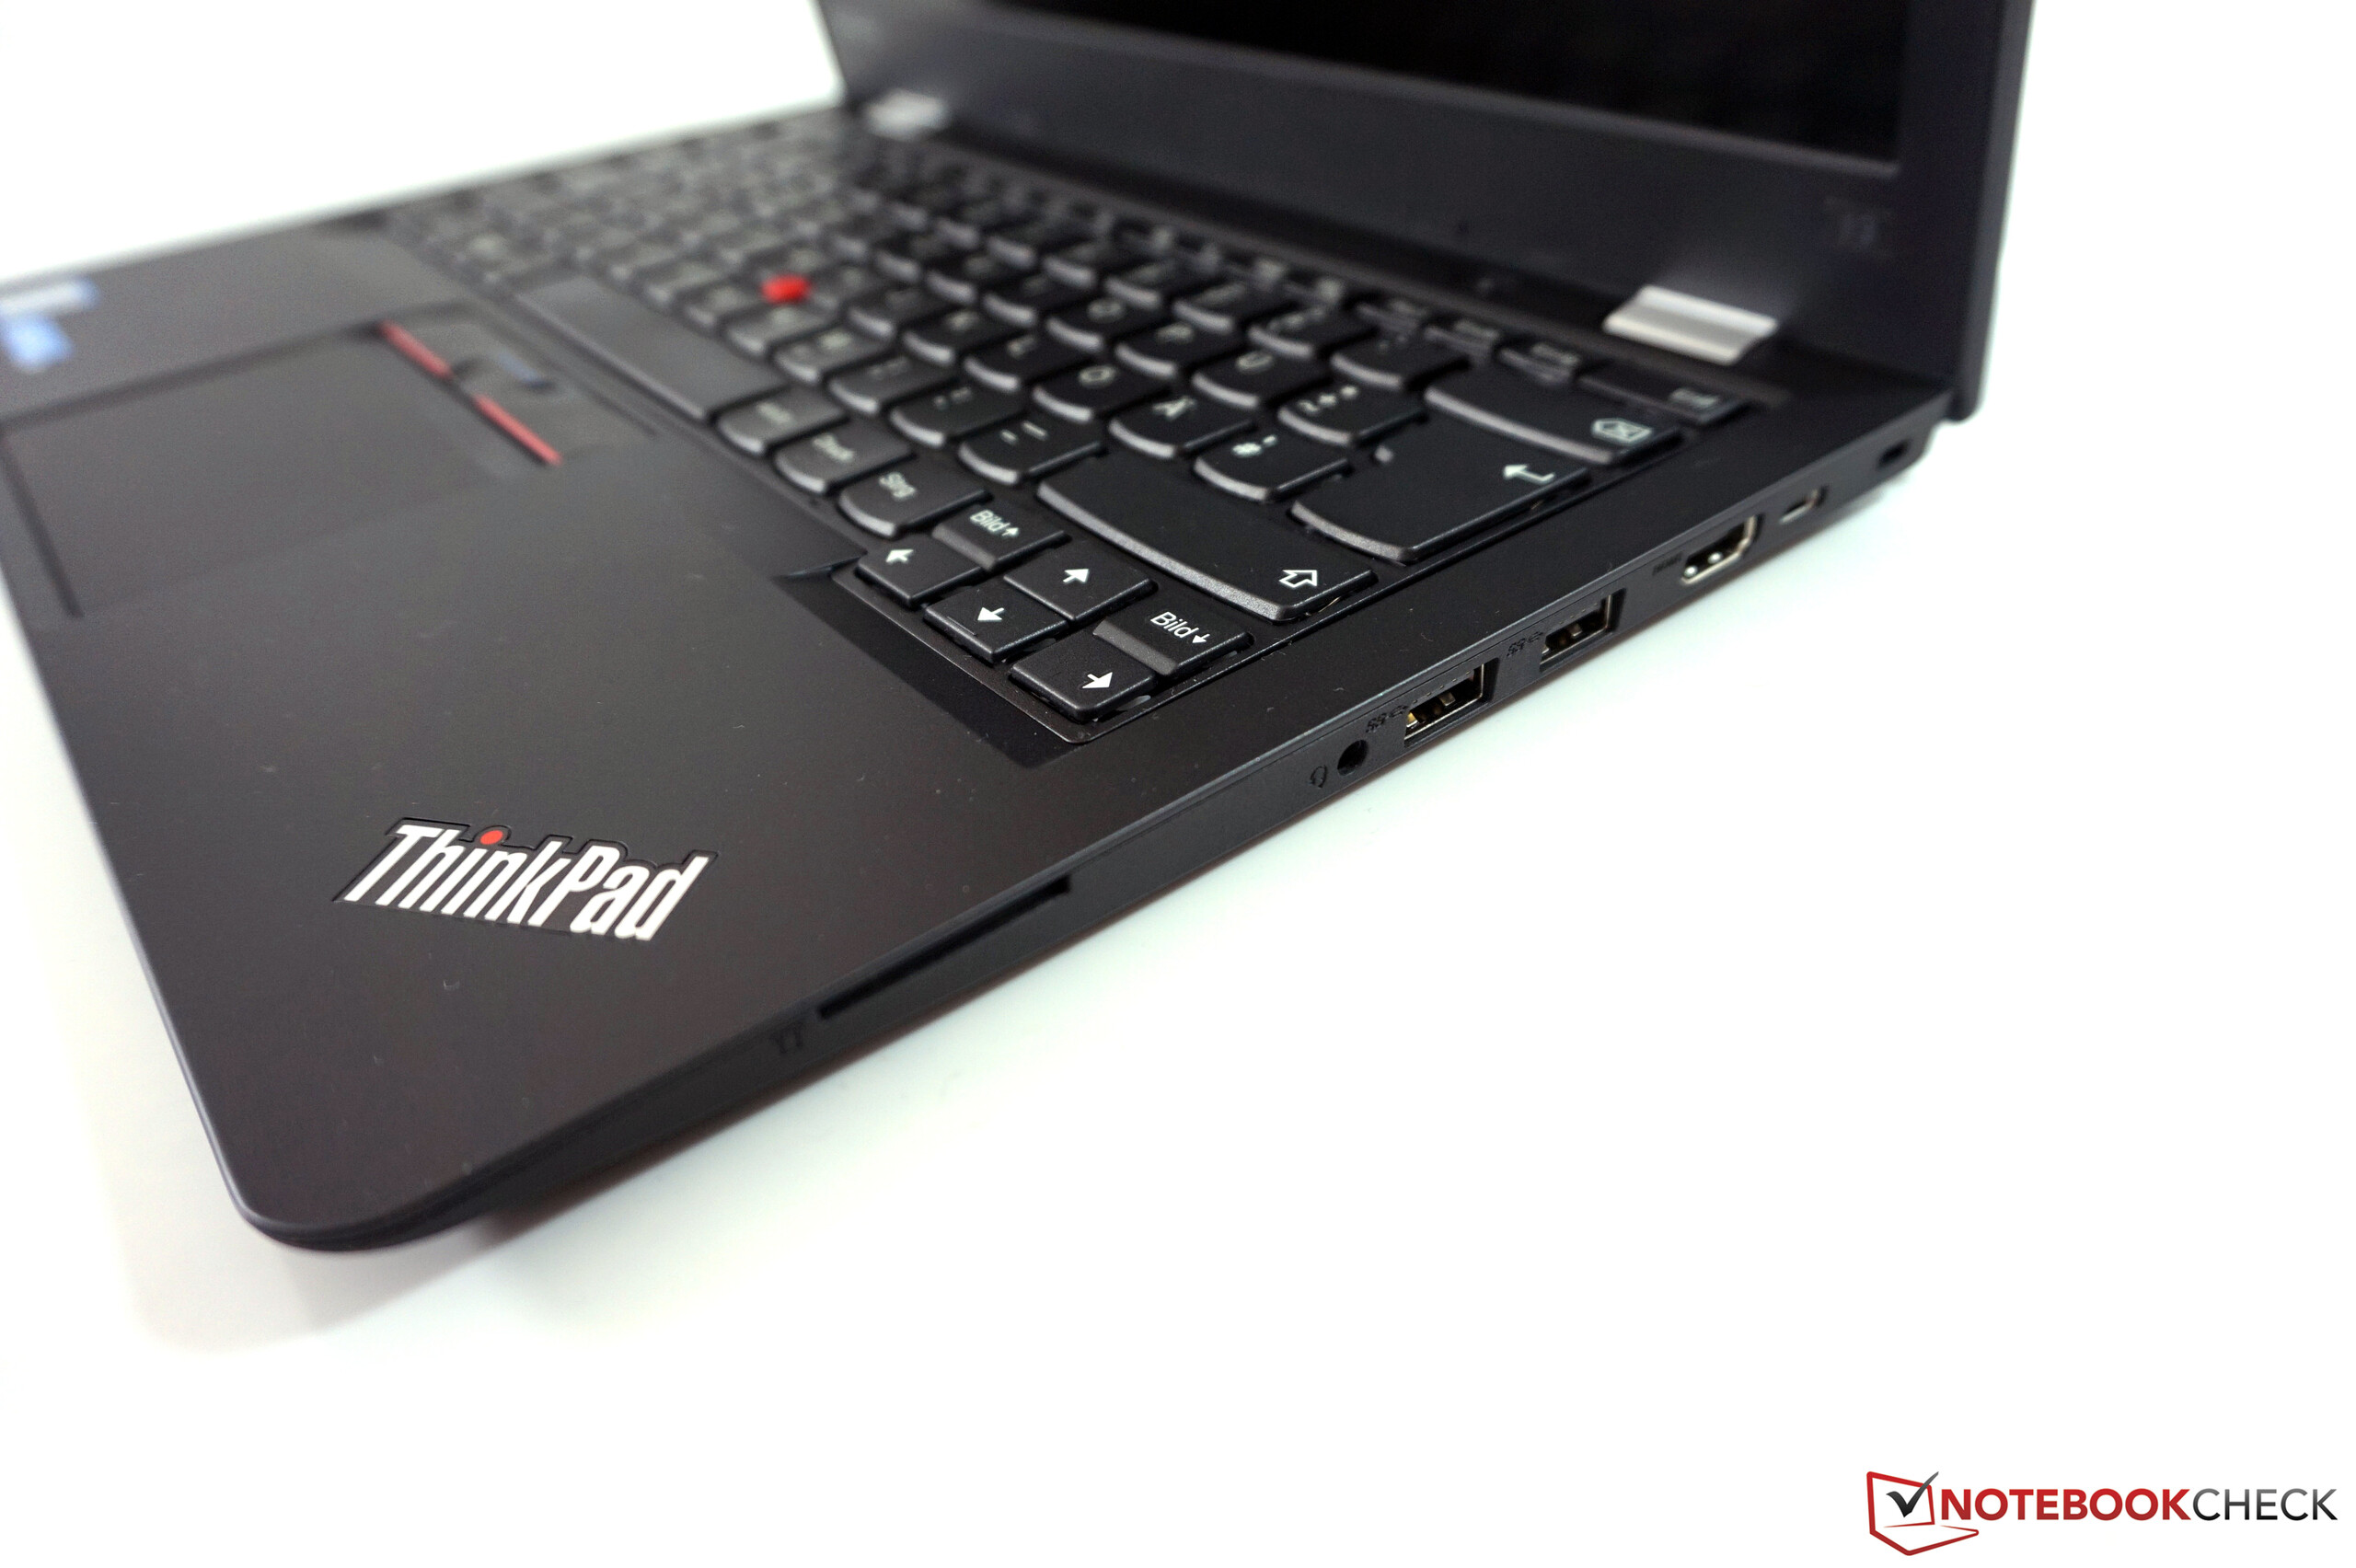
你需要在机身品质上做出一些妥协。它的底座稳定性还是很优秀,不过屏幕的抗压抗弯折能力较差。它的屏幕转轴也不够稳定,无法避免屏幕的晃动。在安全性能上它也受到了一些限制。
ThinkPad 13的校园版特别值得推荐。如果需要全价购买,它1000欧元(约7435人民币)的售价的竞争力有打了一些折扣,戴尔XPS 13也是个非常优秀的选择。
与另外两台ThinkPad机型的对比也十分有趣。它们的性能几乎相同,在电池续航上也十分接近。额外的预算可以给你带来更坚固的机身,背光键盘和更全面的安全功能以及更长的质保时间。在屏幕上则比较复杂。我们的T460和T460s机型都搭配了来自Innolux的屏幕面板,在这方面ThinkPad 13的LG屏幕则占了上风。
ThinkPad 13和ThinkPad T460相比来自华硕和Acer的实惠型设备提供了更好的品质,特别是在你能得到教育优惠的情况下。ThinkPad 13在便携性上相比T460占优,因此用户需要根据实际需要定夺。如果你每天都会带着笔记本电脑去学校的话,ThinkPad 13当然是个更好的选择。在1000欧元(约7435人民币)的全价上我们则无法推荐这款设备了。戴尔 XPS 13是这个价位上目前最好的选择之一。
注:本文是基于完整评测的缩减版本,阅读完整的英文评测,请点击这里。
Lenovo ThinkPad 13-20GKS01100
- 04/28/2017 v6 (old)
Andreas Osthoff
Price comparison
