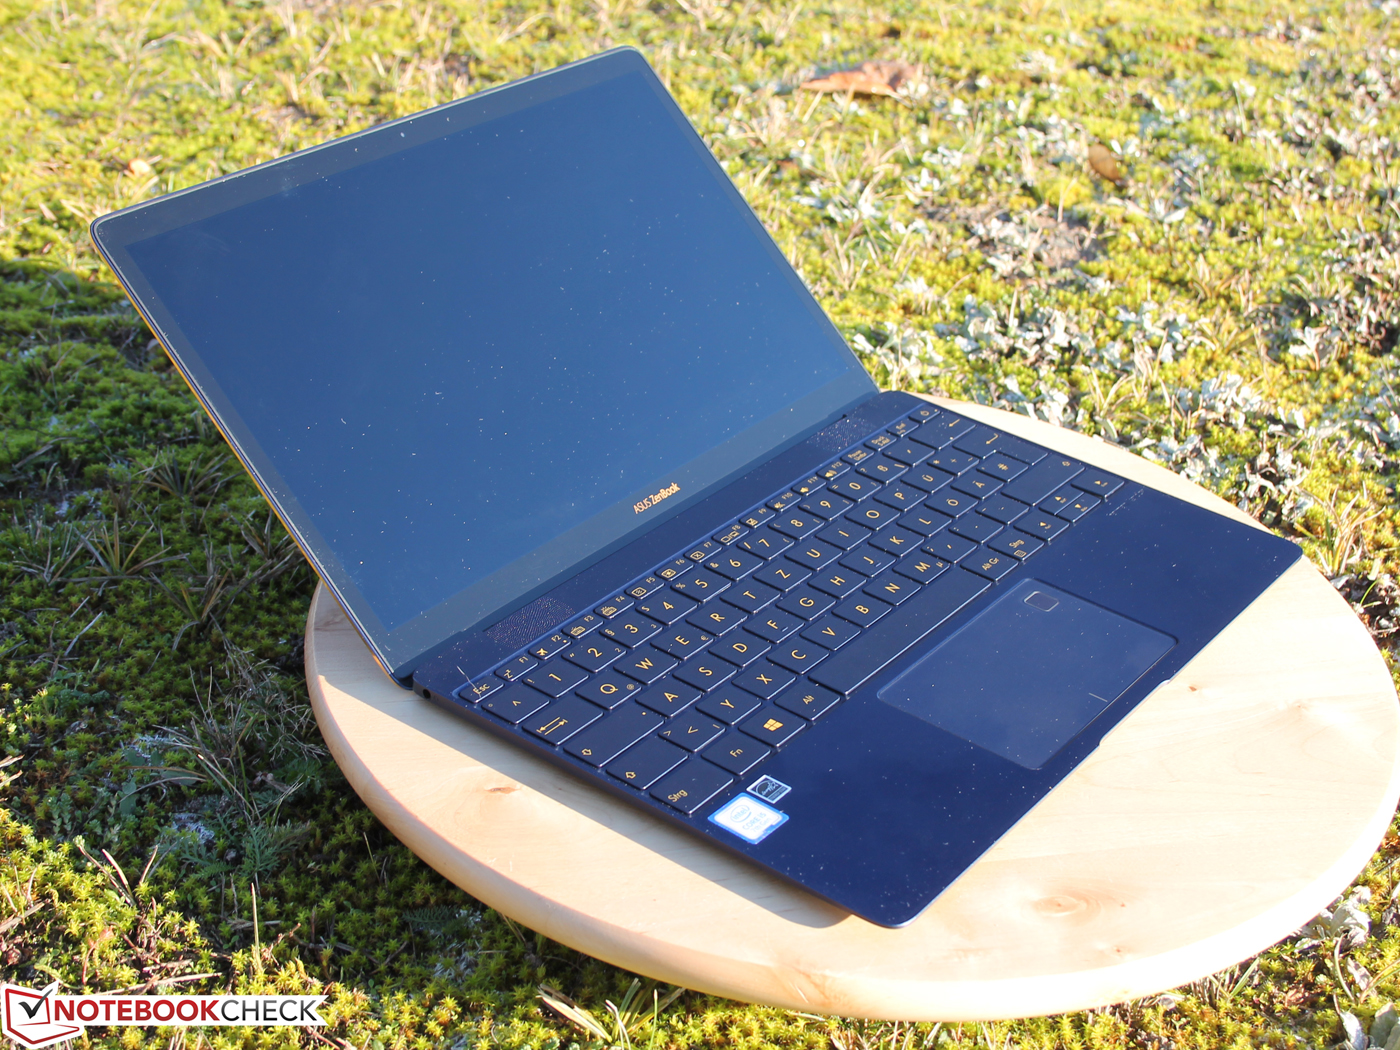
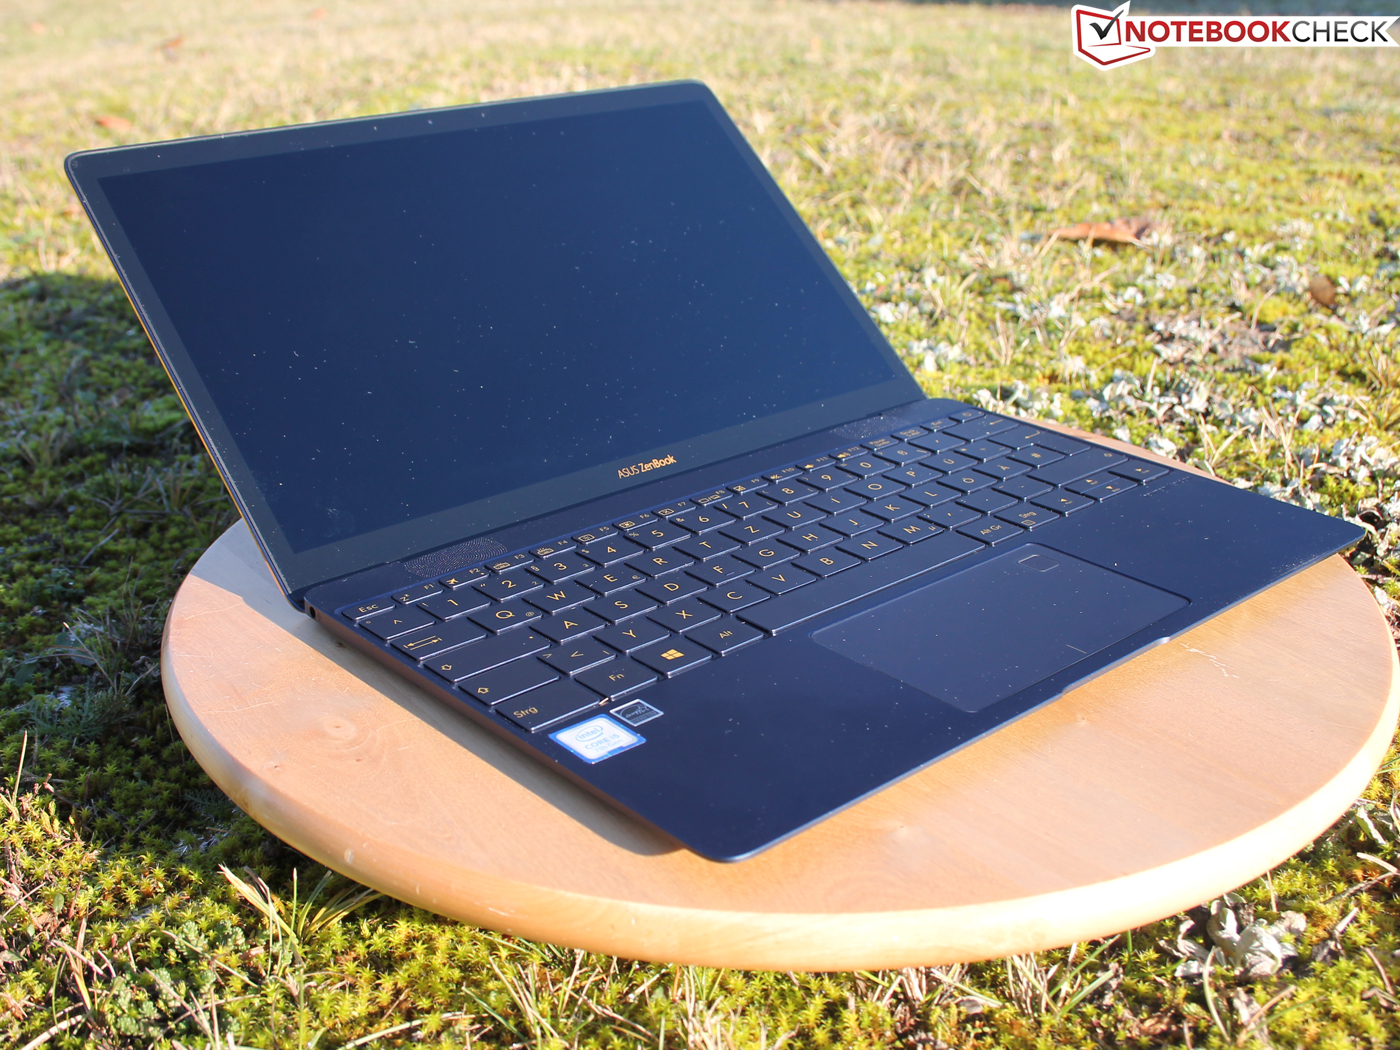
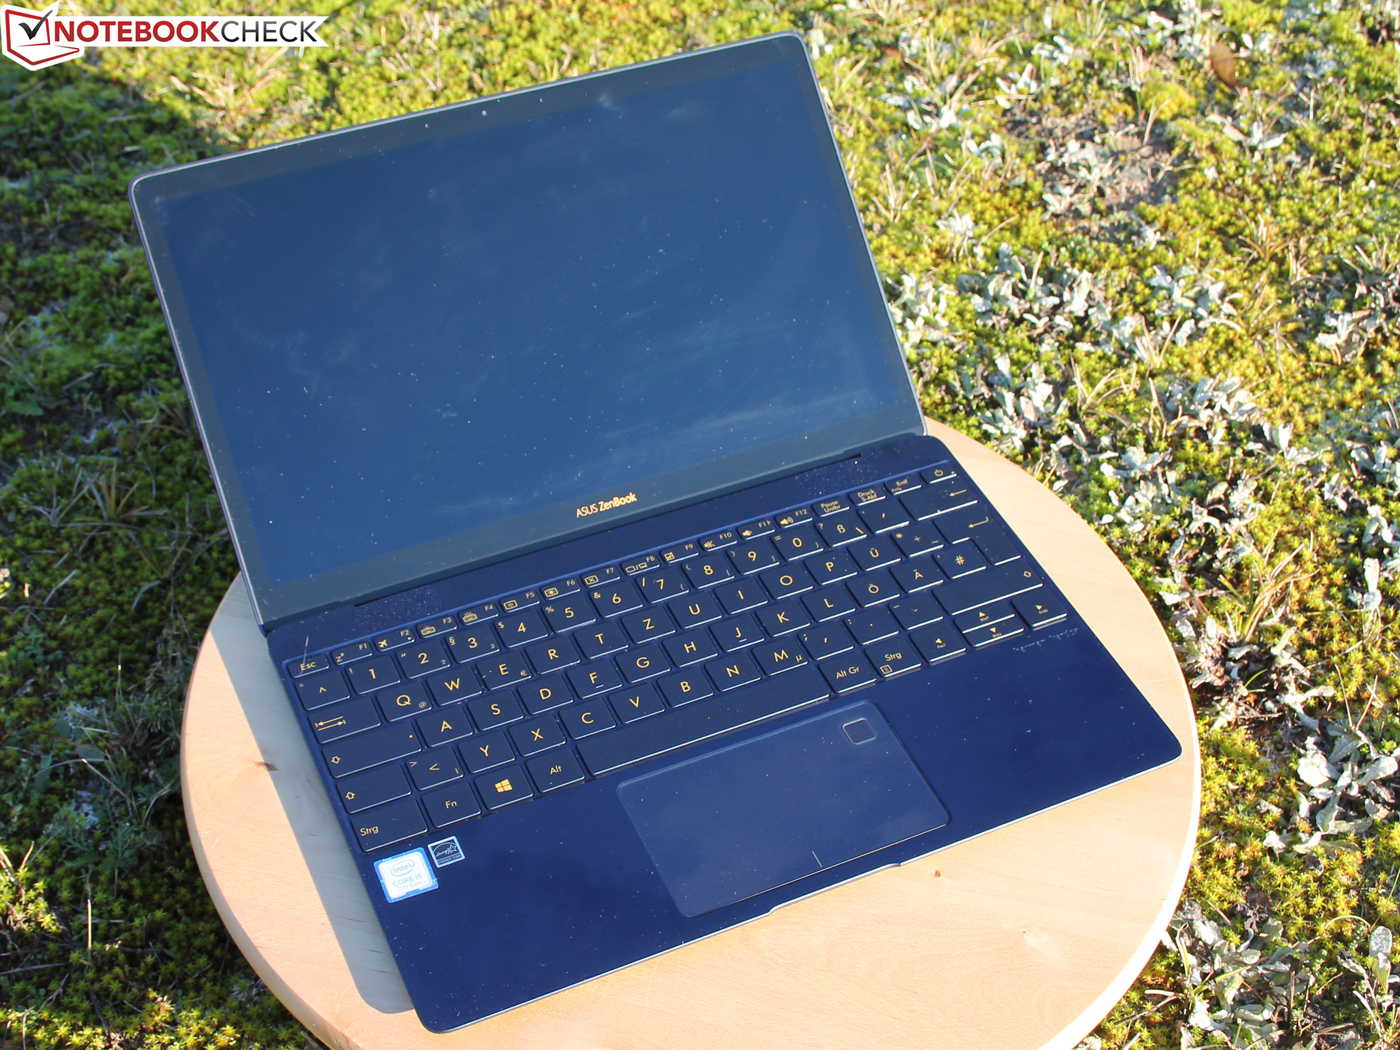
华硕 Zenbook 3 UX390UA-GS041T 笔记本电脑简短评测
| Networking | |
| iperf Server (receive) TCP 1 m | |
| Asus Zenbook 3 UX390UA-GS041T (jseb) | |
| Apple MacBook 12 (Early 2016) 1.1 GHz | |
| Razer Blade Stealth QHD i7-7500U (sim) | |
| Acer Aspire S 13 S5-371-71QZ | |
| iperf Client (transmit) TCP 1 m | |
| Asus Zenbook 3 UX390UA-GS041T (jseb) | |
| Razer Blade Stealth QHD i7-7500U (sim) | |
| Apple MacBook 12 (Early 2016) 1.1 GHz | |
| Acer Aspire S 13 S5-371-71QZ | |
| |||||||||||||||||||||||||
Brightness Distribution: 87 %
Center on Battery: 355 cd/m²
Contrast: 1183:1 (Black: 0.3 cd/m²)
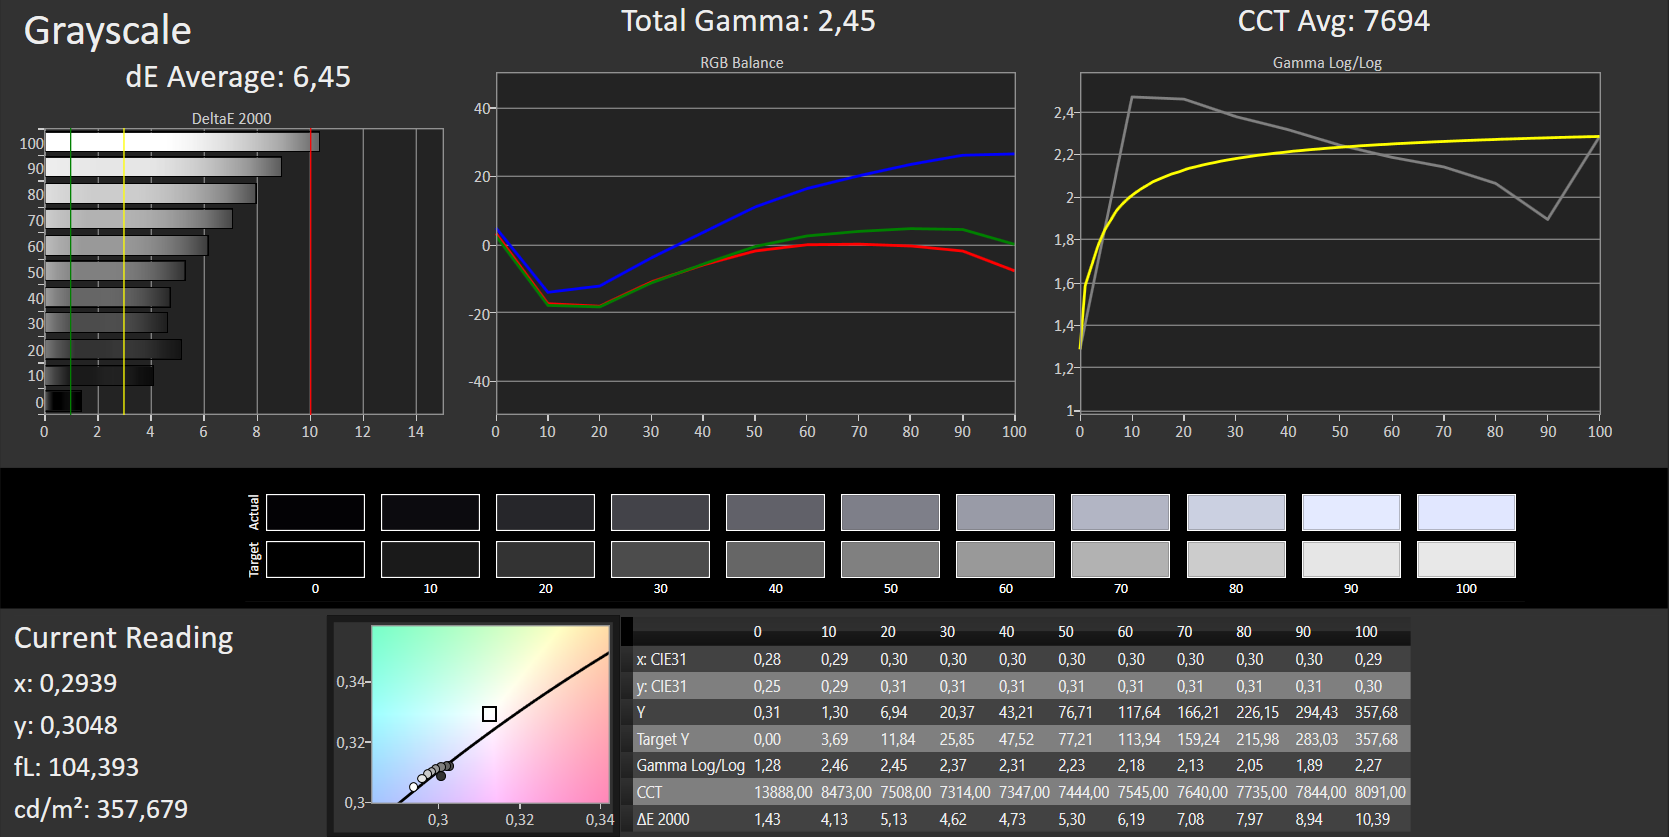
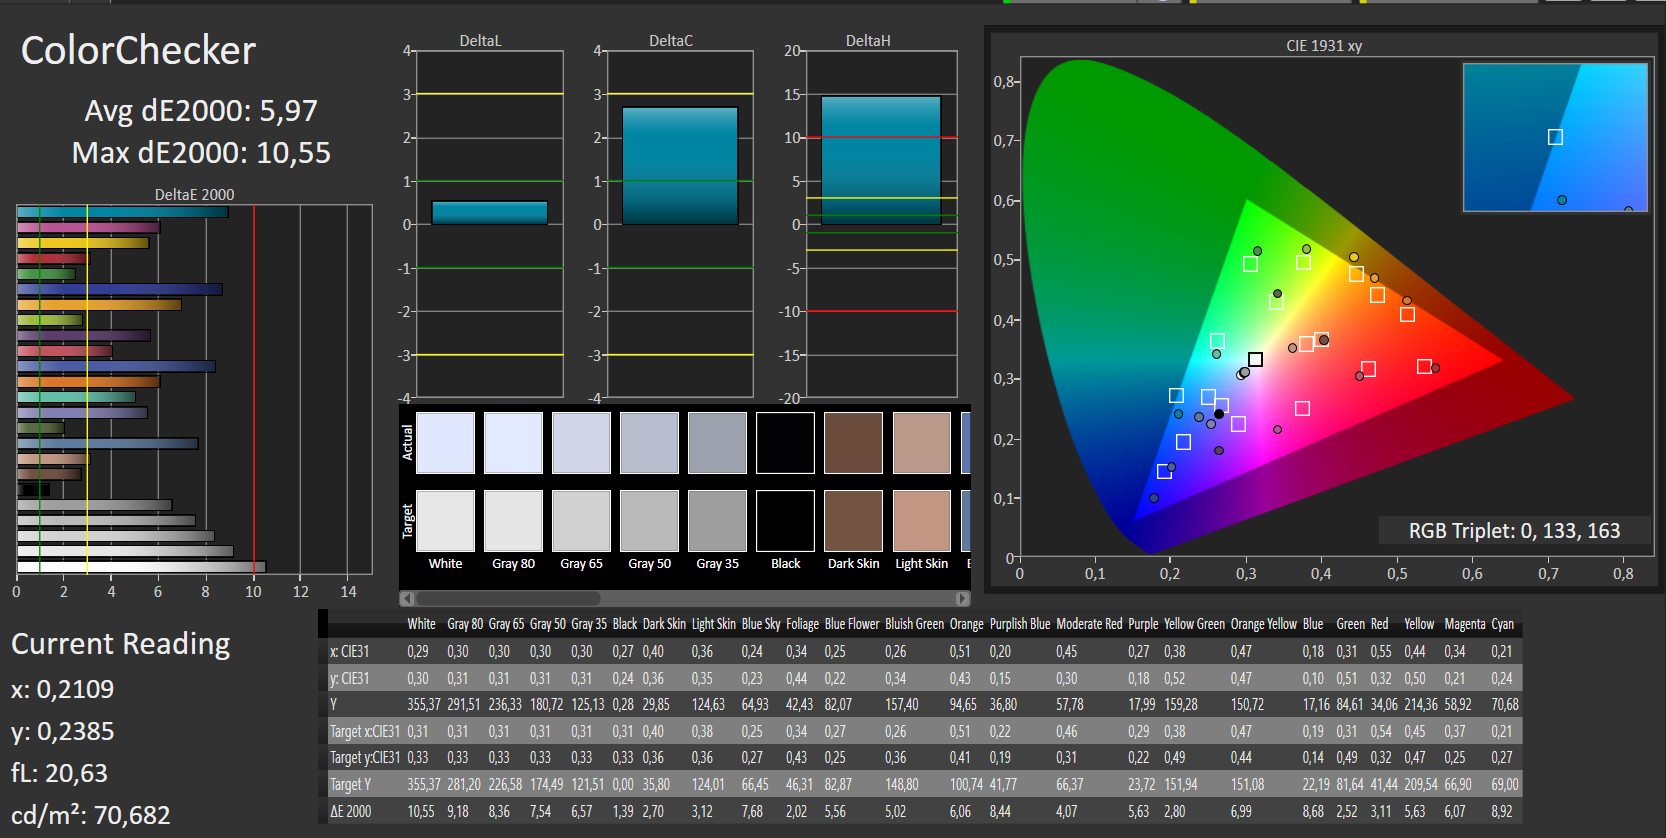
ΔE ColorChecker Calman: 5.97 | ∀{0.5-29.43 Ø4.71}
ΔE Greyscale Calman: 6.45 | ∀{0.09-98 Ø4.96}
89% sRGB (Argyll 1.6.3 3D)
58% AdobeRGB 1998 (Argyll 1.6.3 3D)
65.4% AdobeRGB 1998 (Argyll 3D)
89.6% sRGB (Argyll 3D)
64.7% Display P3 (Argyll 3D)
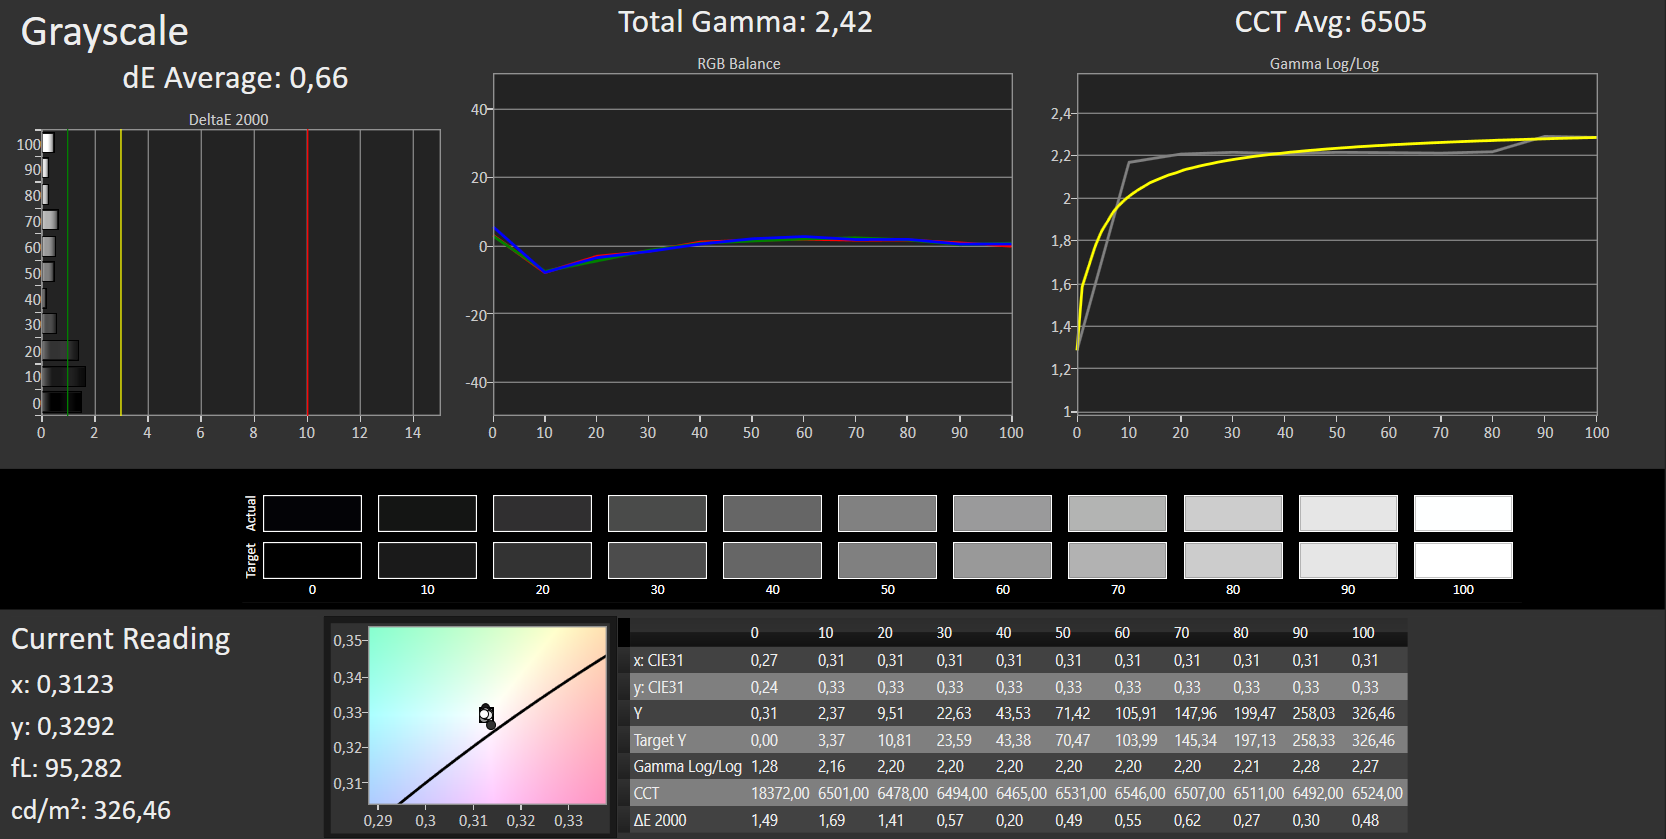
Gamma: 2.45
CCT: 7694 K
| Asus Zenbook 3 UX390UA-GS041T AUO B125HAN03.0 AUO306D, , 1920x1080, 12.5" | Apple MacBook 12 (Early 2016) 1.1 GHz APPA027, , 2304x1440, 12" | Dell XPS 13 9360 QHD+ i7 Sharp SHP144A, , 3200x1800, 13.3" | HP EliteBook Folio G1 V1C37EA AUO226D, , 1920x1080, 12.5" | Razer Blade Stealth QHD i7-7500U Sharp SHP142F (LQ125T1JW02), , 2560x1440, 12.5" | Acer Aspire S 13 S5-371-71QZ AUO B133HAN04.1, , 1920x1080, 13.3" | HP Spectre 13 1920x1080, 13.3" | |
|---|---|---|---|---|---|---|---|
| Display | 4% | -1% | -29% | 7% | 3% | ||
| Display P3 Coverage (%) | 64.7 | 66.8 3% | 62.8 -3% | 44.45 -31% | 68.7 6% | 65.6 1% | |
| sRGB Coverage (%) | 89.6 | 95.4 6% | 89.4 0% | 65.2 -27% | 95.8 7% | 94.7 6% | |
| AdobeRGB 1998 Coverage (%) | 65.4 | 68 4% | 64.6 -1% | 45.96 -30% | 69.9 7% | 67.5 3% | |
| Response Times | -27% | -29% | 1% | -26% | -41% | -49% | |
| Response Time Grey 50% / Grey 80% * (ms) | 30 ? | 41.2 ? -37% | 43.6 ? -45% | 32 ? -7% | 37 ? -23% | 50 ? -67% | 50.8 ? -69% |
| Response Time Black / White * (ms) | 26 ? | 30.4 ? -17% | 29.2 ? -12% | 24 ? 8% | 33.4 ? -28% | 29.6 ? -14% | 33.2 ? -28% |
| PWM Frequency (Hz) | 50 ? | 200 ? | |||||
| Screen | 15% | 15% | -3% | 7% | 4% | 21% | |
| Brightness middle (cd/m²) | 355 | 387 9% | 396.2 12% | 289 -19% | 402 13% | 375 6% | 300.5 -15% |
| Brightness (cd/m²) | 341 | 358 5% | 357 5% | 298 -13% | 382 12% | 358 5% | 305 -11% |
| Brightness Distribution (%) | 87 | 88 1% | 84 -3% | 87 0% | 88 1% | 87 0% | 76 -13% |
| Black Level * (cd/m²) | 0.3 | 0.47 -57% | 0.266 11% | 0.27 10% | 0.45 -50% | 0.39 -30% | 0.184 39% |
| Contrast (:1) | 1183 | 823 -30% | 1489 26% | 1070 -10% | 893 -25% | 962 -19% | 1633 38% |
| Colorchecker dE 2000 * | 5.97 | 1.6 73% | 3.9 35% | 4.82 19% | 3.6 40% | 4.6 23% | 2.64 56% |
| Colorchecker dE 2000 max. * | 10.55 | 4 62% | 7.58 28% | 10.73 -2% | 7.5 29% | 8.8 17% | 5.06 52% |
| Greyscale dE 2000 * | 6.45 | 1 84% | 4.16 36% | 3.84 40% | 4.3 33% | 4 38% | 2.8 57% |
| Gamma | 2.45 90% | 2.26 97% | 2.31 95% | 2.41 91% | 2.1 105% | 2.34 94% | 2.16 102% |
| CCT | 7694 84% | 6680 97% | 6514 100% | 6492 100% | 6572 99% | 7304 89% | 6999 93% |
| Color Space (Percent of AdobeRGB 1998) (%) | 58 | 61.6 6% | 57.5 -1% | 42.03 -28% | 62.3 7% | 57.9 0% | 60.9 5% |
| Color Space (Percent of sRGB) (%) | 89 | 82.2 -8% | 88.7 0% | 64.8 -27% | 95.7 8% | 88.7 0% | 94.3 6% |
| Total Average (Program / Settings) | -3% /
7% | -5% /
6% | -10% /
-8% | -4% /
2% | -19% /
-3% | -8% /
8% |
* ... smaller is better

Display Response Times
| ↔ Response Time Black to White | ||
|---|---|---|
| 26 ms ... rise ↗ and fall ↘ combined | ↗ 6 ms rise | 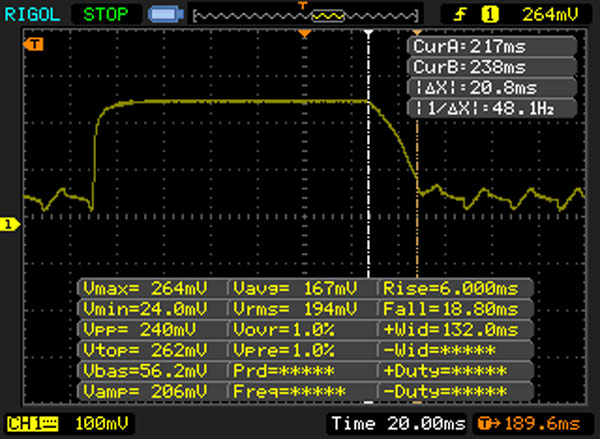 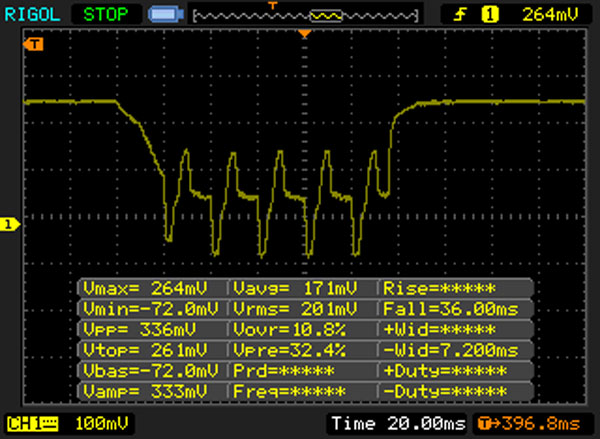 |
| ↘ 20 ms fall | ||
| The screen shows relatively slow response rates in our tests and may be too slow for gamers. In comparison, all tested devices range from 0.1 (minimum) to 240 (maximum) ms. » 63 % of all devices are better. This means that the measured response time is worse than the average of all tested devices (19.8 ms). | ||
| ↔ Response Time 50% Grey to 80% Grey | ||
| 30 ms ... rise ↗ and fall ↘ combined | ↗ 13 ms rise | 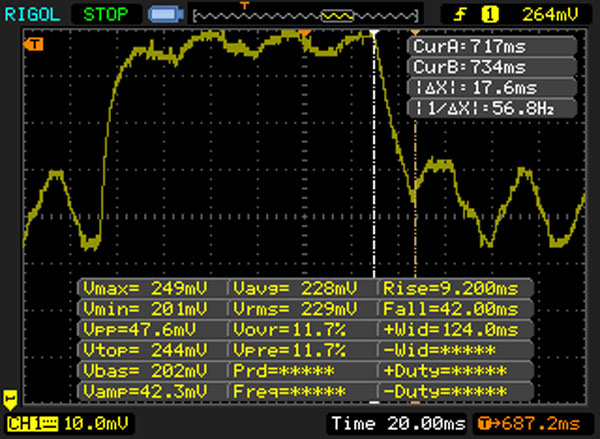 |
| ↘ 17 ms fall | ||
| The screen shows slow response rates in our tests and will be unsatisfactory for gamers. In comparison, all tested devices range from 0.165 (minimum) to 636 (maximum) ms. » 40 % of all devices are better. This means that the measured response time is similar to the average of all tested devices (31 ms). | ||
Screen Flickering / PWM (Pulse-Width Modulation)
| Screen flickering / PWM detected | 50 Hz | ≤ 10 % brightness setting | 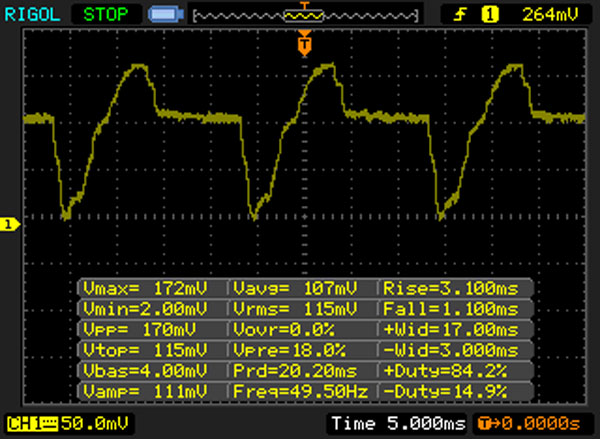 |
The display backlight flickers at 50 Hz (worst case, e.g., utilizing PWM) Flickering detected at a brightness setting of 10 % and below. There should be no flickering or PWM above this brightness setting. The frequency of 50 Hz is very low, so the flickering may cause eyestrain and headaches after extended use. In comparison: 52 % of all tested devices do not use PWM to dim the display. If PWM was detected, an average of 7754 (minimum: 5 - maximum: 343500) Hz was measured. | |||

| PCMark 8 Home Score Accelerated v2 | 2880 points | |
| PCMark 8 Work Score Accelerated v2 | 4326 points | |
Help | ||
| Asus Zenbook 3 UX390UA-GS041T SK Hynix Canvas SC300 512GB M.2 (HFS512G39MND) | Apple MacBook 12 (Early 2016) 1.1 GHz Apple SSD AP0256 | Dell XPS 13 9360 QHD+ i7 Toshiba NVMe THNSN5256GPUK | HP EliteBook Folio G1 V1C37EA Samsung SM951 MZVPV256 m.2 | Razer Blade Stealth QHD i7-7500U Samsung PM951 NVMe MZVLV256 | Acer Aspire S 13 S5-371-71QZ LiteOn CV1-8B512 | HP Spectre 13 Samsung PM951 NVMe MZVLV256 | |
|---|---|---|---|---|---|---|---|
| CrystalDiskMark 3.0 | 27% | 74% | 127% | 60% | 2% | 49% | |
| Read Seq (MB/s) | 508 | 754 48% | 1214 139% | 1482 192% | 1178 132% | 502 -1% | 1322 160% |
| Write Seq (MB/s) | 454.4 | 638 40% | 655 44% | 1232 171% | 305.4 -33% | 418.9 -8% | 305.5 -33% |
| Read 512 (MB/s) | 335.5 | 616 84% | 1019 204% | 1191 255% | 638 90% | 341.3 2% | 621 85% |
| Write 512 (MB/s) | 413.9 | 678 64% | 445.7 8% | 1220 195% | 305.7 -26% | 389.7 -6% | 306 -26% |
| Read 4k (MB/s) | 28.13 | 14.6 -48% | 35.55 26% | 46.96 67% | 38.54 37% | 29.69 6% | 40.09 43% |
| Write 4k (MB/s) | 69.8 | 20.5 -71% | 130 86% | 100.7 44% | 153.4 120% | 86.8 24% | 119 70% |
| Read 4k QD32 (MB/s) | 245.7 | 464 89% | 537 119% | 464 89% | 614 150% | 301.3 23% | 513 109% |
| Write 4k QD32 (MB/s) | 277.6 | 315 13% | 173.8 -37% | 292.1 5% | 302.7 9% | 211.2 -24% | 231.5 -17% |

| 3DMark 11 Performance | 1704 points | |
| 3DMark Cloud Gate Standard Score | 5989 points | |
Help | ||
| BioShock Infinite - 1280x720 Very Low Preset | |
| Acer Aspire S 13 S5-371-71QZ | |
| Dell XPS 13 9360 QHD+ i7 | |
| HP Spectre 13 | |
| Asus Zenbook 3 UX390UA-GS041T | |
| HP EliteBook Folio G1 V1C37EA | |
| Thief - 1024x768 Very Low Preset | |
| Asus Zenbook 3 UX390UA-GS041T | |
| Dirt Rally - 1024x768 Ultra Low Preset | |
| Asus Zenbook 3 UX390UA-GS041T | |
| Rise of the Tomb Raider - 1024x768 Lowest Preset | |
| Dell XPS 13 9360 QHD+ i7 | |
| Razer Blade Stealth QHD i7-7500U | |
| Asus Zenbook 3 UX390UA-GS041T | |
| Doom - 1280x720 Low Preset | |
| Asus Zenbook 3 UX390UA-GS041T | |
| low | med. | high | ultra | |
|---|---|---|---|---|
| BioShock Infinite (2013) | 51 | 27.2 | 20.7 | |
| Thief (2014) | 14 | 8.4 | ||
| Dirt Rally (2015) | 119 | 34.5 | 15 | |
| Rise of the Tomb Raider (2016) | 18.8 | 9.4 | ||
| Doom (2016) | 22.6 |
| Asus Zenbook 3 UX390UA-GS041T HD Graphics 620, i5-7200U, SK Hynix Canvas SC300 512GB M.2 (HFS512G39MND) | Apple MacBook 12 (Early 2016) 1.1 GHz HD Graphics 515, 6Y30, Apple SSD AP0256 | Dell XPS 13 9360 QHD+ i7 HD Graphics 620, i7-7500U, Toshiba NVMe THNSN5256GPUK | HP EliteBook Folio G1 V1C37EA HD Graphics 515, 6Y54, Samsung SM951 MZVPV256 m.2 | Razer Blade Stealth QHD i7-7500U HD Graphics 620, i7-7500U, Samsung PM951 NVMe MZVLV256 | Acer Aspire S 13 S5-371-71QZ HD Graphics 520, 6500U, LiteOn CV1-8B512 | HP Spectre 13 HD Graphics 520, 6500U, Samsung PM951 NVMe MZVLV256 | |
|---|---|---|---|---|---|---|---|
| Noise | 7% | 1% | 1% | 1% | |||
| off / environment * (dB) | 30.7 | 28.8 6% | 31 -1% | 31.2 -2% | 28.5 7% | ||
| Idle Minimum * (dB) | 30.7 | 28.8 6% | 31 -1% | 31.2 -2% | 28.5 7% | ||
| Idle Average * (dB) | 30.7 | 28.8 6% | 31 -1% | 31.2 -2% | 30.9 -1% | ||
| Idle Maximum * (dB) | 30.9 | 30.8 -0% | 31 -0% | 31.5 -2% | 31.6 -2% | ||
| Load Average * (dB) | 38.7 | 34.8 10% | 35 10% | 35.7 8% | 38.8 -0% | ||
| Load Maximum * (dB) | 38.9 | 34.8 11% | 40.5 -4% | 35.8 8% | 41.4 -6% |
* ... smaller is better
Noise level
| Idle |
| 30.7 / 30.7 / 30.9 dB(A) |
| Load |
| 38.7 / 38.9 dB(A) |
 | ||
30 dB silent 40 dB(A) audible 50 dB(A) loud |
||
min: | ||
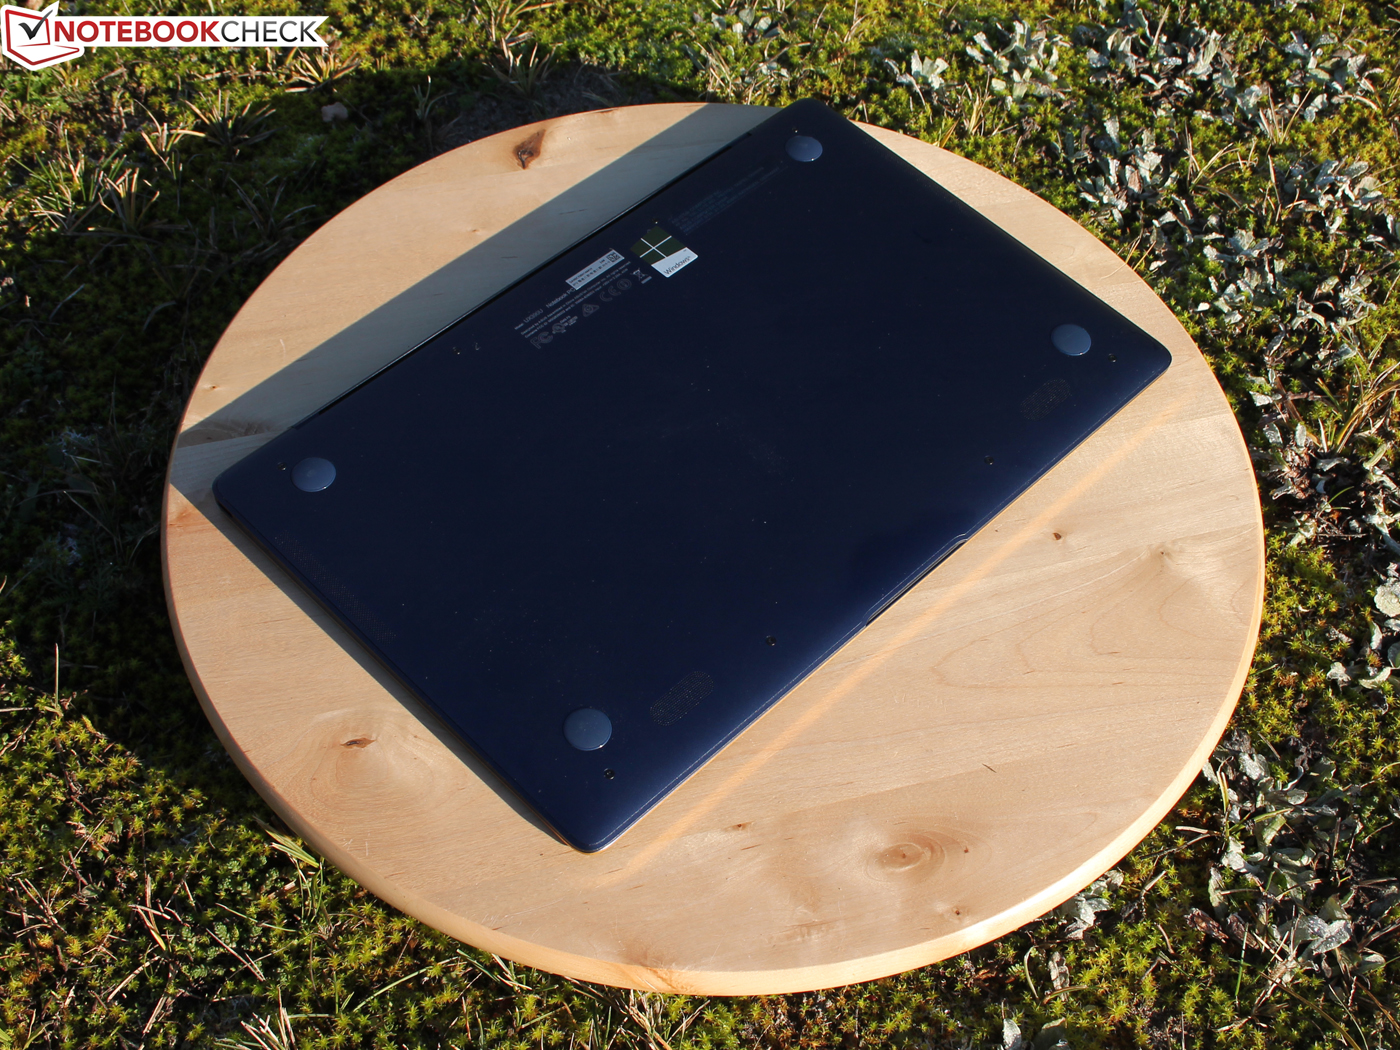
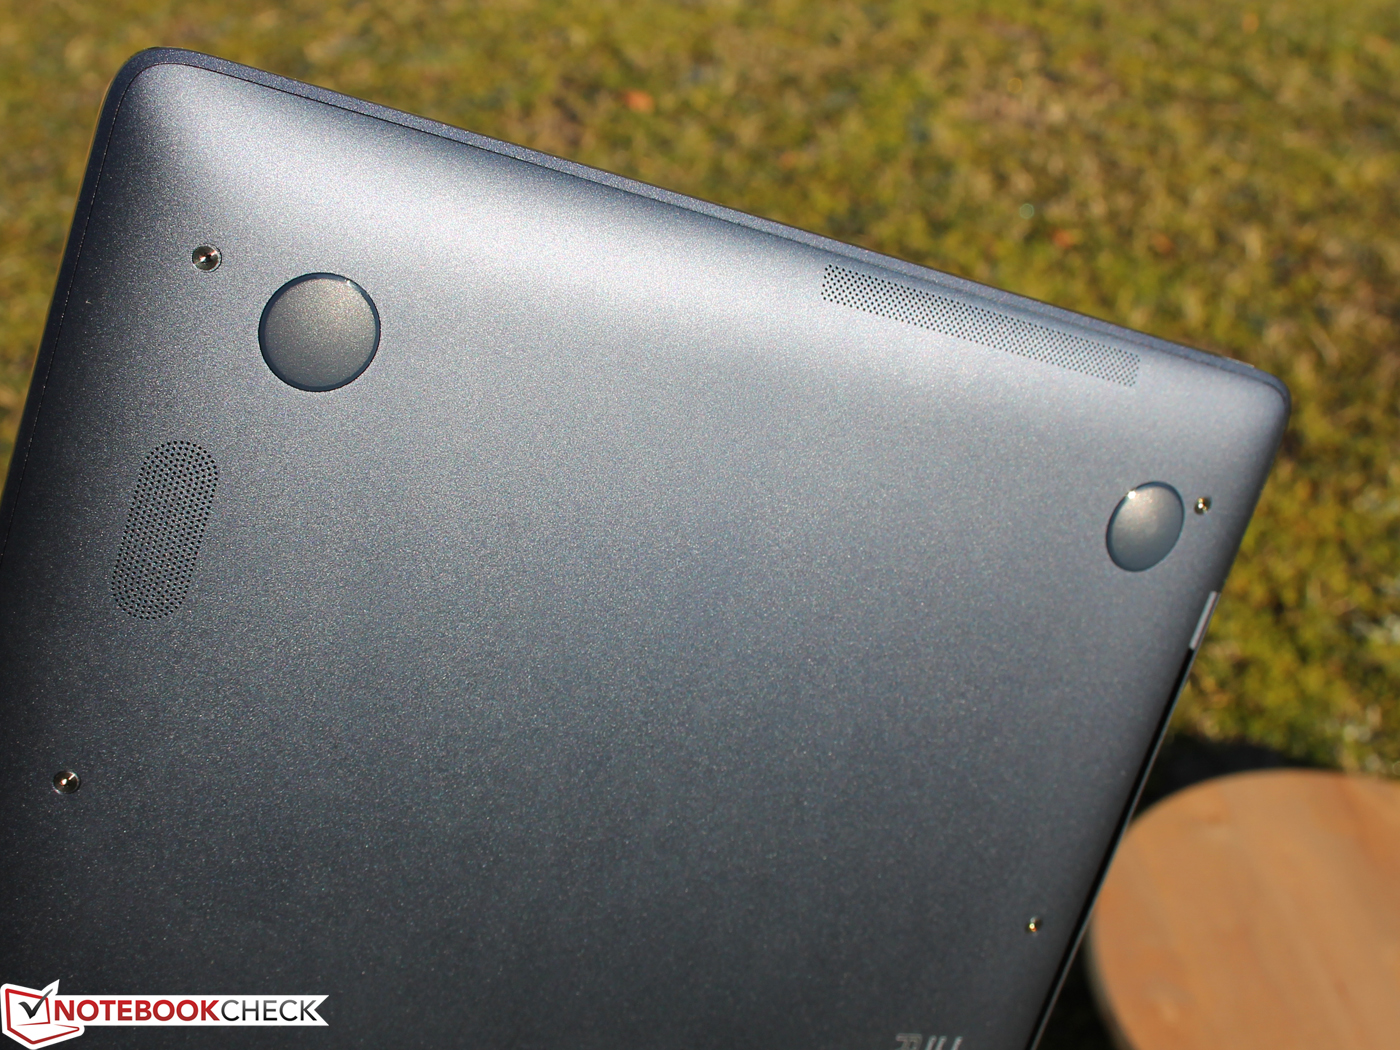
(±) The maximum temperature on the upper side is 41.6 °C / 107 F, compared to the average of 35.9 °C / 97 F, ranging from 21.4 to 59 °C for the class Subnotebook.
(+) The bottom heats up to a maximum of 39.3 °C / 103 F, compared to the average of 39.2 °C / 103 F
(+) In idle usage, the average temperature for the upper side is 24.5 °C / 76 F, compared to the device average of 30.8 °C / 87 F.
(+) The palmrests and touchpad are reaching skin temperature as a maximum (32.2 °C / 90 F) and are therefore not hot.
(-) The average temperature of the palmrest area of similar devices was 28.2 °C / 82.8 F (-4 °C / -7.2 F).
Asus Zenbook 3 UX390UA-GS041T audio analysis
(-) | not very loud speakers (71 dB)
Bass 100 - 315 Hz
(-) | nearly no bass - on average 20.9% lower than median
(±) | linearity of bass is average (12.6% delta to prev. frequency)
Mids 400 - 2000 Hz
(+) | balanced mids - only 4.1% away from median
(±) | linearity of mids is average (8.9% delta to prev. frequency)
Highs 2 - 16 kHz
(+) | balanced highs - only 2.3% away from median
(+) | highs are linear (4% delta to prev. frequency)
Overall 100 - 16.000 Hz
(±) | linearity of overall sound is average (17.3% difference to median)
Compared to same class
» 44% of all tested devices in this class were better, 9% similar, 46% worse
» The best had a delta of 5%, average was 18%, worst was 53%
Compared to all devices tested
» 33% of all tested devices were better, 8% similar, 59% worse
» The best had a delta of 4%, average was 23%, worst was 134%
Apple MacBook 12 (Early 2016) 1.1 GHz audio analysis
(+) | speakers can play relatively loud (83.6 dB)
Bass 100 - 315 Hz
(±) | reduced bass - on average 11.3% lower than median
(±) | linearity of bass is average (14.2% delta to prev. frequency)
Mids 400 - 2000 Hz
(+) | balanced mids - only 2.4% away from median
(+) | mids are linear (5.5% delta to prev. frequency)
Highs 2 - 16 kHz
(+) | balanced highs - only 2% away from median
(+) | highs are linear (4.5% delta to prev. frequency)
Overall 100 - 16.000 Hz
(+) | overall sound is linear (10.2% difference to median)
Compared to same class
» 7% of all tested devices in this class were better, 2% similar, 90% worse
» The best had a delta of 5%, average was 18%, worst was 53%
Compared to all devices tested
» 5% of all tested devices were better, 1% similar, 94% worse
» The best had a delta of 4%, average was 23%, worst was 134%
| Off / Standby | |
| Idle | |
| Load |
|
Key:
min: | |
| Asus Zenbook 3 UX390UA-GS041T i5-7200U, HD Graphics 620, SK Hynix Canvas SC300 512GB M.2 (HFS512G39MND), IPS, 1920x1080, 12.5" | Apple MacBook 12 (Early 2016) 1.1 GHz 6Y30, HD Graphics 515, Apple SSD AP0256, IPS, 2304x1440, 12" | Dell XPS 13 9360 QHD+ i7 i7-7500U, HD Graphics 620, Toshiba NVMe THNSN5256GPUK, IPS, 3200x1800, 13.3" | HP EliteBook Folio G1 V1C37EA 6Y54, HD Graphics 515, Samsung SM951 MZVPV256 m.2, IPS, 1920x1080, 12.5" | Razer Blade Stealth QHD i7-7500U i7-7500U, HD Graphics 620, Samsung PM951 NVMe MZVLV256, , 2560x1440, 12.5" | Acer Aspire S 13 S5-371-71QZ 6500U, HD Graphics 520, LiteOn CV1-8B512, IPS, 1920x1080, 13.3" | HP Spectre 13 6500U, HD Graphics 520, Samsung PM951 NVMe MZVLV256, IPS UWVA, 1920x1080, 13.3" | |
|---|---|---|---|---|---|---|---|
| Power Consumption | 29% | -18% | 2% | -28% | -9% | -62% | |
| Idle Minimum * (Watt) | 3.3 | 2.7 18% | 6.4 -94% | 4.3 -30% | 4.4 -33% | 4.1 -24% | 8.6 -161% |
| Idle Average * (Watt) | 6.2 | 2.7 56% | 6.6 -6% | 6 3% | 5.8 6% | 6.7 -8% | 11 -77% |
| Idle Maximum * (Watt) | 10.4 | 7.2 31% | 6.8 35% | 6.4 38% | 8.6 17% | 7.4 29% | 11.3 -9% |
| Load Average * (Watt) | 28 | 22 21% | 27.5 2% | 22.7 19% | 35.2 -26% | 32.4 -16% | 33.8 -21% |
| Load Maximum * (Watt) | 25.7 | 20.5 20% | 32.4 -26% | 31.2 -21% | 52 -102% | 32.4 -26% | 36.2 -41% |
* ... smaller is better
| Asus Zenbook 3 UX390UA-GS041T i5-7200U, HD Graphics 620, 40 Wh | Apple MacBook 12 (Early 2016) 1.1 GHz 6Y30, HD Graphics 515, 41.4 Wh | Dell XPS 13 9360 QHD+ i7 i7-7500U, HD Graphics 620, 60 Wh | HP EliteBook Folio G1 V1C37EA 6Y54, HD Graphics 515, 38 Wh | Razer Blade Stealth QHD i7-7500U i7-7500U, HD Graphics 620, 53.6 Wh | Acer Aspire S 13 S5-371-71QZ 6500U, HD Graphics 520, 45 Wh | HP Spectre 13 6500U, HD Graphics 520, 38 Wh | |
|---|---|---|---|---|---|---|---|
| Battery runtime | 59% | 26% | -1% | 7% | 12% | -20% | |
| Reader / Idle (h) | 14.1 | 17.6 25% | 8.8 -38% | 13.6 -4% | 17.1 21% | 11.9 -16% | |
| H.264 (h) | 6.4 | 8.5 33% | 6.9 8% | ||||
| WiFi v1.3 (h) | 6.6 | 8.4 27% | 8.6 30% | 5.9 -11% | 8.3 26% | 7.9 20% | 5.6 -15% |
| Load (h) | 1.8 | 3.9 117% | 2.2 22% | 2.5 39% | 1.8 0% | 1.7 -6% | 1.3 -28% |
Pros
Cons
Zenbook 3 UX390UA-GS041T可以轻松地在我们的亚笔记本排行中占据一席之地——不过只是在榜末。Apple MacBook 12 (2016年初),戴尔XPS 13 9360 QHD+酷睿i7机型,惠普EliteBook Folio G1 V1C37EA都得到了更好的分数,不过它们并不能满足每个用户的需要。
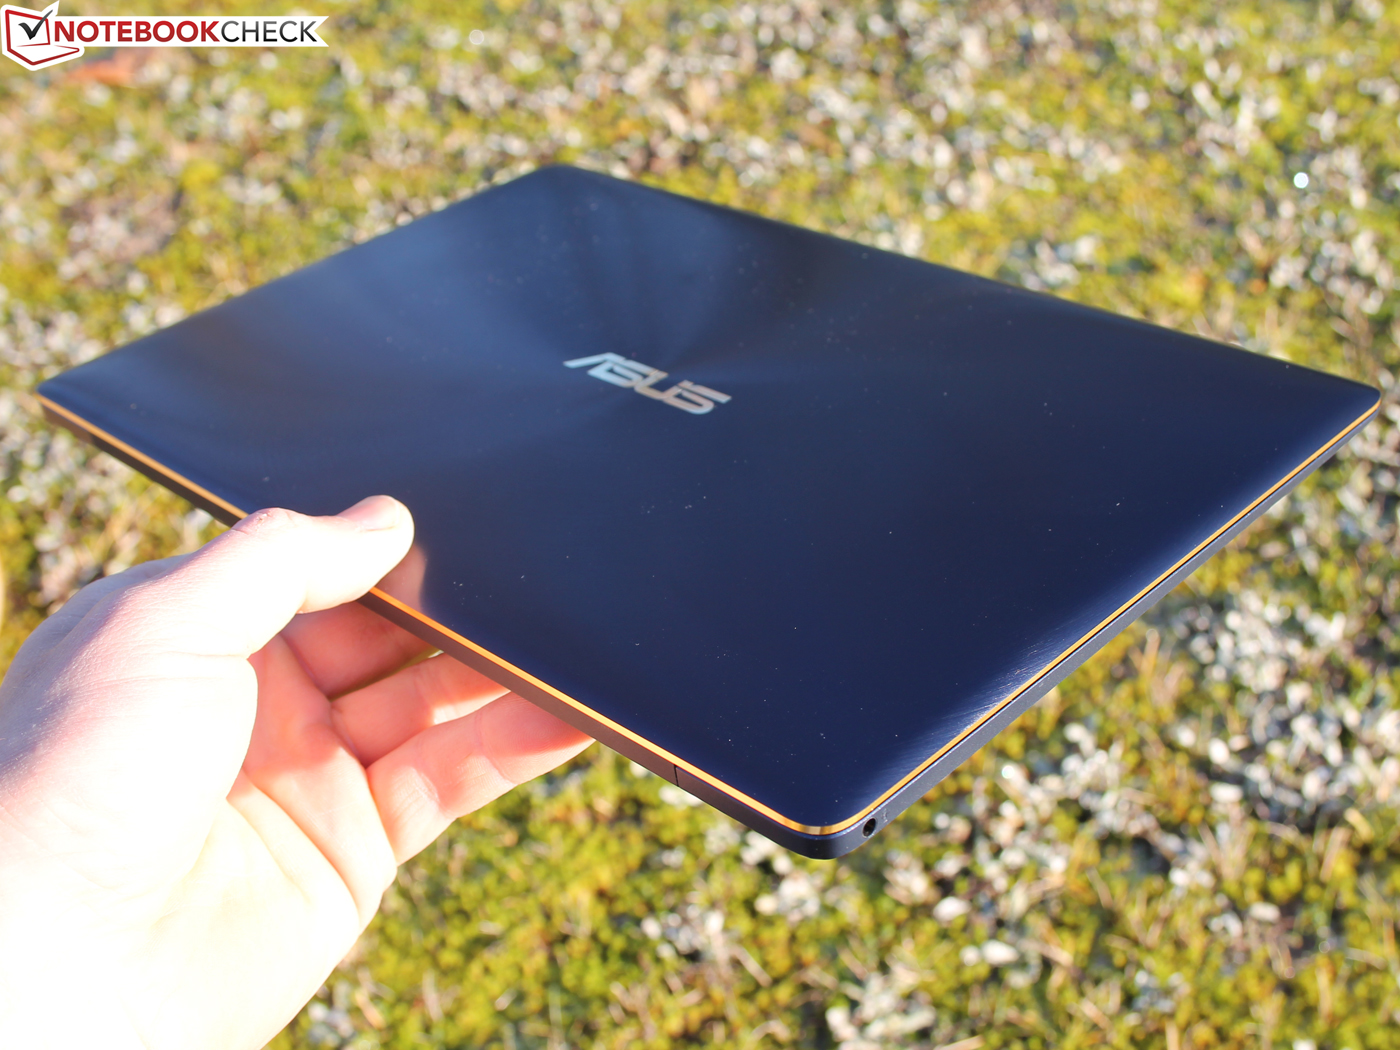
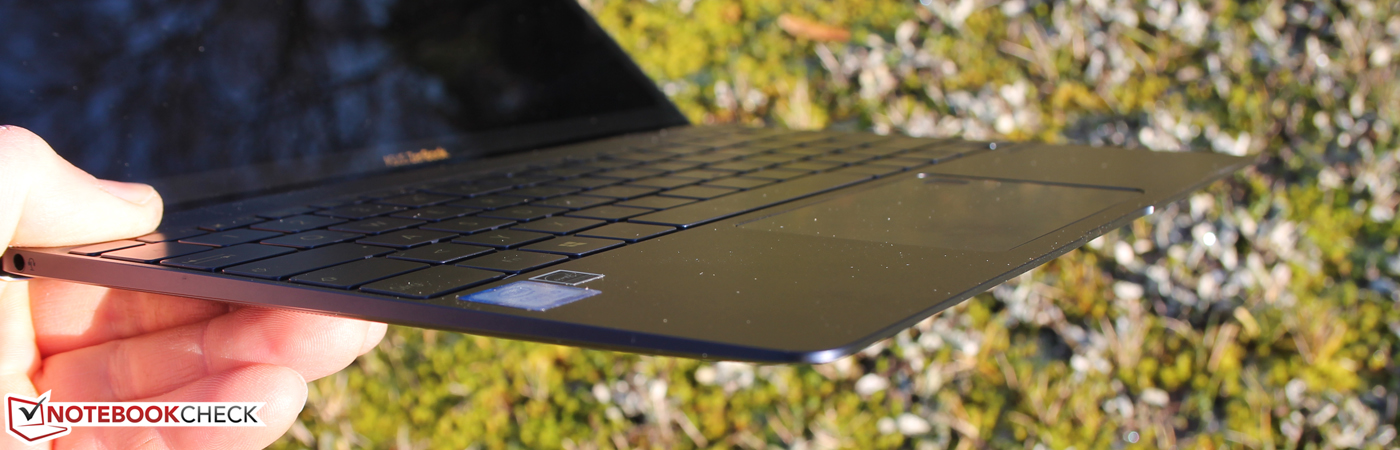
除了轻盈的机身和十分不错的坚固度,Zenbook 3的另一大优势是稳定的性能表现。搭配酷睿m处理器的MacBook 12和EliteBook Folio G1都相比落后:如果你需要不错的处理器性能,那么Zenbook 3和XPS 13 9360则是更好的选择。不过,华硕设备搭配了一个在负载下噪音更大的风扇,不过还不算特别吵。
这几台对比设备在屏幕品质上都十分接近——如果不看屏幕分辨率的区别的话。在这方面MacBook 12 (2304 x 1440)和XPS 13 (3200 x 1800)表现更好。
我们的测试机在续航上没能更胜一筹,它仅914克的重量(40瓦时电池)没能包括像XPS 13一样的大容量电池(60瓦时)。Zenbook在测试中坚持了6小时30分,XPS达到了8小时40分。不过后者重量接近1.3千克。MacBook 12也提供了相似的续航时间。
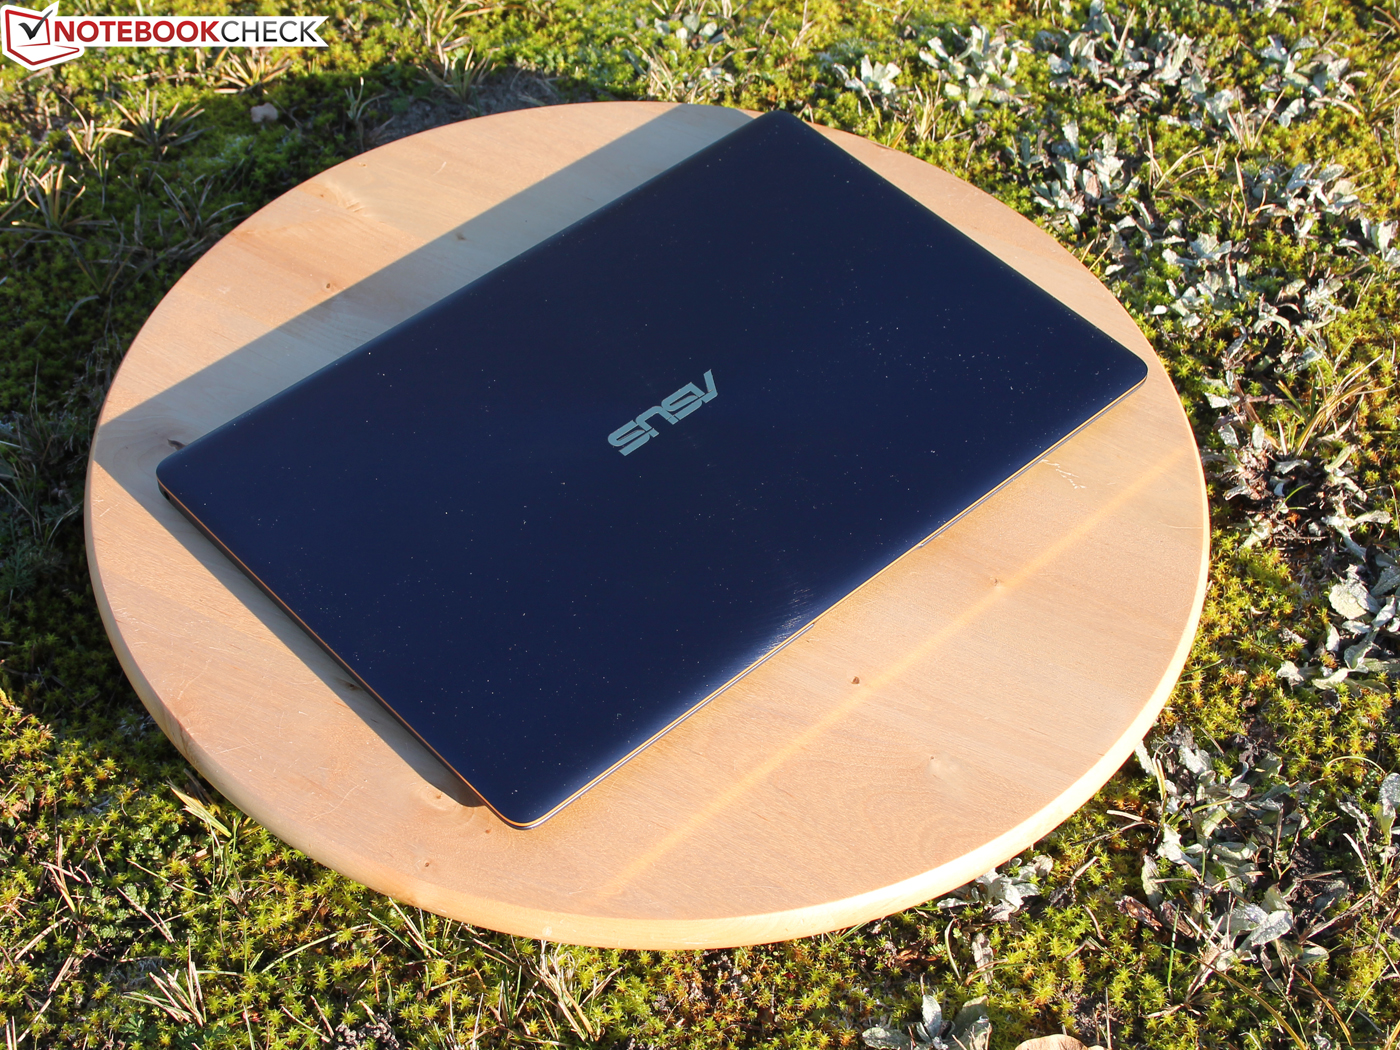
我们的蓝色Zenbook 3零售价1500欧元(约10908人民币),这绝不算便宜,不过搭配512GB固态硬盘的MacBook 12售价达1600欧元(约11636人民币),而同硬盘容量的XPS 13 9360更是高达1850欧元(约13454人民币)。不过,XPS 13也包括了全尺寸接口和Thunderbolt 3支持,但厚度15毫米的这台设备并不算超便携12.5寸系统。
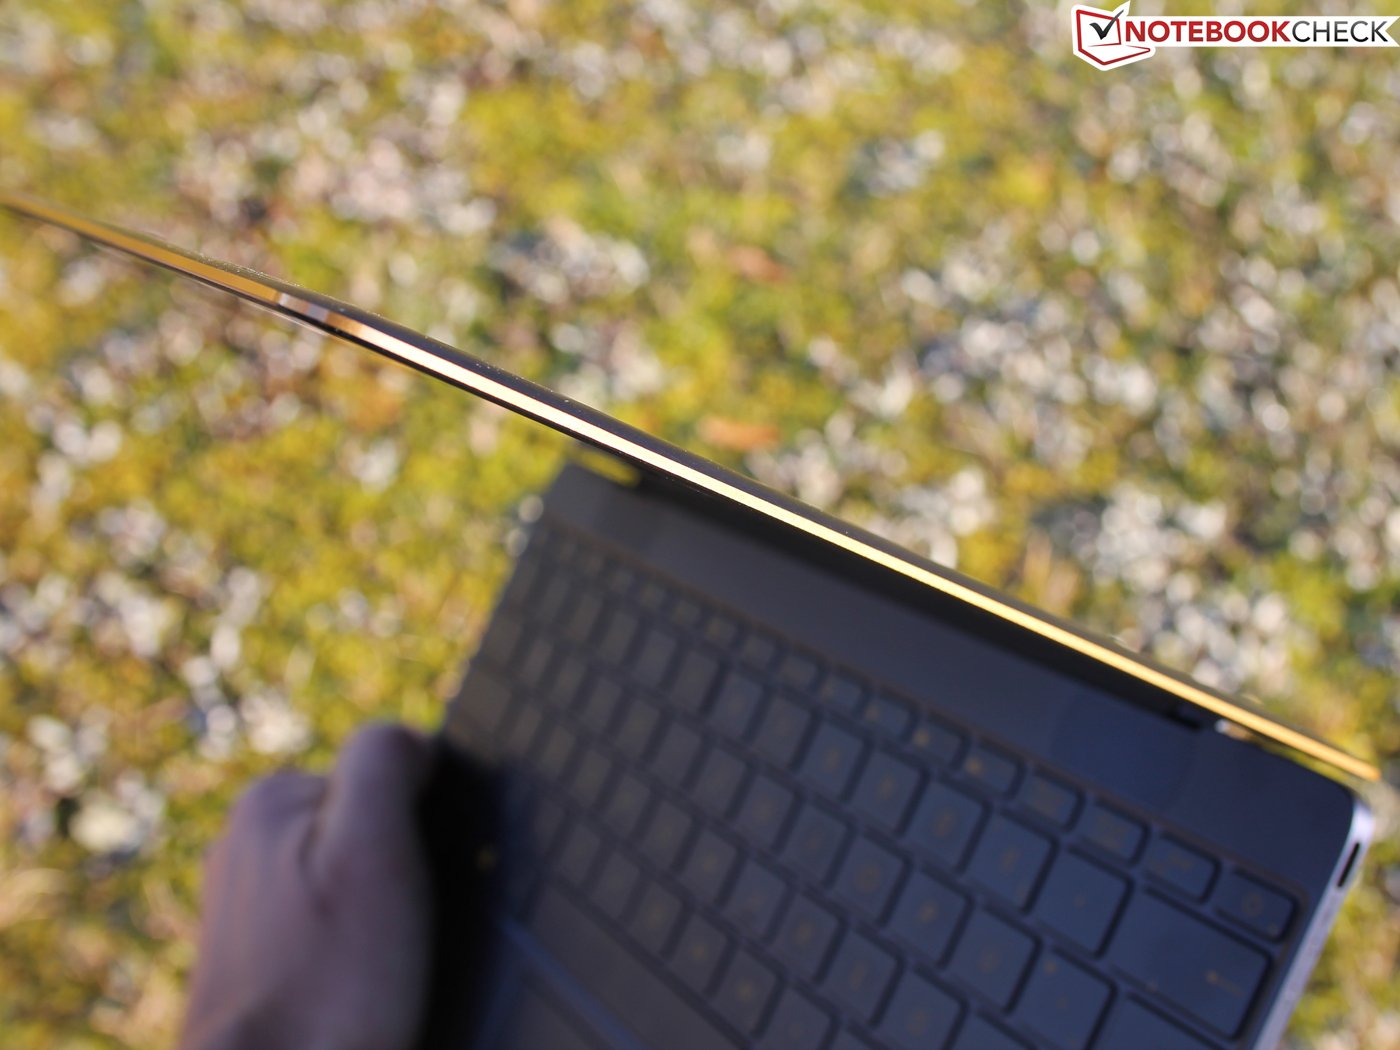
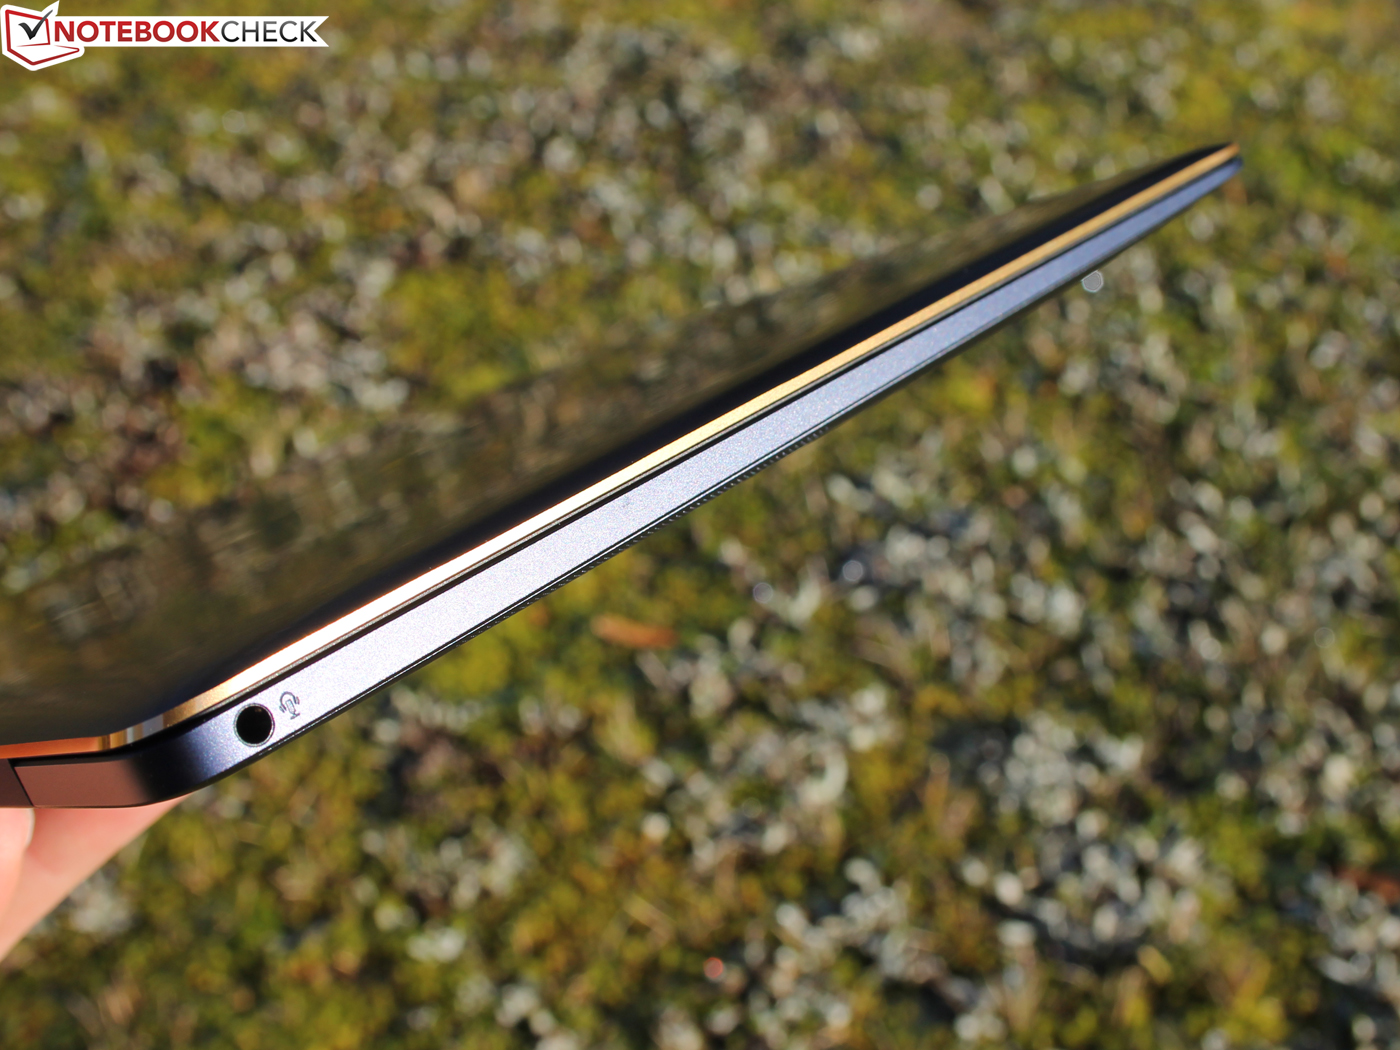
最薄机身之争的获胜者是10.4毫米的惠普 Spectre 13,不过它的酷睿i处理器受到降频问题(甚至是低负载时)的影响,无法发挥全部加速潜能。
整体上,我们认为Zenbook 3对需要高性能小尺寸设备的用户来说是最好的选择。它在测试中的全面性能表现结合很薄的机身可以说史无前例。
如果把电池续航,人体工程学设计(无风扇)和应用程序结合作为“性能”来考虑的话,那么惠普EliteBook Folio G1或Apple MacBook 12 (2016年初)也都是不错的选择。
注:本文是基于完整评测的缩减版本,阅读完整的英文评测,请点击这里。
Asus Zenbook 3 UX390UA-GS041T
- 12/02/2016 v5.1 (old)
Sebastian Jentsch
Price comparison
