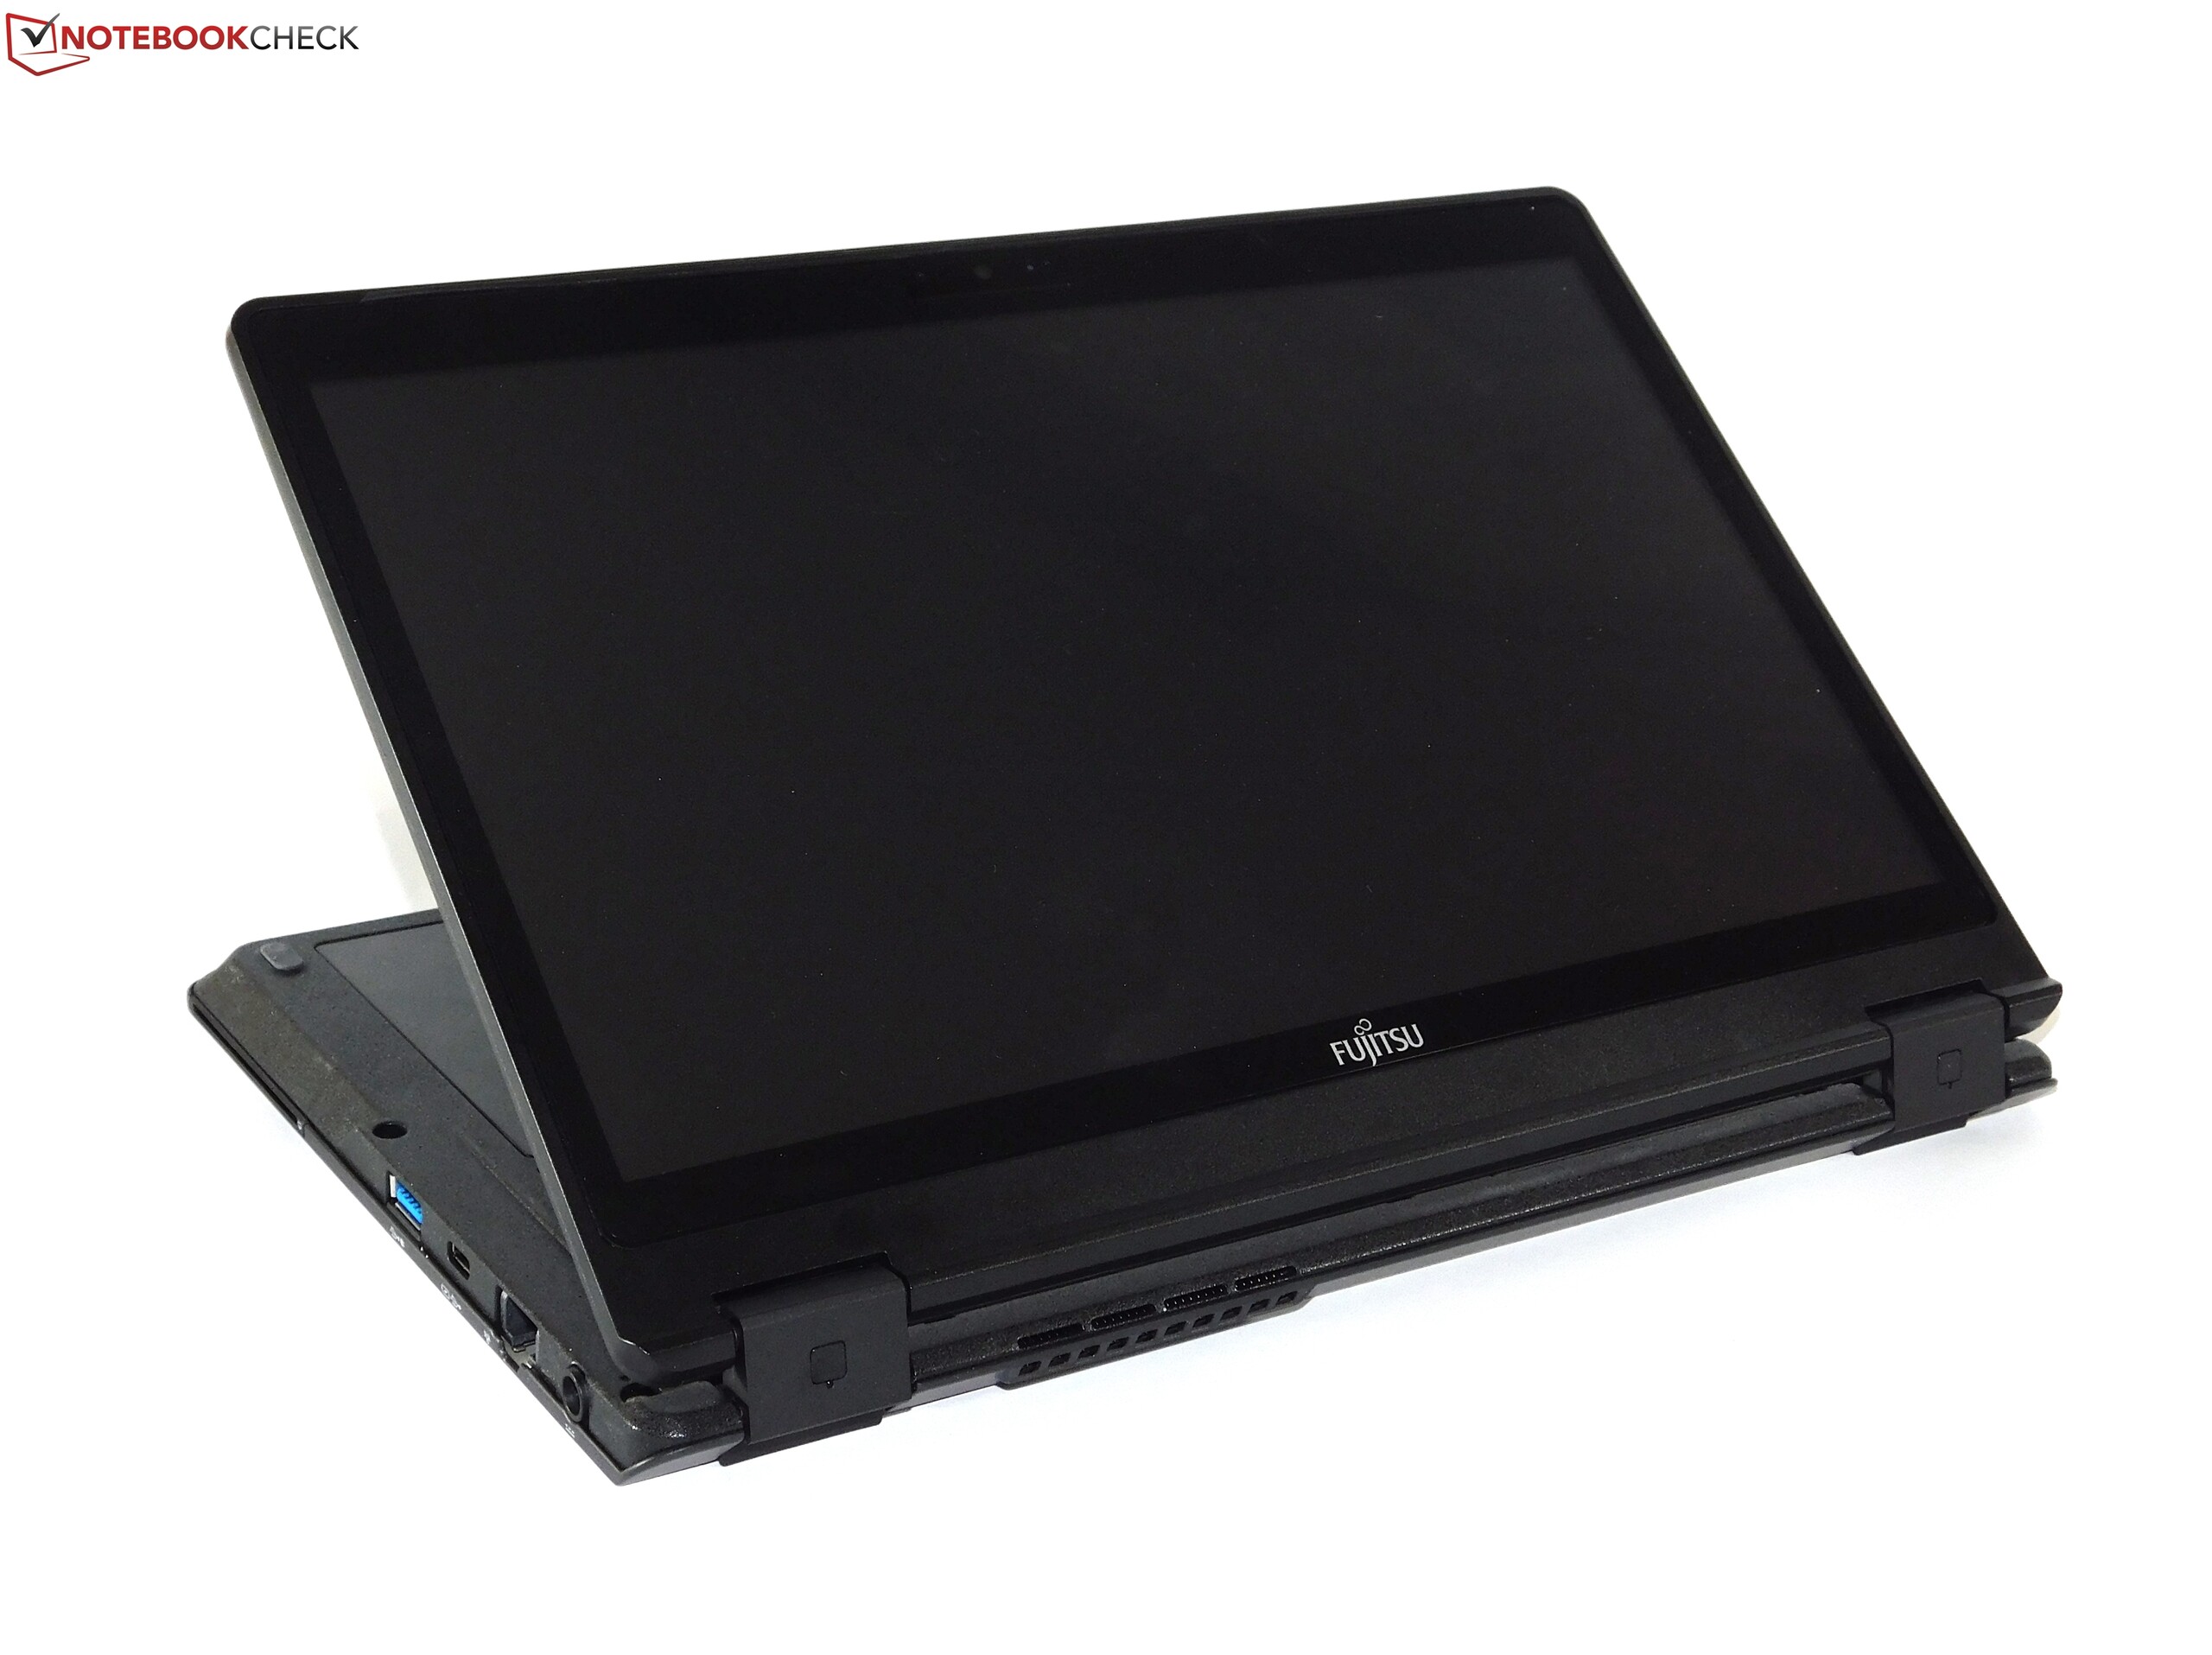
富士通 Lifebook P727 (i7, 16 GB, LTE) 变形本简短评测
| SD Card Reader | |
| average JPG Copy Test (av. of 3 runs) | |
| Fujitsu Lifebook T937 | |
| Fujitsu Lifebook P727 | |
| Dell XPS 15 2017 9560 (7300HQ, Full-HD) | |
| maximum AS SSD Seq Read Test (1GB) | |
| Dell XPS 15 2017 9560 (7300HQ, Full-HD) | |
| Fujitsu Lifebook T937 | |
| Fujitsu Lifebook P727 | |
| Networking | |
| iperf3 transmit AX12 | |
| Lenovo ThinkPad Yoga 370-20JJS00100 | |
| Fujitsu Lifebook P727 | |
| Dell Latitude 5289 | |
| HP EliteBook x360 1030 G2 | |
| iperf3 receive AX12 | |
| Lenovo ThinkPad Yoga 370-20JJS00100 | |
| Fujitsu Lifebook P727 | |
| HP EliteBook x360 1030 G2 | |
| Dell Latitude 5289 | |
| |||||||||||||||||||||||||
Brightness Distribution: 79 %
Center on Battery: 303 cd/m²
Contrast: 659:1 (Black: 0.46 cd/m²)
ΔE ColorChecker Calman: 3.94 | ∀{0.5-29.43 Ø4.71}
ΔE Greyscale Calman: 5.14 | ∀{0.09-98 Ø4.96}
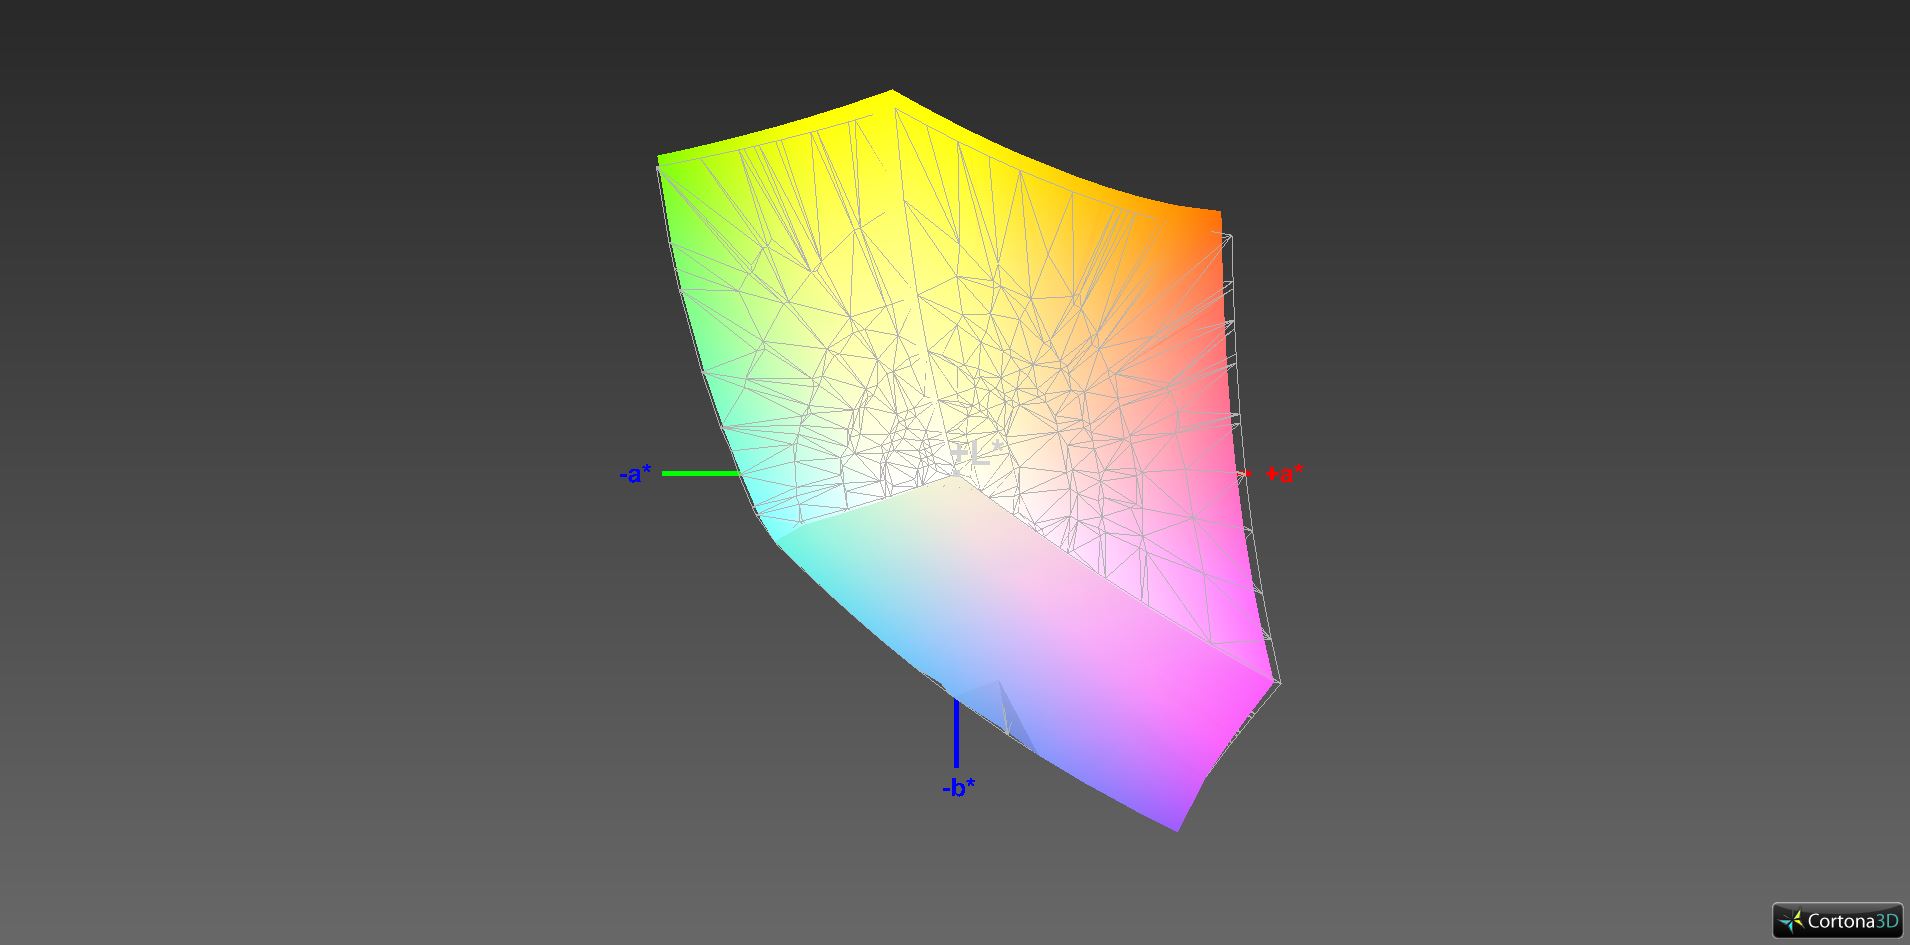
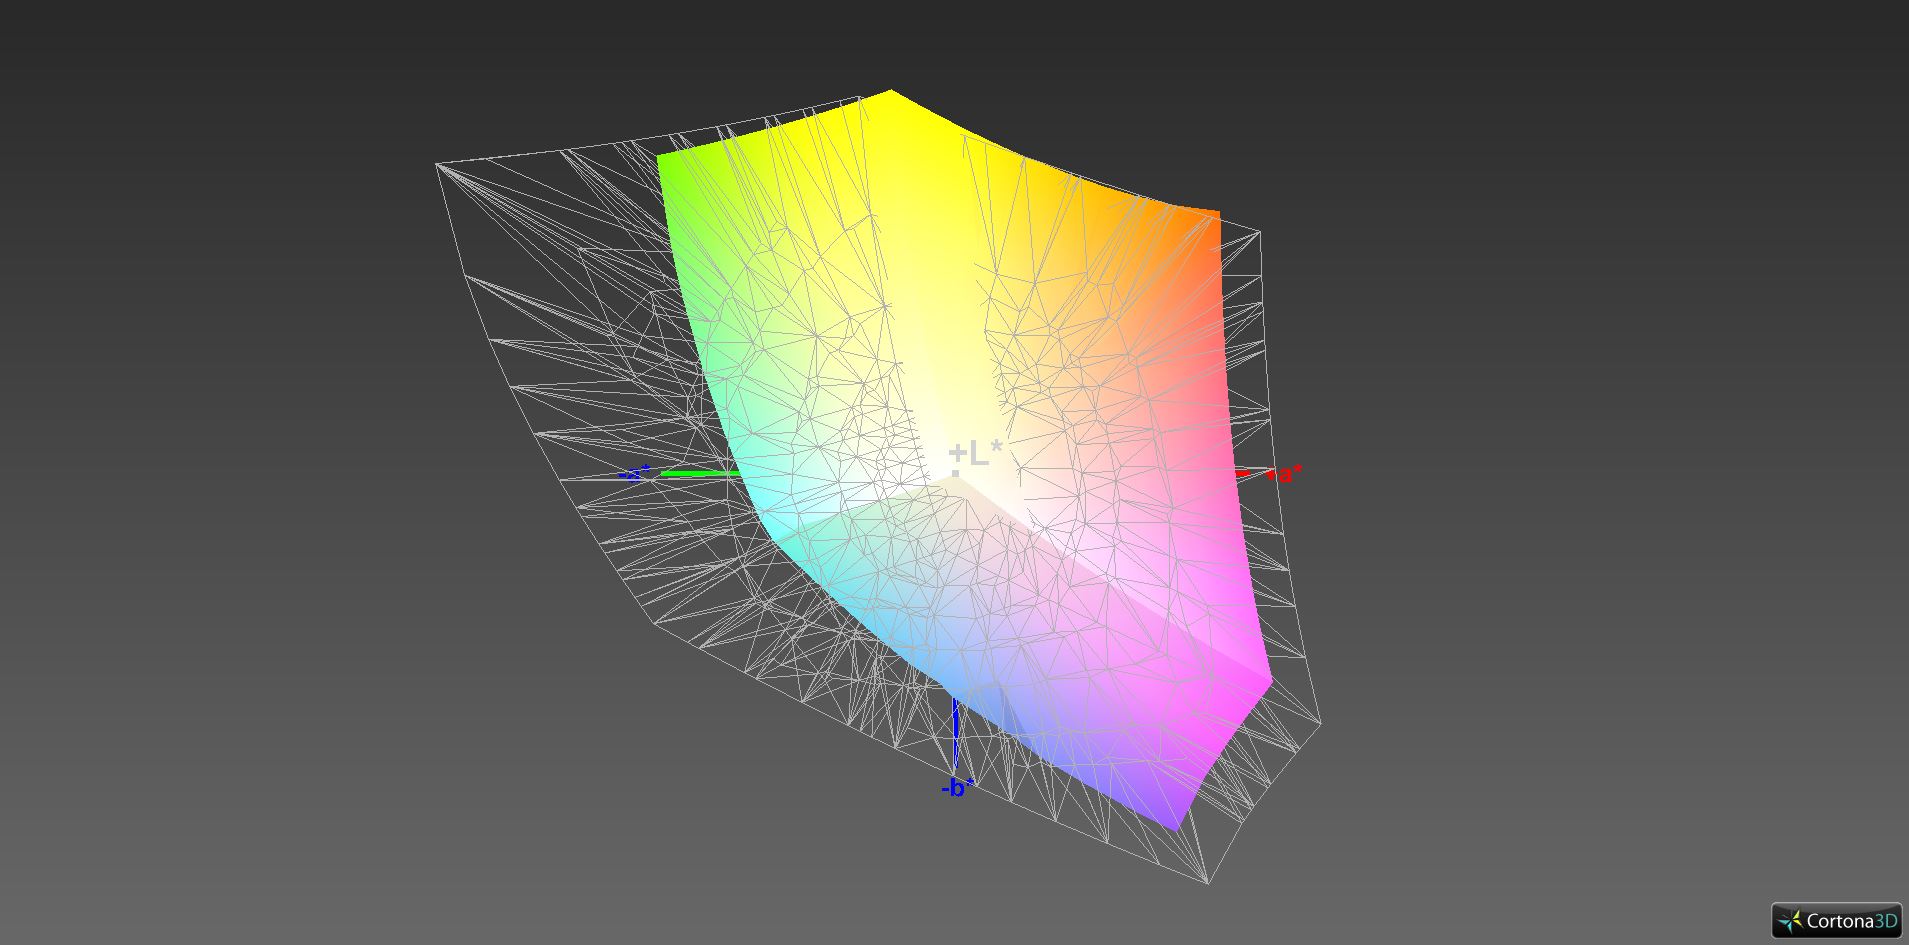
98% sRGB (Argyll 1.6.3 3D)
63% AdobeRGB 1998 (Argyll 1.6.3 3D)
69.1% AdobeRGB 1998 (Argyll 3D)
97.5% sRGB (Argyll 3D)
67.2% Display P3 (Argyll 3D)
Gamma: 2.31
CCT: 6521 K
| Fujitsu Lifebook P727 LP125WF4-SPH1, , 1920x1080, 12.5" | Lenovo ThinkPad Yoga 370-20JJS00100 Sharp LQ133M1JX15, , 1920x1080, 13.3" | HP EliteBook x360 1030 G2 CMN1374, , 1920x1080, 13.3" | Dell Latitude 5289 BOE NV12N51, , 1920x1080, 12.5" | Toshiba Portege X20W-D-10R Toshiba TOS508F, , 1920x1080, 12.5" | Fujitsu Lifebook T937 Sharp SHP141B , , 1920x1080, 13.3" | |
|---|---|---|---|---|---|---|
| Display | 1% | -6% | -35% | 1% | -38% | |
| Display P3 Coverage (%) | 67.2 | 67.9 1% | 65.5 -3% | 42.79 -36% | 68.7 2% | 41.08 -39% |
| sRGB Coverage (%) | 97.5 | 97.3 0% | 88.8 -9% | 64.3 -34% | 96.8 -1% | 61.6 -37% |
| AdobeRGB 1998 Coverage (%) | 69.1 | 69.9 1% | 64.9 -6% | 44.21 -36% | 70.4 2% | 42.48 -39% |
| Response Times | -11% | -15% | -7% | -51% | -14% | |
| Response Time Grey 50% / Grey 80% * (ms) | 44 ? | 42 ? 5% | 55.2 ? -25% | 42 ? 5% | 67 ? -52% | 46 ? -5% |
| Response Time Black / White * (ms) | 26 ? | 32.8 ? -26% | 27.2 ? -5% | 31 ? -19% | 39 ? -50% | 32 ? -23% |
| PWM Frequency (Hz) | 217.4 ? | 531 ? | 212 ? | |||
| Screen | 7% | -2% | 11% | 20% | 8% | |
| Brightness middle (cd/m²) | 303 | 374 23% | 262 -14% | 336 11% | 442 46% | 236 -22% |
| Brightness (cd/m²) | 272 | 356 31% | 256 -6% | 320 18% | 410 51% | 219 -19% |
| Brightness Distribution (%) | 79 | 87 10% | 83 5% | 90 14% | 86 9% | 87 10% |
| Black Level * (cd/m²) | 0.46 | 0.33 28% | 0.25 46% | 0.34 26% | 0.22 52% | 0.18 61% |
| Contrast (:1) | 659 | 1133 72% | 1048 59% | 988 50% | 2009 205% | 1311 99% |
| Colorchecker dE 2000 * | 3.94 | 4.7 -19% | 5.13 -30% | 3.45 12% | 5.22 -32% | 4.25 -8% |
| Colorchecker dE 2000 max. * | 6.57 | 9.5 -45% | 9.46 -44% | 7.95 -21% | 11.84 -80% | 7.4 -13% |
| Greyscale dE 2000 * | 5.14 | 6.5 -26% | 6.23 -21% | 1.68 67% | 7.88 -53% | 2.5 51% |
| Gamma | 2.31 95% | 2.19 100% | 2.45 90% | 2.49 88% | 2.51 88% | 2.48 89% |
| CCT | 6521 100% | 7086 92% | 6413 101% | 6782 96% | 6756 96% | 7082 92% |
| Color Space (Percent of AdobeRGB 1998) (%) | 63 | 63.1 0% | 57.84 -8% | 41 -35% | 64 2% | 39 -38% |
| Color Space (Percent of sRGB) (%) | 98 | 97.2 -1% | 88.57 -10% | 64 -35% | 97 -1% | 62 -37% |
| Total Average (Program / Settings) | -1% /
4% | -8% /
-5% | -10% /
-1% | -10% /
7% | -15% /
-4% |
* ... smaller is better
Display Response Times
| ↔ Response Time Black to White | ||
|---|---|---|
| 26 ms ... rise ↗ and fall ↘ combined | ↗ 14 ms rise | 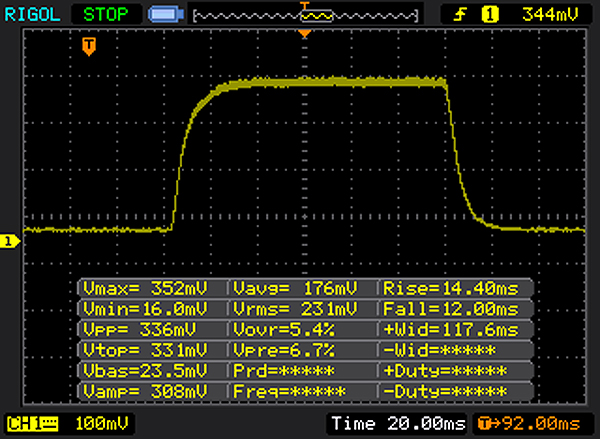 |
| ↘ 12 ms fall | ||
| The screen shows relatively slow response rates in our tests and may be too slow for gamers. In comparison, all tested devices range from 0.1 (minimum) to 240 (maximum) ms. » 63 % of all devices are better. This means that the measured response time is worse than the average of all tested devices (19.8 ms). | ||
| ↔ Response Time 50% Grey to 80% Grey | ||
| 44 ms ... rise ↗ and fall ↘ combined | ↗ 26 ms rise |  |
| ↘ 18 ms fall | ||
| The screen shows slow response rates in our tests and will be unsatisfactory for gamers. In comparison, all tested devices range from 0.165 (minimum) to 636 (maximum) ms. » 73 % of all devices are better. This means that the measured response time is worse than the average of all tested devices (30.9 ms). | ||
Screen Flickering / PWM (Pulse-Width Modulation)
| Screen flickering / PWM not detected | ||
In comparison: 52 % of all tested devices do not use PWM to dim the display. If PWM was detected, an average of 7748 (minimum: 5 - maximum: 343500) Hz was measured. | ||
| PCMark 8 Home Score Accelerated v2 | 3714 points | |
| PCMark 8 Work Score Accelerated v2 | 4932 points | |
Help | ||
| Fujitsu Lifebook P727 Samsung CM871A MZNTN512HDJH | Lenovo ThinkPad Yoga 370-20JJS00100 Toshiba NVMe THNSF5512GPUK | HP EliteBook x360 1030 G2 Sandisk SD8TN8U-256G-1006 | Dell Latitude 5289 SanDisk X400 256GB, SATA (SD8SB8U-256G) | Toshiba Portege X20W-D-10R Toshiba SG5 THNSNK512GVN8 | Fujitsu Lifebook T937 | |
|---|---|---|---|---|---|---|
| CrystalDiskMark 3.0 | 42% | -15% | -32% | -17% | -1% | |
| Read Seq (MB/s) | 513 | 1070 109% | 467.1 -9% | 423.7 -17% | 469 -9% | 549 7% |
| Write Seq (MB/s) | 467.7 | 484.5 4% | 443.6 -5% | 406.4 -13% | 277.3 -41% | 526 12% |
| Read 512 (MB/s) | 379.8 | 680 79% | 312.3 -18% | 260.8 -31% | 404.4 6% | |
| Write 512 (MB/s) | 399.1 | 483.1 21% | 372.5 -7% | 255.6 -36% | 266.6 -33% | |
| Read 4k (MB/s) | 38.74 | 30.55 -21% | 29.43 -24% | 22.73 -41% | 25.24 -35% | 34.71 -10% |
| Write 4k (MB/s) | 89.8 | 127.3 42% | 56.5 -37% | 27.92 -69% | 89.4 0% | 89.6 0% |
| Read 4k QD32 (MB/s) | 337.1 | 460.8 37% | 311.3 -8% | 306.2 -9% | 322.5 -4% | 279.3 -17% |
| Write 4k QD32 (MB/s) | 254.2 | 414.5 63% | 225.2 -11% | 158.8 -38% | 208.1 -18% | 255.8 1% |

| 3DMark 11 - 1280x720 Performance GPU | |
| Dell Latitude 5289 | |
| Toshiba Portege X20W-D-10R | |
| HP EliteBook x360 1030 G2 | |
| Fujitsu Lifebook P727 | |
| Lenovo ThinkPad Yoga 370-20JJS00100 | |
| 3DMark | |
| 1280x720 Cloud Gate Standard Graphics | |
| Dell Latitude 5289 | |
| HP EliteBook x360 1030 G2 | |
| Toshiba Portege X20W-D-10R | |
| Fujitsu Lifebook P727 | |
| Lenovo ThinkPad Yoga 370-20JJS00100 | |
| 1920x1080 Fire Strike Graphics | |
| Dell Latitude 5289 | |
| HP EliteBook x360 1030 G2 | |
| Fujitsu Lifebook P727 | |
| Lenovo ThinkPad Yoga 370-20JJS00100 | |
| 3DMark 11 Performance | 1597 points | |
| 3DMark Cloud Gate Standard Score | 5792 points | |
| 3DMark Fire Strike Score | 796 points | |
Help | ||
| low | med. | high | ultra | |
|---|---|---|---|---|
| BioShock Infinite (2013) | 44.27 | 25.35 | 21.31 | |
| Company of Heroes 2 (2013) | 20.76 | |||
| Rise of the Tomb Raider (2016) | 10.84 |
Noise level
| Idle |
| 30 / 30 / 30 dB(A) |
| HDD |
| 30 dB(A) |
| Load |
| 30.8 / 30.8 dB(A) |
 | ||
30 dB silent 40 dB(A) audible 50 dB(A) loud |
||
min: | ||
(±) The maximum temperature on the upper side is 42.2 °C / 108 F, compared to the average of 35.4 °C / 96 F, ranging from 19.6 to 60 °C for the class Convertible.
(±) The bottom heats up to a maximum of 43.1 °C / 110 F, compared to the average of 36.9 °C / 98 F
(+) In idle usage, the average temperature for the upper side is 21.6 °C / 71 F, compared to the device average of 30.3 °C / 87 F.
(+) The palmrests and touchpad are cooler than skin temperature with a maximum of 27.5 °C / 81.5 F and are therefore cool to the touch.
(±) The average temperature of the palmrest area of similar devices was 28 °C / 82.4 F (+0.5 °C / 0.9 F).
Fujitsu Lifebook P727 audio analysis
(-) | not very loud speakers (65 dB)
Bass 100 - 315 Hz
(-) | nearly no bass - on average 20.9% lower than median
(+) | bass is linear (3.3% delta to prev. frequency)
Mids 400 - 2000 Hz
(±) | reduced mids - on average 7% lower than median
(±) | linearity of mids is average (8.1% delta to prev. frequency)
Highs 2 - 16 kHz
(+) | balanced highs - only 4.3% away from median
(+) | highs are linear (6.3% delta to prev. frequency)
Overall 100 - 16.000 Hz
(±) | linearity of overall sound is average (26.5% difference to median)
Compared to same class
» 82% of all tested devices in this class were better, 3% similar, 15% worse
» The best had a delta of 6%, average was 20%, worst was 57%
Compared to all devices tested
» 81% of all tested devices were better, 4% similar, 15% worse
» The best had a delta of 4%, average was 23%, worst was 134%
Apple MacBook 12 (Early 2016) 1.1 GHz audio analysis
(+) | speakers can play relatively loud (83.6 dB)
Bass 100 - 315 Hz
(±) | reduced bass - on average 11.3% lower than median
(±) | linearity of bass is average (14.2% delta to prev. frequency)
Mids 400 - 2000 Hz
(+) | balanced mids - only 2.4% away from median
(+) | mids are linear (5.5% delta to prev. frequency)
Highs 2 - 16 kHz
(+) | balanced highs - only 2% away from median
(+) | highs are linear (4.5% delta to prev. frequency)
Overall 100 - 16.000 Hz
(+) | overall sound is linear (10.2% difference to median)
Compared to same class
» 7% of all tested devices in this class were better, 2% similar, 90% worse
» The best had a delta of 5%, average was 18%, worst was 53%
Compared to all devices tested
» 5% of all tested devices were better, 1% similar, 94% worse
» The best had a delta of 4%, average was 23%, worst was 134%
| Off / Standby | |
| Idle | |
| Load |
|
Key:
min: | |
| Fujitsu Lifebook P727 i7-7600U, HD Graphics 620, Samsung CM871A MZNTN512HDJH, IPS LED, 1920x1080, 12.5" | Lenovo ThinkPad Yoga 370-20JJS00100 i5-7200U, HD Graphics 620, Toshiba NVMe THNSF5512GPUK, IPS LED, 1920x1080, 13.3" | HP EliteBook x360 1030 G2 i5-7300U, HD Graphics 620, Sandisk SD8TN8U-256G-1006, IPS, 1920x1080, 13.3" | Dell Latitude 5289 i5-7300U, HD Graphics 620, SanDisk X400 256GB, SATA (SD8SB8U-256G), IPS LED, 1920x1080, 12.5" | Toshiba Portege X20W-D-10R i7-7600U, HD Graphics 620, Toshiba SG5 THNSNK512GVN8, IPS, 1920x1080, 12.5" | Fujitsu Lifebook T937 i7-7600U, HD Graphics 620, , IPS, 1920x1080, 13.3" | |
|---|---|---|---|---|---|---|
| Power Consumption | -11% | -4% | 3% | 14% | -3% | |
| Idle Minimum * (Watt) | 3.9 | 3.6 8% | 3.2 18% | 2.7 31% | 3.4 13% | 3 23% |
| Idle Average * (Watt) | 6.6 | 7.2 -9% | 5.5 17% | 5.1 23% | 5.8 12% | 6.8 -3% |
| Idle Maximum * (Watt) | 6.9 | 8.4 -22% | 6.5 6% | 7.6 -10% | 6.7 3% | 7.7 -12% |
| Load Average * (Watt) | 27 | 29.9 -11% | 29.7 -10% | 33 -22% | 21.4 21% | 30 -11% |
| Load Maximum * (Watt) | 27.1 | 32.2 -19% | 41.3 -52% | 29 -7% | 21.6 20% | 30.3 -12% |
* ... smaller is better
| Fujitsu Lifebook P727 i7-7600U, HD Graphics 620, 45 Wh | Lenovo ThinkPad Yoga 370-20JJS00100 i5-7200U, HD Graphics 620, 51 Wh | HP EliteBook x360 1030 G2 i5-7300U, HD Graphics 620, 57 Wh | Dell Latitude 5289 i5-7300U, HD Graphics 620, 60 Wh | Toshiba Portege X20W-D-10R i7-7600U, HD Graphics 620, 44 Wh | Fujitsu Lifebook T937 i7-7600U, HD Graphics 620, 50 Wh | |
|---|---|---|---|---|---|---|
| Battery runtime | 13% | 59% | 56% | 34% | 23% | |
| Reader / Idle (h) | 15.7 | 19.4 24% | 23.1 47% | 28.8 83% | 16.7 6% | 17 8% |
| WiFi v1.3 (h) | 5.9 | 8.1 37% | 10.5 78% | 11.8 100% | 12 103% | 8.7 47% |
| Load (h) | 2.7 | 2.1 -22% | 4.1 52% | 2.3 -15% | 2.5 -7% | 3.1 15% |
| H.264 (h) | 9.6 | 11 |
Pros
Cons
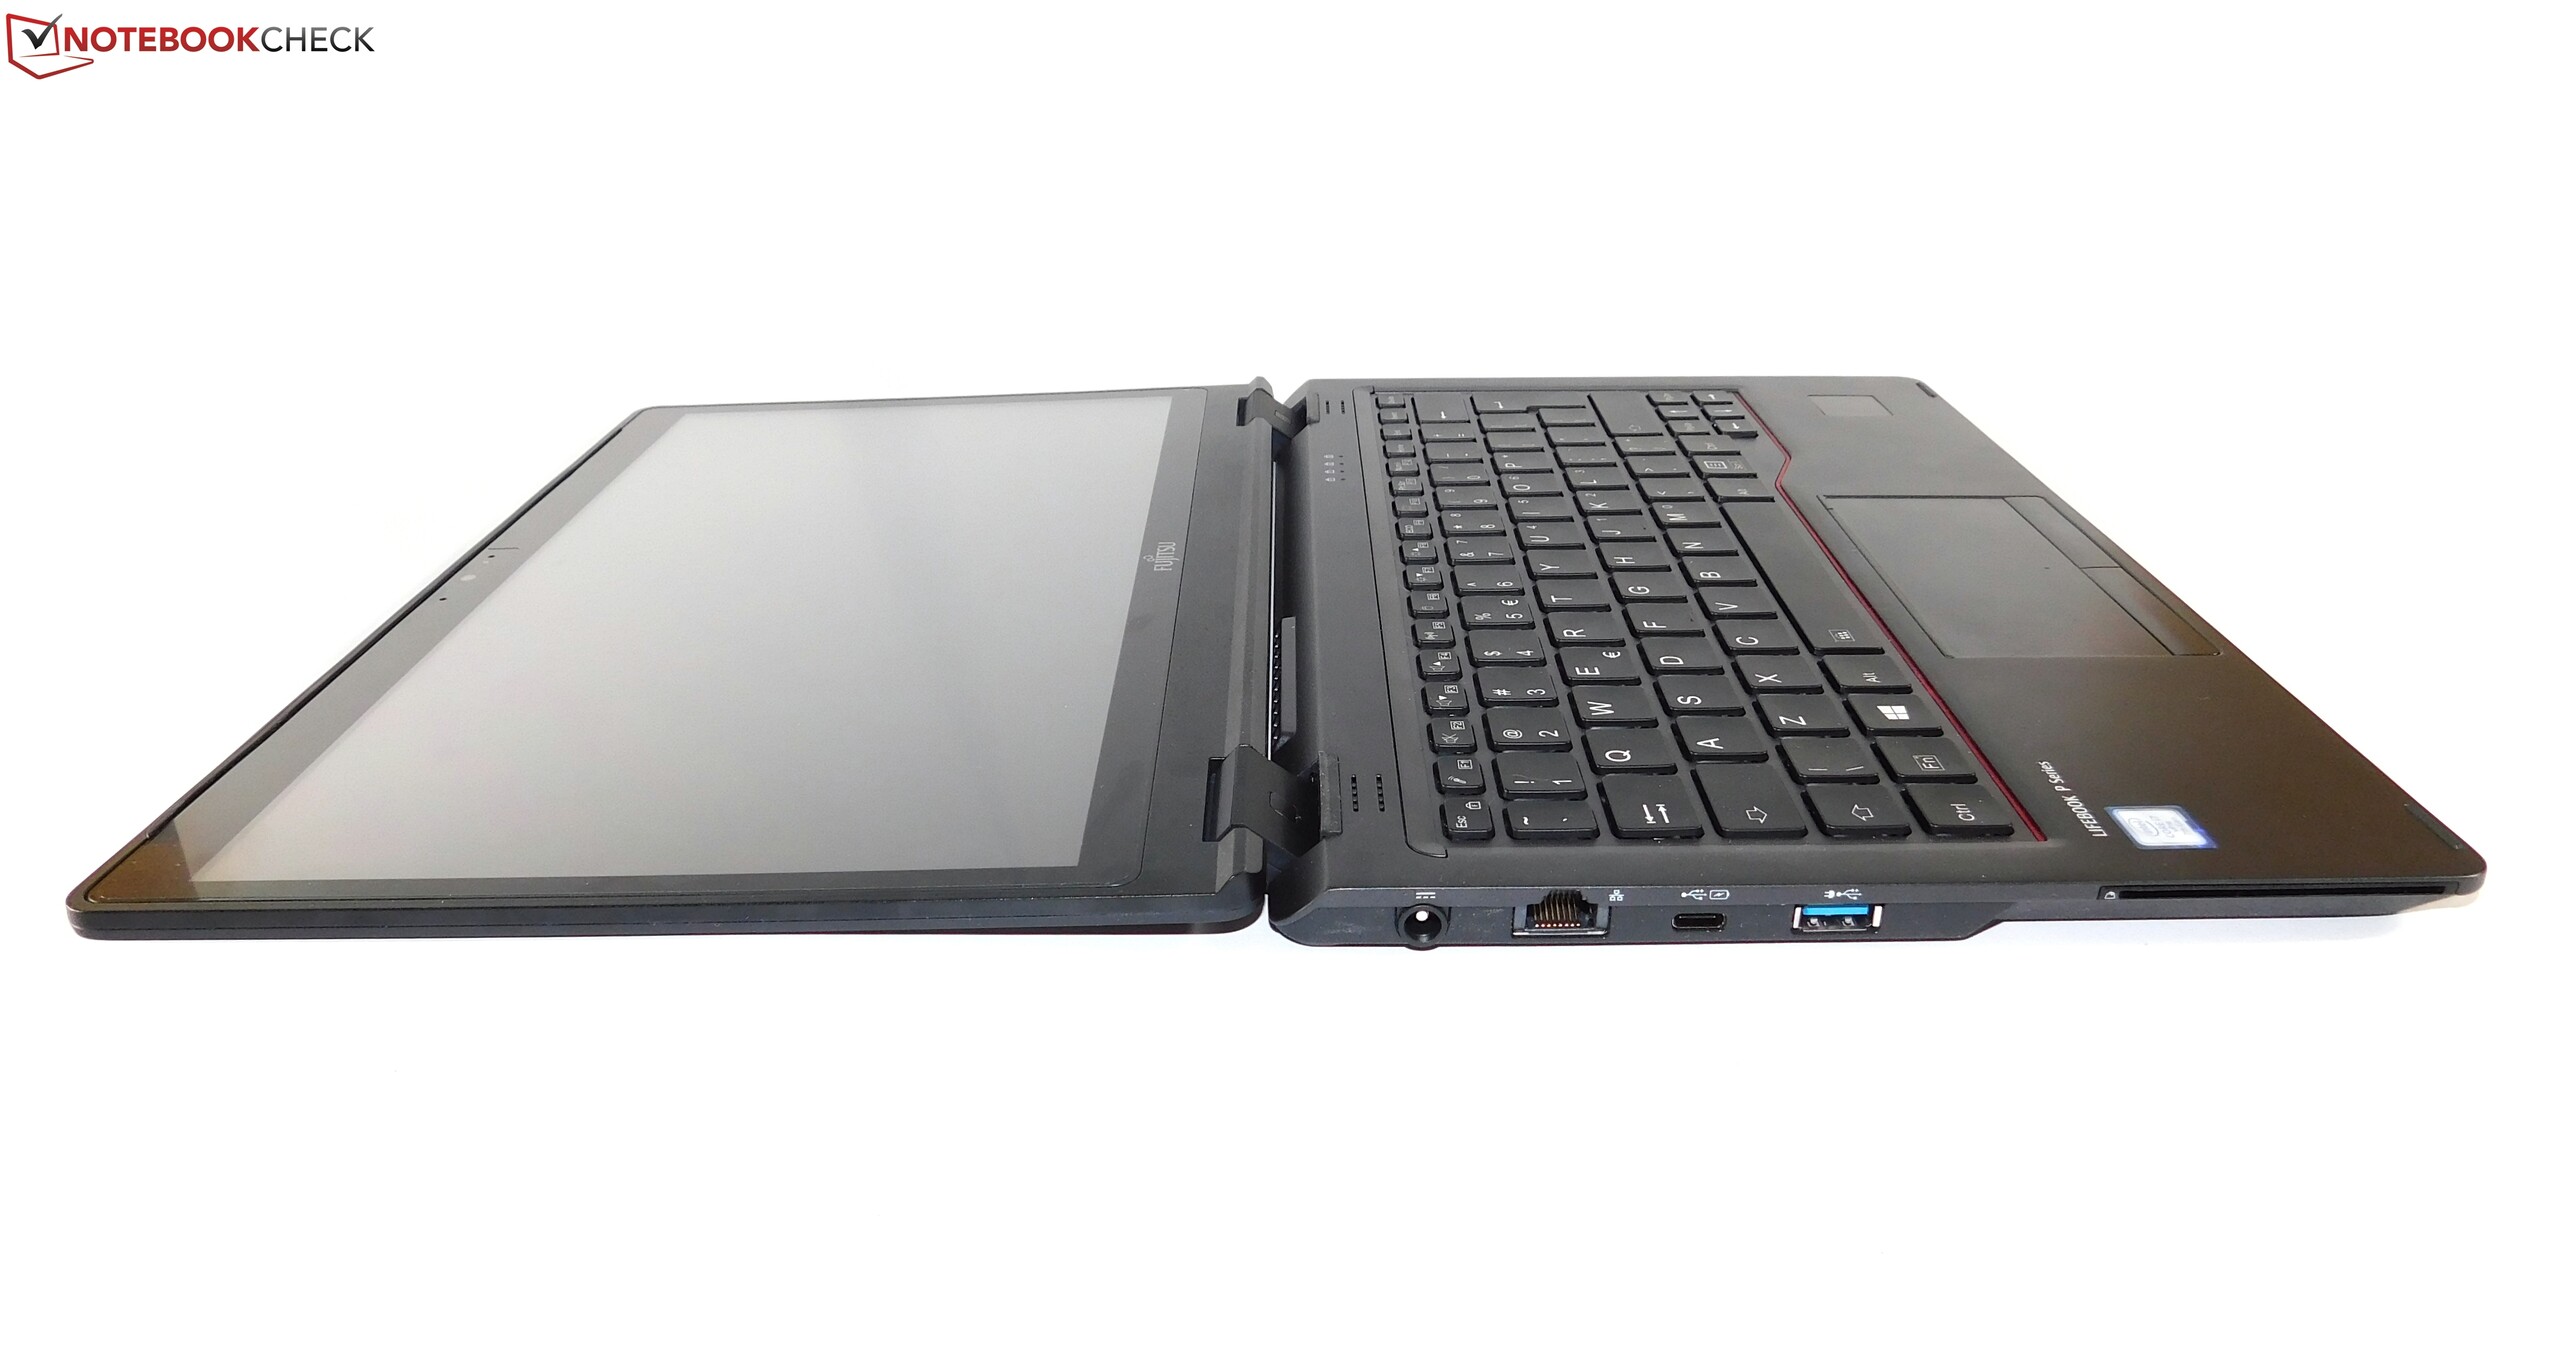
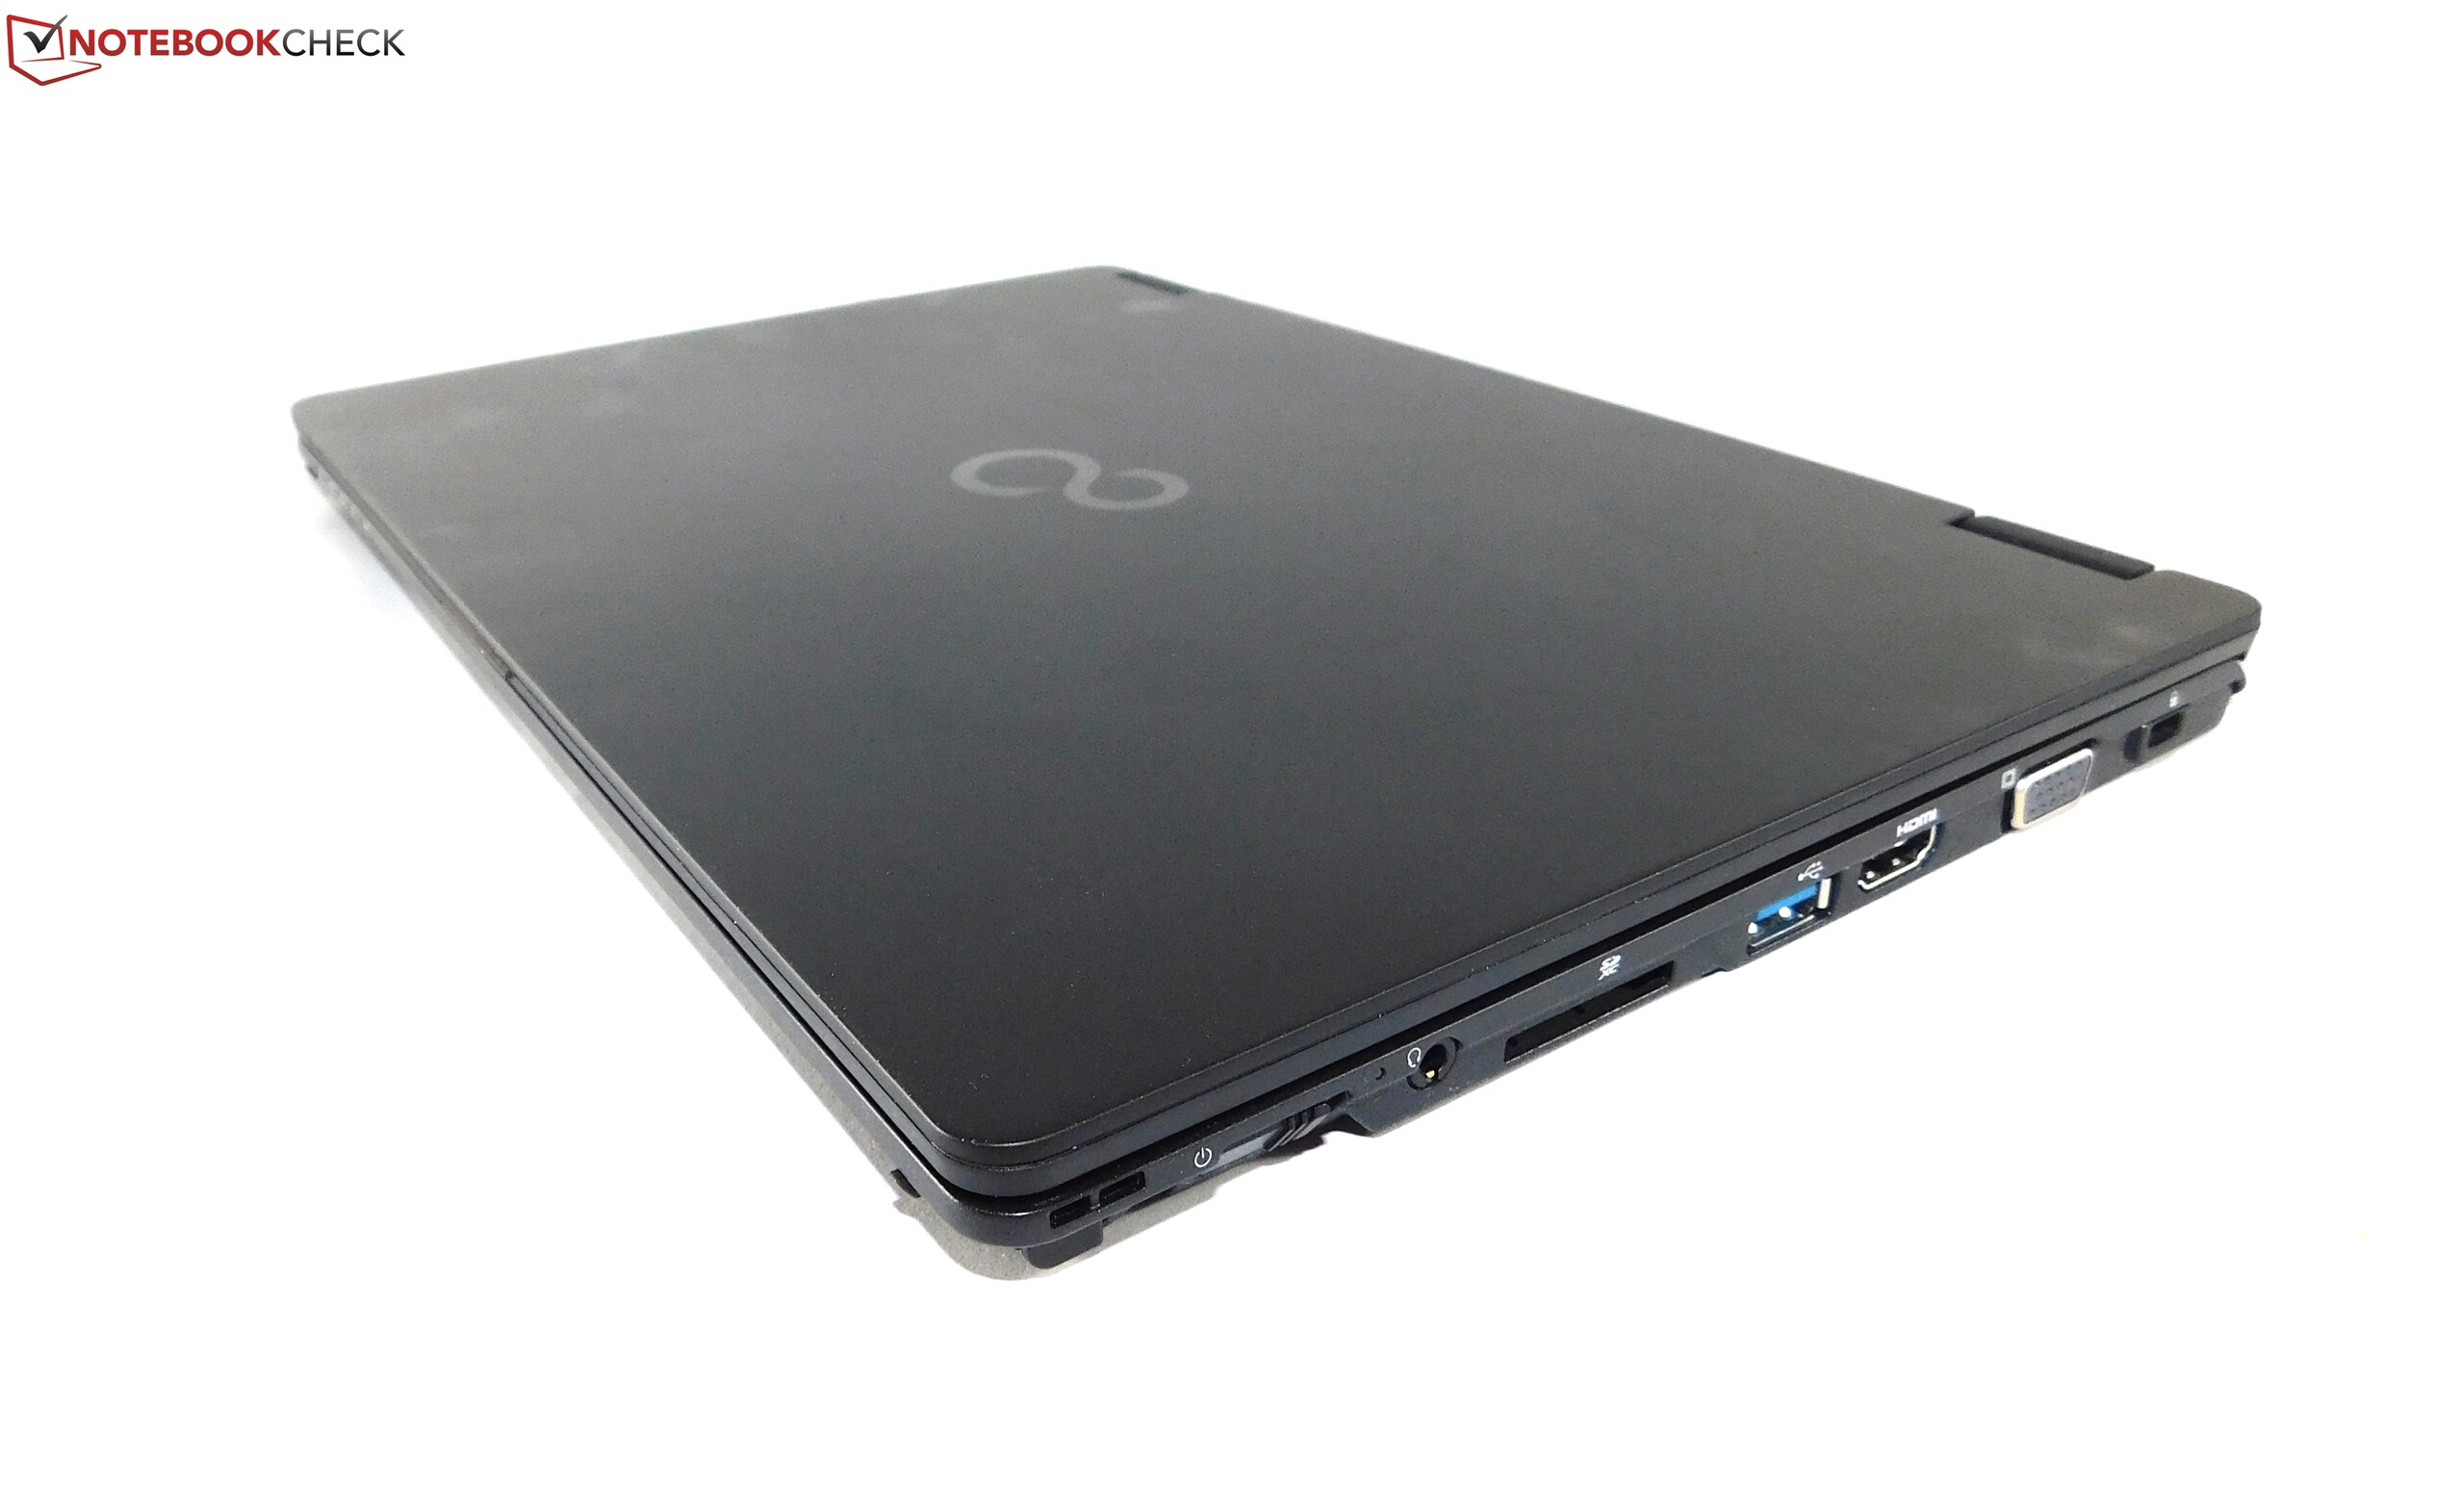
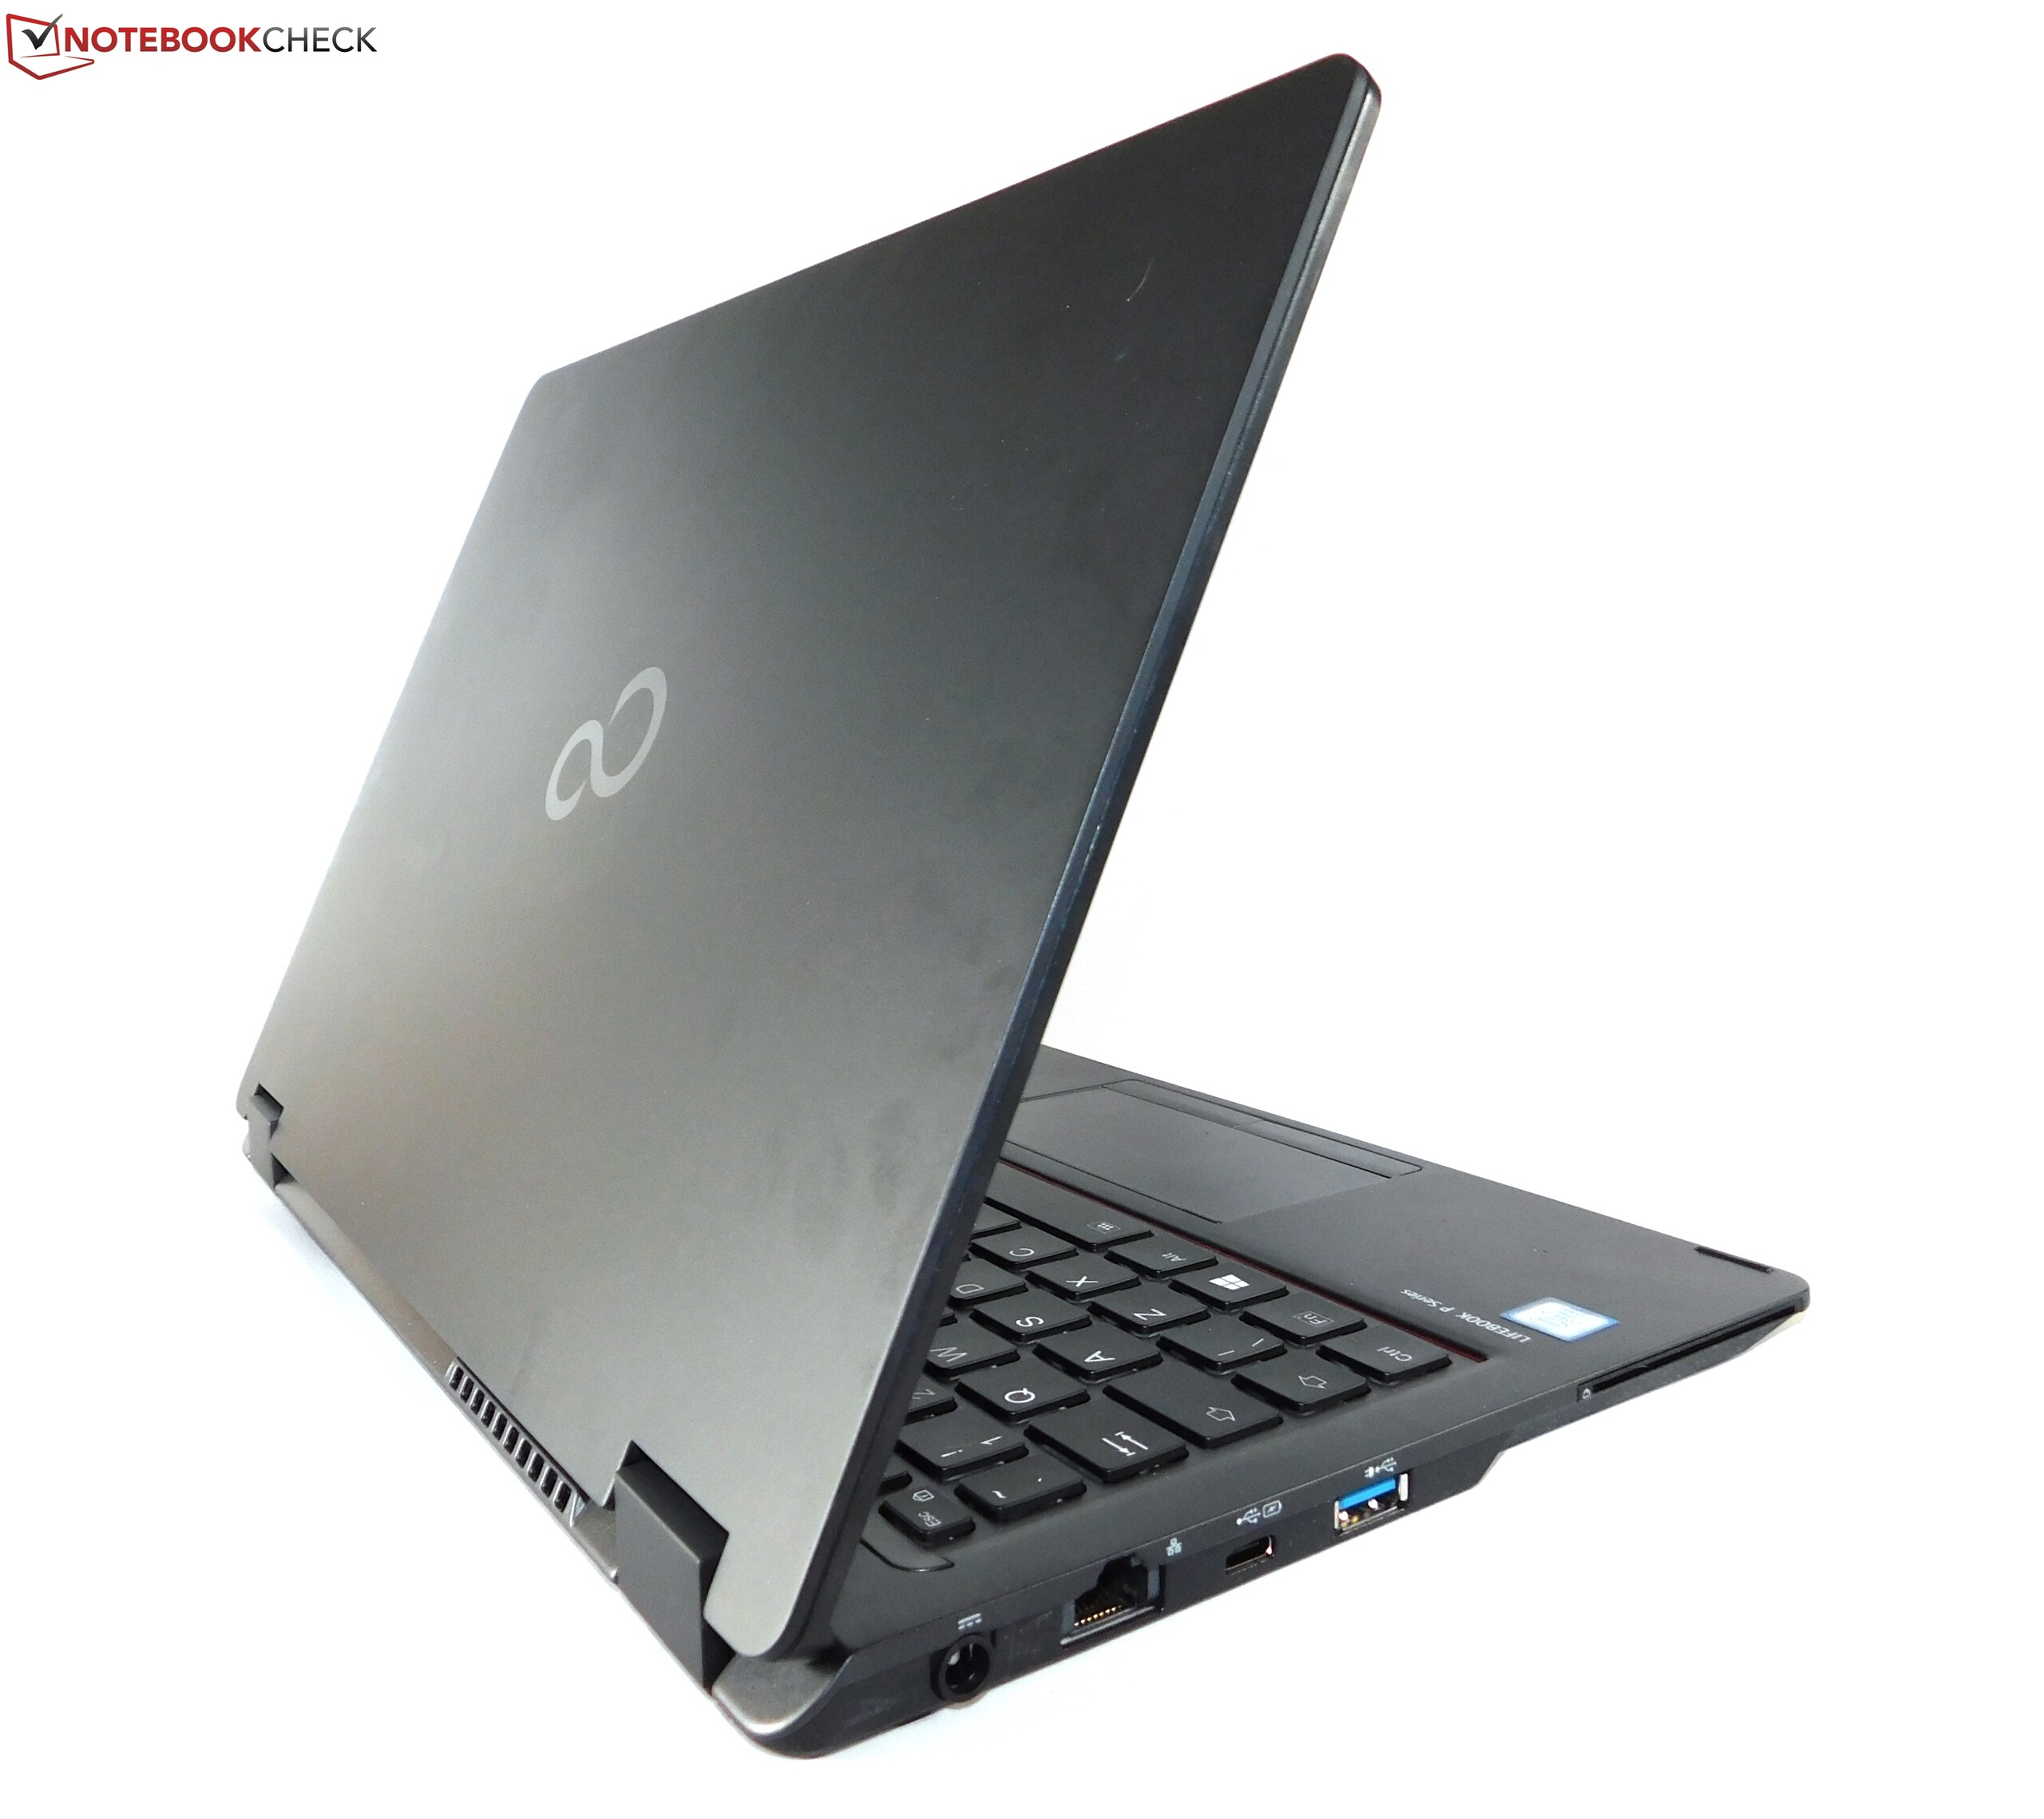
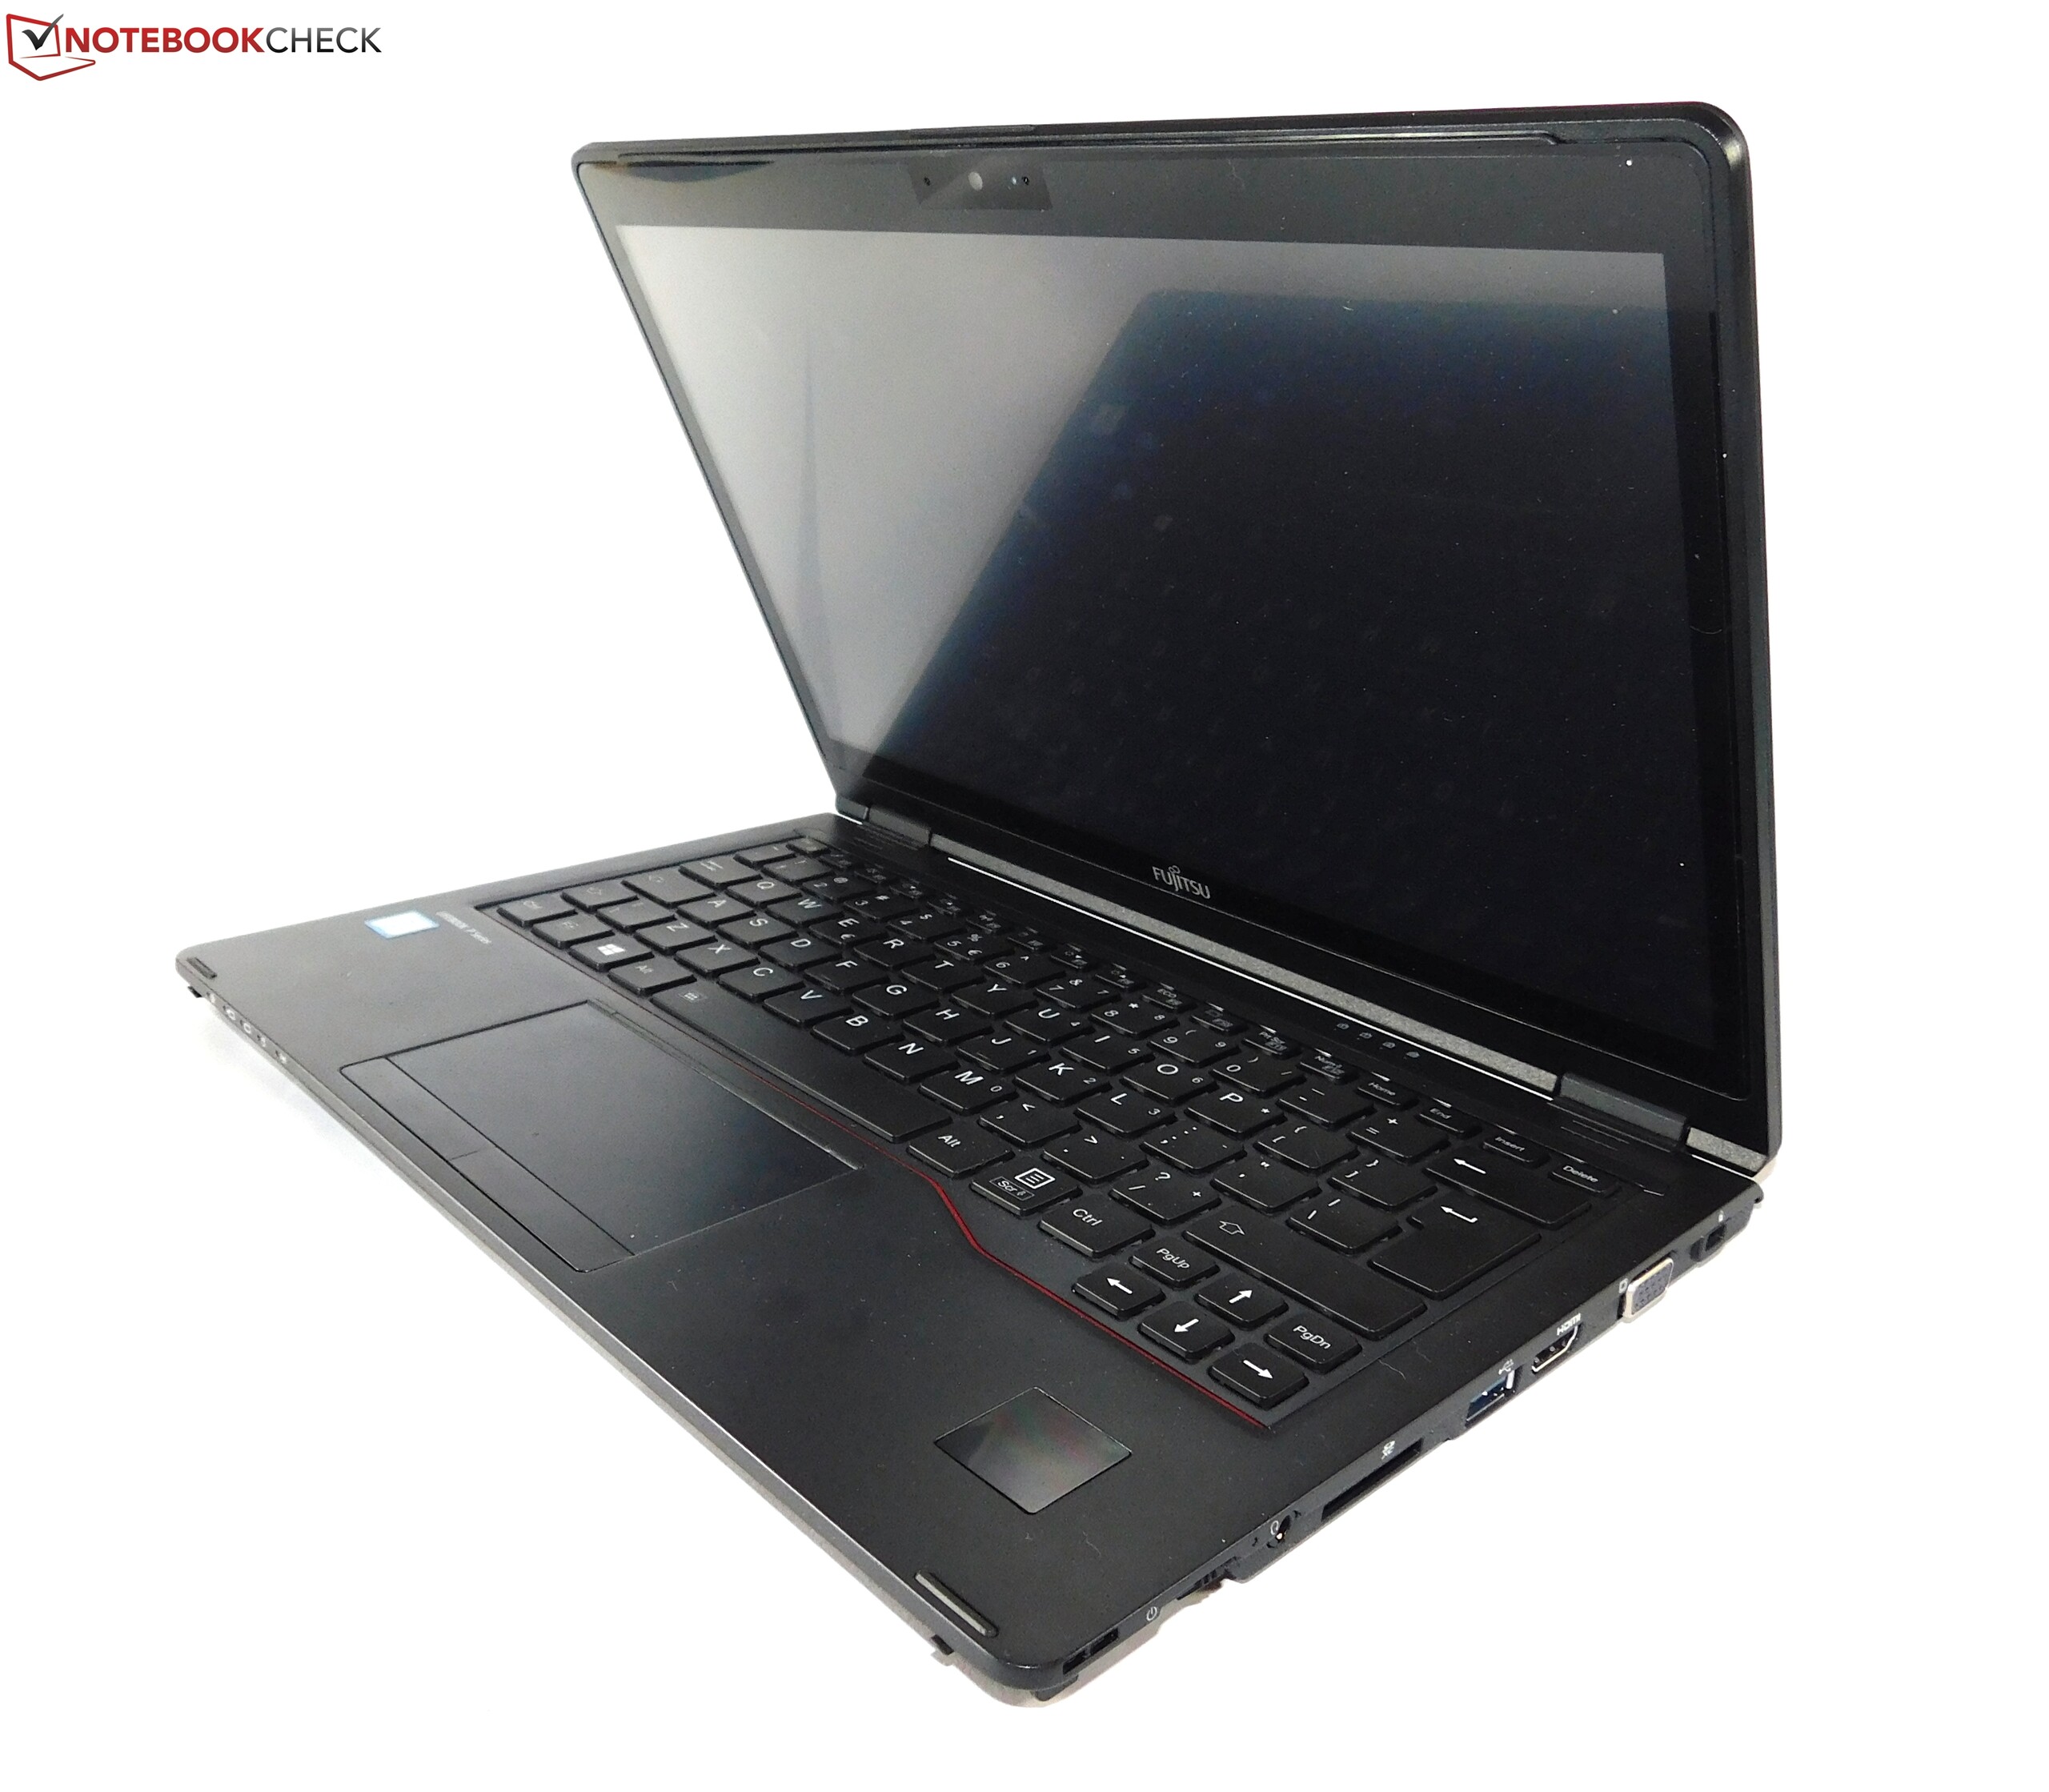
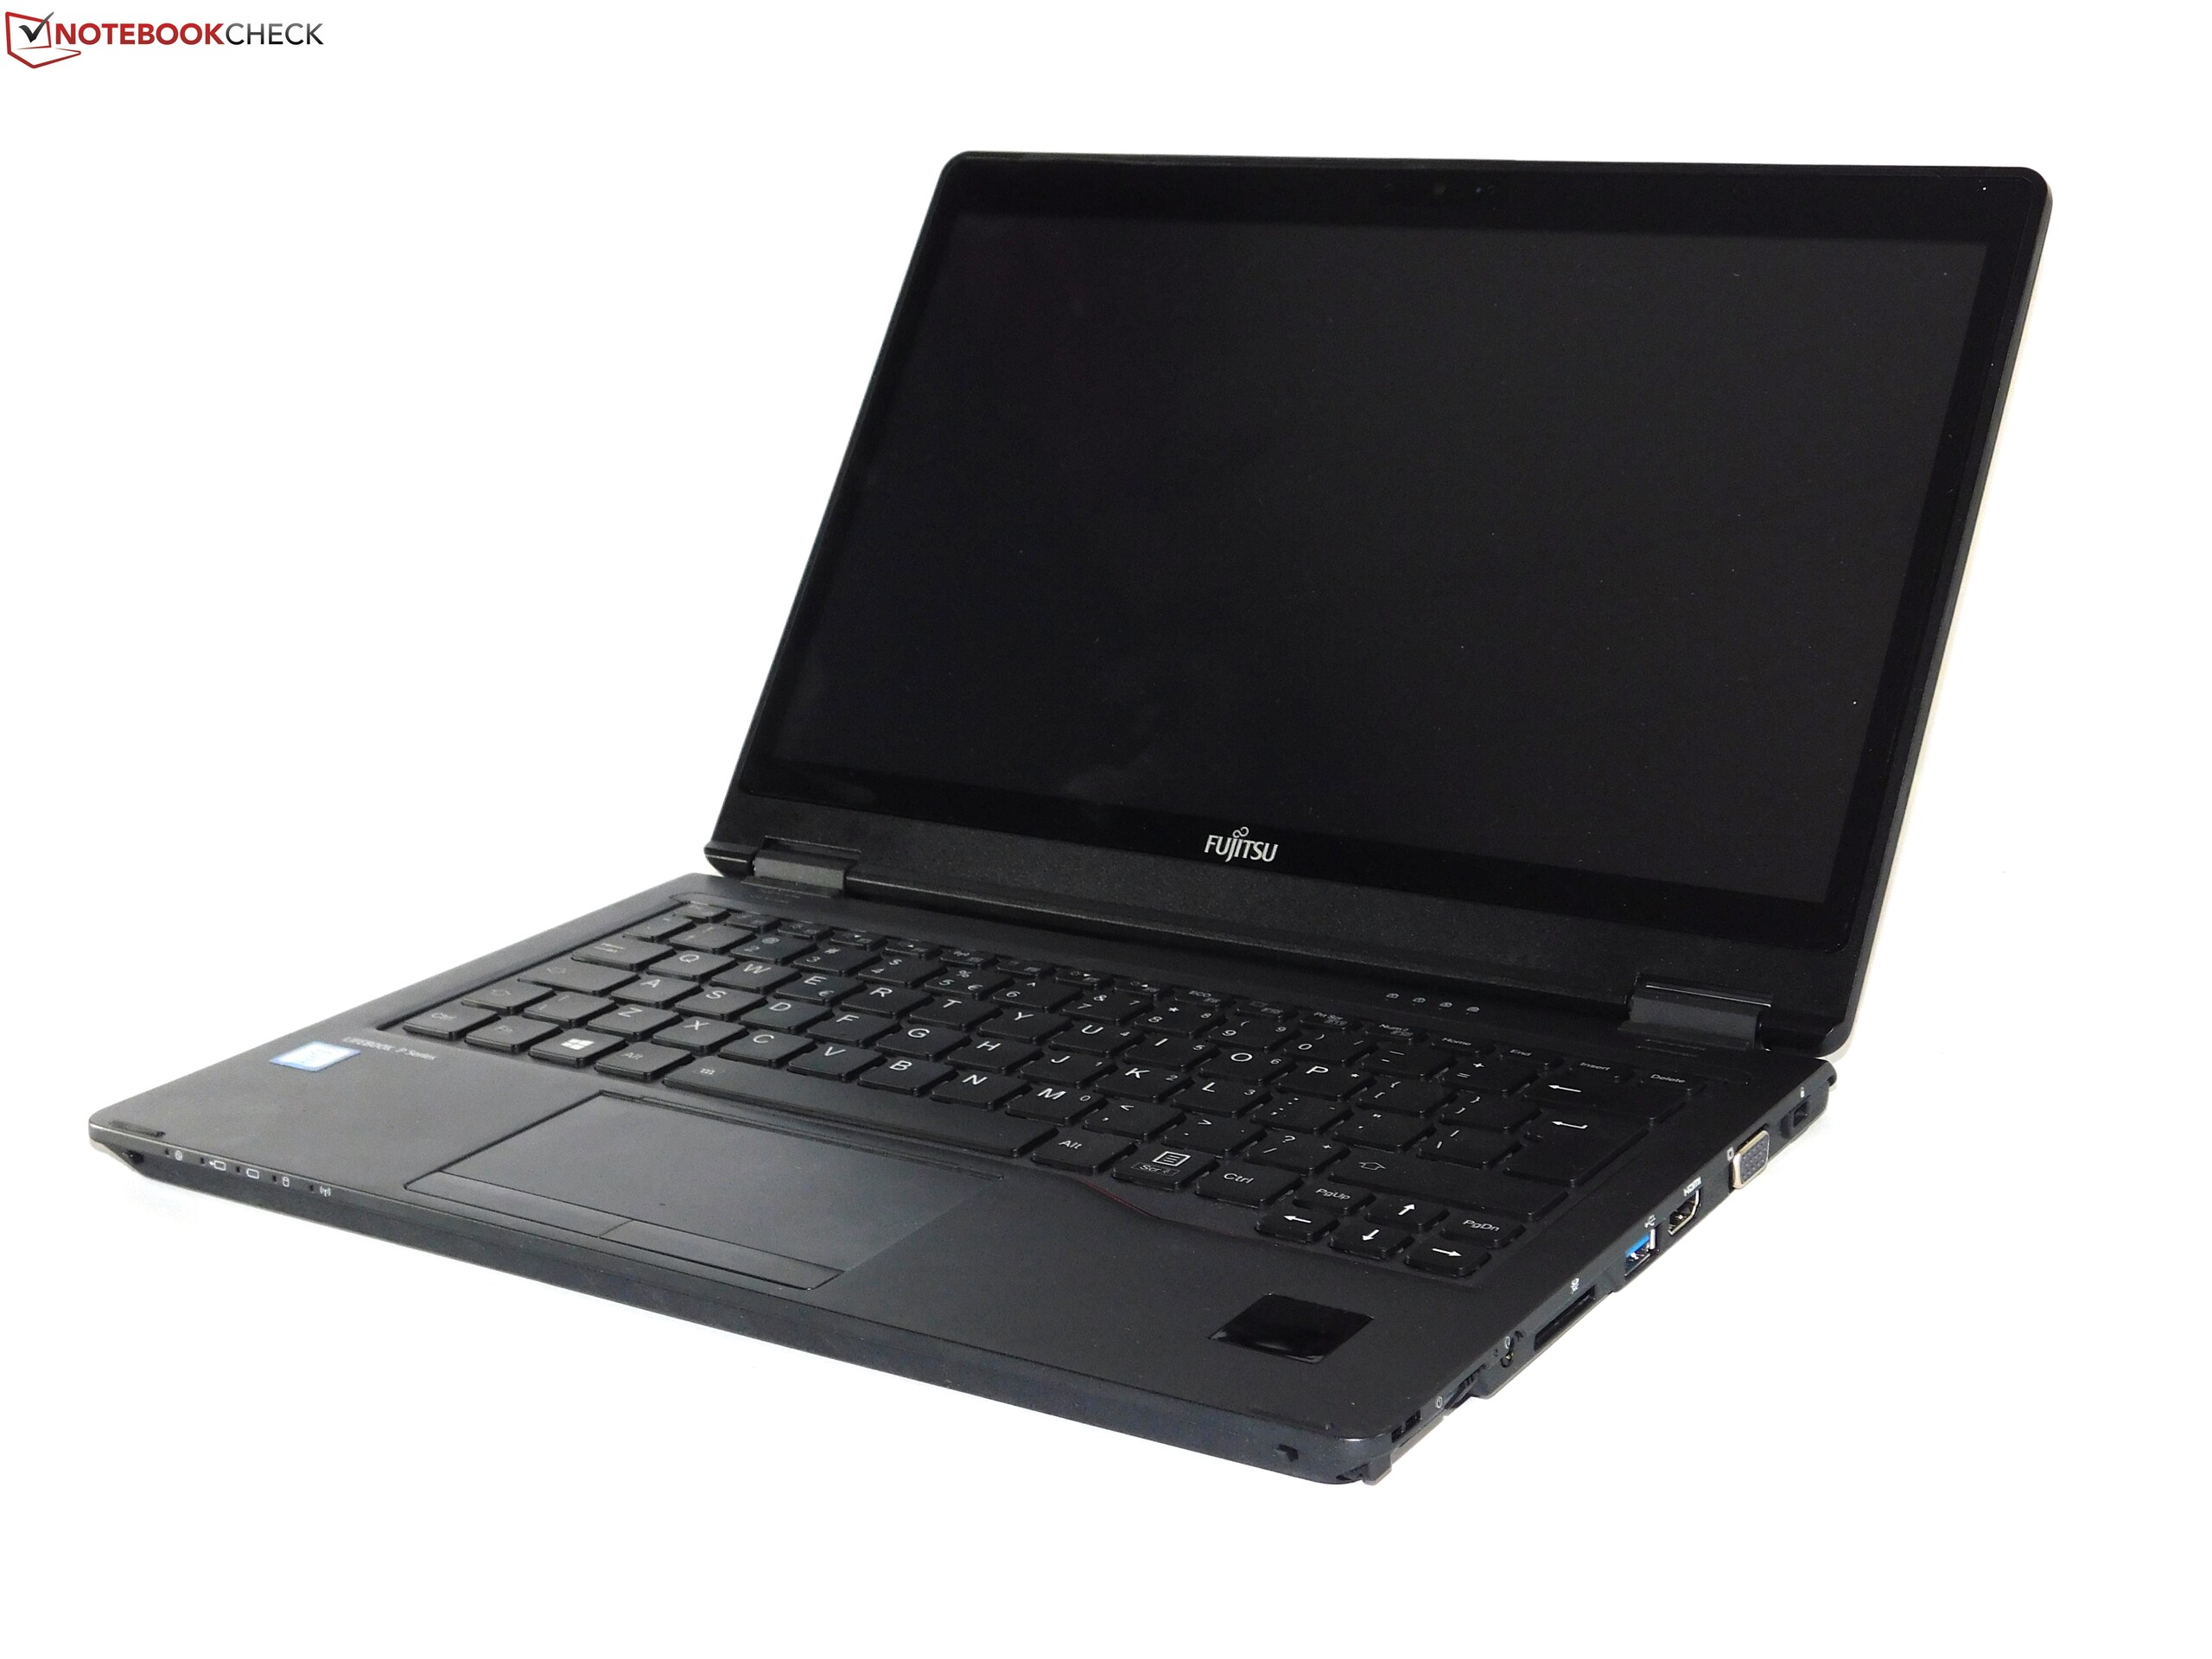
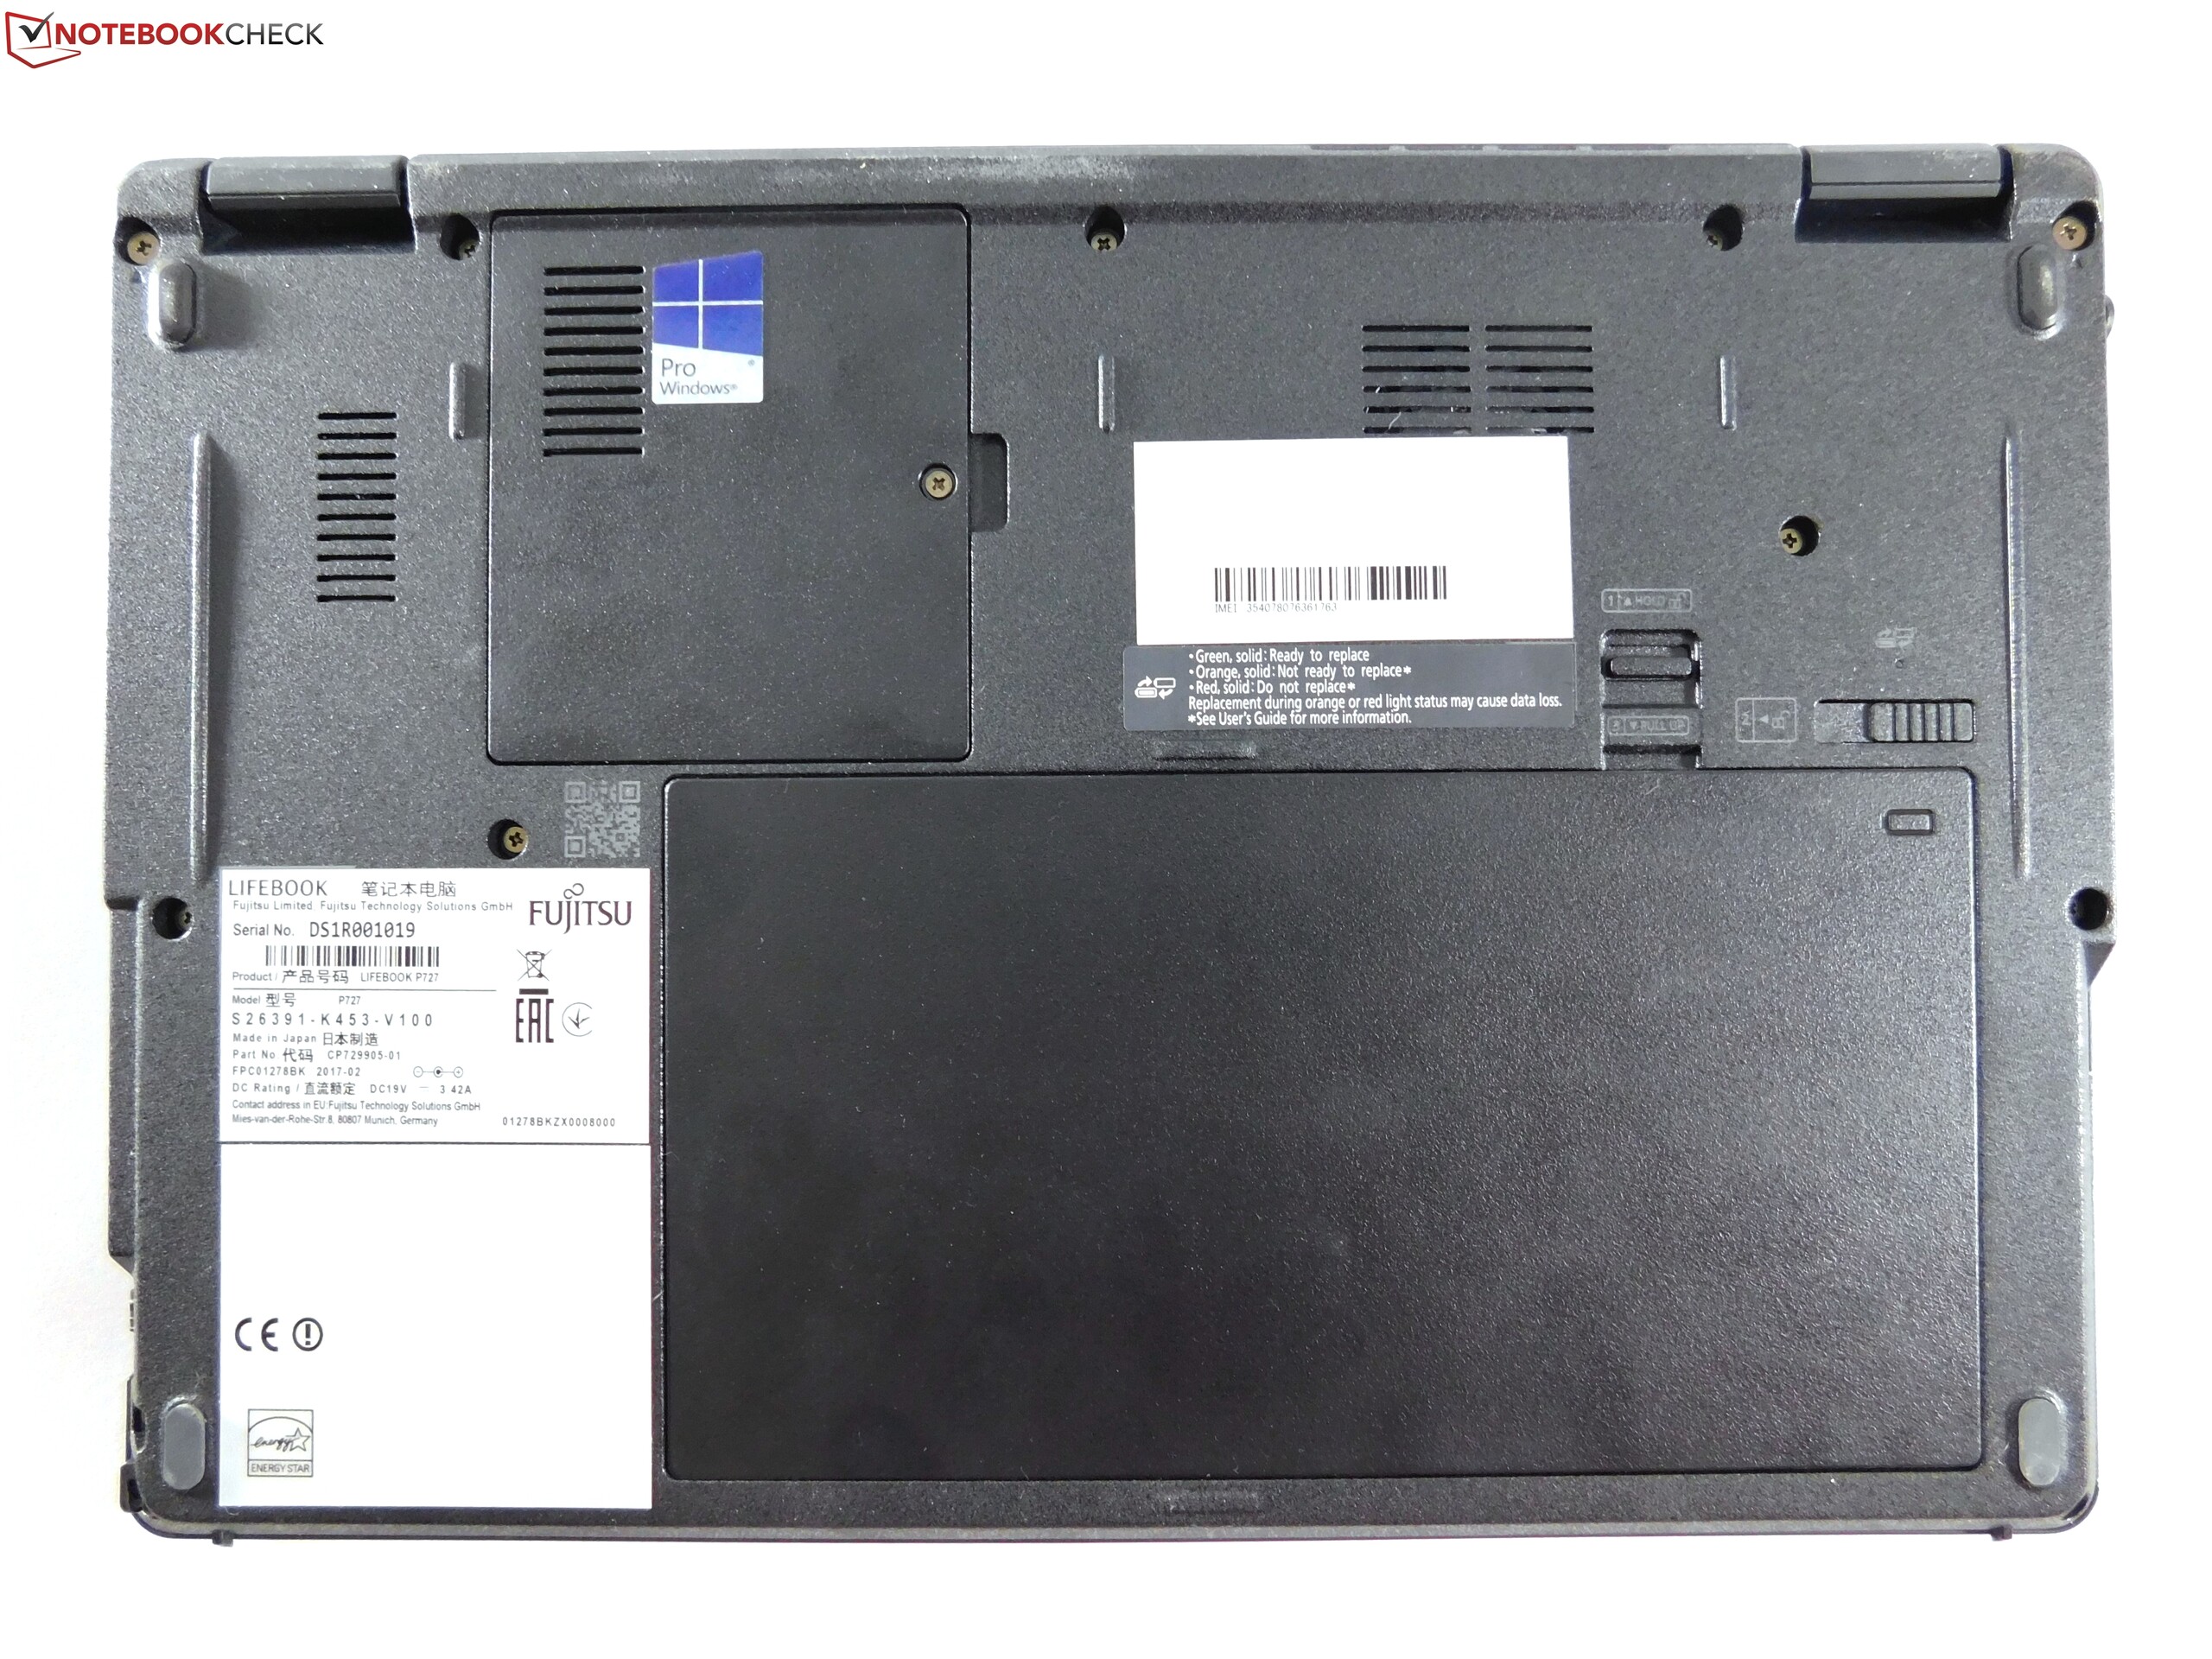
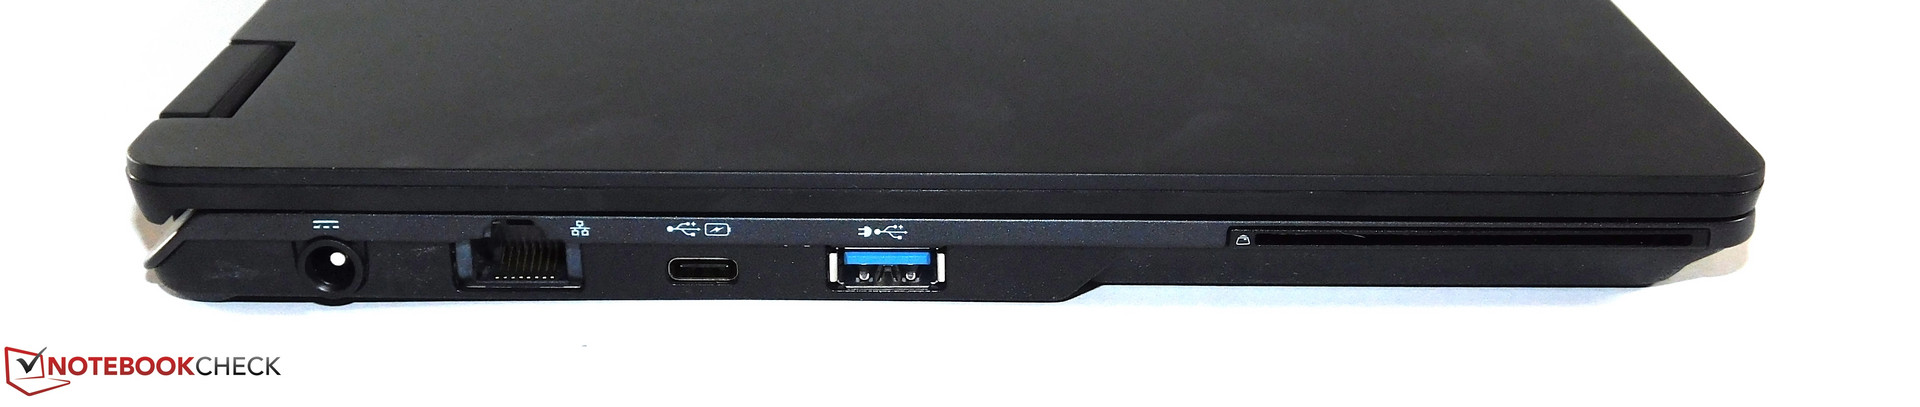
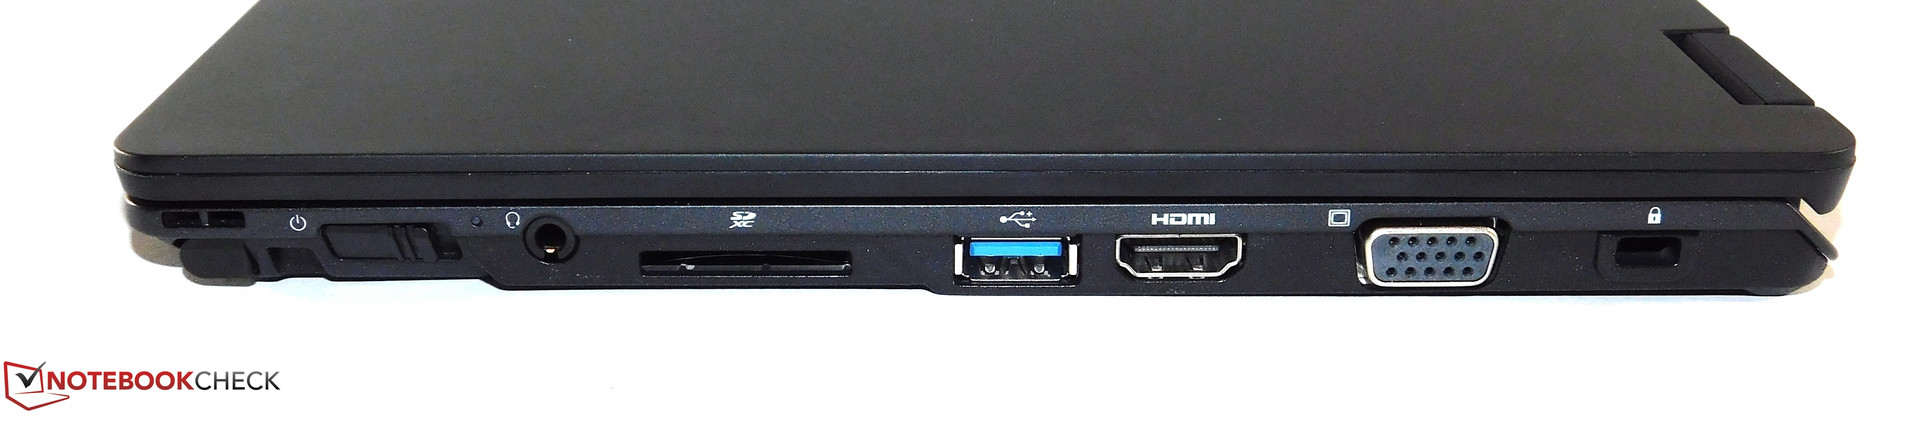
该机在拥有众多优秀机器的市场上,很难脱颖而出。戴尔曾不得不吞下Latitude 5289这颗苦药,现在轮到了富士通。先说优点:外壳由高级材料制作,非常坚固;显示屏虽然不如承诺那样明亮,但表现非常好,特别是在色彩空间覆盖方面;连接方式——提供全尺寸VGA和以太网端口或全尺寸MicroSD卡插槽;用户可自行更换电池即使容量不大,这是一个独特的卖点;键盘是非常好用,打字愉悦;最后是,Lifebook P727在一些市场中提供LTE调制解调器配置(目前美国不行)。
可惜,它还有一些缺点的。P727不能否认它身上带有Lifebook U系列的影子,触摸板问题最大,非常不准确而且令人生厌。虽然我们赞扬富士通配备了了VGA和以太网等传统端口,但雷电3的缺失令人不安。由于底部专有的对接端口的缺失,用户被限制于USB-C对接方案。另一个缺点是处理器过热时,不能按照达到规定的性能,并且在某些情况下甚至落后于较慢的酷睿 i5。而且,更糟糕的是,电池续航相对较短。
Lifebook P727的传统端口和用户可更换电池是两个独特卖点。可怕的触摸板及其低于平均水平的电池续航时间,破坏了原有的良好印象。
因此,我们不能无限制地推荐P727。如果您有较老的设备,例如VGA投影机,P727肯定会成为一个非常有趣的选择。那些喜欢可更换电池的人也是如此。否则,Elitebook x360和ThinkPad Yoga 370是更好选择,具有更长的电池寿命和更好的输入设备。此外,这些13.3英寸变形本会比P727稍笨重些。
注:本文是基于完整评测的缩减版本,阅读完整的英文评测,请点击这里。
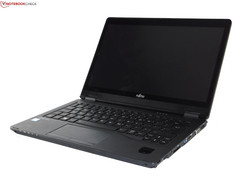
Fujitsu Lifebook P727
- 06/07/2017 v6 (old)
Benjamin Herzig
Price comparison
