富士通 Lifebook T937 (i7, 512 GB) 变形本简短评测
| SD Card Reader | |
| average JPG Copy Test (av. of 3 runs) | |
| Fujitsu Lifebook T937 | |
| HP EliteBook 820 G4 Z2V72ET | |
| Dell Latitude 12 5285 2-in-1 | |
| maximum AS SSD Seq Read Test (1GB) | |
| Fujitsu Lifebook T937 | |
| Dell Latitude 12 5285 2-in-1 | |
| HP EliteBook 820 G4 Z2V72ET | |
| Networking | |
| iperf3 transmit AX12 | |
| Asus Transformer 3 Pro T303UA-GN050T | |
| Fujitsu Lifebook T937 | |
| HP EliteBook 820 G4 Z2V72ET (jseb) | |
| Dell Latitude 12 5285 2-in-1 | |
| iperf3 receive AX12 | |
| Fujitsu Lifebook T937 | |
| Asus Transformer 3 Pro T303UA-GN050T | |
| HP EliteBook 820 G4 Z2V72ET (jseb) | |
| Dell Latitude 12 5285 2-in-1 | |
| |||||||||||||||||||||||||
Brightness Distribution: 87 %
Center on Battery: 236 cd/m²
Contrast: 1311:1 (Black: 0.18 cd/m²)
ΔE ColorChecker Calman: 4.25 | ∀{0.5-29.43 Ø4.72}
ΔE Greyscale Calman: 2.5 | ∀{0.09-98 Ø4.97}
62% sRGB (Argyll 1.6.3 3D)
39% AdobeRGB 1998 (Argyll 1.6.3 3D)
42.48% AdobeRGB 1998 (Argyll 3D)
61.6% sRGB (Argyll 3D)
41.08% Display P3 (Argyll 3D)
Gamma: 2.48
CCT: 7082 K
| Fujitsu Lifebook T937 Sharp SHP141B , , 1920x1080, 13.3" | Dell Latitude 12 5285 2-in-1 BOE06DC, , 1920x1280, 12.3" | Asus Transformer 3 Pro T303UA-GN050T BOE BOE06AC (NV126A1M-N51), , 2880x1920, 12.6" | Lenovo Thinkpad X1 Yoga 20FQ-000QUS VVX14T058J10, , 2560x1440, 14" | HP EliteBook 820 G4 Z2V72ET Chi Mei, , 1920x1080, 12.5" | |
|---|---|---|---|---|---|
| Display | 53% | 84% | 63% | 7% | |
| Display P3 Coverage (%) | 41.08 | 62.8 53% | 81.8 99% | 68.1 66% | 44.45 8% |
| sRGB Coverage (%) | 61.6 | 94 53% | 98.3 60% | 97.2 58% | 65.5 6% |
| AdobeRGB 1998 Coverage (%) | 42.48 | 64.7 52% | 82.2 94% | 70.2 65% | 46.04 8% |
| Response Times | 6% | 22% | 11% | 22% | |
| Response Time Grey 50% / Grey 80% * (ms) | 46 ? | 42.4 ? 8% | 30 ? 35% | 38 ? 17% | 35 ? 24% |
| Response Time Black / White * (ms) | 32 ? | 30.8 ? 4% | 29 ? 9% | 30.4 ? 5% | 26 ? 19% |
| PWM Frequency (Hz) | 212 ? | 210.1 ? | 200 ? | 219 ? | |
| Screen | 11% | 3% | -24% | -31% | |
| Brightness middle (cd/m²) | 236 | 523.2 122% | 316 34% | 284.7 21% | 326 38% |
| Brightness (cd/m²) | 219 | 522 138% | 307 40% | 272 24% | 304 39% |
| Brightness Distribution (%) | 87 | 88 1% | 91 5% | 89 2% | 81 -7% |
| Black Level * (cd/m²) | 0.18 | 0.42 -133% | 0.29 -61% | 0.383 -113% | 0.29 -61% |
| Contrast (:1) | 1311 | 1246 -5% | 1090 -17% | 743 -43% | 1124 -14% |
| Colorchecker dE 2000 * | 4.25 | 4 6% | 3.91 8% | 5.24 -23% | 6.49 -53% |
| Colorchecker dE 2000 max. * | 7.4 | 8.6 -16% | 7.9 -7% | 11.22 -52% | 15.95 -116% |
| Greyscale dE 2000 * | 2.5 | 5.5 -120% | 5.37 -115% | 7.32 -193% | 6.16 -146% |
| Gamma | 2.48 89% | 2.16 102% | 2.36 93% | 2.22 99% | 2.32 95% |
| CCT | 7082 92% | 7546 86% | 7812 83% | 6277 104% | 7575 86% |
| Color Space (Percent of AdobeRGB 1998) (%) | 39 | 64.86 66% | 72 85% | 70.17 80% | 42 8% |
| Color Space (Percent of sRGB) (%) | 62 | 93.97 52% | 98 58% | 94.68 53% | 65 5% |
| Total Average (Program / Settings) | 23% /
19% | 36% /
22% | 17% /
-2% | -1% /
-16% |
* ... smaller is better
Display Response Times
| ↔ Response Time Black to White | ||
|---|---|---|
| 32 ms ... rise ↗ and fall ↘ combined | ↗ 18 ms rise | 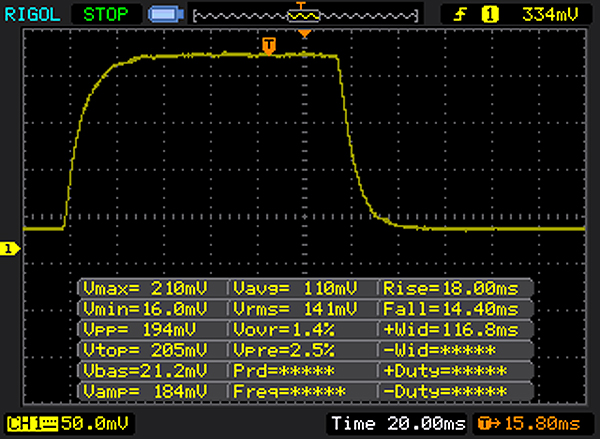 |
| ↘ 14 ms fall | ||
| The screen shows slow response rates in our tests and will be unsatisfactory for gamers. In comparison, all tested devices range from 0.1 (minimum) to 240 (maximum) ms. » 86 % of all devices are better. This means that the measured response time is worse than the average of all tested devices (19.8 ms). | ||
| ↔ Response Time 50% Grey to 80% Grey | ||
| 46 ms ... rise ↗ and fall ↘ combined | ↗ 22 ms rise | 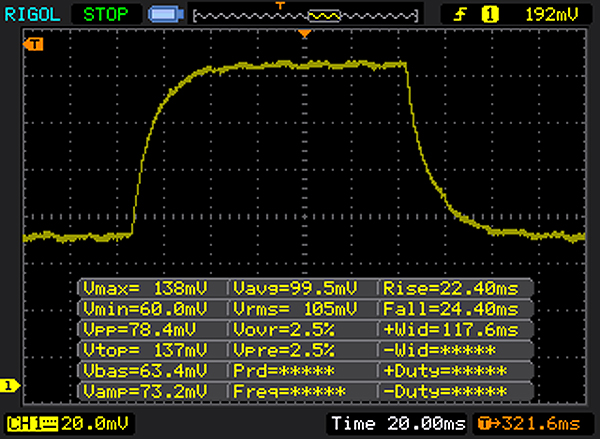 |
| ↘ 24 ms fall | ||
| The screen shows slow response rates in our tests and will be unsatisfactory for gamers. In comparison, all tested devices range from 0.165 (minimum) to 636 (maximum) ms. » 79 % of all devices are better. This means that the measured response time is worse than the average of all tested devices (31 ms). | ||
Screen Flickering / PWM (Pulse-Width Modulation)
| Screen flickering / PWM detected | 212 Hz | ≤ 30 % brightness setting | 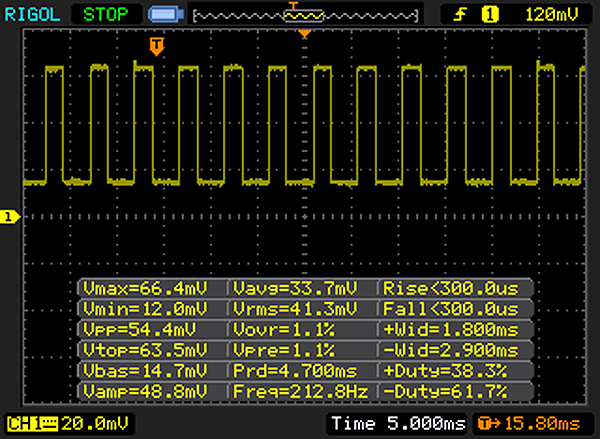 |
The display backlight flickers at 212 Hz (worst case, e.g., utilizing PWM) Flickering detected at a brightness setting of 30 % and below. There should be no flickering or PWM above this brightness setting. The frequency of 212 Hz is relatively low, so sensitive users will likely notice flickering and experience eyestrain at the stated brightness setting and below. In comparison: 52 % of all tested devices do not use PWM to dim the display. If PWM was detected, an average of 7781 (minimum: 5 - maximum: 343500) Hz was measured. | |||
| PCMark 8 Home Score Accelerated v2 | 3048 points | |
| PCMark 8 Creative Score Accelerated v2 | 4029 points | |
| PCMark 8 Work Score Accelerated v2 | 4286 points | |
Help | ||
| Fujitsu Lifebook T937 | Dell Latitude 12 5285 2-in-1 Samsung PM961 MZVLW256HEHP | Asus Transformer 3 Pro T303UA-GN050T SK Hynix Canvas SC300 512GB M.2 (HFS512G39MND) | Lenovo Thinkpad X1 Yoga 20FQ-000QUS Samsung SSD PM871 MZNLN512HCJH | HP EliteBook 820 G4 Z2V72ET Samsung PM951 NVMe MZVLV512 | |
|---|---|---|---|---|---|
| CrystalDiskMark 3.0 | 53% | -21% | -7% | 74% | |
| Read Seq (MB/s) | 549 | 1294 136% | 398.9 -27% | 512 -7% | 1315 140% |
| Write Seq (MB/s) | 526 | 865 64% | 402 -24% | 443.8 -16% | 594 13% |
| Read 512 (MB/s) | 406 | 303.1 | 363.1 | 661 | |
| Write 512 (MB/s) | 589 | 320.3 | 377.8 | 594 | |
| Read 4k (MB/s) | 34.71 | 31.75 -9% | 26.11 -25% | 33.99 -2% | 42.87 24% |
| Write 4k (MB/s) | 89.6 | 72.2 -19% | 57.7 -36% | 81.9 -9% | 151.6 69% |
| Read 4k QD32 (MB/s) | 279.3 | 493.3 77% | 245.8 -12% | 327.4 17% | 568 103% |
| Write 4k QD32 (MB/s) | 255.8 | 434.5 70% | 253.8 -1% | 189.2 -26% | 491.7 92% |

| 3DMark Cloud Gate Standard Score | 3369 points | |
Help | ||
| BioShock Infinite - 1280x720 Very Low Preset | |
| Dell Latitude 12 5285 2-in-1 | |
| Lenovo Thinkpad X1 Yoga 20FQ-000QUS | |
| Asus Transformer 3 Pro T303UA-GN050T | |
| HP EliteBook 820 G4 Z2V72ET | |
| Fujitsu Lifebook T937 | |
| low | med. | high | ultra | |
|---|---|---|---|---|
| BioShock Infinite (2013) | 33.72 | 10.98 | 9.52 | 7 |
Noise level
| Idle |
| 30 / 30 / 30 dB(A) |
| Load |
| 37.4 / 37.6 dB(A) |
 | ||
30 dB silent 40 dB(A) audible 50 dB(A) loud |
||
min: | ||
(+) The maximum temperature on the upper side is 35.2 °C / 95 F, compared to the average of 35.4 °C / 96 F, ranging from 19.6 to 60 °C for the class Convertible.
(+) The bottom heats up to a maximum of 33.9 °C / 93 F, compared to the average of 36.9 °C / 98 F
(+) In idle usage, the average temperature for the upper side is 22.1 °C / 72 F, compared to the device average of 30.3 °C / 87 F.
(+) The palmrests and touchpad are cooler than skin temperature with a maximum of 23.8 °C / 74.8 F and are therefore cool to the touch.
(+) The average temperature of the palmrest area of similar devices was 28 °C / 82.4 F (+4.2 °C / 7.6 F).
Fujitsu Lifebook T937 audio analysis
(-) | not very loud speakers (65 dB)
Bass 100 - 315 Hz
(-) | nearly no bass - on average 20.9% lower than median
(+) | bass is linear (3.3% delta to prev. frequency)
Mids 400 - 2000 Hz
(±) | reduced mids - on average 7% lower than median
(±) | linearity of mids is average (8.1% delta to prev. frequency)
Highs 2 - 16 kHz
(+) | balanced highs - only 4.3% away from median
(+) | highs are linear (6.3% delta to prev. frequency)
Overall 100 - 16.000 Hz
(±) | linearity of overall sound is average (26.5% difference to median)
Compared to same class
» 82% of all tested devices in this class were better, 3% similar, 15% worse
» The best had a delta of 6%, average was 20%, worst was 57%
Compared to all devices tested
» 81% of all tested devices were better, 4% similar, 15% worse
» The best had a delta of 4%, average was 24%, worst was 134%
Apple MacBook 12 (Early 2016) 1.1 GHz audio analysis
(+) | speakers can play relatively loud (83.6 dB)
Bass 100 - 315 Hz
(±) | reduced bass - on average 11.3% lower than median
(±) | linearity of bass is average (14.2% delta to prev. frequency)
Mids 400 - 2000 Hz
(+) | balanced mids - only 2.4% away from median
(+) | mids are linear (5.5% delta to prev. frequency)
Highs 2 - 16 kHz
(+) | balanced highs - only 2% away from median
(+) | highs are linear (4.5% delta to prev. frequency)
Overall 100 - 16.000 Hz
(+) | overall sound is linear (10.2% difference to median)
Compared to same class
» 7% of all tested devices in this class were better, 2% similar, 91% worse
» The best had a delta of 5%, average was 18%, worst was 53%
Compared to all devices tested
» 5% of all tested devices were better, 1% similar, 94% worse
» The best had a delta of 4%, average was 24%, worst was 134%
| Off / Standby | |
| Idle | |
| Load |
|
Key:
min: | |
| Fujitsu Lifebook T937 i7-7600U, HD Graphics 620, , IPS, 1920x1080, 13.3" | Dell Latitude 12 5285 2-in-1 i7-7600U, HD Graphics 620, Samsung PM961 MZVLW256HEHP, IPS, 1920x1280, 12.3" | Asus Transformer 3 Pro T303UA-GN050T 6500U, HD Graphics 520, SK Hynix Canvas SC300 512GB M.2 (HFS512G39MND), IPS, 2880x1920, 12.6" | Lenovo Thinkpad X1 Yoga 20FQ-000QUS 6500U, HD Graphics 520, Samsung SSD PM871 MZNLN512HCJH, IPS, 2560x1440, 14" | HP EliteBook 820 G4 Z2V72ET i7-7500U, HD Graphics 620, Samsung PM951 NVMe MZVLV512, IPS, 1920x1080, 12.5" | |
|---|---|---|---|---|---|
| Power Consumption | -3% | -46% | -57% | 12% | |
| Idle Minimum * (Watt) | 3 | 2.85 5% | 6.7 -123% | 6.82 -127% | 2.7 10% |
| Idle Average * (Watt) | 6.8 | 6.76 1% | 10.3 -51% | 8.21 -21% | 4.8 29% |
| Idle Maximum * (Watt) | 7.7 | 6.91 10% | 13.5 -75% | 17.55 -128% | 6.6 14% |
| Load Average * (Watt) | 30 | 32.88 -10% | 26 13% | 28.81 4% | 28.5 5% |
| Load Maximum * (Watt) | 30.3 | 37.41 -23% | 28.8 5% | 34.07 -12% | 29 4% |
* ... smaller is better
| Fujitsu Lifebook T937 i7-7600U, HD Graphics 620, 50 Wh | Dell Latitude 12 5285 2-in-1 i7-7600U, HD Graphics 620, 42 Wh | Asus Transformer 3 Pro T303UA-GN050T 6500U, HD Graphics 520, 39 Wh | Lenovo Thinkpad X1 Yoga 20FQ-000QUS 6500U, HD Graphics 520, 52 Wh | HP EliteBook 820 G4 Z2V72ET i7-7500U, HD Graphics 620, 49 Wh | |
|---|---|---|---|---|---|
| Battery runtime | -15% | -53% | -25% | 17% | |
| Reader / Idle (h) | 17 | 17.9 5% | 7.1 -58% | 15.4 -9% | 22.4 32% |
| WiFi v1.3 (h) | 8.7 | 8.1 -7% | 3.7 -57% | 5.9 -32% | 9.4 8% |
| Load (h) | 3.1 | 1.8 -42% | 1.7 -45% | 2 -35% | 3.4 10% |
| H.264 (h) | 3.4 | 8.9 |
Pros
Cons
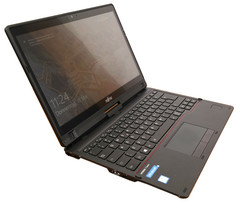
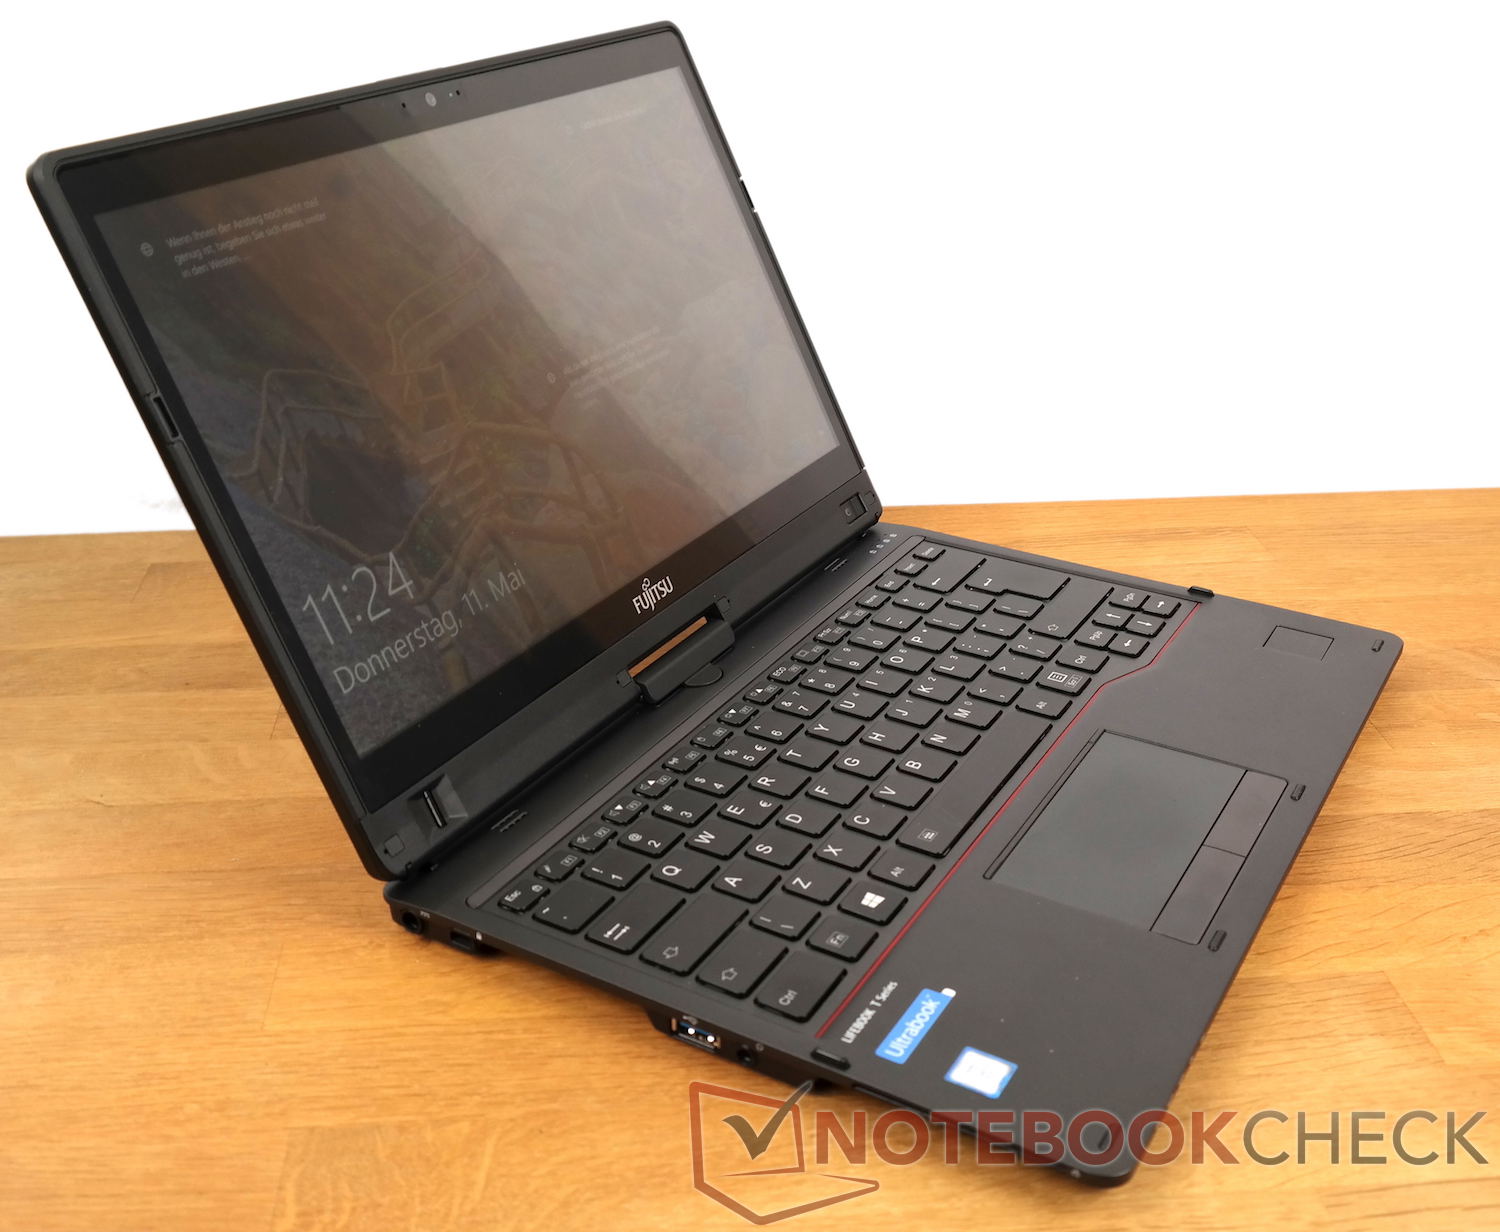
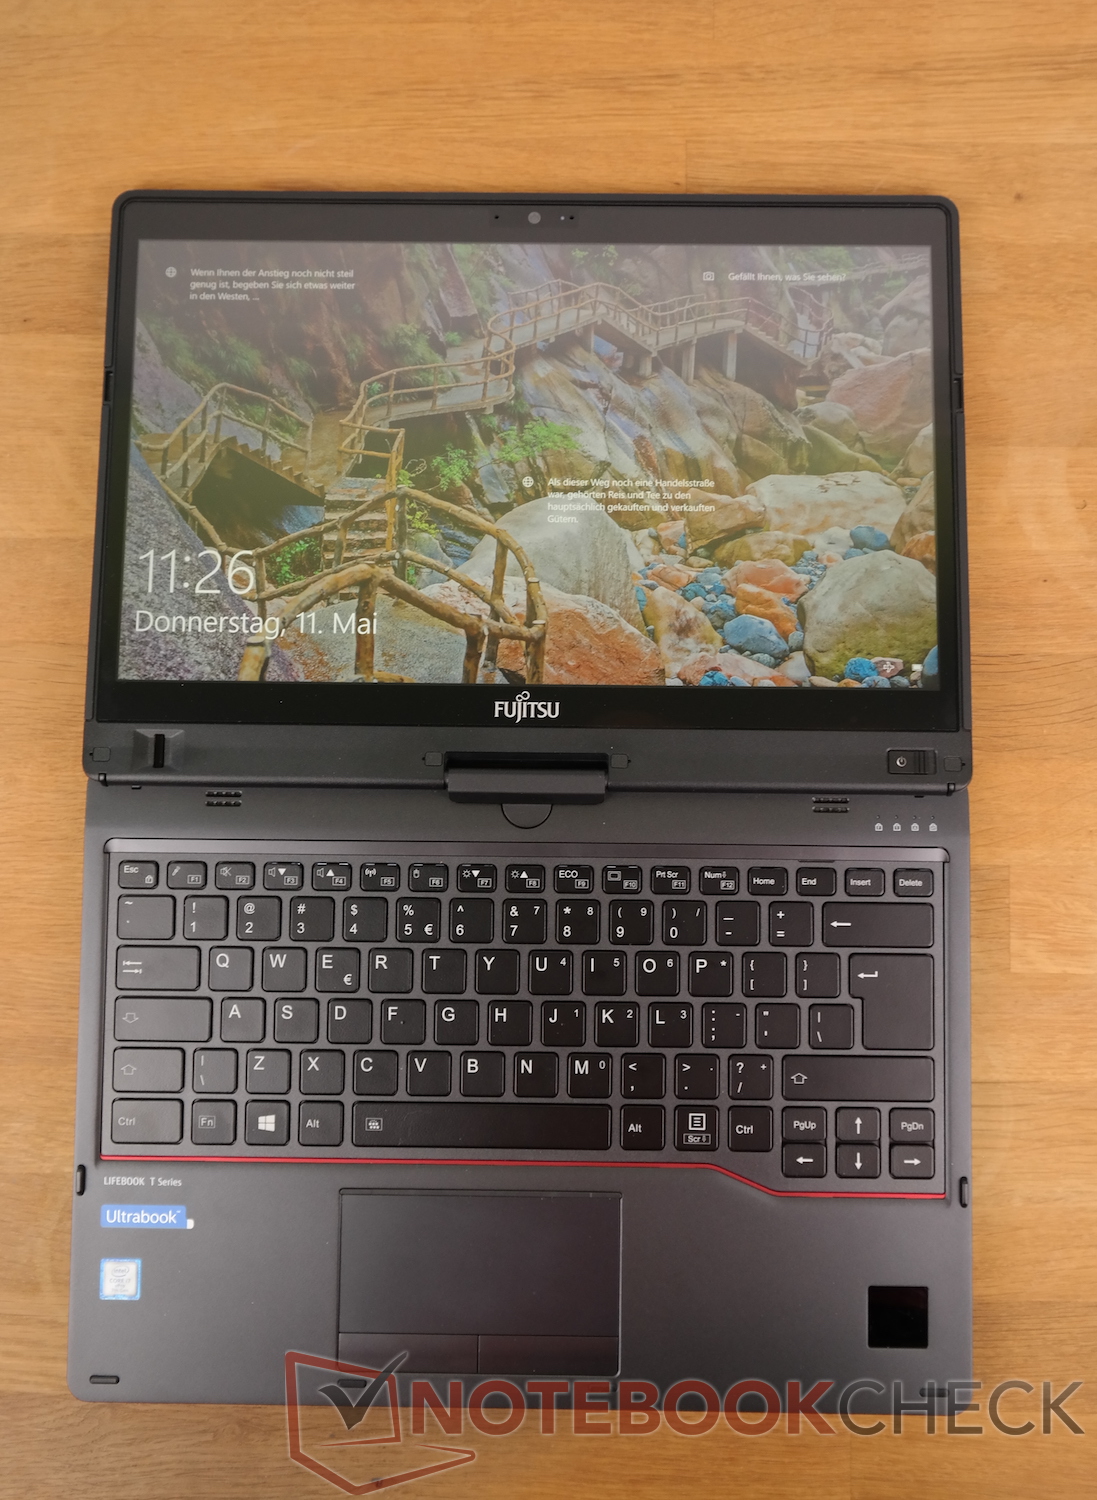
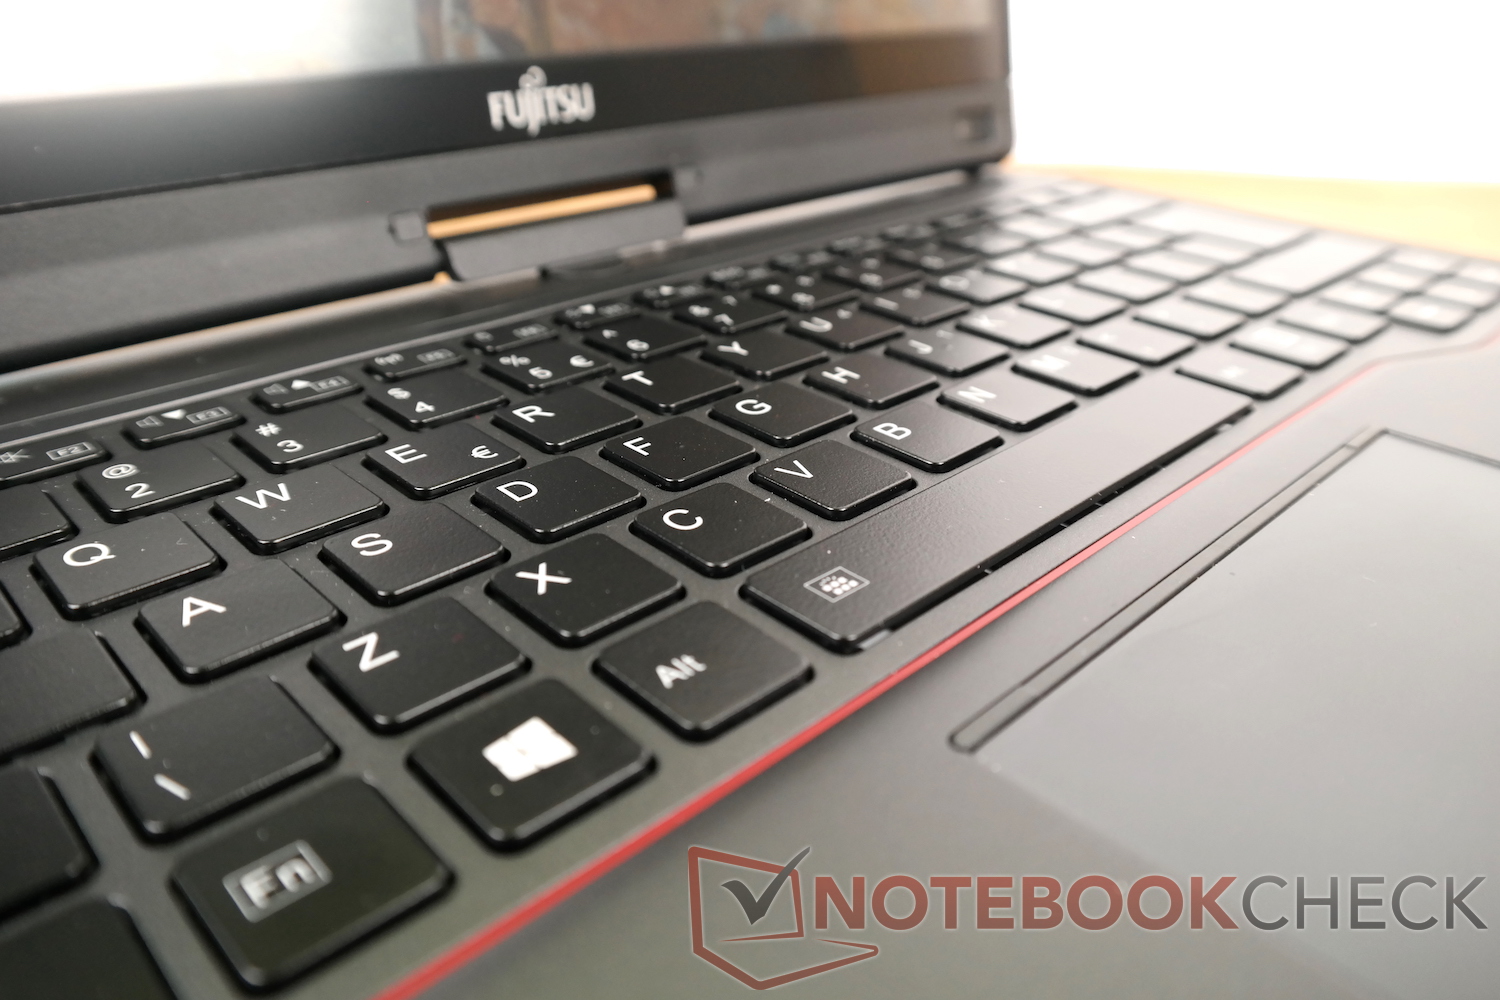
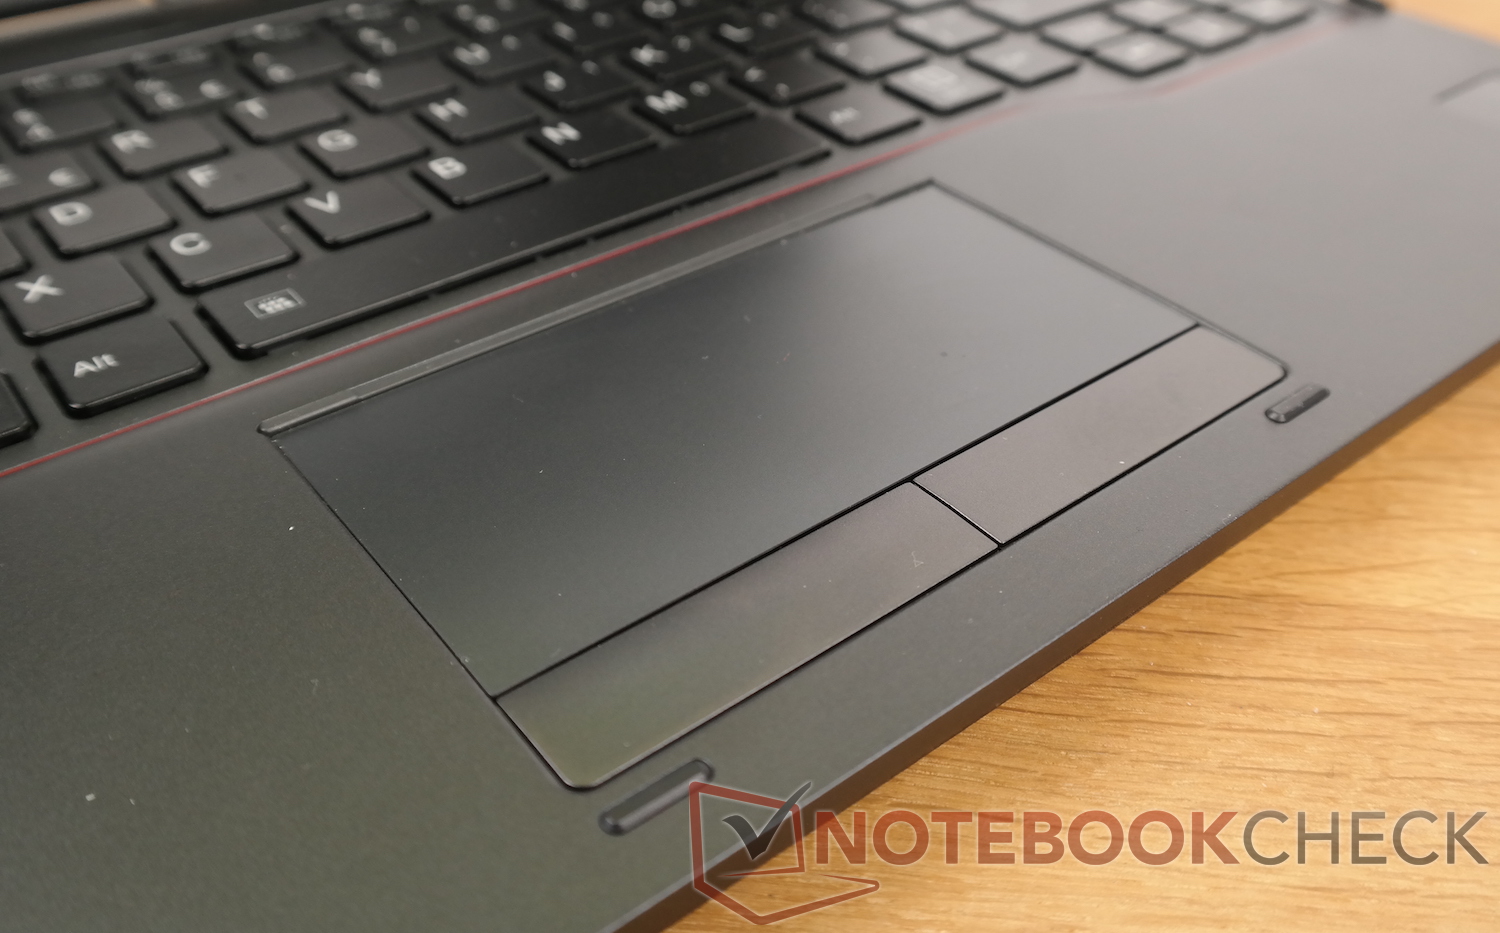
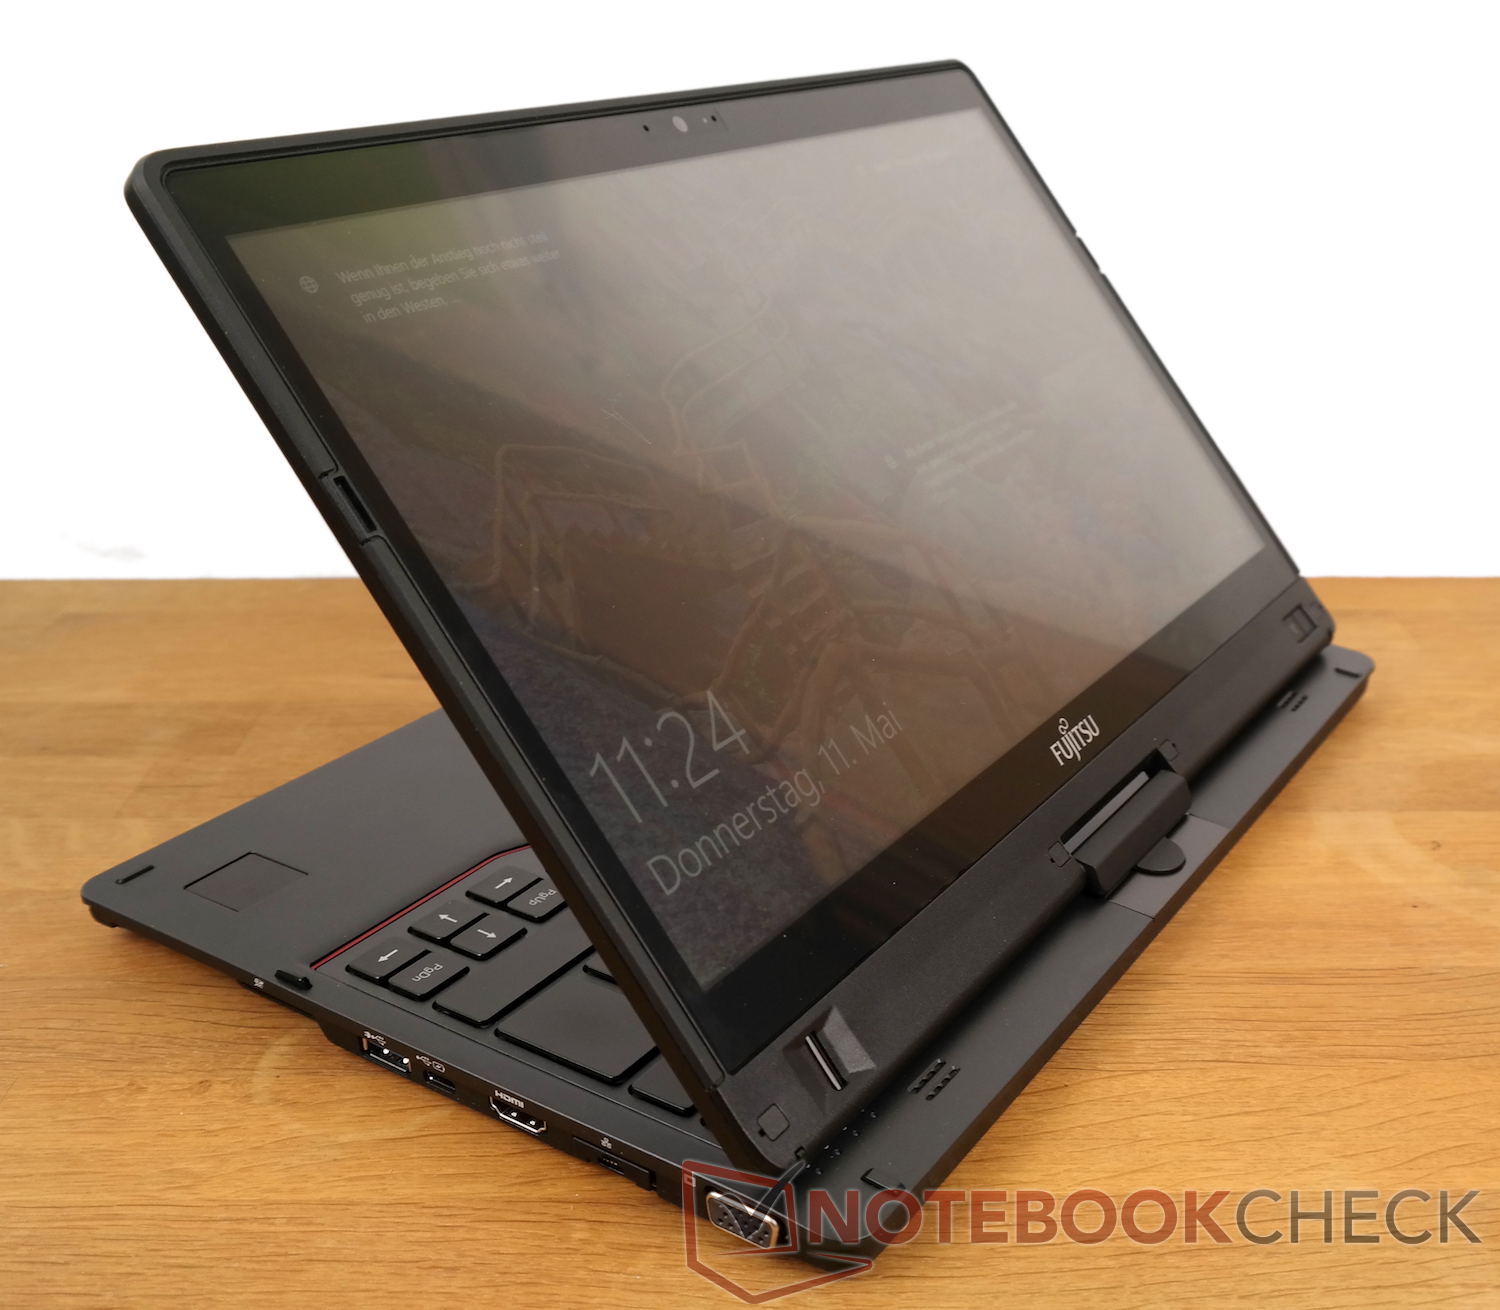
富士通Lifebook T937在测试中给我们的印象一言难尽。虽然它的许多特性都让它可以说是一台十分脚踏实地的优秀笔记本电脑,但仍然存在一些与它价位不相称的弱点。这台设备不仅在基准测试中表现较差,同时还会时常遇到卡顿的情况。除了触控板和旋转屏幕设计显得有些落伍,它仍然可能会适合年长且对价格不太敏感的用户。
这是一台中规中矩的优秀笔记本电脑,但它有一些让人感到遗憾的弱点。
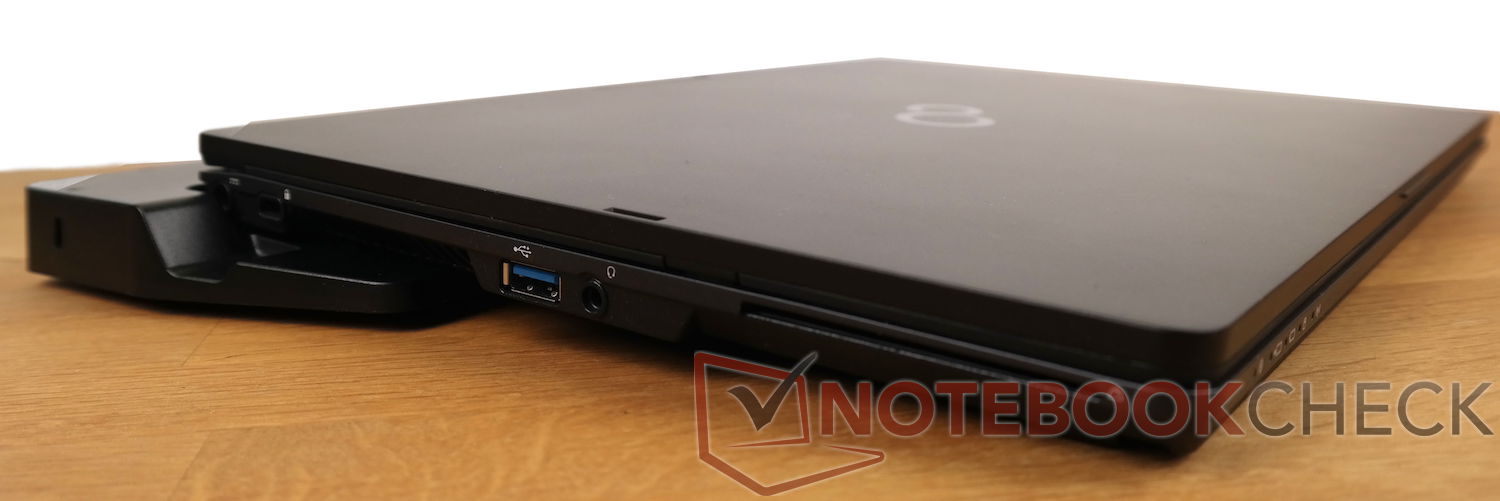
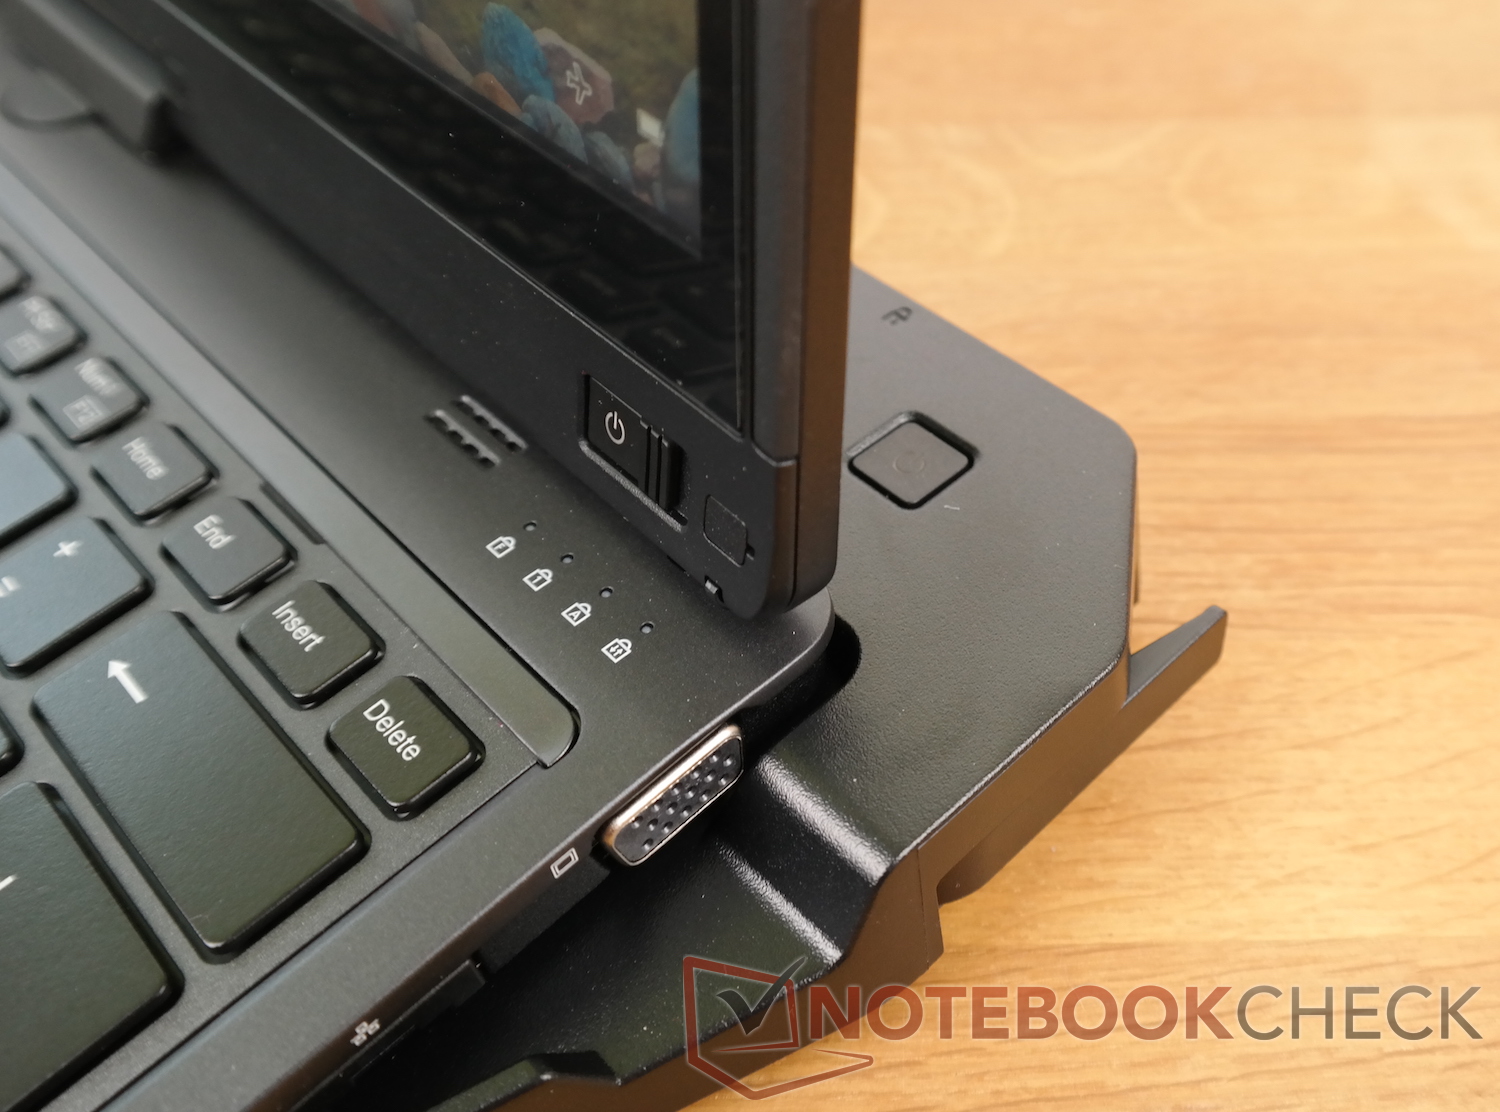
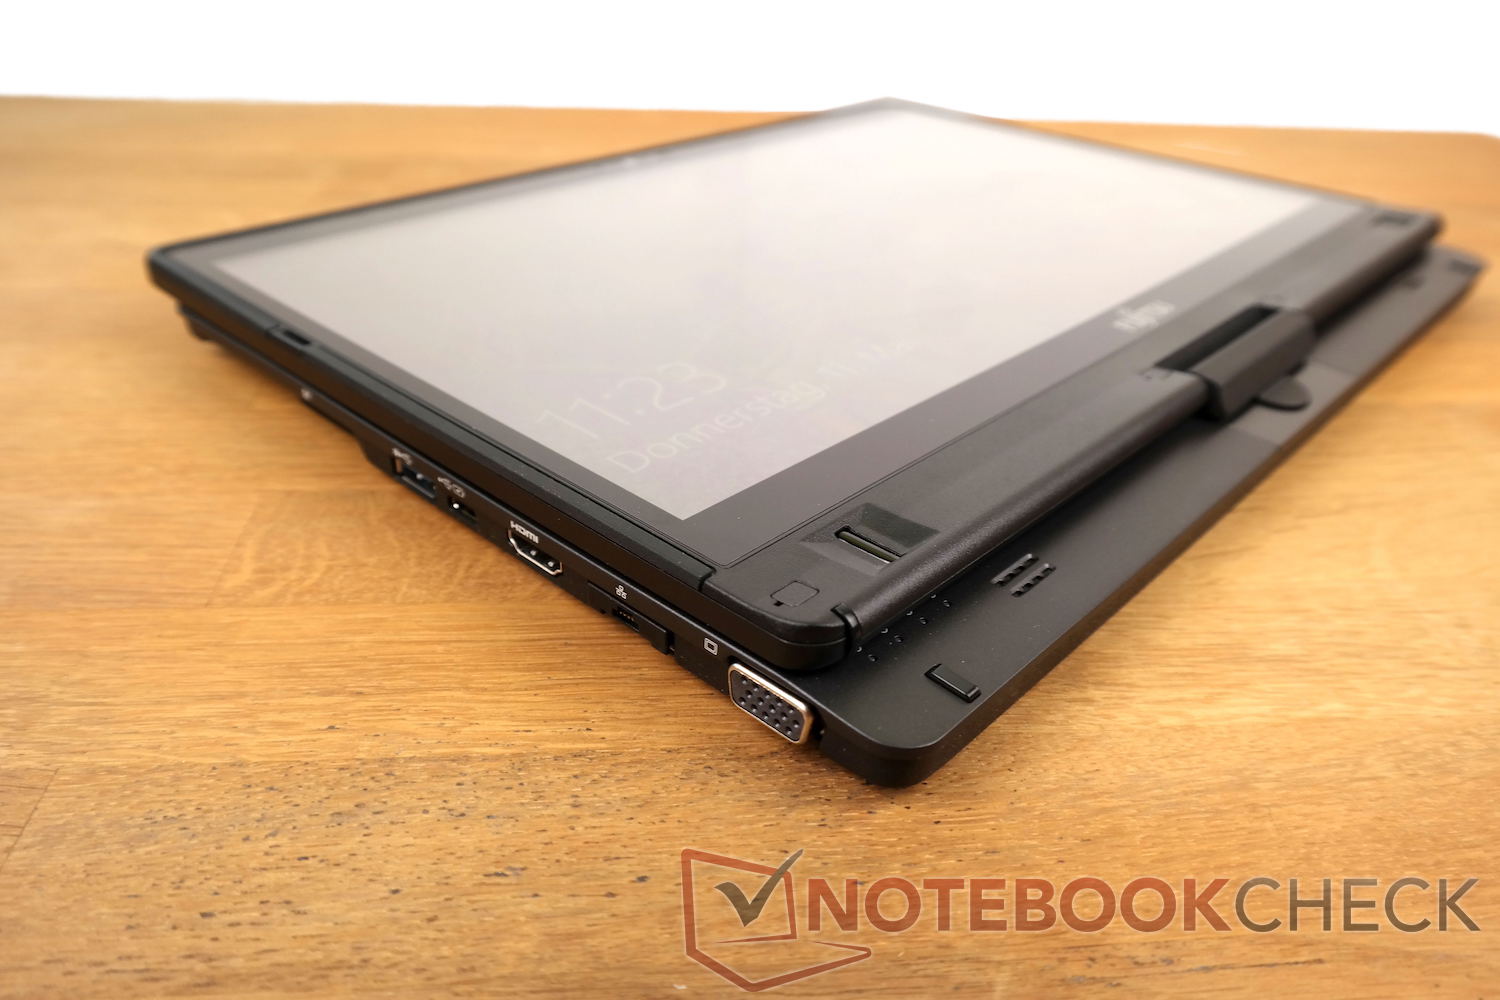
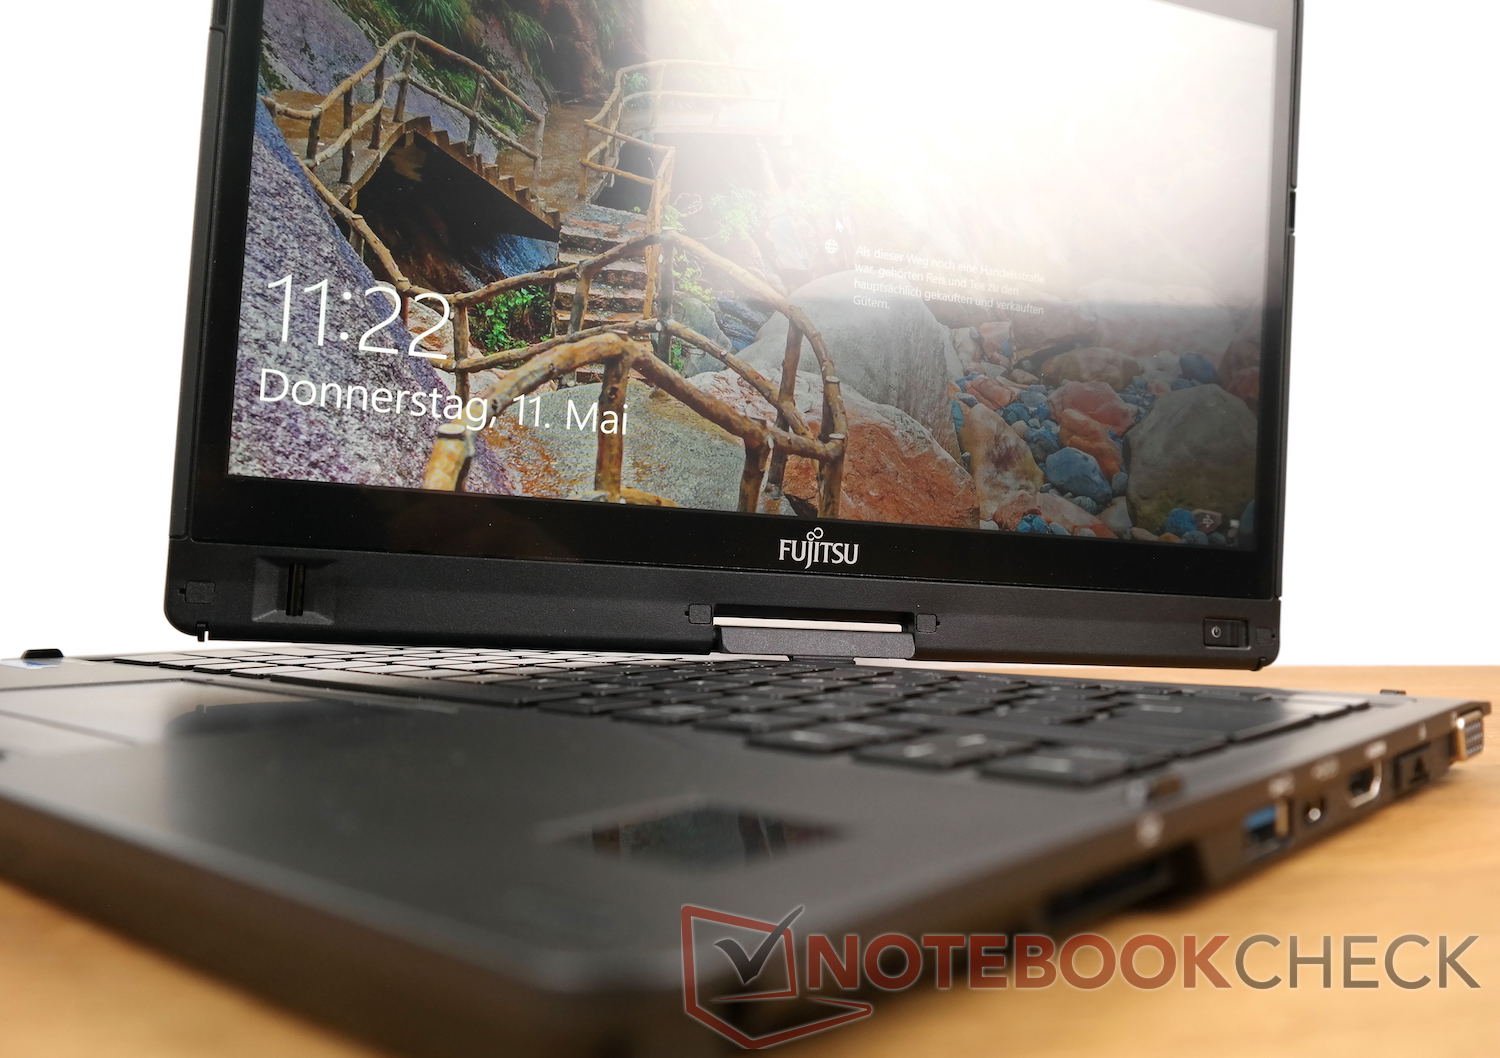
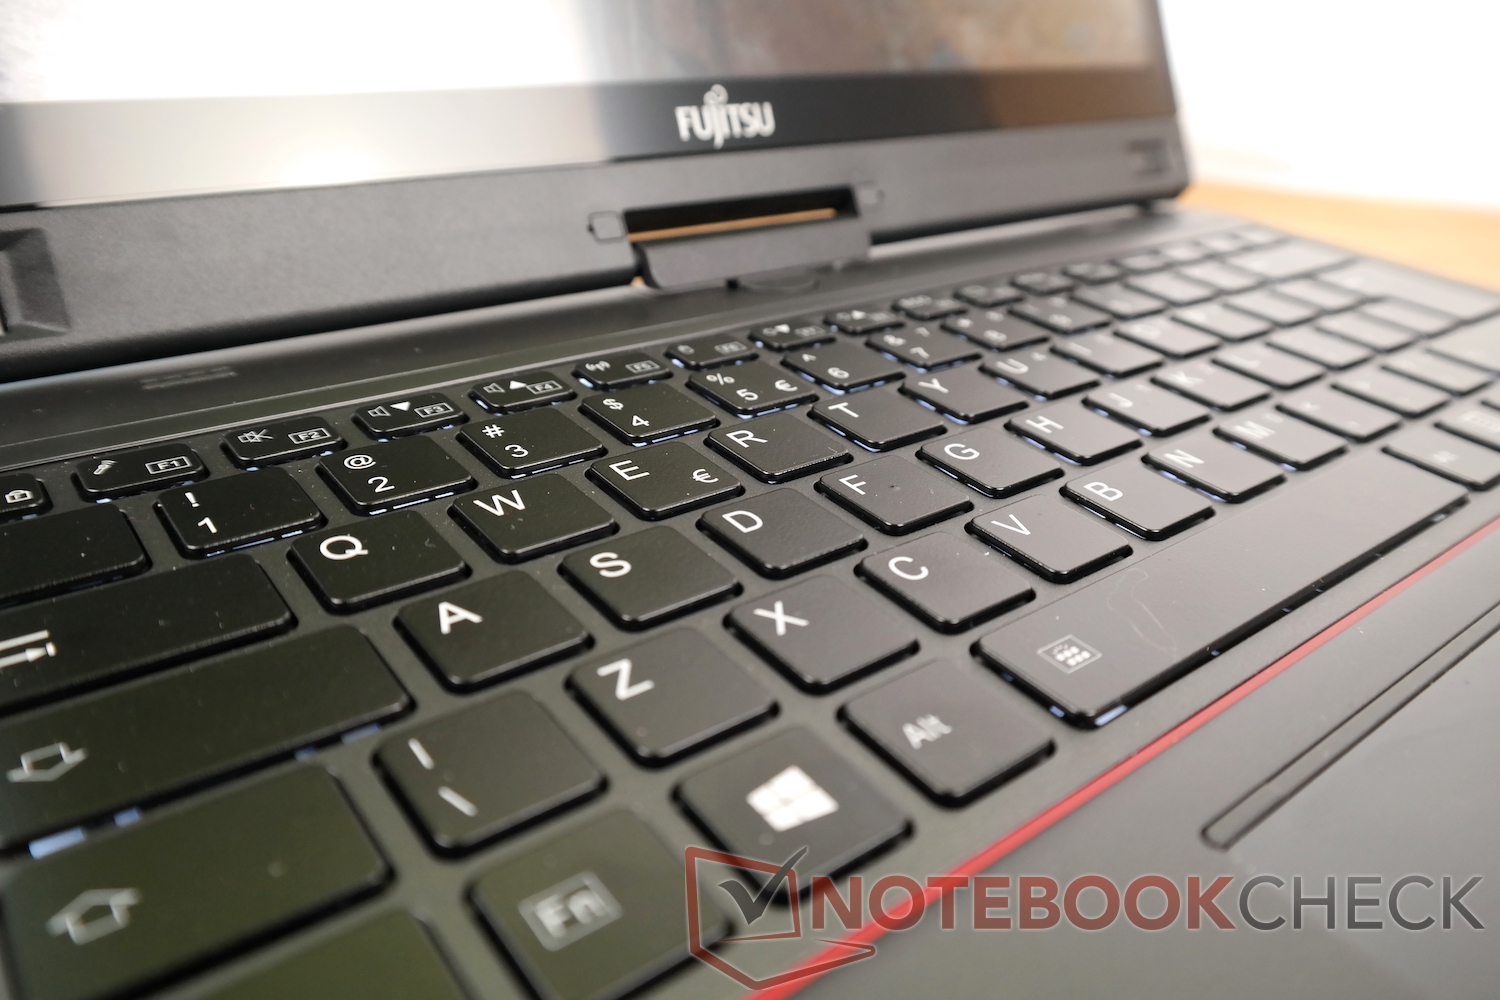
除了较为昏暗的屏幕和较差的测试成绩,它几乎无懈可击:坚固精致的机身,优秀的电池续航,丰富的接口和输入设备,同时也支持多种配件。如果你觉得它物有所值的话,仍然可以考虑选择这款设备。
注:本文是基于完整评测的缩减版本,阅读完整的英文评测,请点击这里。
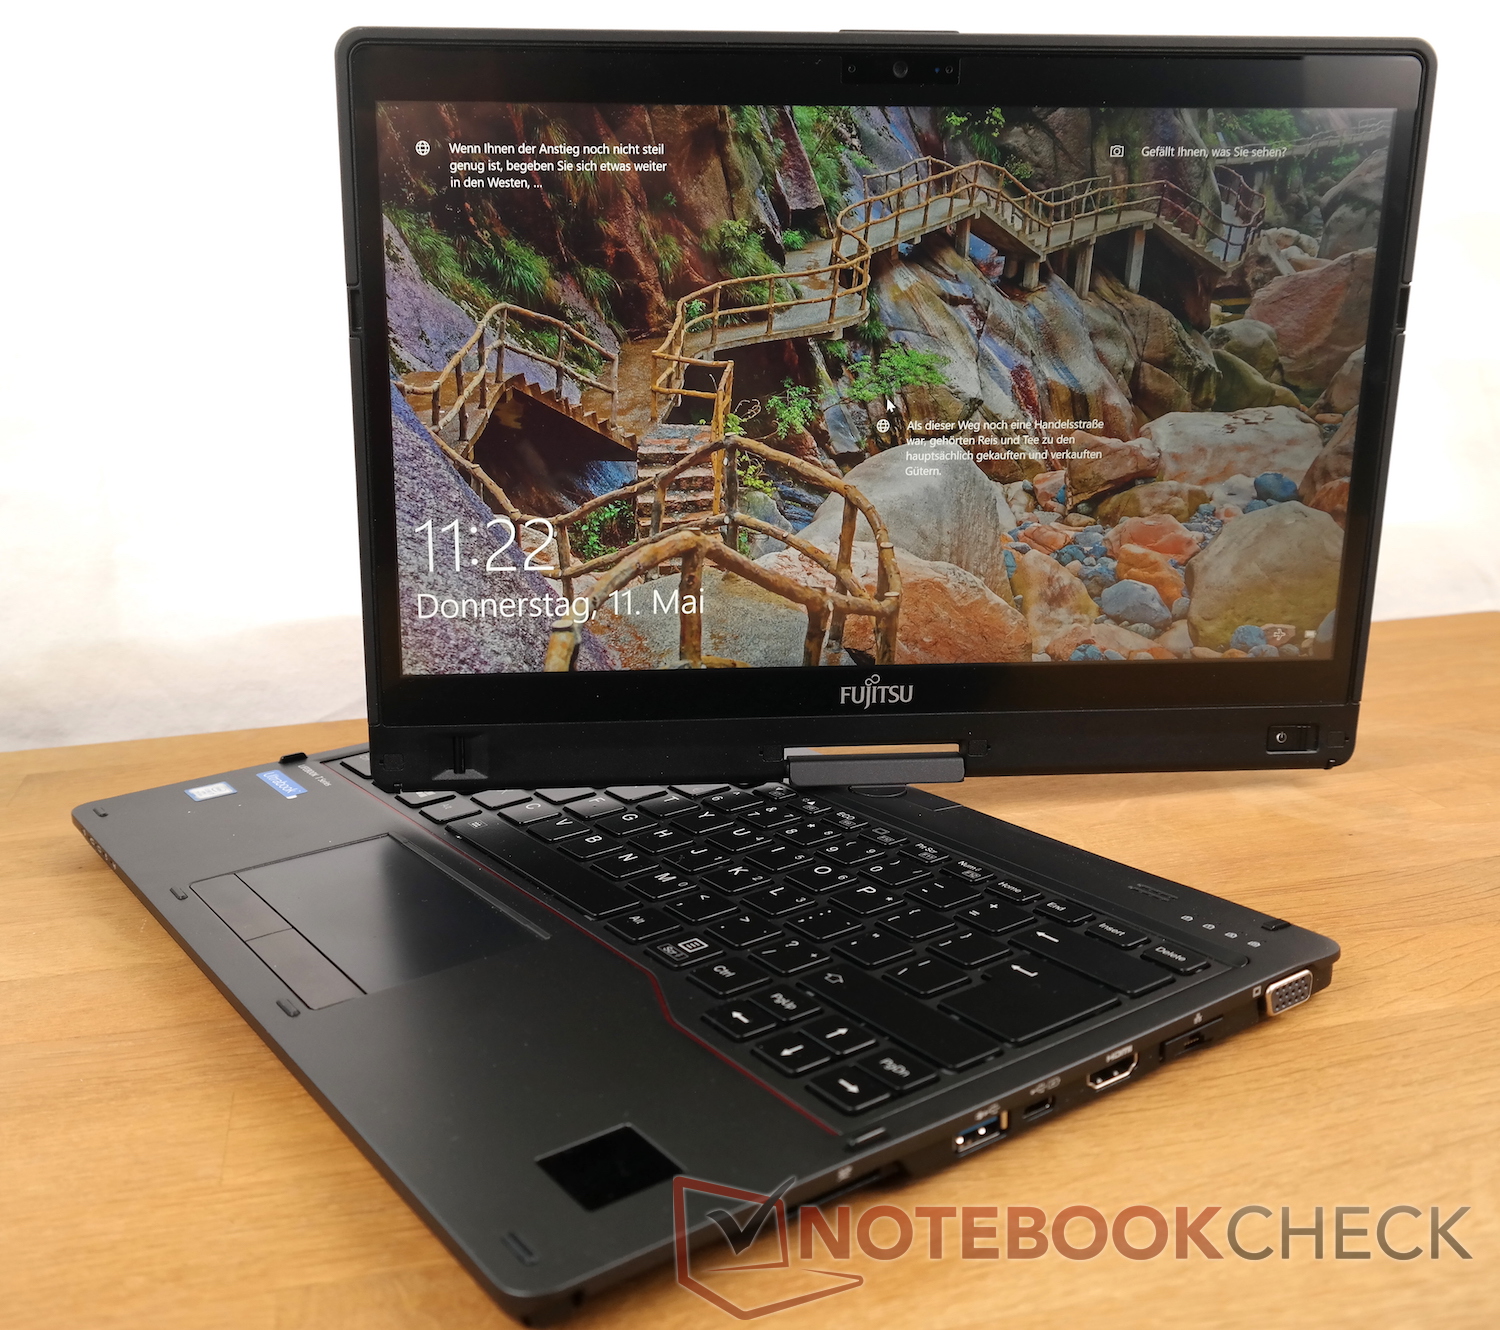
Fujitsu Lifebook T937
- 11/13/2017 v6 (old)
Florian Schaar