惠普 EliteBook x360 1030 G2 (Core i5, 全高清) 变形本简短评测


| Networking | |
| iperf3 transmit AX12 | |
| Lenovo ThinkPad X1 Carbon 2017-20HQS03P00 | |
| Lenovo ThinkPad Yoga 370-20JJS00100 | |
| HP EliteBook x360 1030 G2 | |
| iperf3 receive AX12 | |
| Lenovo ThinkPad Yoga 370-20JJS00100 | |
| Lenovo ThinkPad X1 Carbon 2017-20HQS03P00 | |
| HP EliteBook x360 1030 G2 | |
| |||||||||||||||||||||||||
Brightness Distribution: 83 %
Center on Battery: 261 cd/m²
Contrast: 1048:1 (Black: 0.25 cd/m²)
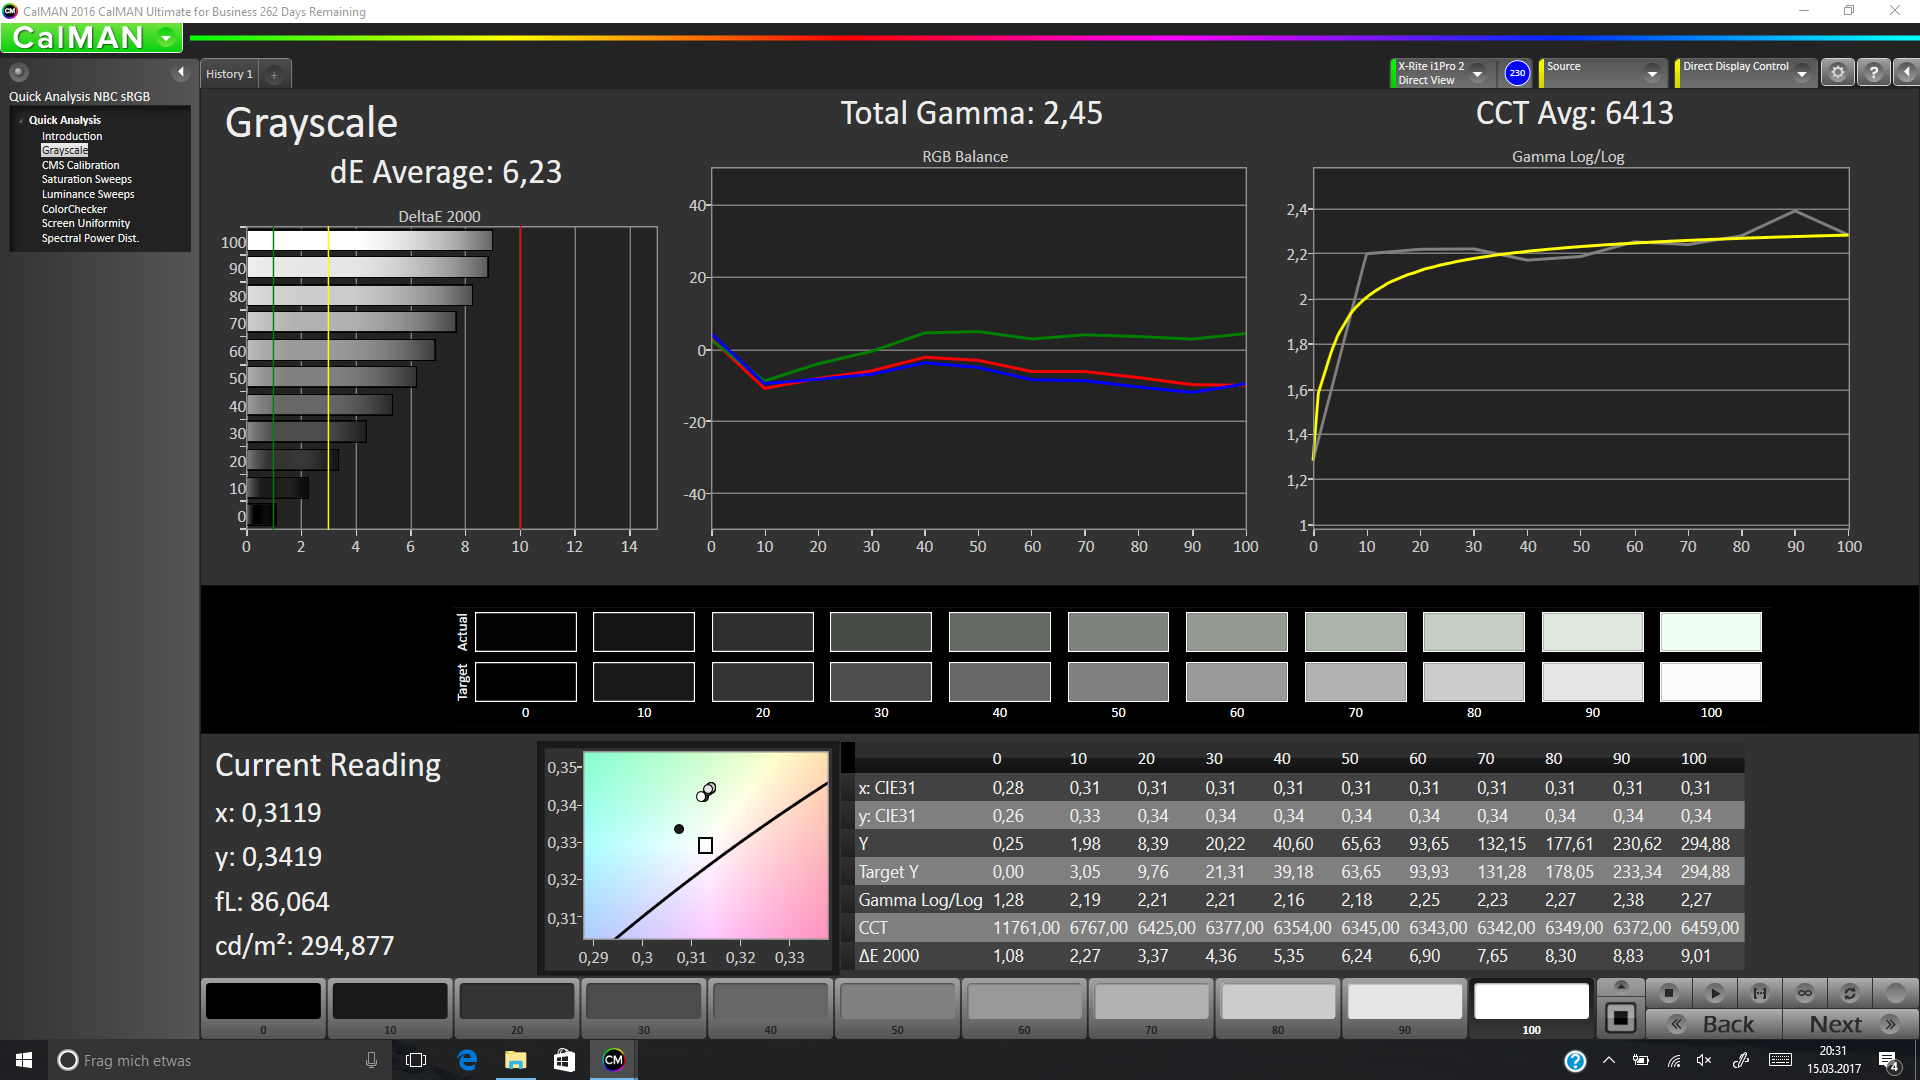
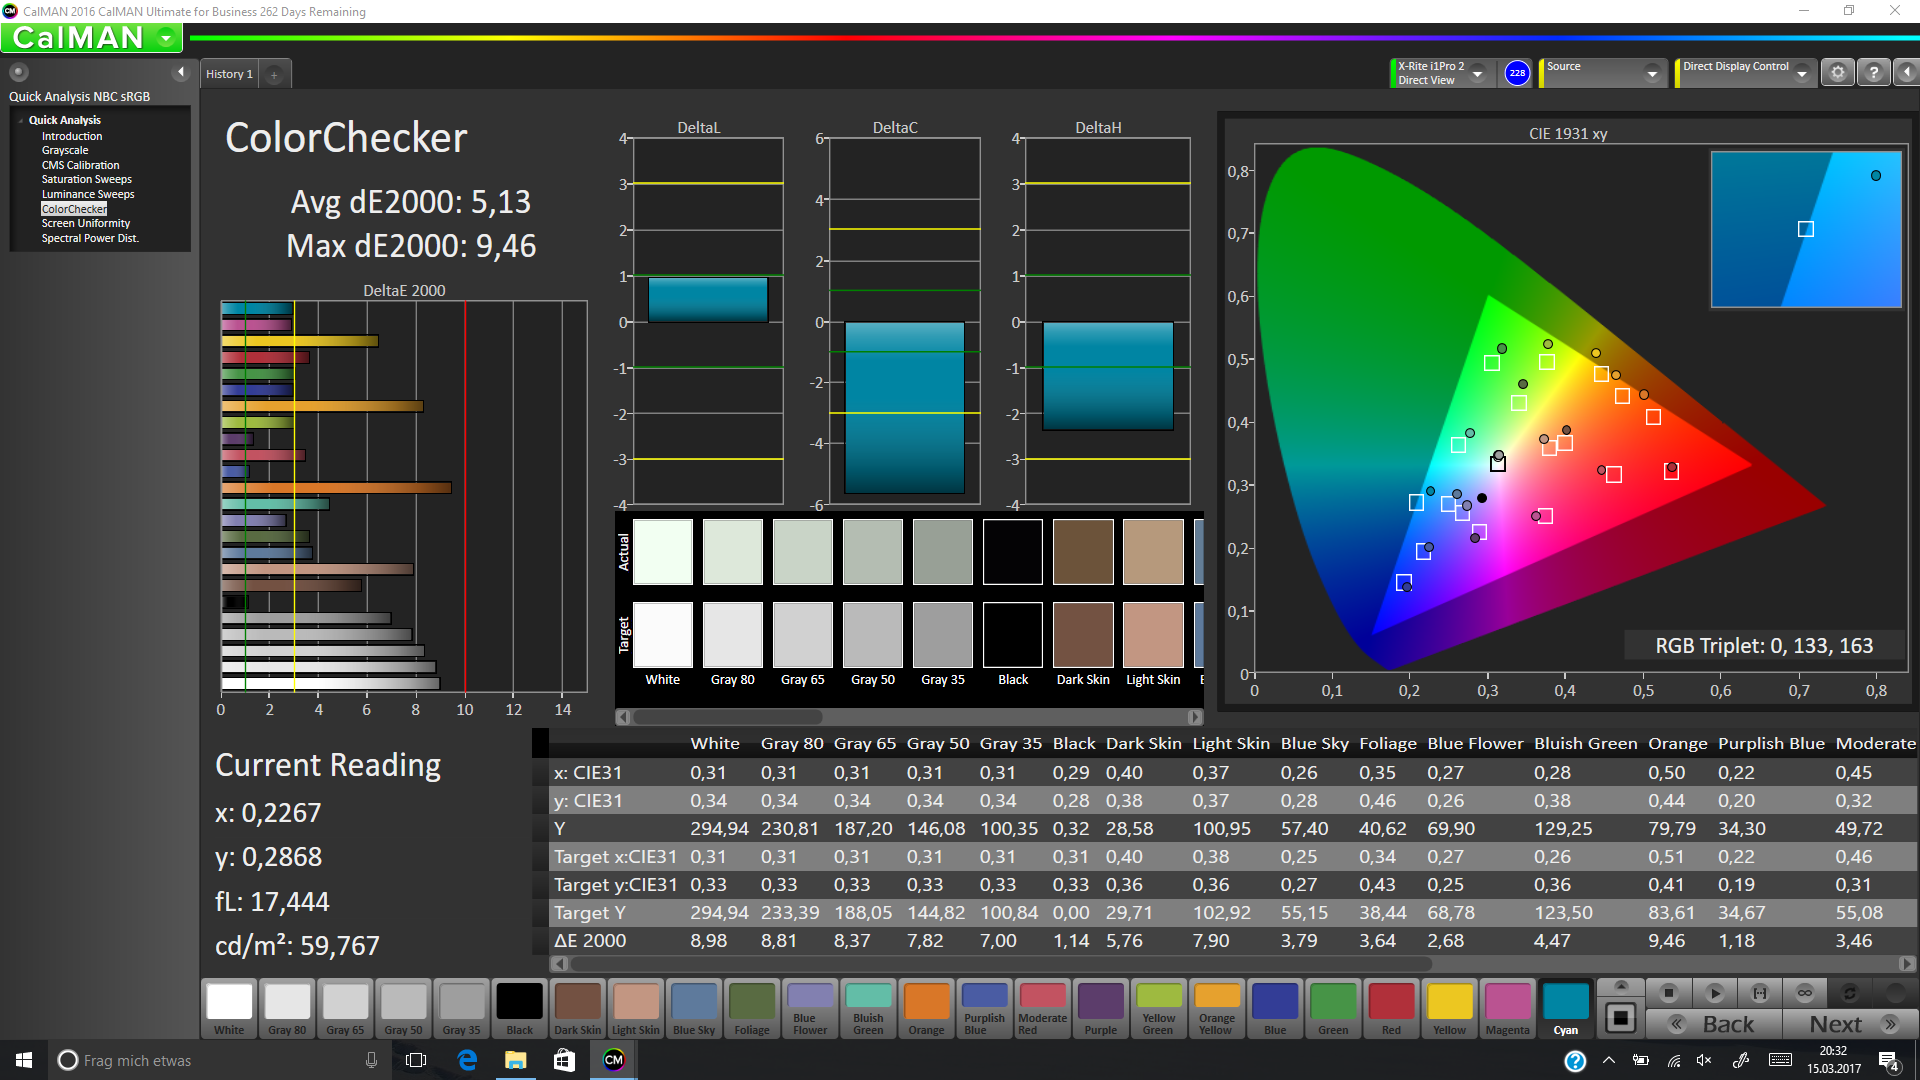
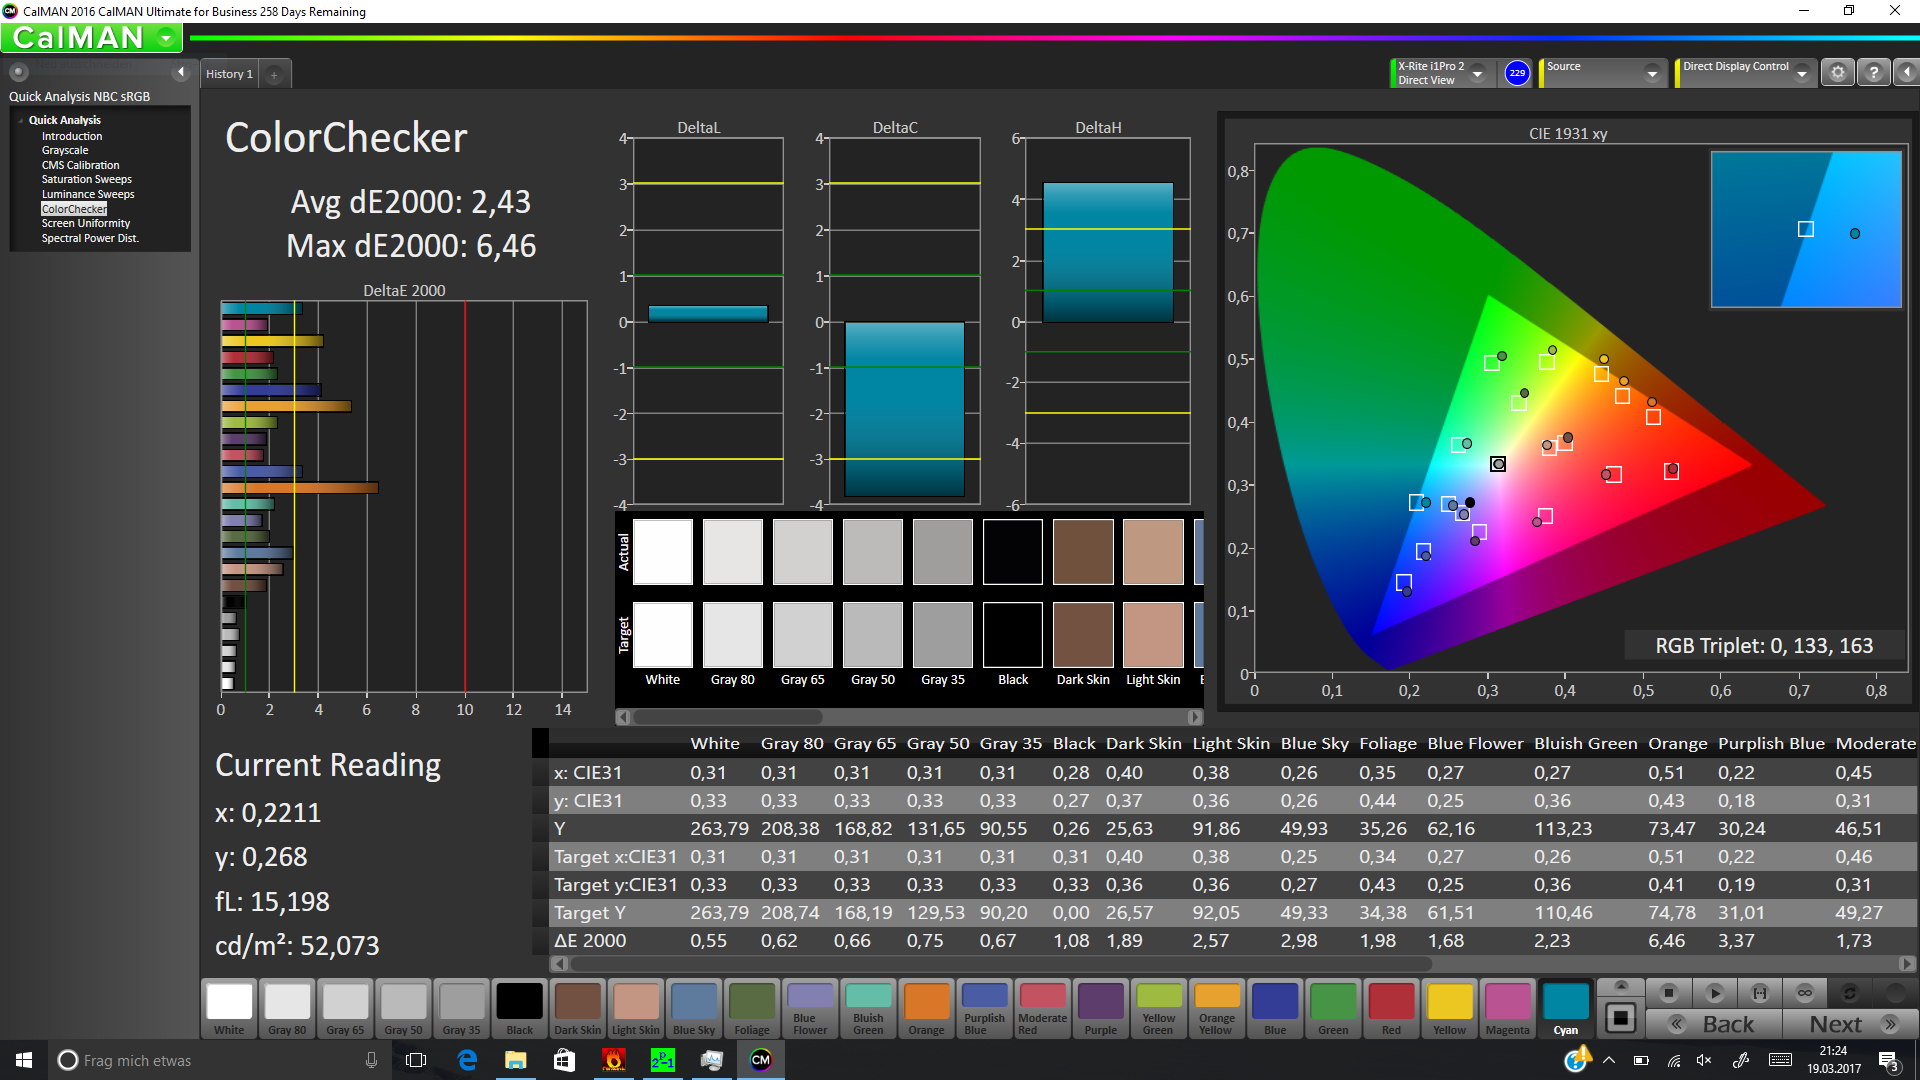
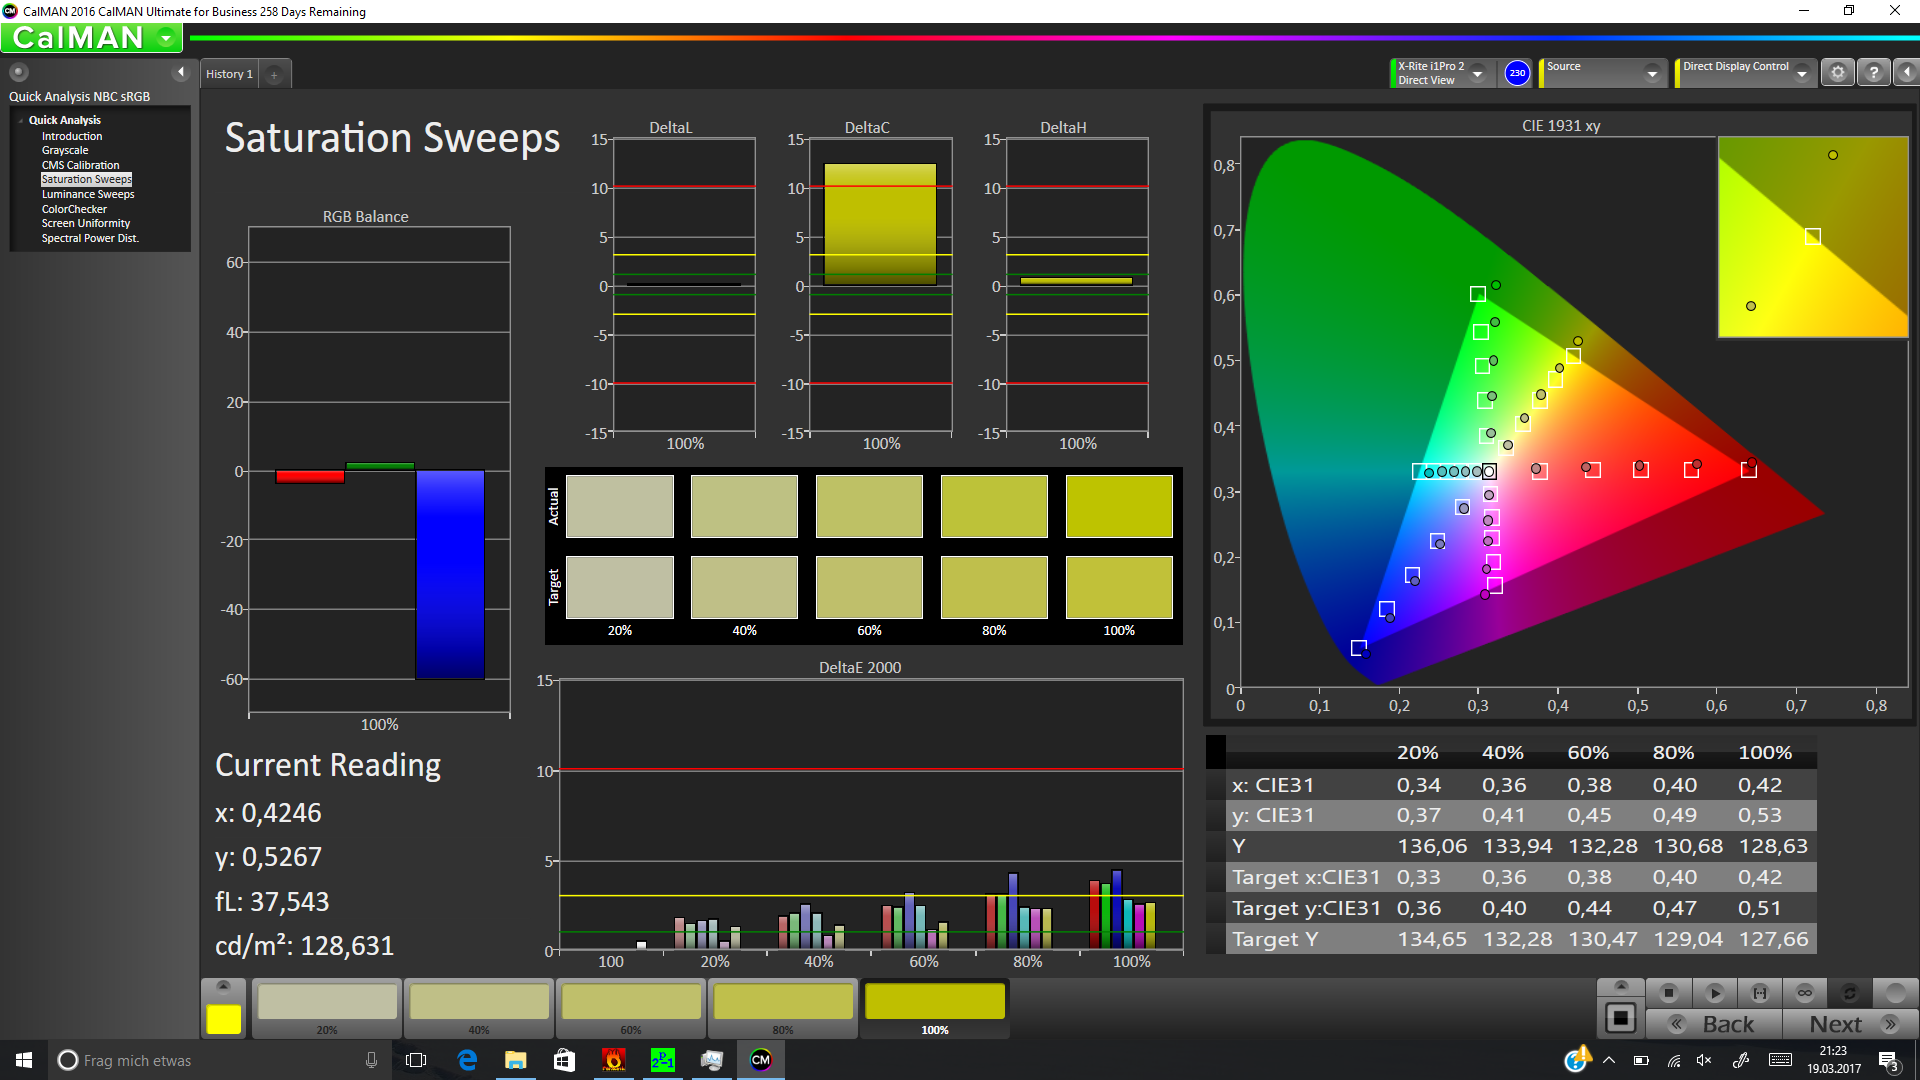
ΔE ColorChecker Calman: 5.13 | ∀{0.5-29.43 Ø4.71}
ΔE Greyscale Calman: 6.23 | ∀{0.09-98 Ø4.96}
88.57% sRGB (Argyll 1.6.3 3D)
57.84% AdobeRGB 1998 (Argyll 1.6.3 3D)
64.9% AdobeRGB 1998 (Argyll 3D)
88.8% sRGB (Argyll 3D)
65.5% Display P3 (Argyll 3D)
Gamma: 2.45
CCT: 6413 K
| HP EliteBook x360 1030 G2 CMN1374, 1920x1080, 13.3" | Lenovo Yoga 910-13IKB-80VF004CGE AU Optronics AUO323D / B139HAN03.2, 3840x2160, 13.9" | Lenovo ThinkPad X1 Yoga-20FRS1VS00 Samsung ATNA40JU01-0, 2560x1440, 14" | Lenovo ThinkPad X1 Carbon 2017-20HQS03P00 B140HAN03_1, 1920x1080, 14" | Dell Latitude 13 7370 Sharp LQ133M1, 1920x1080, 13.3" | HP Spectre x360 13-w023dx Chi Mei CMN1367, 1920x1080, 13.3" | Lenovo ThinkPad Yoga 370-20JJS00100 Sharp LQ133M1JX15, 1920x1080, 13.3" | |
|---|---|---|---|---|---|---|---|
| Display | -2% | -4% | -16% | 1% | 7% | ||
| Display P3 Coverage (%) | 65.5 | 62.2 -5% | 61.4 -6% | 52.2 -20% | 65.4 0% | 67.9 4% | |
| sRGB Coverage (%) | 88.8 | 90.1 1% | 85.9 -3% | 78.3 -12% | 90.4 2% | 97.3 10% | |
| AdobeRGB 1998 Coverage (%) | 64.9 | 63.5 -2% | 62.4 -4% | 53.9 -17% | 65.8 1% | 69.9 8% | |
| Response Times | 15% | 97% | 5% | -8% | 19% | 2% | |
| Response Time Grey 50% / Grey 80% * (ms) | 55.2 ? | 46 ? 17% | 1 ? 98% | 41.6 ? 25% | 50.4 ? 9% | 33.2 ? 40% | 42 ? 24% |
| Response Time Black / White * (ms) | 27.2 ? | 24 ? 12% | 1 ? 96% | 31.6 ? -16% | 33.6 ? -24% | 28 ? -3% | 32.8 ? -21% |
| PWM Frequency (Hz) | 240 ? | 217.4 ? | |||||
| Screen | -4% | 16% | 5% | -1% | -5% | 9% | |
| Brightness middle (cd/m²) | 262 | 348 33% | 279 6% | 311 19% | 261 0% | 334.6 28% | 374 43% |
| Brightness (cd/m²) | 256 | 310 21% | 277 8% | 288 13% | 241 -6% | 319 25% | 356 39% |
| Brightness Distribution (%) | 83 | 80 -4% | 91 10% | 85 2% | 85 2% | 90 8% | 87 5% |
| Black Level * (cd/m²) | 0.25 | 0.25 -0% | 0.24 4% | 0.26 -4% | 0.336 -34% | 0.33 -32% | |
| Contrast (:1) | 1048 | 1392 33% | 1296 24% | 1004 -4% | 996 -5% | 1133 8% | |
| Colorchecker dE 2000 * | 5.13 | 7.86 -53% | 5.15 -0% | 5.5 -7% | 4.3 16% | 6.21 -21% | 4.7 8% |
| Colorchecker dE 2000 max. * | 9.46 | 13.43 -42% | 8.28 12% | 9 5% | 8.66 8% | 12 -27% | 9.5 -0% |
| Greyscale dE 2000 * | 6.23 | 8.25 -32% | 5.44 13% | 6.2 -0% | 5.82 7% | 7.71 -24% | 6.5 -4% |
| Gamma | 2.45 90% | 2.05 107% | 2.28 96% | 2.02 109% | 2.44 90% | 2.36 93% | 2.19 100% |
| CCT | 6413 101% | 6834 95% | 5686 114% | 5950 109% | 6771 96% | 6458 101% | 7086 92% |
| Color Space (Percent of AdobeRGB 1998) (%) | 57.84 | 58 0% | 98 69% | 55.96 -3% | 49.18 -15% | 58.6 1% | 63.1 9% |
| Color Space (Percent of sRGB) (%) | 88.57 | 90 2% | 100 13% | 85.77 -3% | 77.84 -12% | 90 2% | 97.2 10% |
| Total Average (Program / Settings) | 3% /
-1% | 57% /
33% | 2% /
3% | -8% /
-5% | 5% /
-0% | 6% /
7% |
* ... smaller is better

Display Response Times
| ↔ Response Time Black to White | ||
|---|---|---|
| 27.2 ms ... rise ↗ and fall ↘ combined | ↗ 7.6 ms rise | 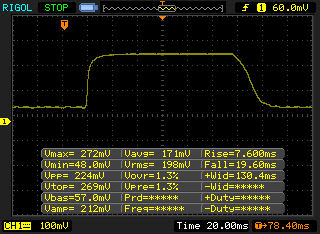 |
| ↘ 19.6 ms fall | ||
| The screen shows relatively slow response rates in our tests and may be too slow for gamers. In comparison, all tested devices range from 0.1 (minimum) to 240 (maximum) ms. » 69 % of all devices are better. This means that the measured response time is worse than the average of all tested devices (19.8 ms). | ||
| ↔ Response Time 50% Grey to 80% Grey | ||
| 55.2 ms ... rise ↗ and fall ↘ combined | ↗ 21.2 ms rise | 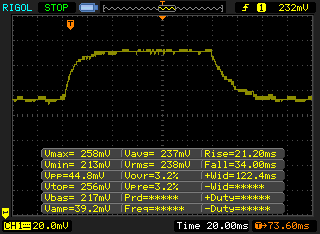 |
| ↘ 34 ms fall | ||
| The screen shows slow response rates in our tests and will be unsatisfactory for gamers. In comparison, all tested devices range from 0.165 (minimum) to 636 (maximum) ms. » 92 % of all devices are better. This means that the measured response time is worse than the average of all tested devices (31 ms). | ||
Screen Flickering / PWM (Pulse-Width Modulation)
| Screen flickering / PWM not detected | ||
In comparison: 52 % of all tested devices do not use PWM to dim the display. If PWM was detected, an average of 7754 (minimum: 5 - maximum: 343500) Hz was measured. | ||
| Cinebench R15 | |
| CPU Single 64Bit | |
| Lenovo Yoga 910-13IKB-80VF004CGE | |
| HP EliteBook x360 1030 G2 | |
| Lenovo ThinkPad X1 Carbon 2017-20HQS03P00 | |
| Lenovo ThinkPad X1 Yoga-20FRS1VS00 | |
| HP Spectre x360 13-w023dx | |
| Lenovo ThinkPad Yoga 370-20JJS00100 | |
| Dell Latitude 13 7370 | |
| CPU Multi 64Bit | |
| Lenovo ThinkPad X1 Carbon 2017-20HQS03P00 | |
| Lenovo Yoga 910-13IKB-80VF004CGE | |
| HP EliteBook x360 1030 G2 | |
| HP Spectre x360 13-w023dx | |
| Lenovo ThinkPad Yoga 370-20JJS00100 | |
| Lenovo ThinkPad X1 Yoga-20FRS1VS00 | |
| Dell Latitude 13 7370 | |
| Cinebench R11.5 | |
| CPU Single 64Bit | |
| HP Spectre x360 13-w023dx | |
| HP EliteBook x360 1030 G2 | |
| Lenovo ThinkPad X1 Yoga-20FRS1VS00 | |
| Dell Latitude 13 7370 | |
| CPU Multi 64Bit | |
| HP EliteBook x360 1030 G2 | |
| HP Spectre x360 13-w023dx | |
| Lenovo ThinkPad X1 Yoga-20FRS1VS00 | |
| Dell Latitude 13 7370 | |
| JetStream 1.1 - 1.1 Total | |
| Lenovo Yoga 910-13IKB-80VF004CGE | |
| Lenovo ThinkPad X1 Carbon 2017-20HQS03P00 | |
| HP EliteBook x360 1030 G2 | |
| Lenovo ThinkPad Yoga 370-20JJS00100 | |
| Lenovo ThinkPad X1 Yoga-20FRS1VS00 | |
| Dell Latitude 13 7370 | |
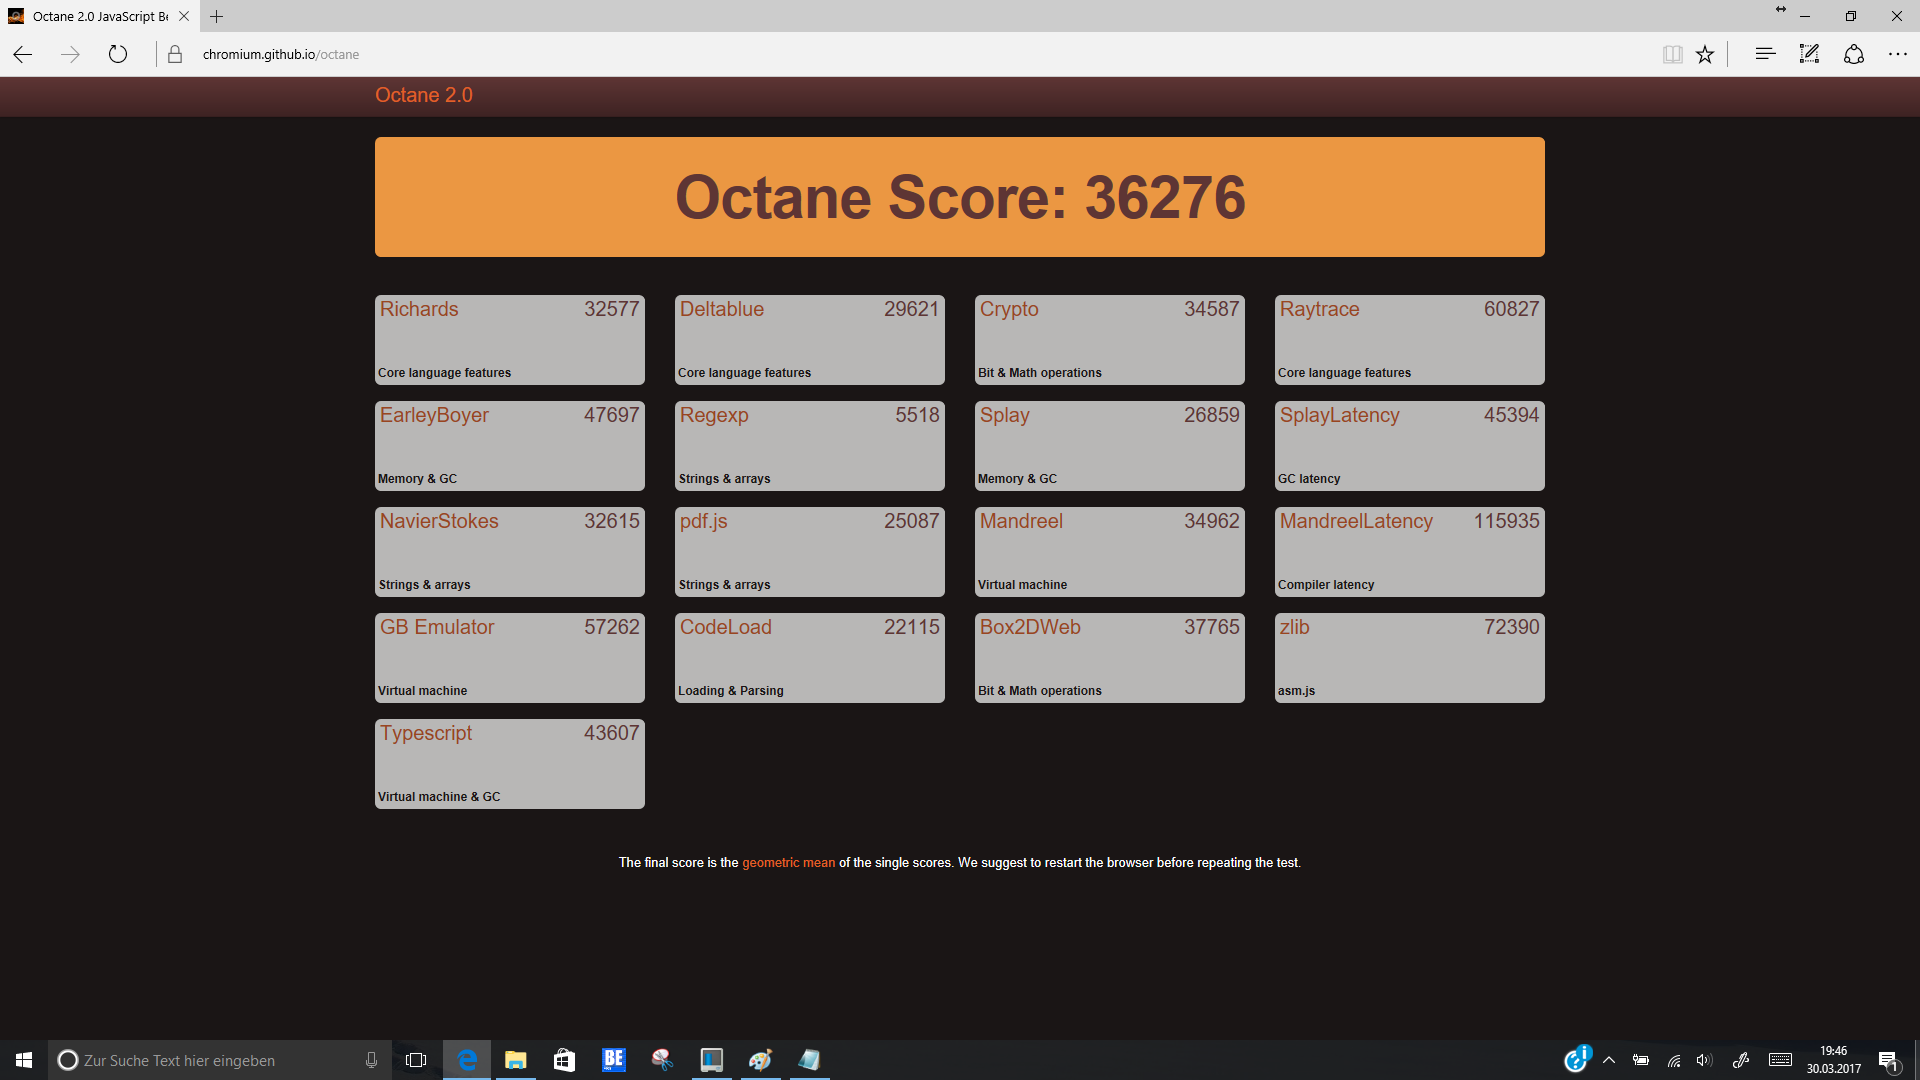
| Octane V2 - Total Score | |
| Lenovo Yoga 910-13IKB-80VF004CGE | |
| HP EliteBook x360 1030 G2 | |
| Lenovo ThinkPad X1 Carbon 2017-20HQS03P00 | |
| Lenovo ThinkPad Yoga 370-20JJS00100 | |
| Lenovo ThinkPad X1 Yoga-20FRS1VS00 | |
| Dell Latitude 13 7370 | |
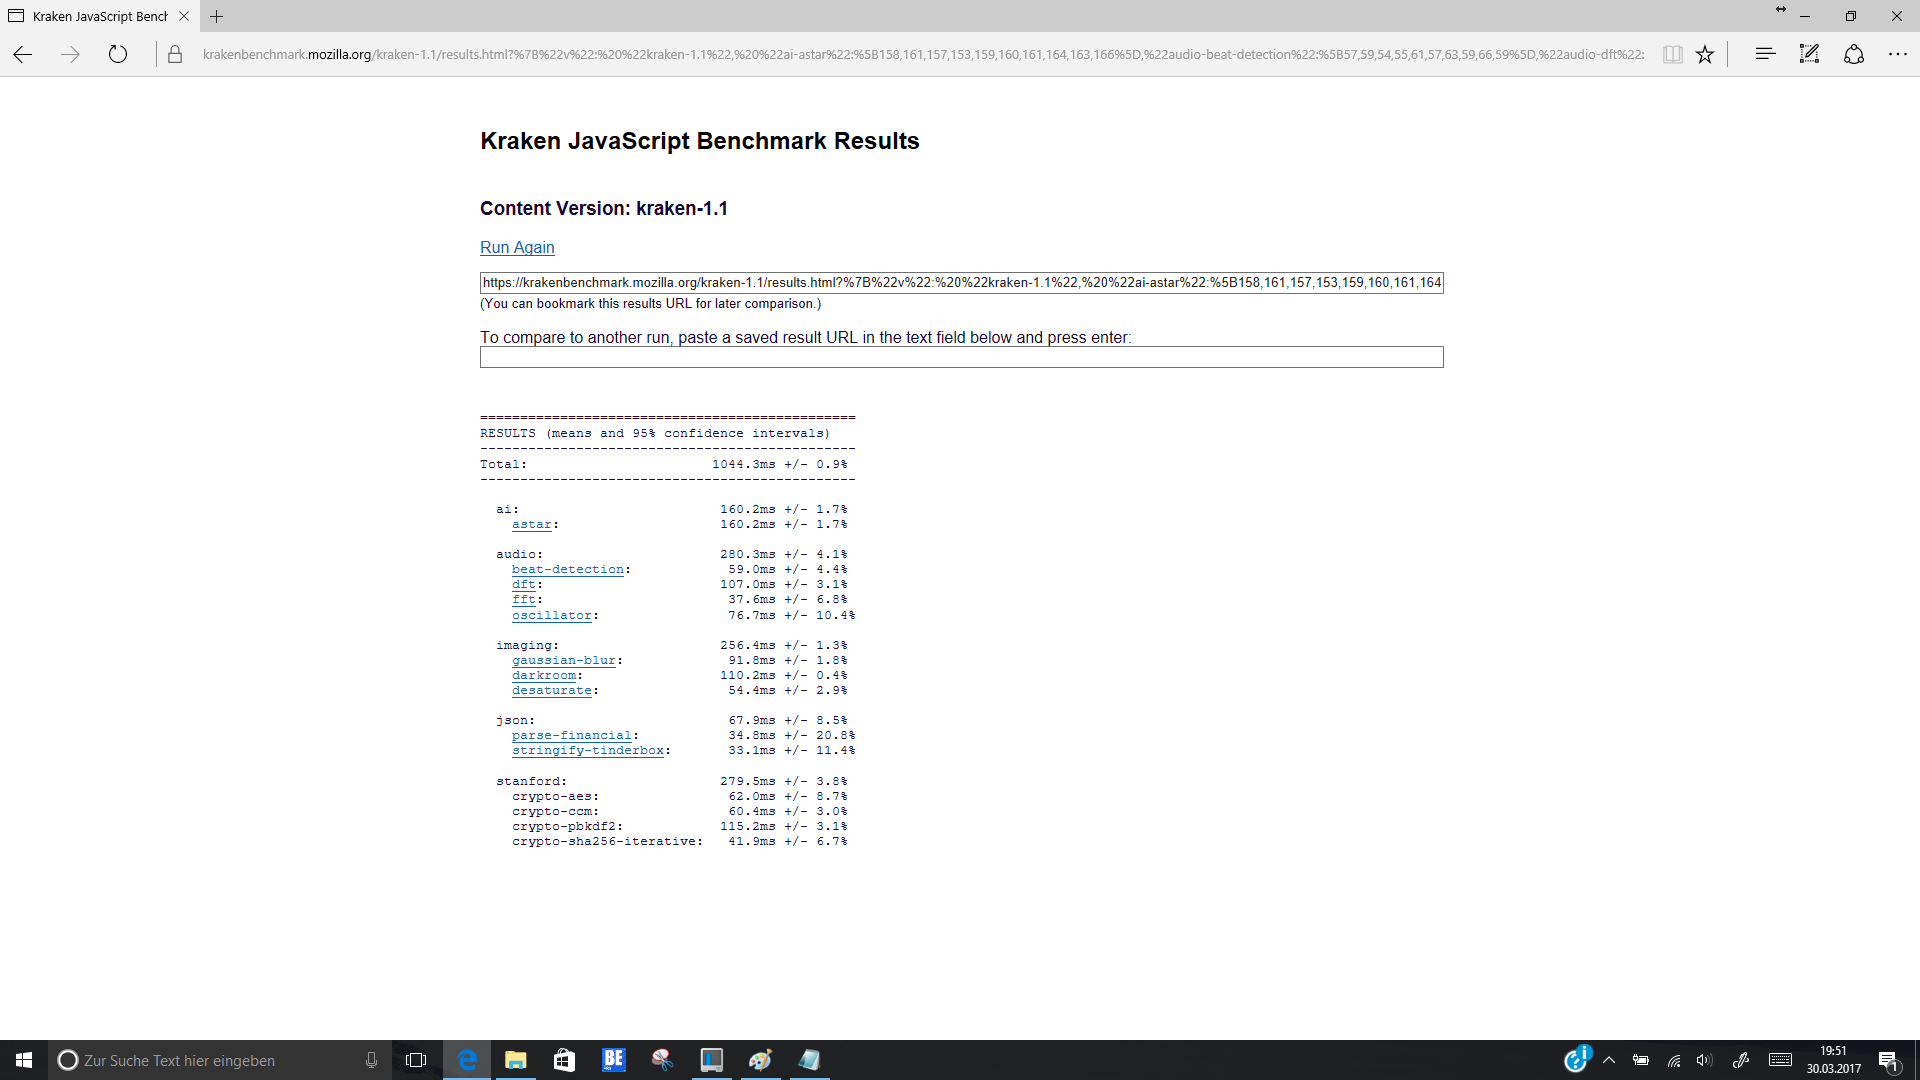
| Mozilla Kraken 1.1 - Total | |
| Dell Latitude 13 7370 | |
| Lenovo ThinkPad X1 Yoga-20FRS1VS00 | |
| Lenovo ThinkPad Yoga 370-20JJS00100 | |
| HP EliteBook x360 1030 G2 | |
| Lenovo ThinkPad X1 Carbon 2017-20HQS03P00 | |
| Lenovo Yoga 910-13IKB-80VF004CGE | |
* ... smaller is better
| PCMark 8 | |
| Home Score Accelerated v2 | |
| Lenovo ThinkPad X1 Carbon 2017-20HQS03P00 | |
| HP Spectre x360 13-w023dx | |
| HP EliteBook x360 1030 G2 | |
| Lenovo Yoga 910-13IKB-80VF004CGE | |
| Lenovo ThinkPad Yoga 370-20JJS00100 | |
| Lenovo ThinkPad X1 Yoga-20FRS1VS00 | |
| Dell Latitude 13 7370 | |
| Work Score Accelerated v2 | |
| Lenovo ThinkPad X1 Carbon 2017-20HQS03P00 | |
| HP Spectre x360 13-w023dx | |
| HP EliteBook x360 1030 G2 | |
| Lenovo ThinkPad X1 Yoga-20FRS1VS00 | |
| Lenovo ThinkPad Yoga 370-20JJS00100 | |
| Dell Latitude 13 7370 | |
| Creative Score Accelerated v2 | |
| Lenovo ThinkPad X1 Carbon 2017-20HQS03P00 | |
| HP EliteBook x360 1030 G2 | |
| HP Spectre x360 13-w023dx | |
| Lenovo ThinkPad Yoga 370-20JJS00100 | |
| Dell Latitude 13 7370 | |
| PCMark 7 | |
| Score | |
| Dell Latitude 13 7370 | |
| Productivity | |
| Dell Latitude 13 7370 | |
| PCMark 8 Home Score Accelerated v2 | 3774 points | |
| PCMark 8 Creative Score Accelerated v2 | 4781 points | |
| PCMark 8 Work Score Accelerated v2 | 4803 points | |
Help | ||
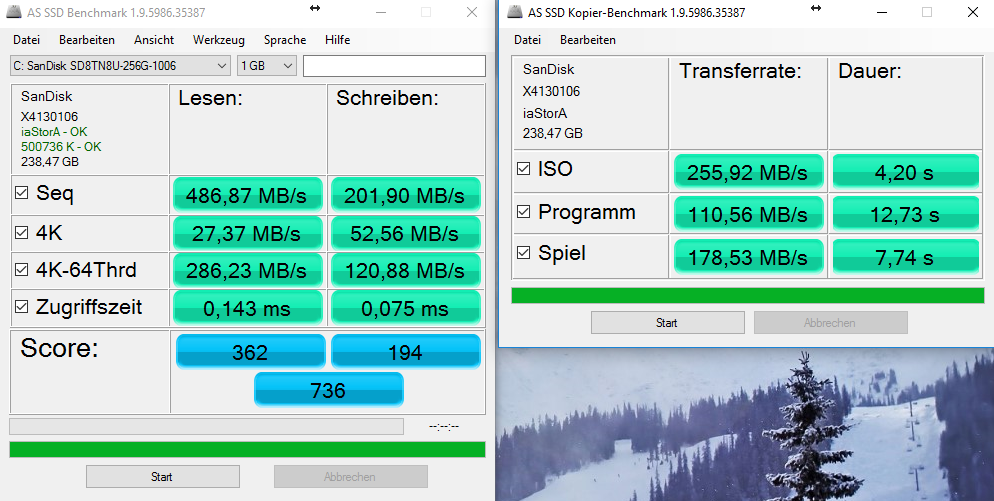
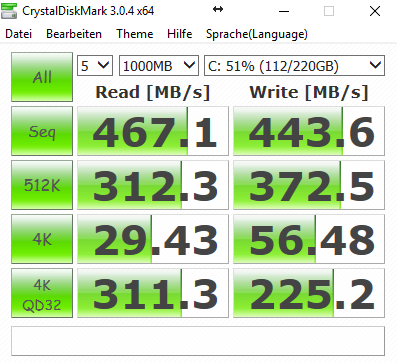
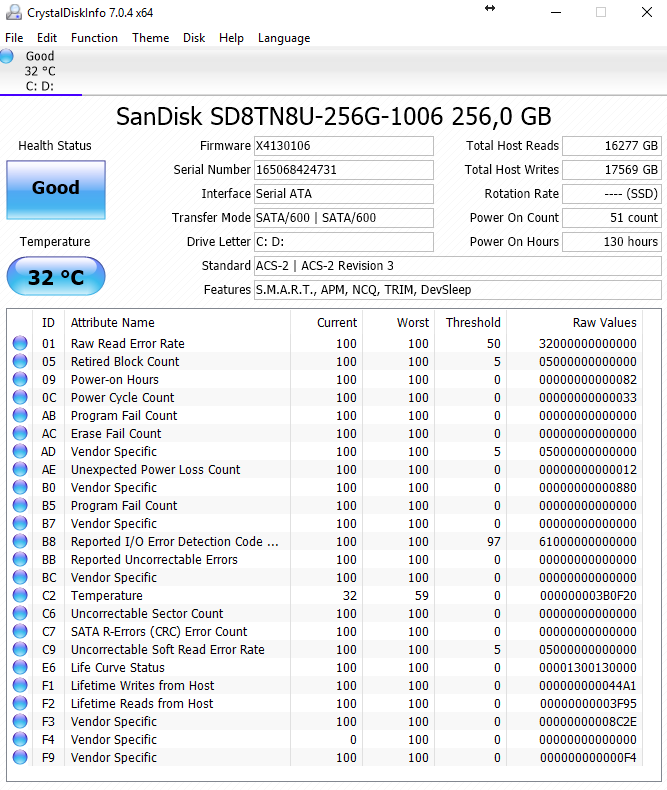
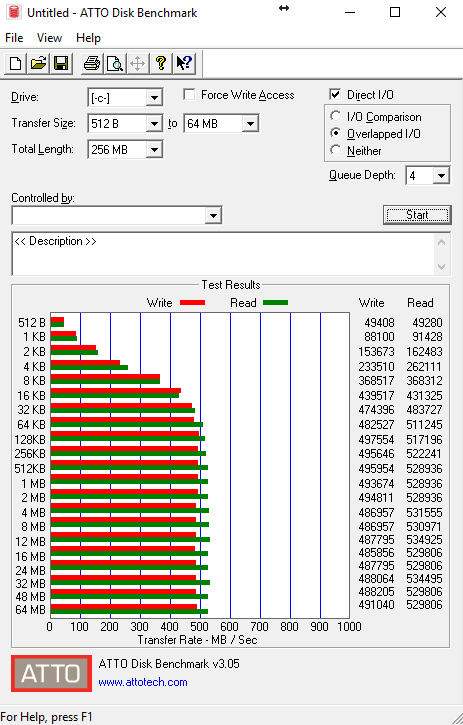
| HP EliteBook x360 1030 G2 Sandisk SD8TN8U-256G-1006 | Lenovo Yoga 910-13IKB-80VF004CGE Samsung PM951 NVMe MZVLV512 | Lenovo ThinkPad X1 Yoga-20FRS1VS00 Samsung SSD PM961 1TB M.2 PCIe 3.0 x4 NVMe (MZSLW1T0) | Lenovo ThinkPad X1 Carbon 2017-20HQS03P00 Samsung PM961 NVMe MZVLW512HMJP | Dell Latitude 13 7370 Toshiba NVMe THNSN5256GPU7 | HP Spectre x360 13-w023dx Samsung PM951 NVMe MZVLV512 | Lenovo ThinkPad Yoga 370-20JJS00100 Toshiba NVMe THNSF5512GPUK | |
|---|---|---|---|---|---|---|---|
| CrystalDiskMark 3.0 | 105% | 102% | 173% | 124% | 89% | 68% | |
| Read Seq (MB/s) | 467.1 | 1412 202% | 1510 223% | 1827 291% | 1354 190% | 1376 195% | 1070 129% |
| Write Seq (MB/s) | 443.6 | 578 30% | 1193 169% | 1383 212% | 1132 155% | 571 29% | 484.5 9% |
| Read 512 (MB/s) | 312.3 | 701 124% | 814 161% | 1140 265% | 679 117% | 680 118% | |
| Write 512 (MB/s) | 372.5 | 580 56% | 1098 195% | 1020 174% | 571 53% | 483.1 30% | |
| Read 4k (MB/s) | 29.43 | 43.5 48% | 37 26% | 61 107% | 42.13 43% | 42.66 45% | 30.55 4% |
| Write 4k (MB/s) | 56.5 | 159.7 183% | 126 123% | 172.2 205% | 105.8 87% | 137.9 144% | 127.3 125% |
| Read 4k QD32 (MB/s) | 311.3 | 570 83% | 404 30% | 601 93% | 400.5 29% | 535 72% | 460.8 48% |
| Write 4k QD32 (MB/s) | 225.2 | 488.7 117% | 319 42% | 495.6 120% | 328.4 46% | 361.2 60% | 414.5 84% |

| 3DMark | |
| 1280x720 Cloud Gate Standard Graphics | |
| Lenovo Yoga 910-13IKB-80VF004CGE | |
| Lenovo ThinkPad X1 Carbon 2017-20HQS03P00 | |
| HP EliteBook x360 1030 G2 | |
| HP Spectre x360 13-w023dx | |
| Lenovo ThinkPad X1 Yoga-20FRS1VS00 | |
| Lenovo ThinkPad Yoga 370-20JJS00100 | |
| Dell Latitude 13 7370 | |
| 1920x1080 Fire Strike Graphics | |
| Lenovo ThinkPad X1 Carbon 2017-20HQS03P00 | |
| Lenovo Yoga 910-13IKB-80VF004CGE | |
| HP EliteBook x360 1030 G2 | |
| HP Spectre x360 13-w023dx | |
| Lenovo ThinkPad X1 Yoga-20FRS1VS00 | |
| Lenovo ThinkPad Yoga 370-20JJS00100 | |
| Dell Latitude 13 7370 | |
| 3DMark 11 - 1280x720 Performance GPU | |
| Lenovo ThinkPad X1 Carbon 2017-20HQS03P00 | |
| Lenovo Yoga 910-13IKB-80VF004CGE | |
| HP Spectre x360 13-w023dx | |
| HP EliteBook x360 1030 G2 | |
| Lenovo ThinkPad X1 Yoga-20FRS1VS00 | |
| Lenovo ThinkPad Yoga 370-20JJS00100 | |
| Dell Latitude 13 7370 | |
| 3DMark 05 Standard | 12125 points | |
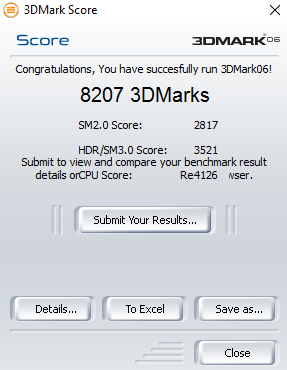
| 3DMark 06 Standard Score | 8207 points | |
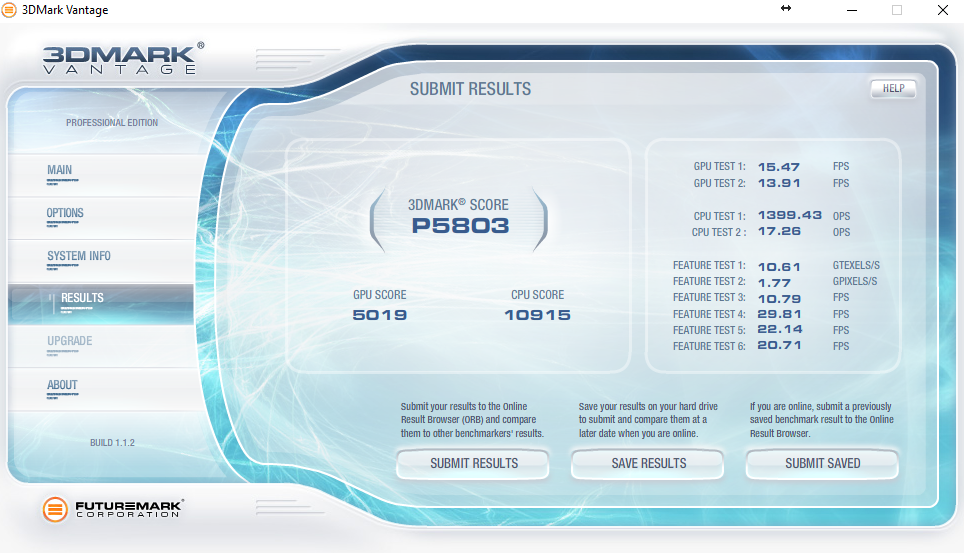
| 3DMark Vantage P Result | 5803 points | |
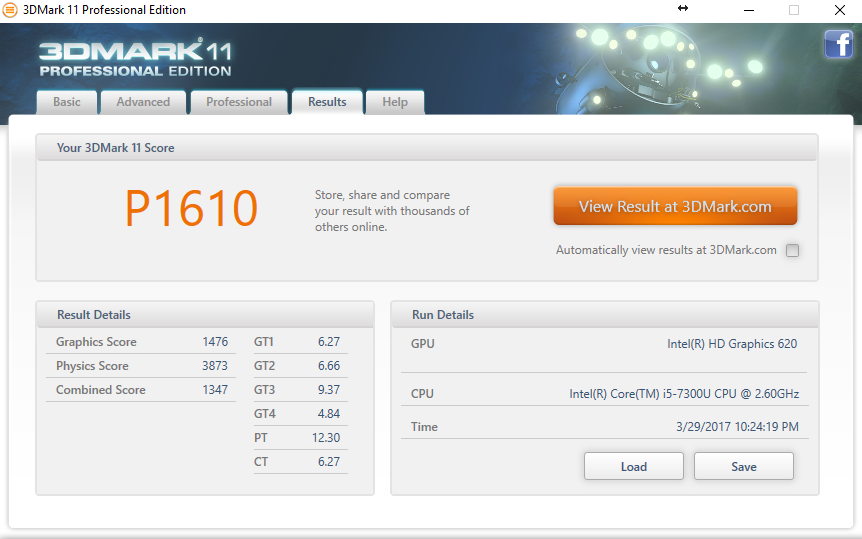
| 3DMark 11 Performance | 1610 points | |
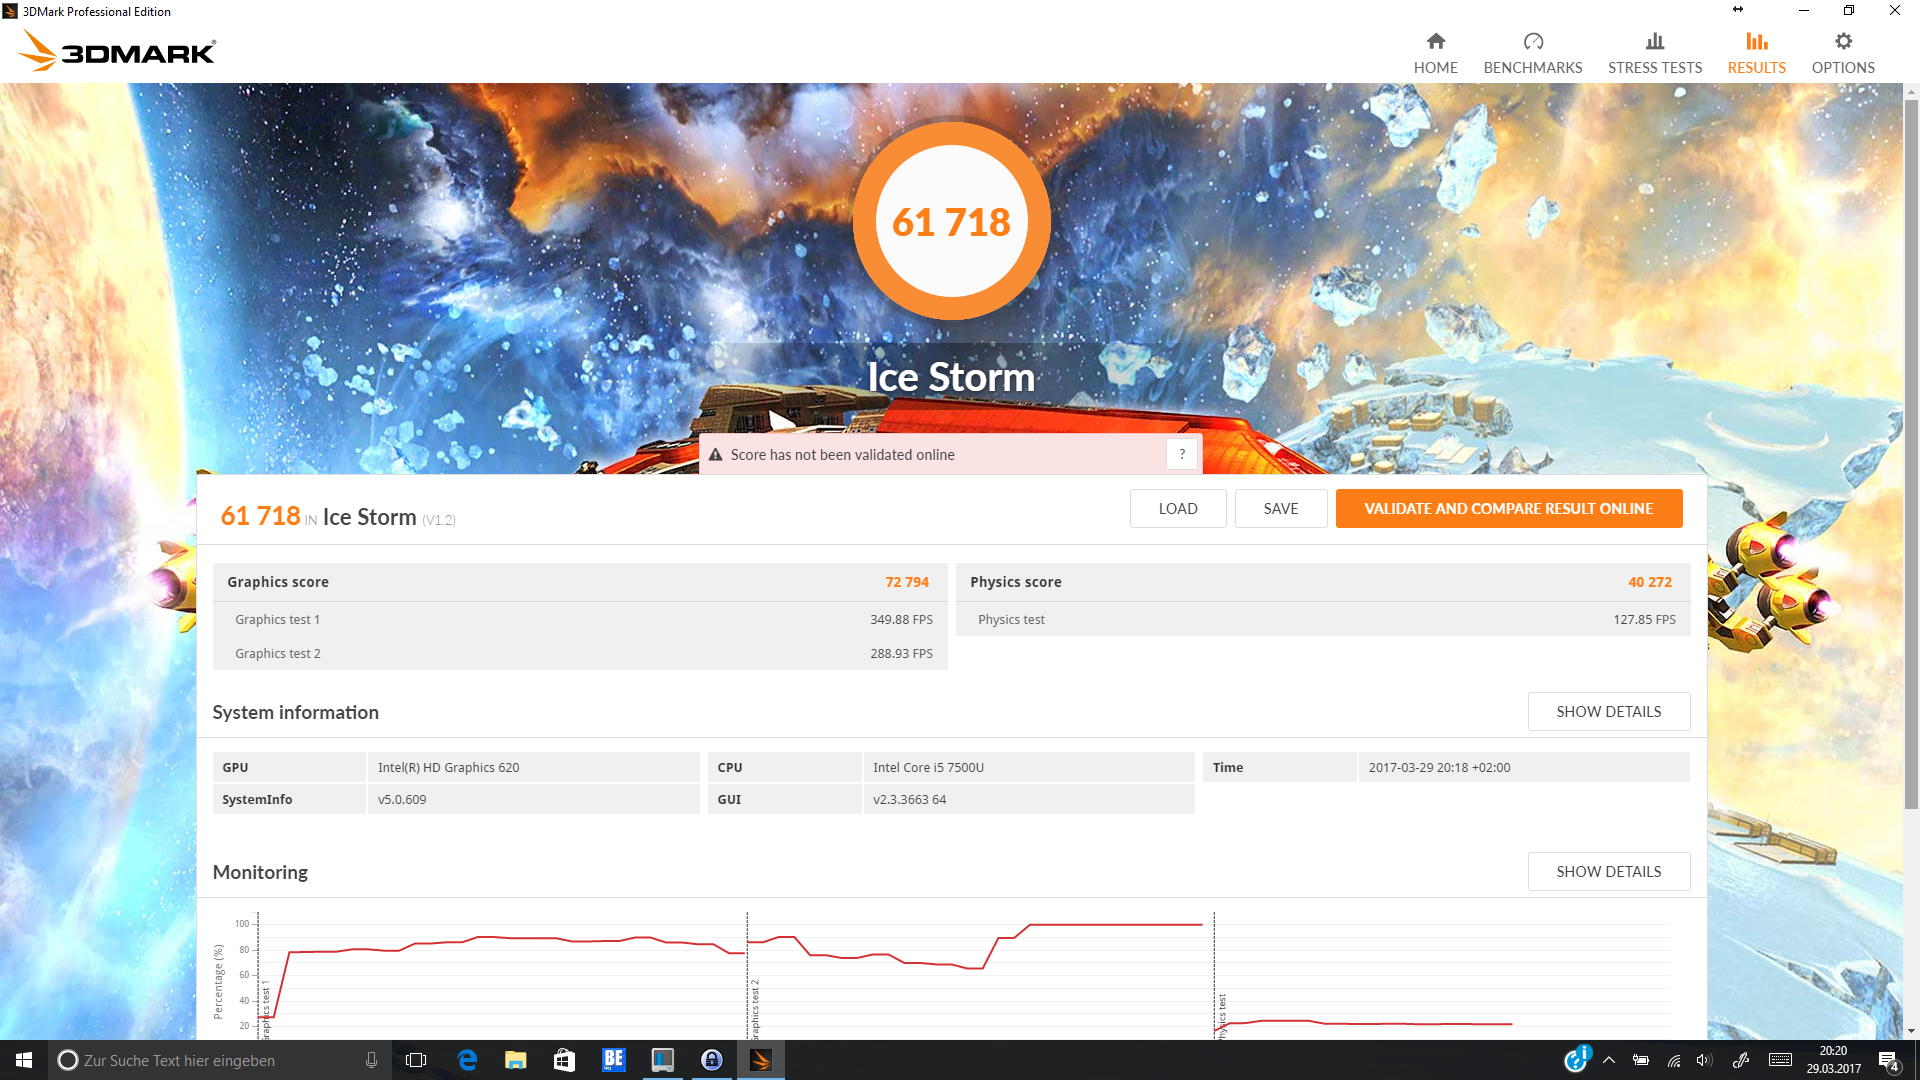
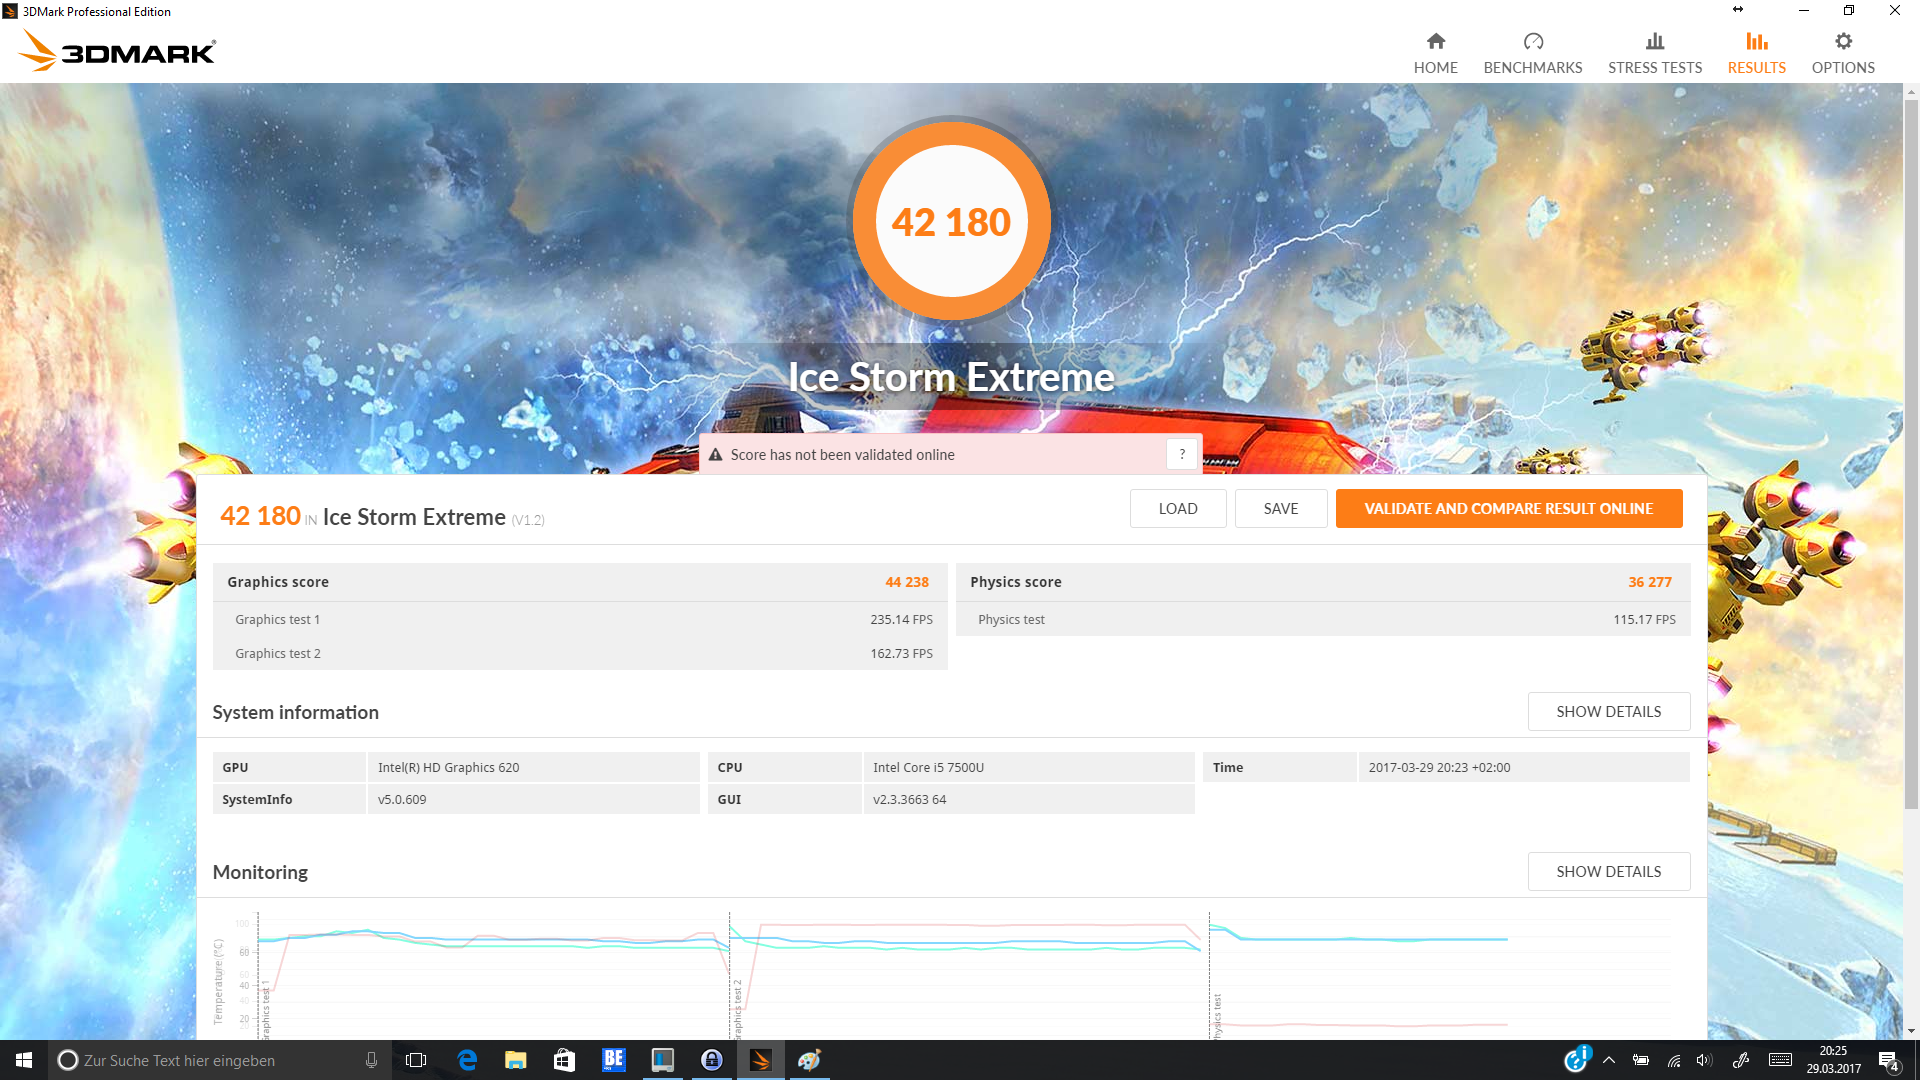
| 3DMark Ice Storm Standard Score | 61718 points | |
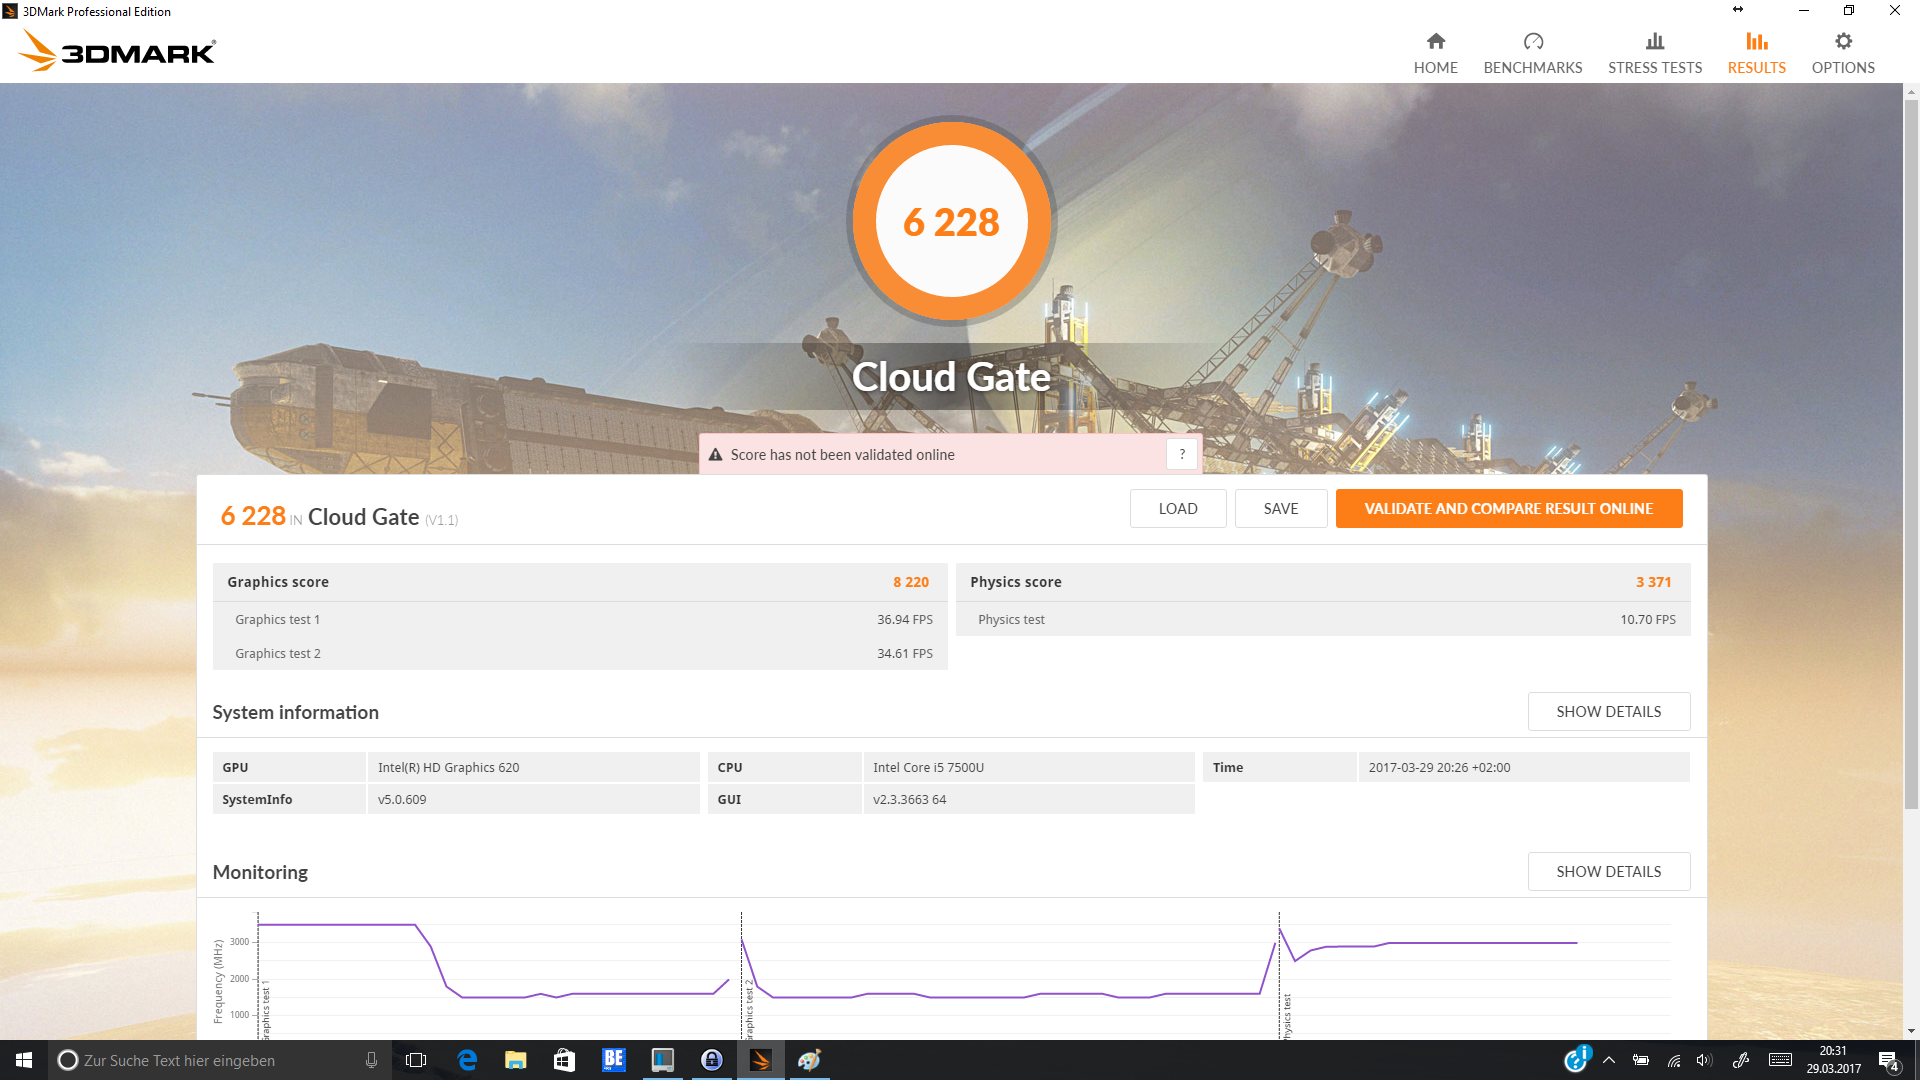
| 3DMark Cloud Gate Standard Score | 6228 points | |
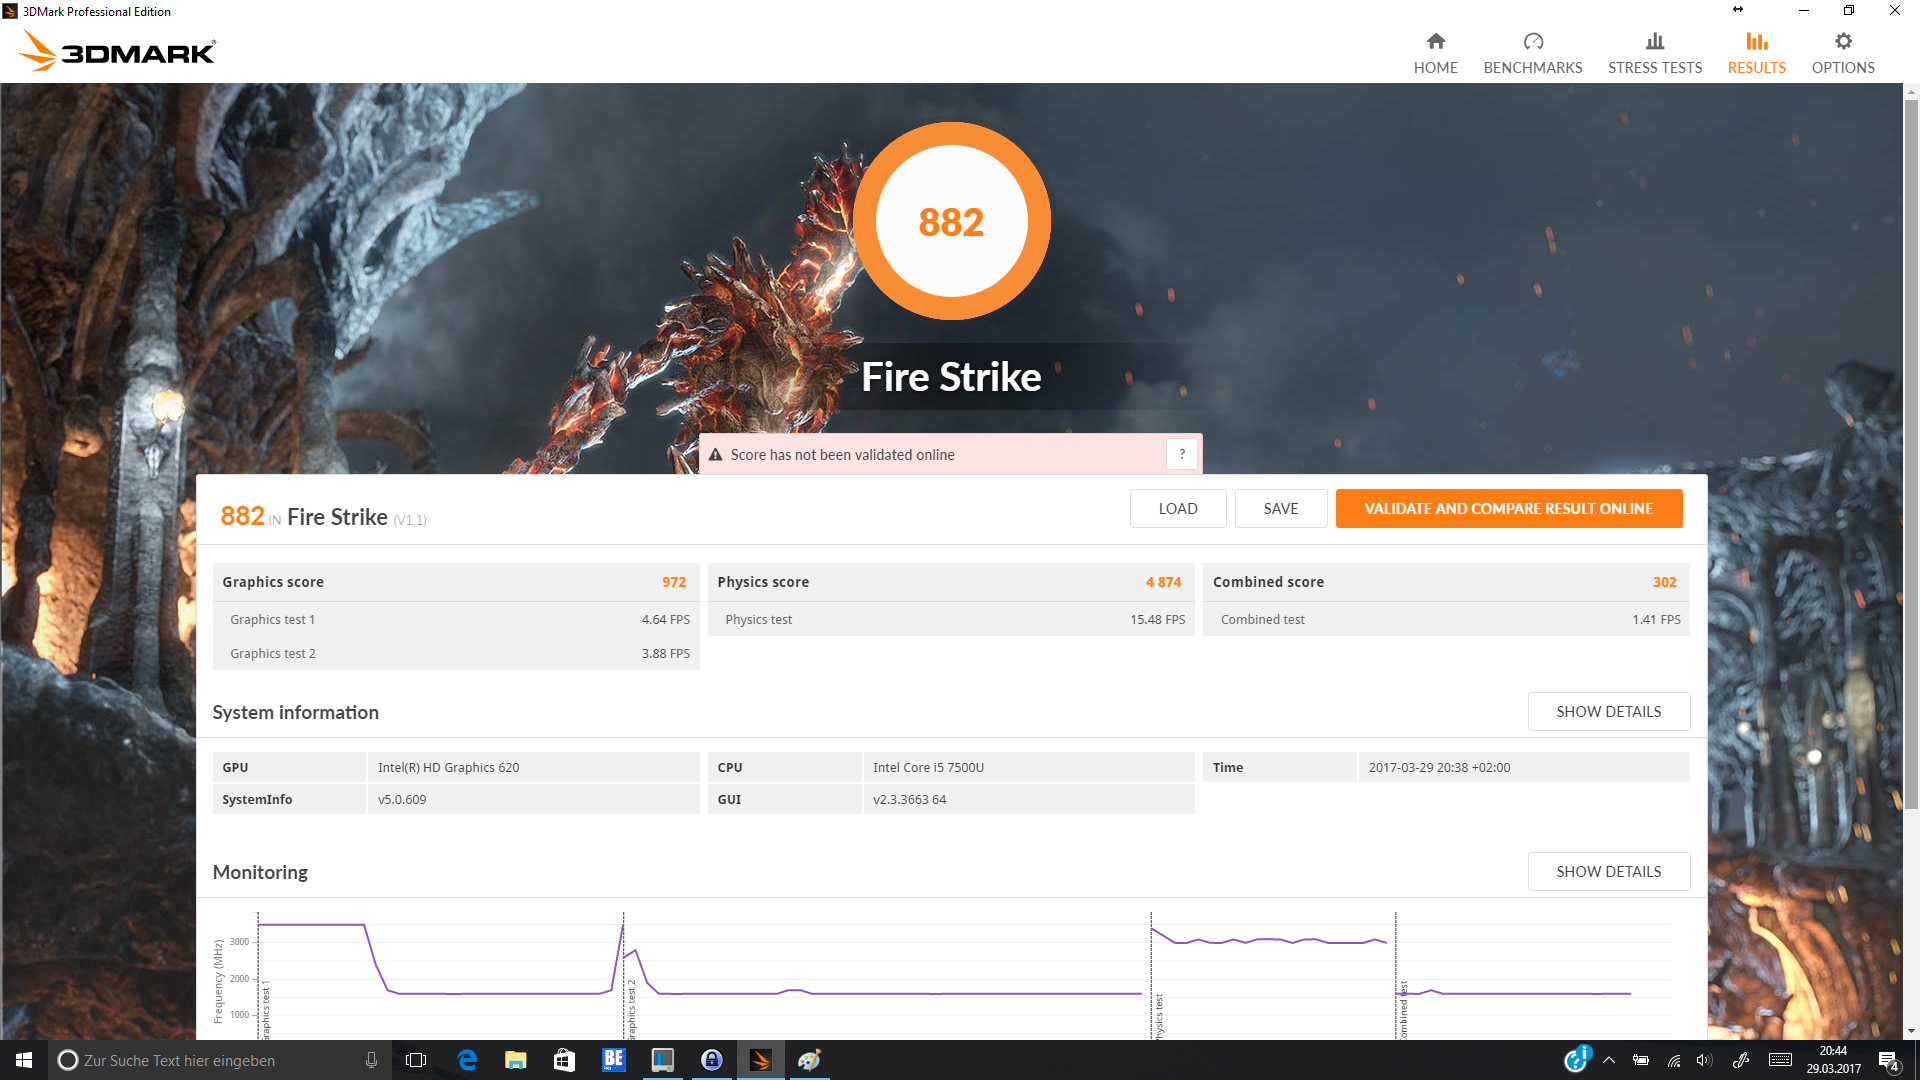
| 3DMark Fire Strike Score | 882 points | |
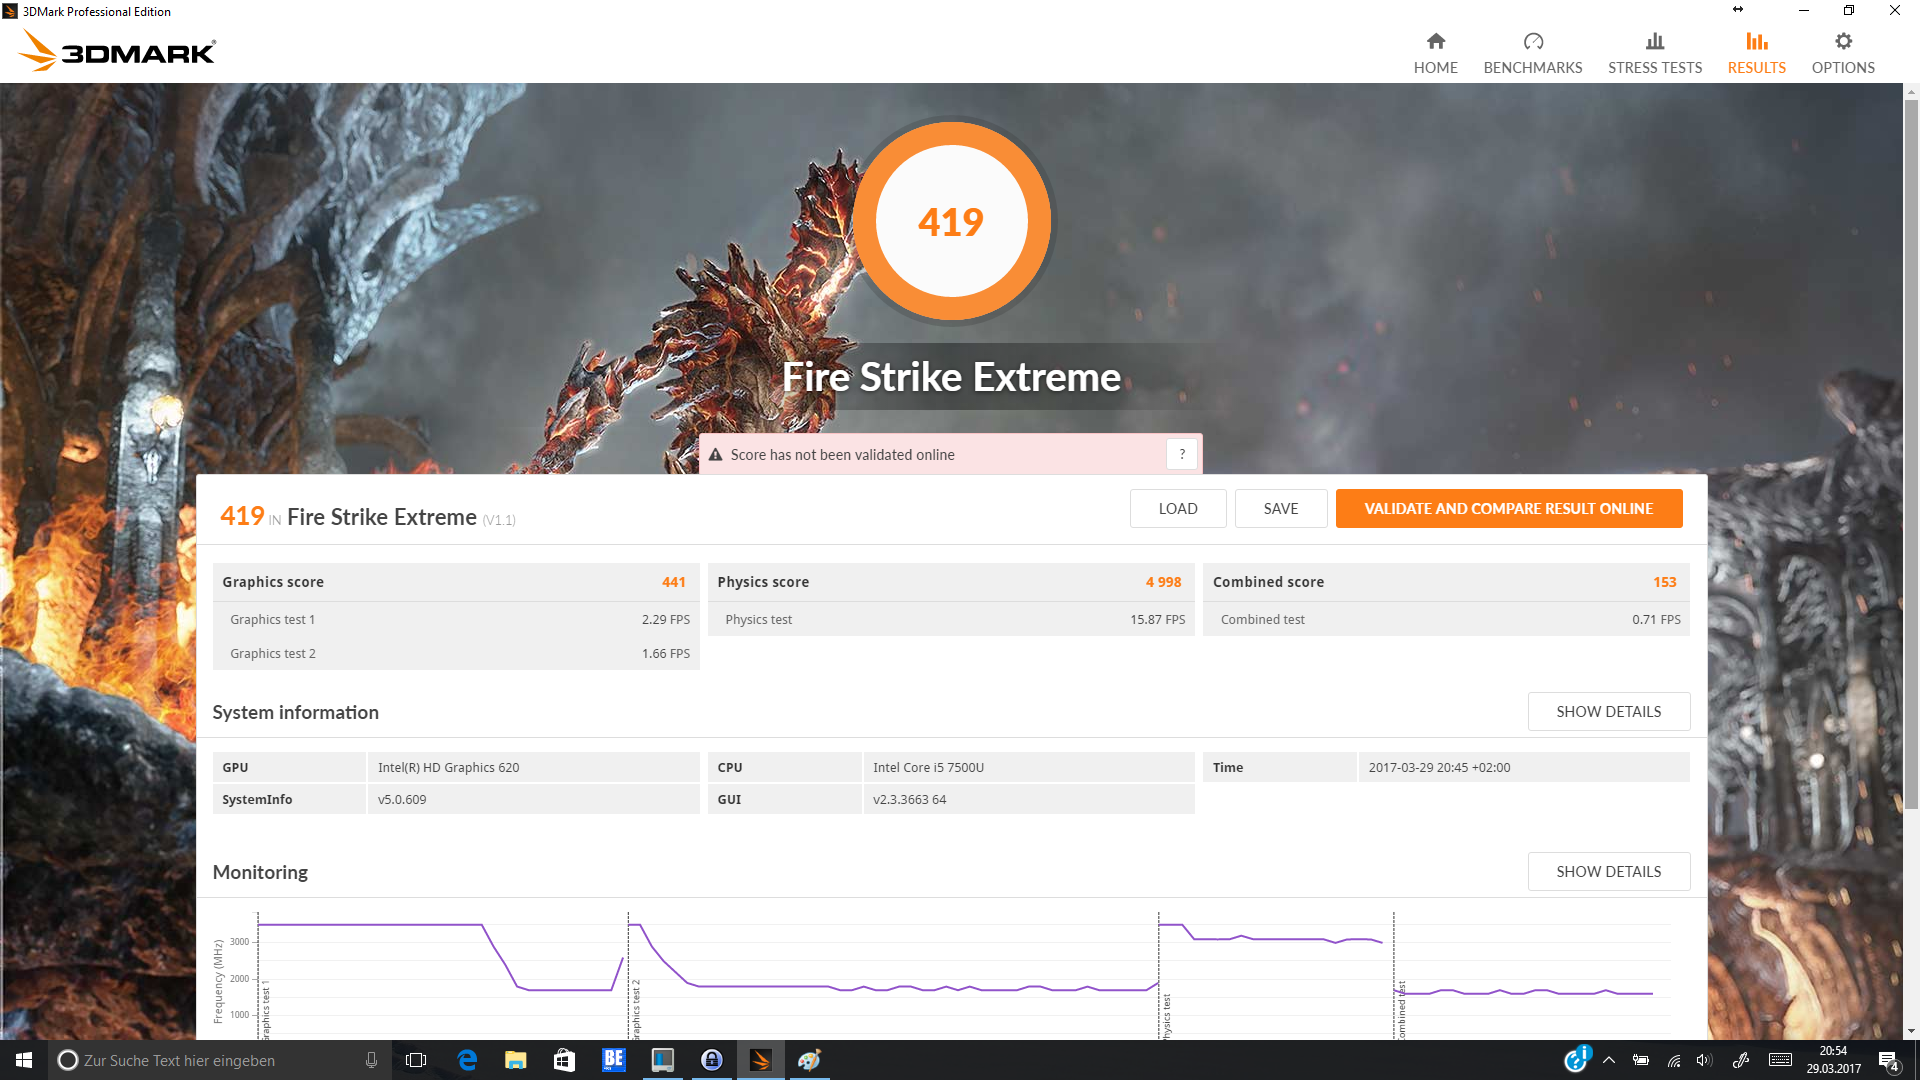
| 3DMark Fire Strike Extreme Score | 419 points | |
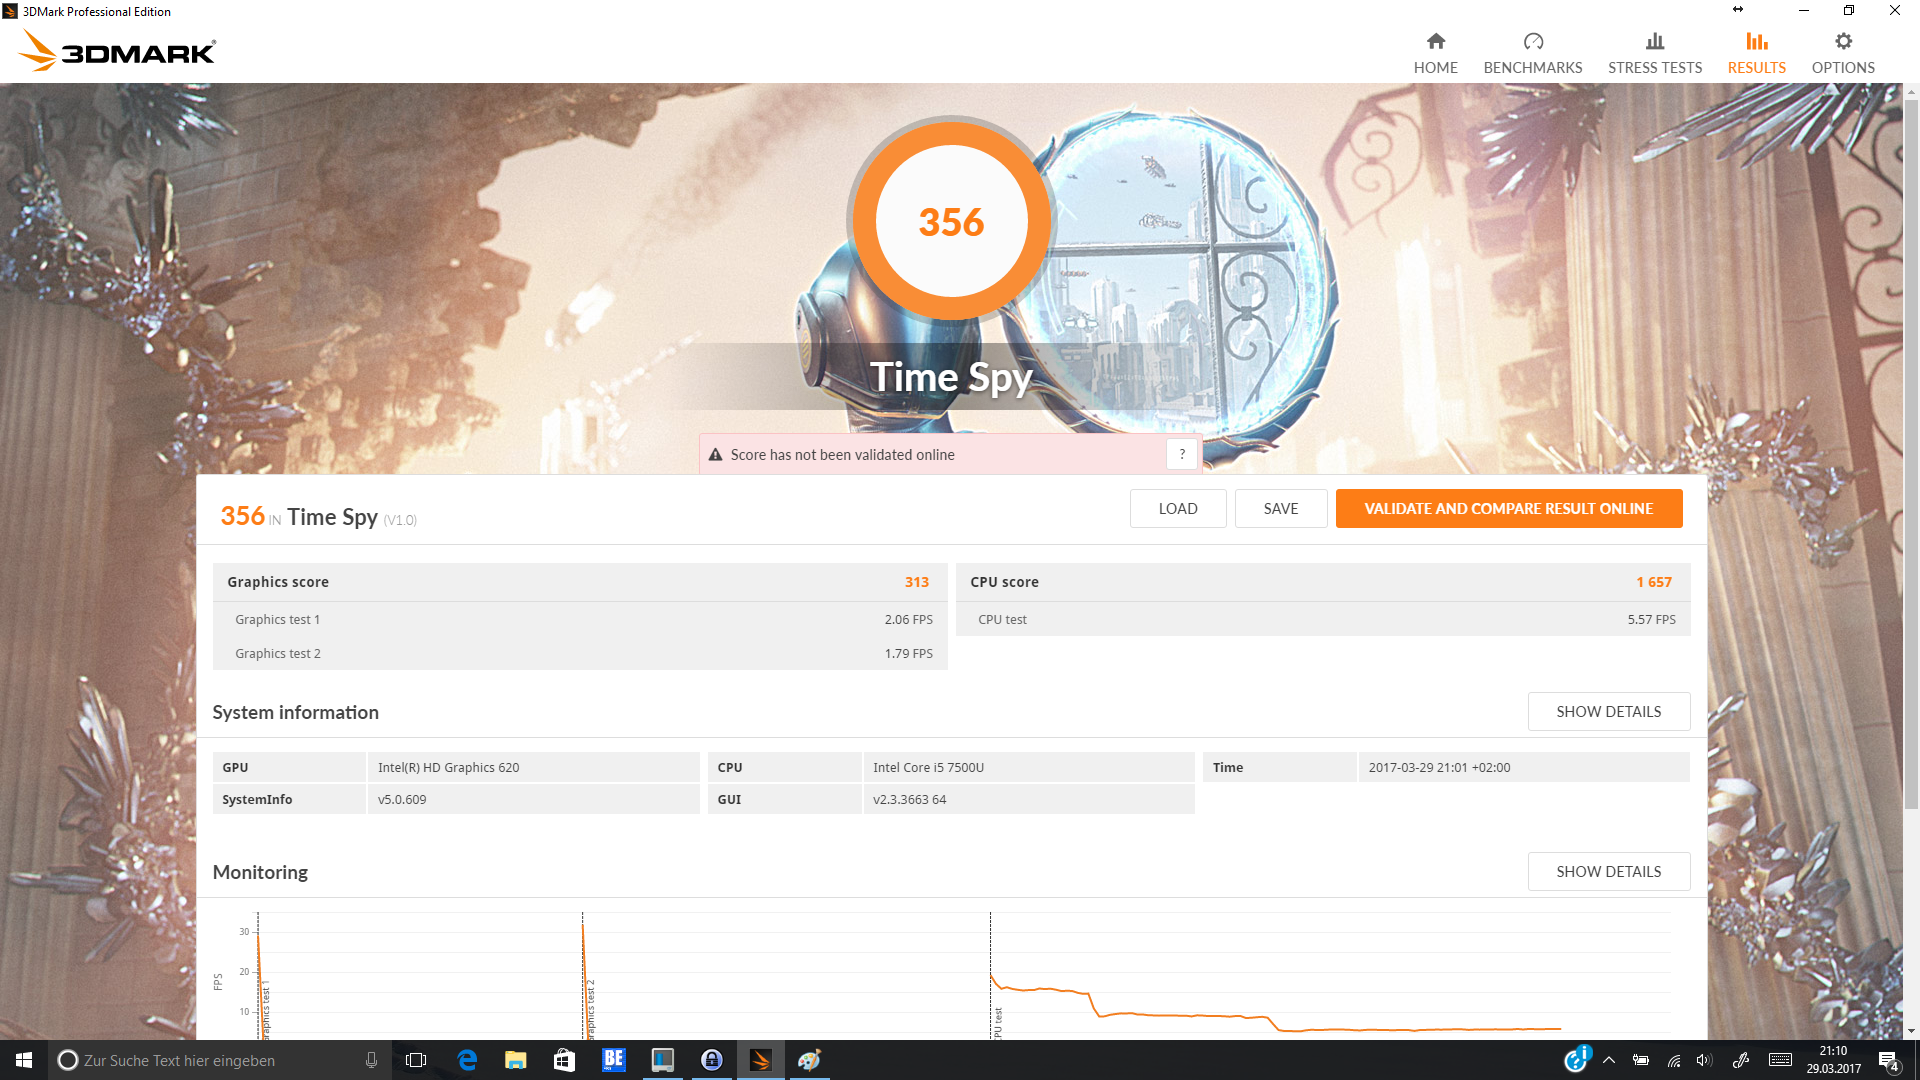
| 3DMark Time Spy Score | 356 points | |
Help | ||
| low | med. | high | ultra | |
|---|---|---|---|---|
| BioShock Infinite (2013) | 54.4 | 30.7 | 24.9 | 7.8 |
| Battlefield 4 (2013) | 40.2 | 31.4 | 20.9 | 7.5 |
| The Witcher 3 (2015) | 14.4 | 12.3 | 5.5 | |
| Rise of the Tomb Raider (2016) | 17.6 | 11 | 6.7 |
Noise level
| Idle |
| 29 / 29 / 29 dB(A) |
| Load |
| 33.6 / 35.8 dB(A) |
 | ||
30 dB silent 40 dB(A) audible 50 dB(A) loud |
||
min: | ||
| HP EliteBook x360 1030 G2 i5-7300U, HD Graphics 620 | Lenovo Yoga 910-13IKB-80VF004CGE i7-7500U, HD Graphics 620 | Lenovo ThinkPad X1 Yoga-20FRS1VS00 6600U, HD Graphics 520 | Lenovo ThinkPad X1 Carbon 2017-20HQS03P00 i7-7500U, HD Graphics 620 | HP Spectre x360 13-w023dx i7-7500U, HD Graphics 620 | Lenovo ThinkPad Yoga 370-20JJS00100 i5-7200U, HD Graphics 620 | Dell Latitude 13 7370 6Y57, HD Graphics 515 | |
|---|---|---|---|---|---|---|---|
| Noise | -8% | -2% | -4% | -5% | -1% | ||
| off / environment * (dB) | 29 | 31.7 -9% | 28.9 -0% | 29.3 -1% | 29.1 -0% | 28.6 1% | |
| Idle Minimum * (dB) | 29 | 31.7 -9% | 28.9 -0% | 29.3 -1% | 29.1 -0% | 28.6 1% | |
| Idle Average * (dB) | 29 | 31.7 -9% | 28.9 -0% | 29.3 -1% | 29.1 -0% | 28.6 1% | |
| Idle Maximum * (dB) | 29 | 31.7 -9% | 28.9 -0% | 32.2 -11% | 31.2 -8% | 31.2 -8% | |
| Load Average * (dB) | 33.6 | 38.4 -14% | 35.3 -5% | 34.3 -2% | 37.3 -11% | 33.7 -0% | |
| Load Maximum * (dB) | 35.8 | 34.7 3% | 38.9 -9% | 39.3 -10% | 39.6 -11% | 36.7 -3% |
* ... smaller is better
(+) The maximum temperature on the upper side is 36.1 °C / 97 F, compared to the average of 35.4 °C / 96 F, ranging from 19.6 to 60 °C for the class Convertible.
(+) The bottom heats up to a maximum of 36.7 °C / 98 F, compared to the average of 36.9 °C / 98 F
(+) In idle usage, the average temperature for the upper side is 24.7 °C / 76 F, compared to the device average of 30.3 °C / 87 F.
(+) The palmrests and touchpad are cooler than skin temperature with a maximum of 25.5 °C / 77.9 F and are therefore cool to the touch.
(+) The average temperature of the palmrest area of similar devices was 28 °C / 82.4 F (+2.5 °C / 4.5 F).
| HP EliteBook x360 1030 G2 i5-7300U, HD Graphics 620 | Lenovo Yoga 910-13IKB-80VF004CGE i7-7500U, HD Graphics 620 | Lenovo ThinkPad X1 Yoga-20FRS1VS00 6600U, HD Graphics 520 | Lenovo ThinkPad X1 Carbon 2017-20HQS03P00 i7-7500U, HD Graphics 620 | Dell Latitude 13 7370 6Y57, HD Graphics 515 | HP Spectre x360 13-w023dx i7-7500U, HD Graphics 620 | Lenovo ThinkPad Yoga 370-20JJS00100 i5-7200U, HD Graphics 620 | |
|---|---|---|---|---|---|---|---|
| Heat | -12% | -24% | -9% | -23% | -10% | -16% | |
| Maximum Upper Side * (°C) | 36.1 | 41.4 -15% | 45.5 -26% | 48 -33% | 43.2 -20% | 48.2 -34% | 42 -16% |
| Maximum Bottom * (°C) | 36.7 | 38.5 -5% | 47.1 -28% | 47.2 -29% | 50.8 -38% | 46 -25% | 48 -31% |
| Idle Upper Side * (°C) | 26.8 | 31 -16% | 31.1 -16% | 23.5 12% | 30.5 -14% | 24.6 8% | 28 -4% |
| Idle Bottom * (°C) | 26.5 | 29.6 -12% | 33.1 -25% | 22.6 15% | 31.2 -18% | 23.2 12% | 29.7 -12% |
* ... smaller is better
HP EliteBook x360 1030 G2 audio analysis
(+) | speakers can play relatively loud (86.3 dB)
Analysis not possible as minimum curve is missing or too high
Lenovo ThinkPad Yoga 370-20JJS00100 audio analysis
(±) | speaker loudness is average but good (79.4 dB)
Bass 100 - 315 Hz
(-) | nearly no bass - on average 23.5% lower than median
(+) | bass is linear (6.5% delta to prev. frequency)
Mids 400 - 2000 Hz
(+) | balanced mids - only 4.4% away from median
(+) | mids are linear (6.8% delta to prev. frequency)
Highs 2 - 16 kHz
(+) | balanced highs - only 4.6% away from median
(+) | highs are linear (6.9% delta to prev. frequency)
Overall 100 - 16.000 Hz
(±) | linearity of overall sound is average (24.2% difference to median)
Compared to same class
» 74% of all tested devices in this class were better, 5% similar, 21% worse
» The best had a delta of 6%, average was 20%, worst was 57%
Compared to all devices tested
» 73% of all tested devices were better, 6% similar, 21% worse
» The best had a delta of 4%, average was 23%, worst was 134%
| Off / Standby | |
| Idle | |
| Load |
|
Key:
min: | |
| HP EliteBook x360 1030 G2 i5-7300U, HD Graphics 620, Sandisk SD8TN8U-256G-1006, IPS, 1920x1080, 13.3" | Lenovo Yoga 910-13IKB-80VF004CGE i7-7500U, HD Graphics 620, Samsung PM951 NVMe MZVLV512, IPS, 3840x2160, 13.9" | Lenovo ThinkPad X1 Yoga-20FRS1VS00 6600U, HD Graphics 520, Samsung SSD PM961 1TB M.2 PCIe 3.0 x4 NVMe (MZSLW1T0), OLED, 2560x1440, 14" | Lenovo ThinkPad X1 Carbon 2017-20HQS03P00 i7-7500U, HD Graphics 620, Samsung PM961 NVMe MZVLW512HMJP, IPS, 1920x1080, 14" | Dell Latitude 13 7370 6Y57, HD Graphics 515, Toshiba NVMe THNSN5256GPU7, IPS, 1920x1080, 13.3" | HP Spectre x360 13-w023dx i7-7500U, HD Graphics 620, Samsung PM951 NVMe MZVLV512, IPS, 1920x1080, 13.3" | Lenovo ThinkPad Yoga 370-20JJS00100 i5-7200U, HD Graphics 620, Toshiba NVMe THNSF5512GPUK, IPS LED, 1920x1080, 13.3" | |
|---|---|---|---|---|---|---|---|
| Power Consumption | -13% | -43% | -25% | -6% | -20% | -10% | |
| Idle Minimum * (Watt) | 3.2 | 4.3 -34% | 4.7 -47% | 3.84 -20% | 5 -56% | 5.5 -72% | 3.6 -13% |
| Idle Average * (Watt) | 5.5 | 6.3 -15% | 8.6 -56% | 6.3 -15% | 7.5 -36% | 6.7 -22% | 7.2 -31% |
| Idle Maximum * (Watt) | 6.5 | 9 -38% | 12.2 -88% | 8.6 -32% | 8 -23% | 7.1 -9% | 8.4 -29% |
| Load Average * (Watt) | 29.7 | 32.7 -10% | 29.7 -0% | 41.9 -41% | 15.3 48% | 33.1 -11% | 29.9 -1% |
| Load Maximum * (Watt) | 41.3 | 28.8 30% | 50.5 -22% | 48.7 -18% | 26.8 35% | 35.2 15% | 32.2 22% |
* ... smaller is better

| HP EliteBook x360 1030 G2 i5-7300U, HD Graphics 620, 57 Wh | Lenovo Yoga 910-13IKB-80VF004CGE i7-7500U, HD Graphics 620, 78 Wh | Lenovo ThinkPad X1 Yoga-20FRS1VS00 6600U, HD Graphics 520, 56 Wh | Lenovo ThinkPad X1 Carbon 2017-20HQS03P00 i7-7500U, HD Graphics 620, 57 Wh | Dell Latitude 13 7370 6Y57, HD Graphics 515, 34 Wh | HP Spectre x360 13-w023dx i7-7500U, HD Graphics 620, 57.8 Wh | Lenovo ThinkPad Yoga 370-20JJS00100 i5-7200U, HD Graphics 620, 51 Wh | |
|---|---|---|---|---|---|---|---|
| Battery runtime | -17% | -40% | -20% | -43% | -24% | -25% | |
| Reader / Idle (h) | 23.1 | 17.8 -23% | 13.7 -41% | 20.9 -10% | 9.8 -58% | 20.6 -11% | 19.4 -16% |
| H.264 (h) | 11 | 8.7 -21% | 11.9 8% | 6.5 -41% | 9.6 -13% | ||
| WiFi v1.3 (h) | 10.5 | 10.7 2% | 5.3 -50% | 8.3 -21% | 6.1 -42% | 9.3 -11% | 8.1 -23% |
| Load (h) | 4.1 | 2.9 -29% | 2.2 -46% | 1.8 -56% | 2.9 -29% | 2 -51% | 2.1 -49% |
Pros
Cons
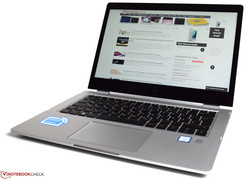
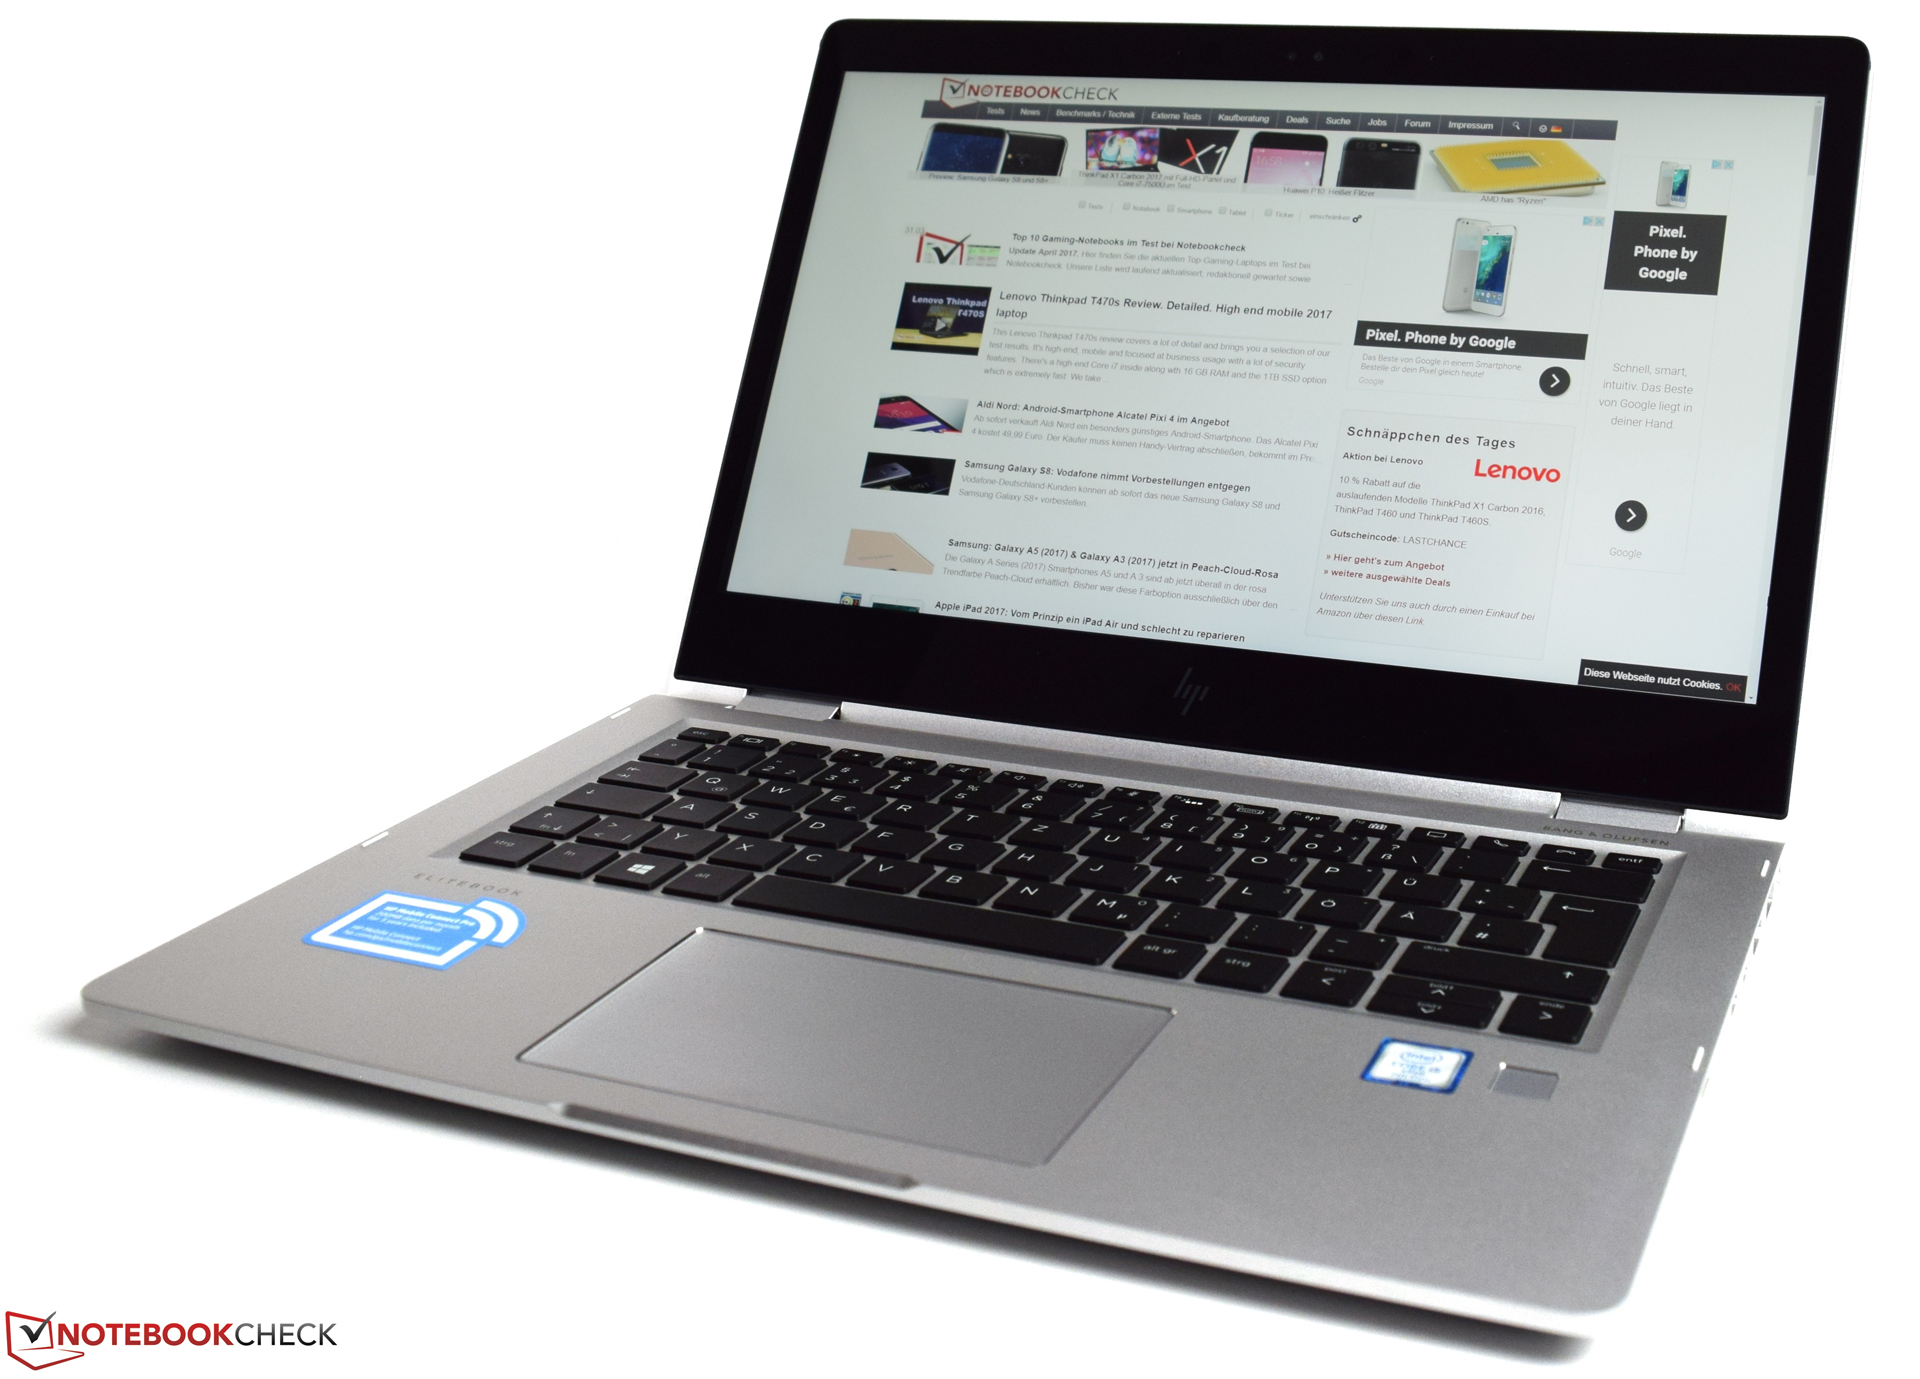
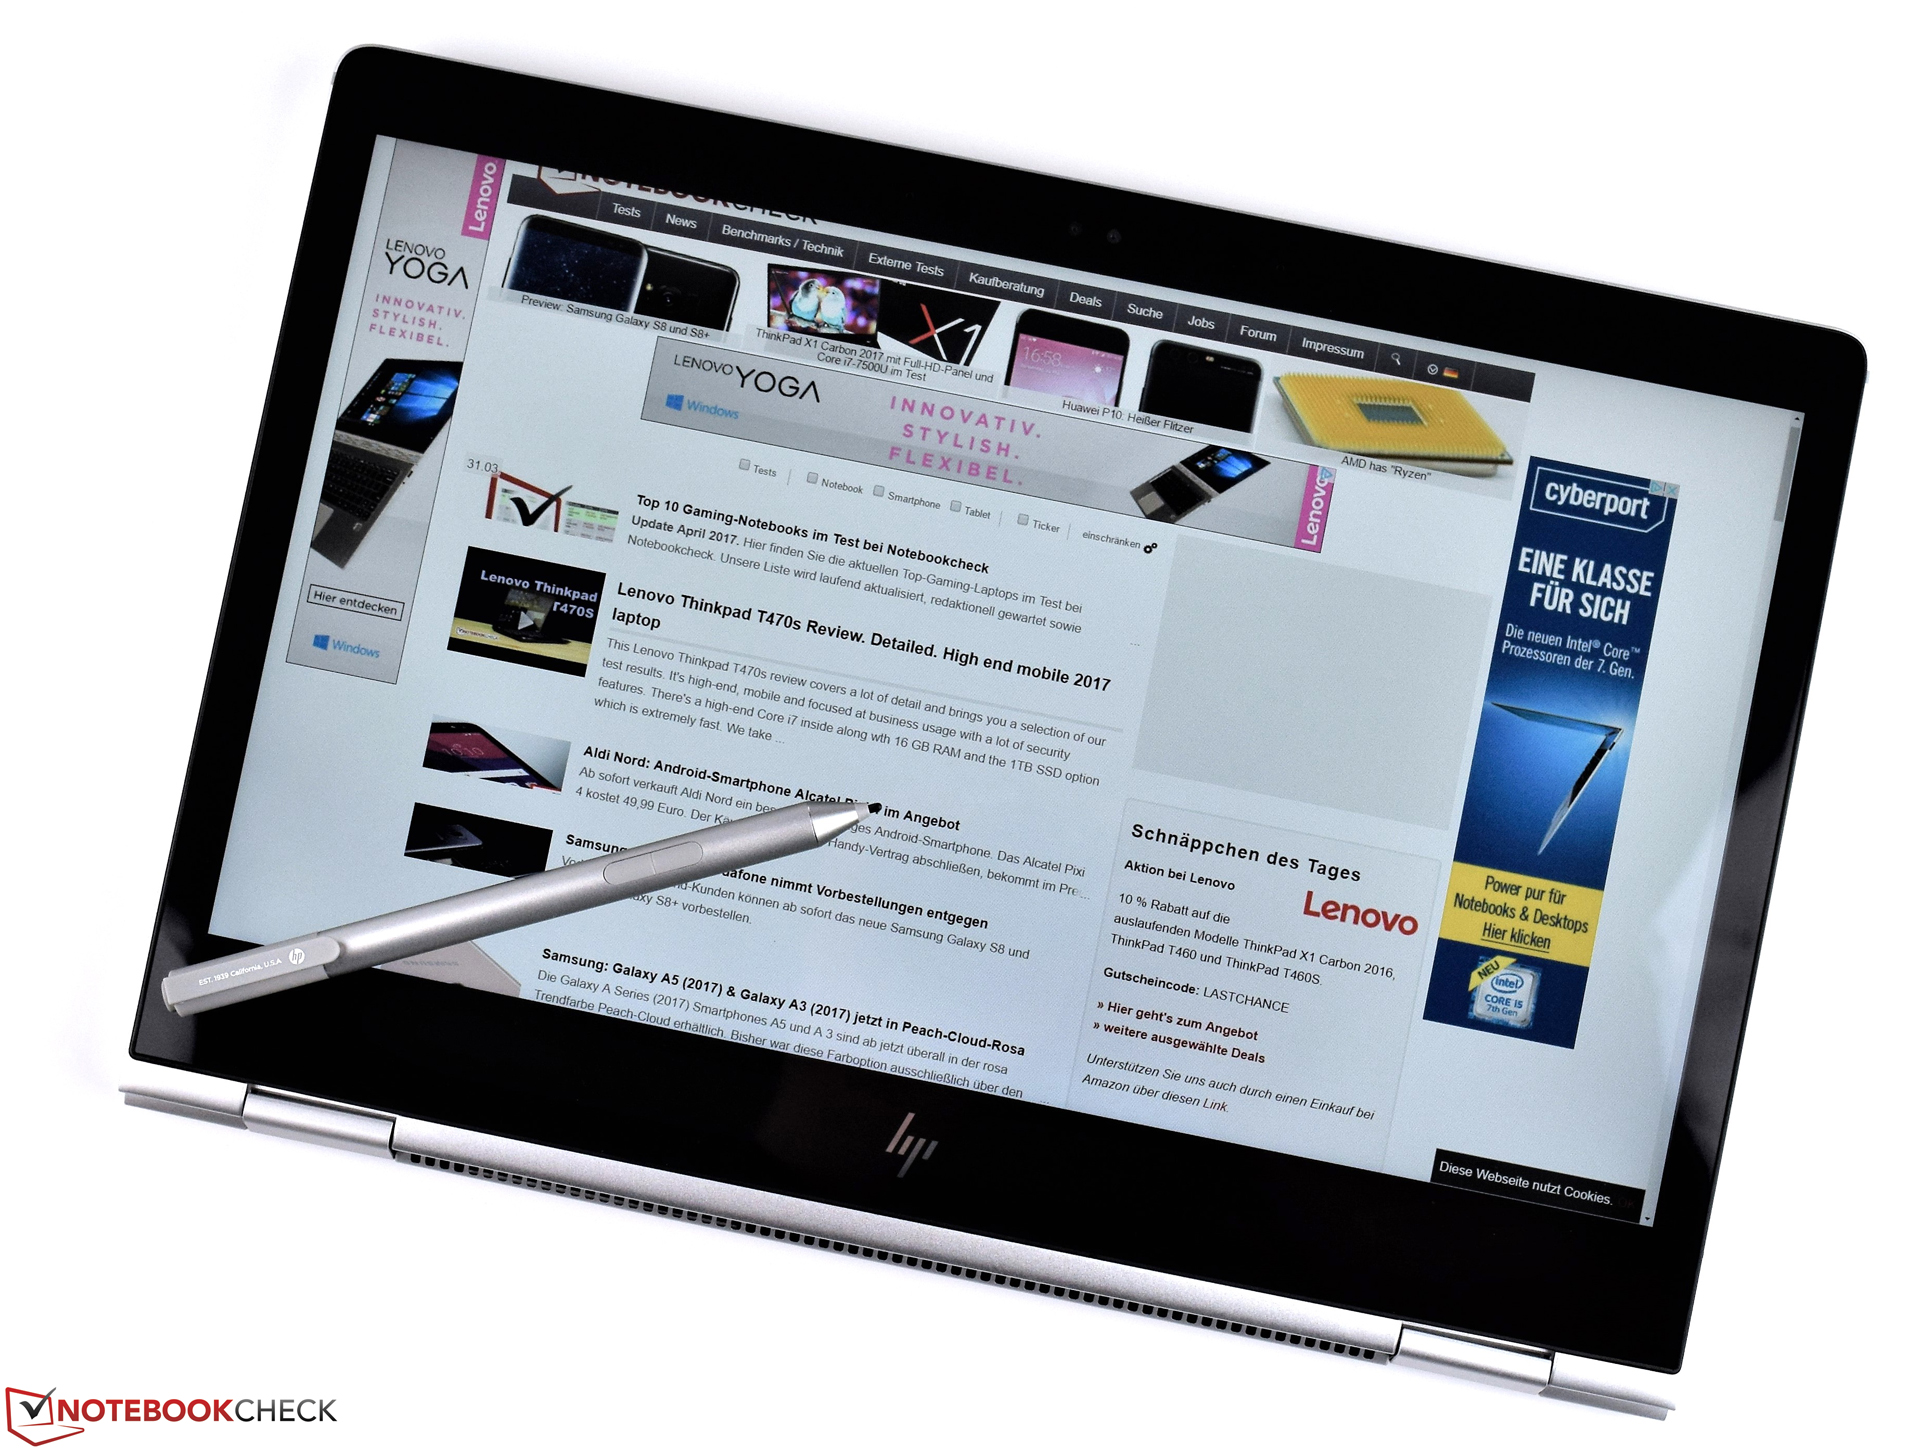
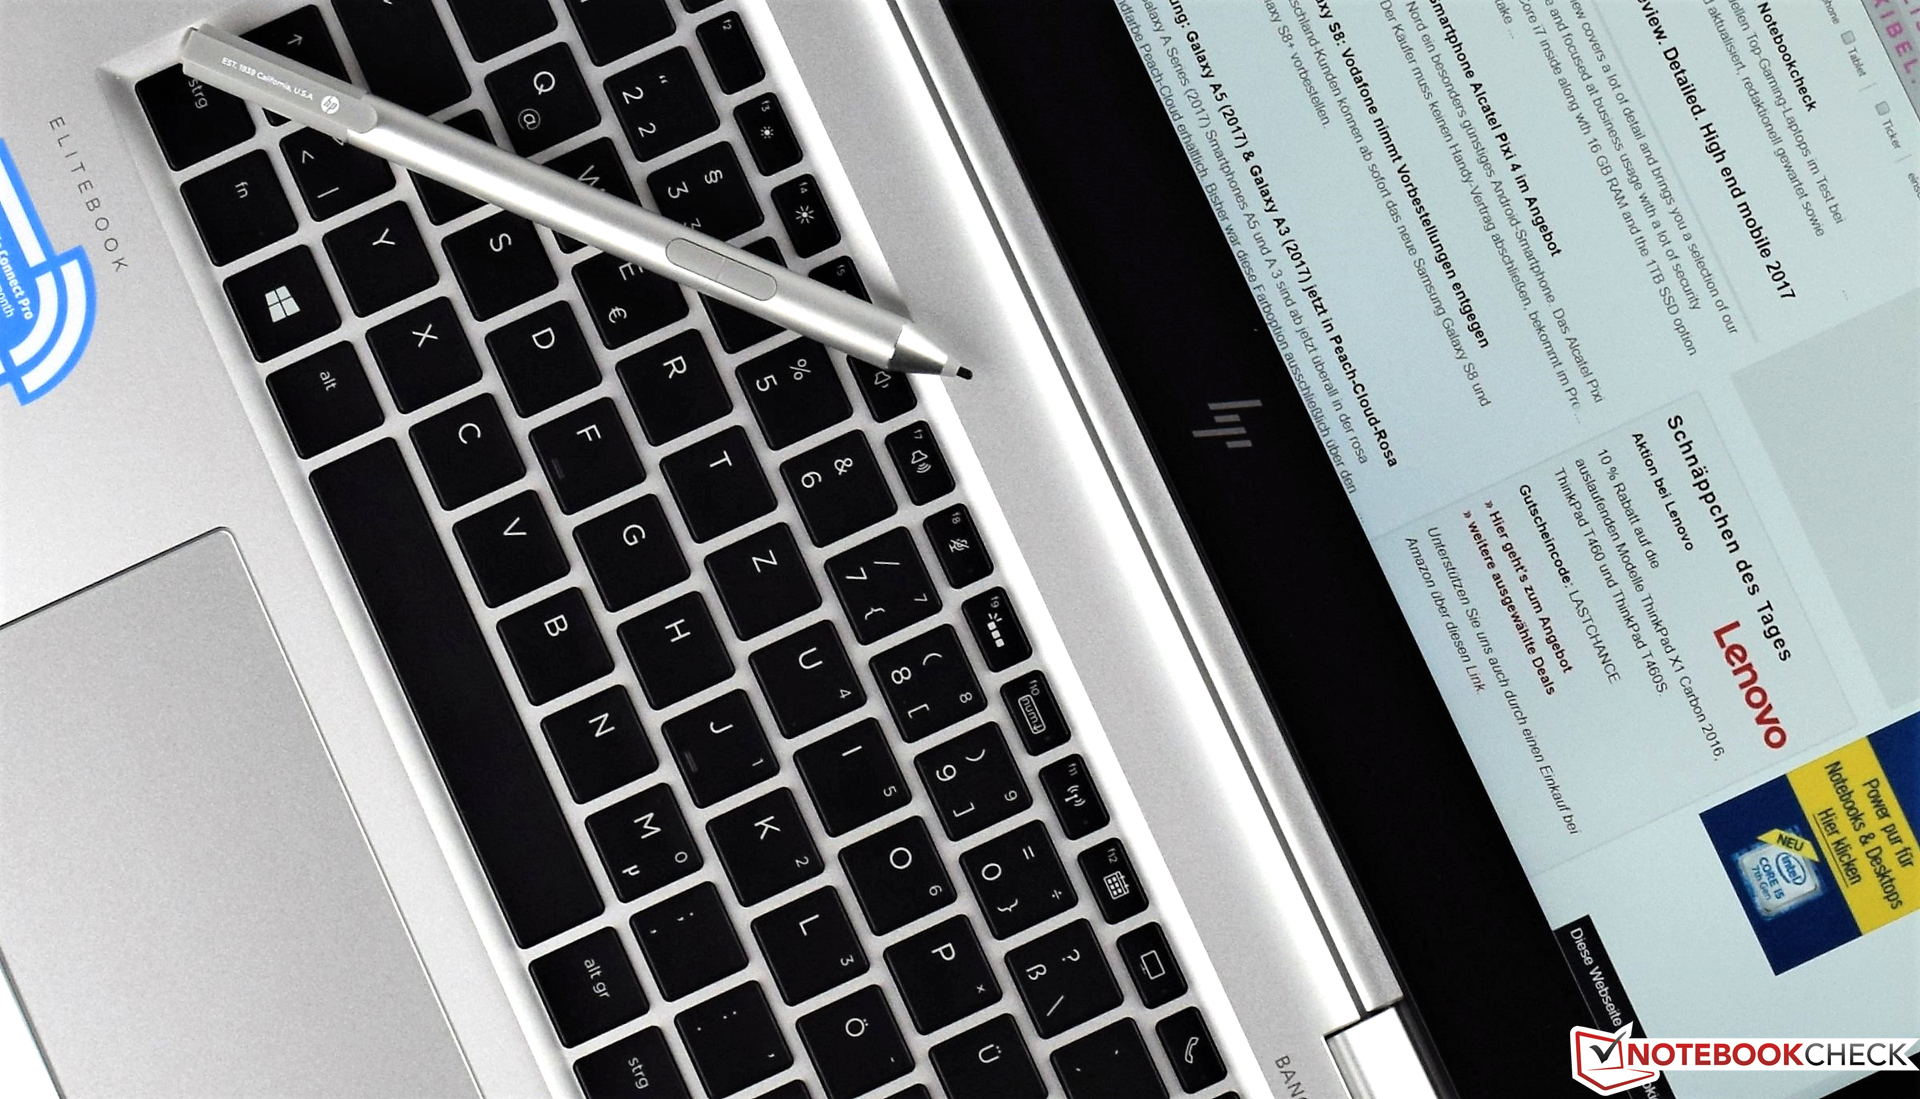
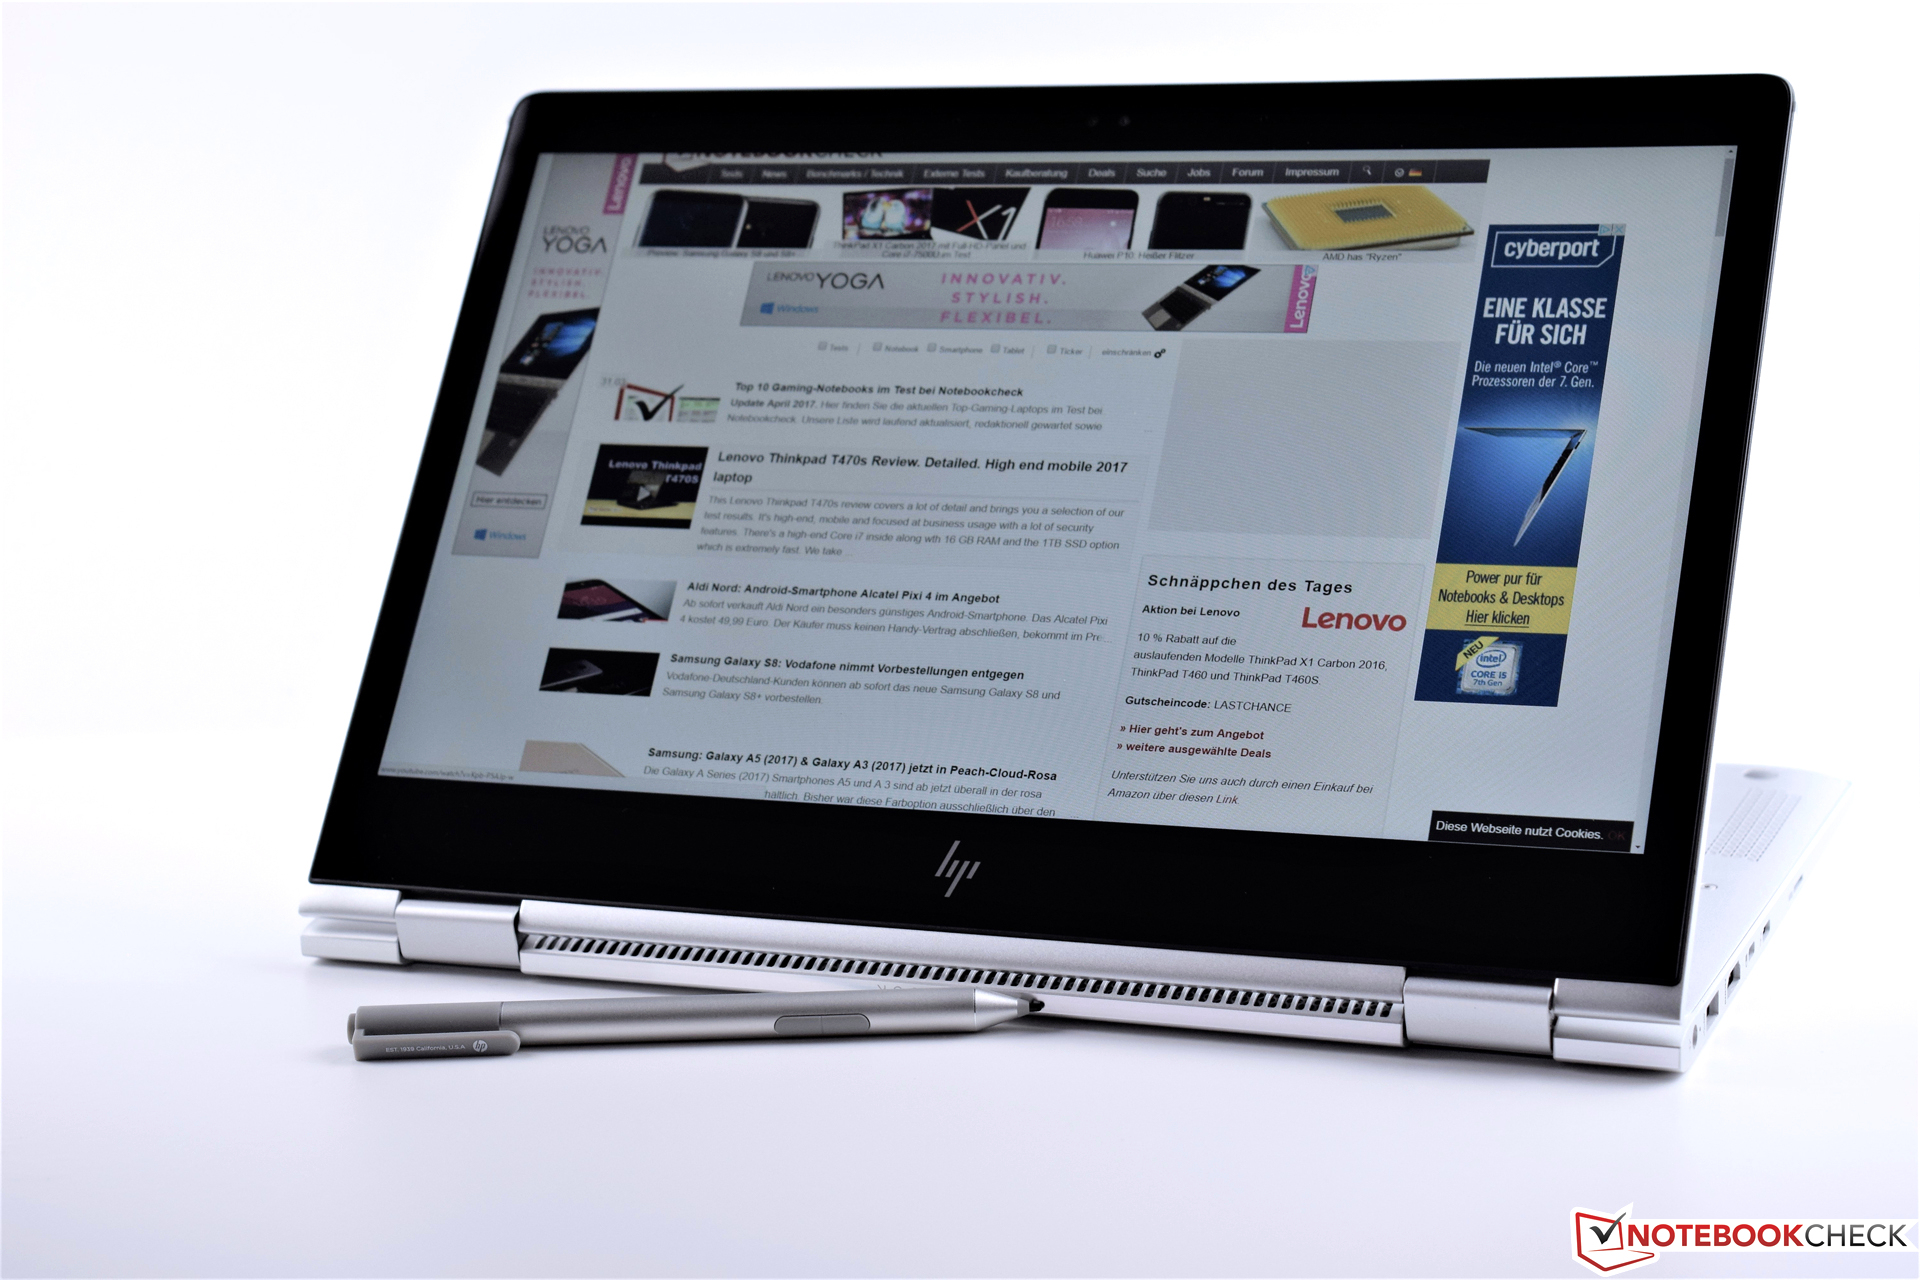
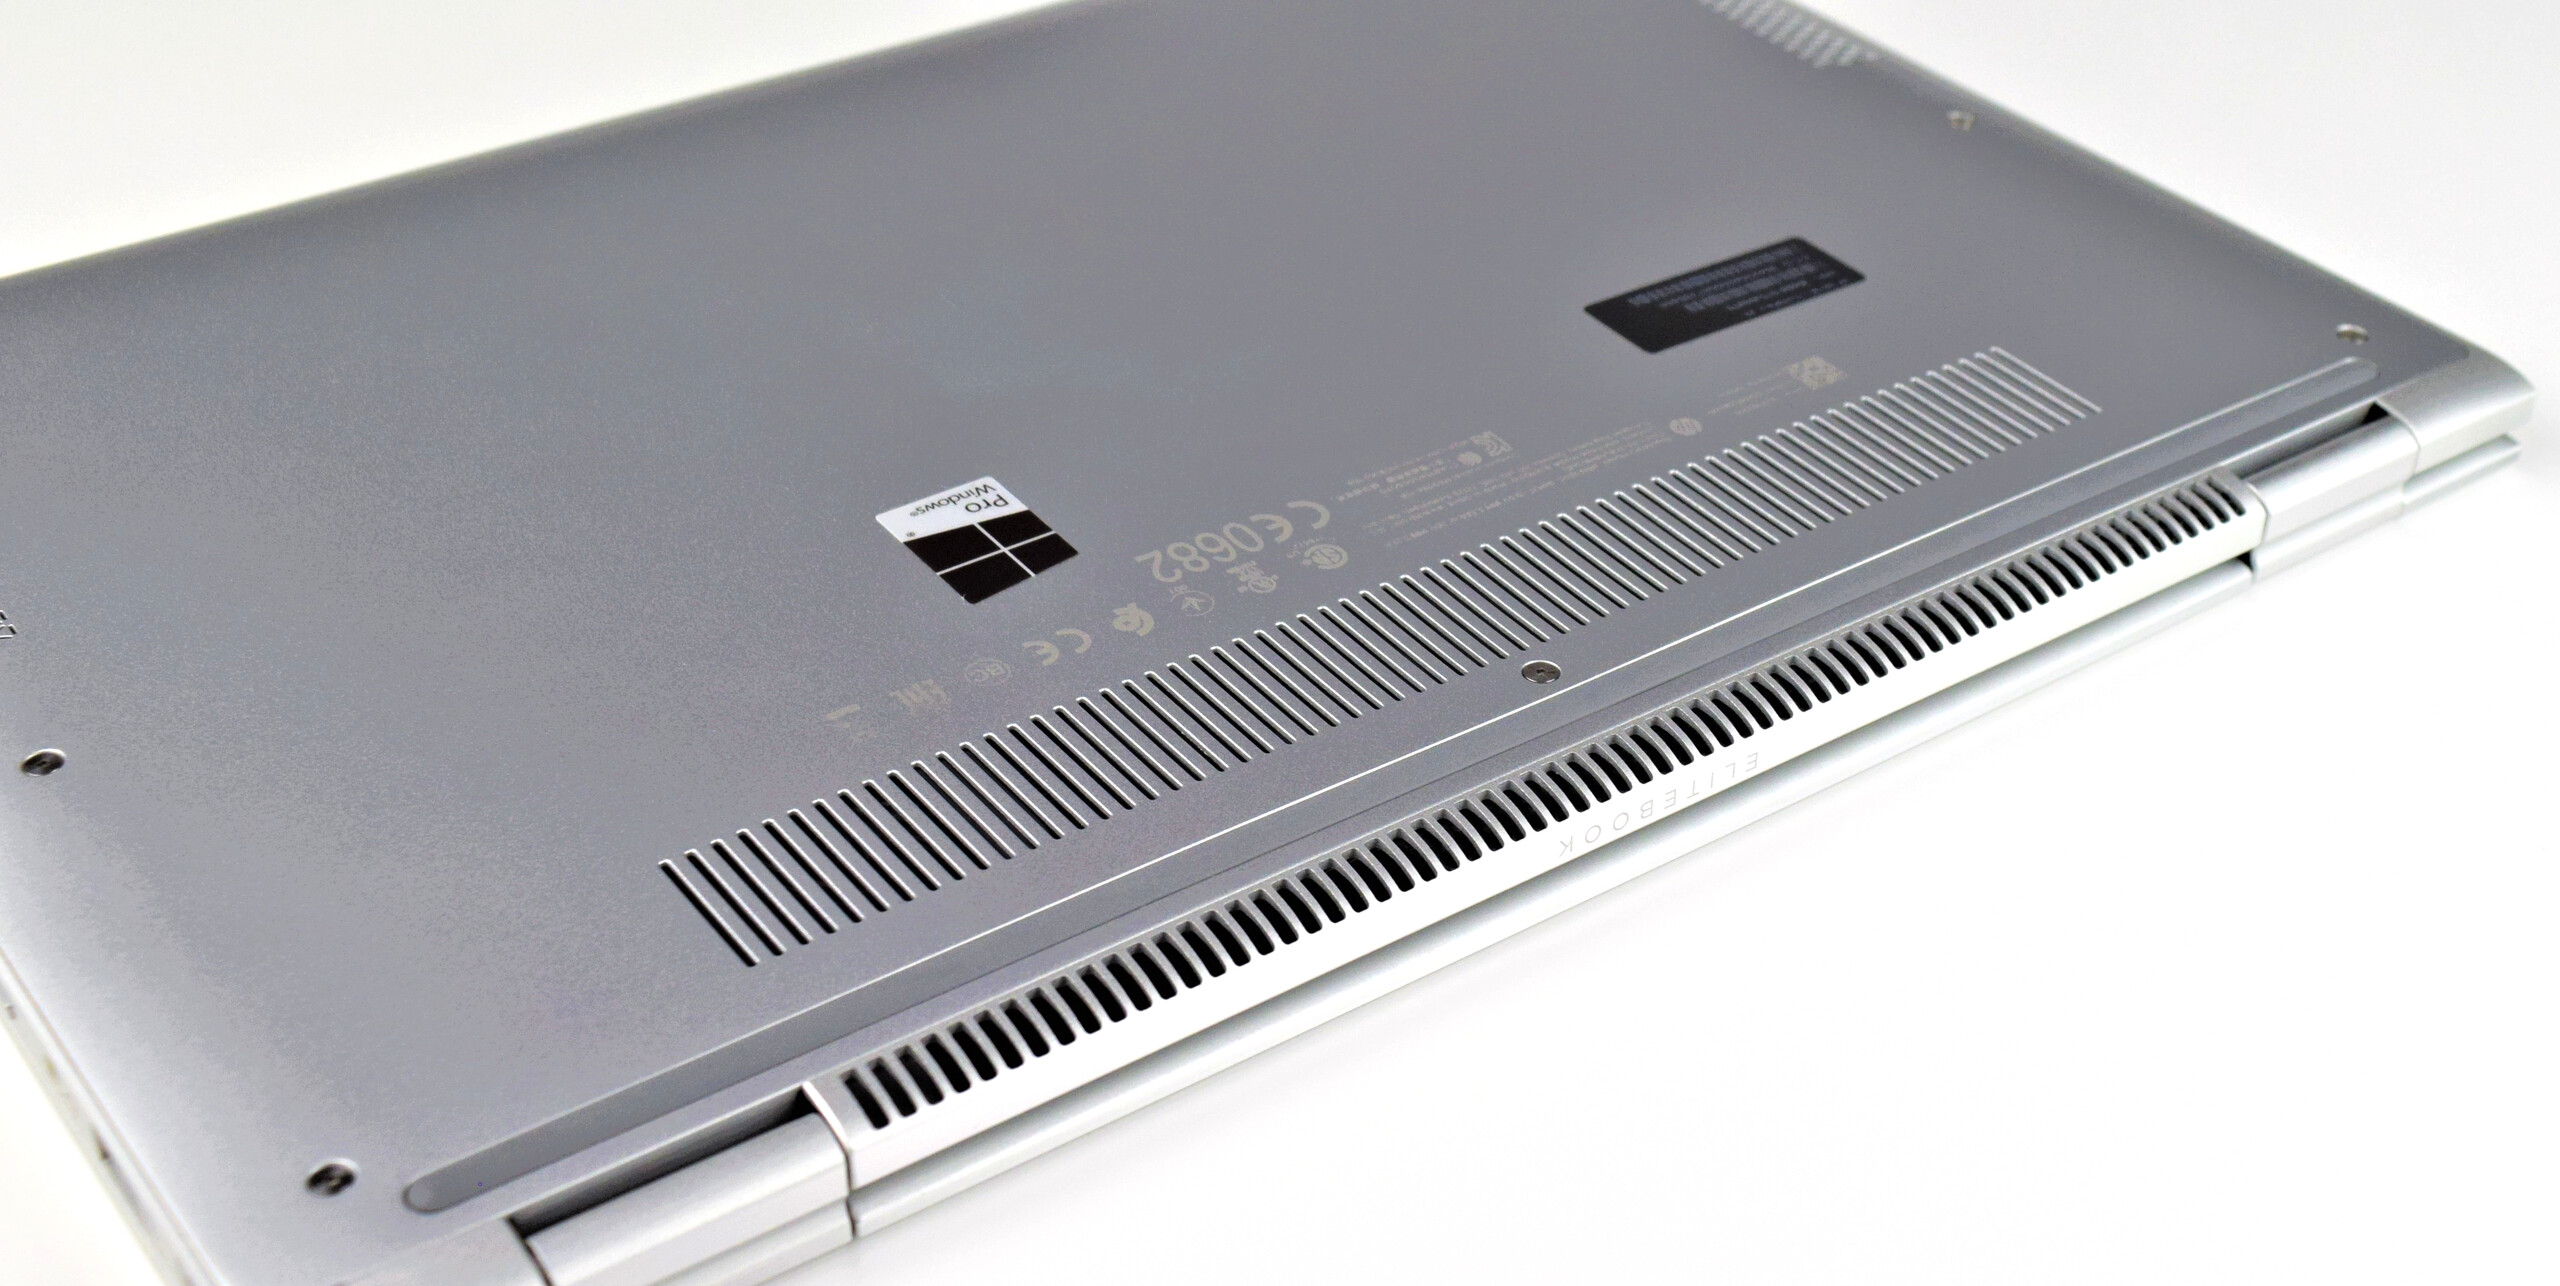
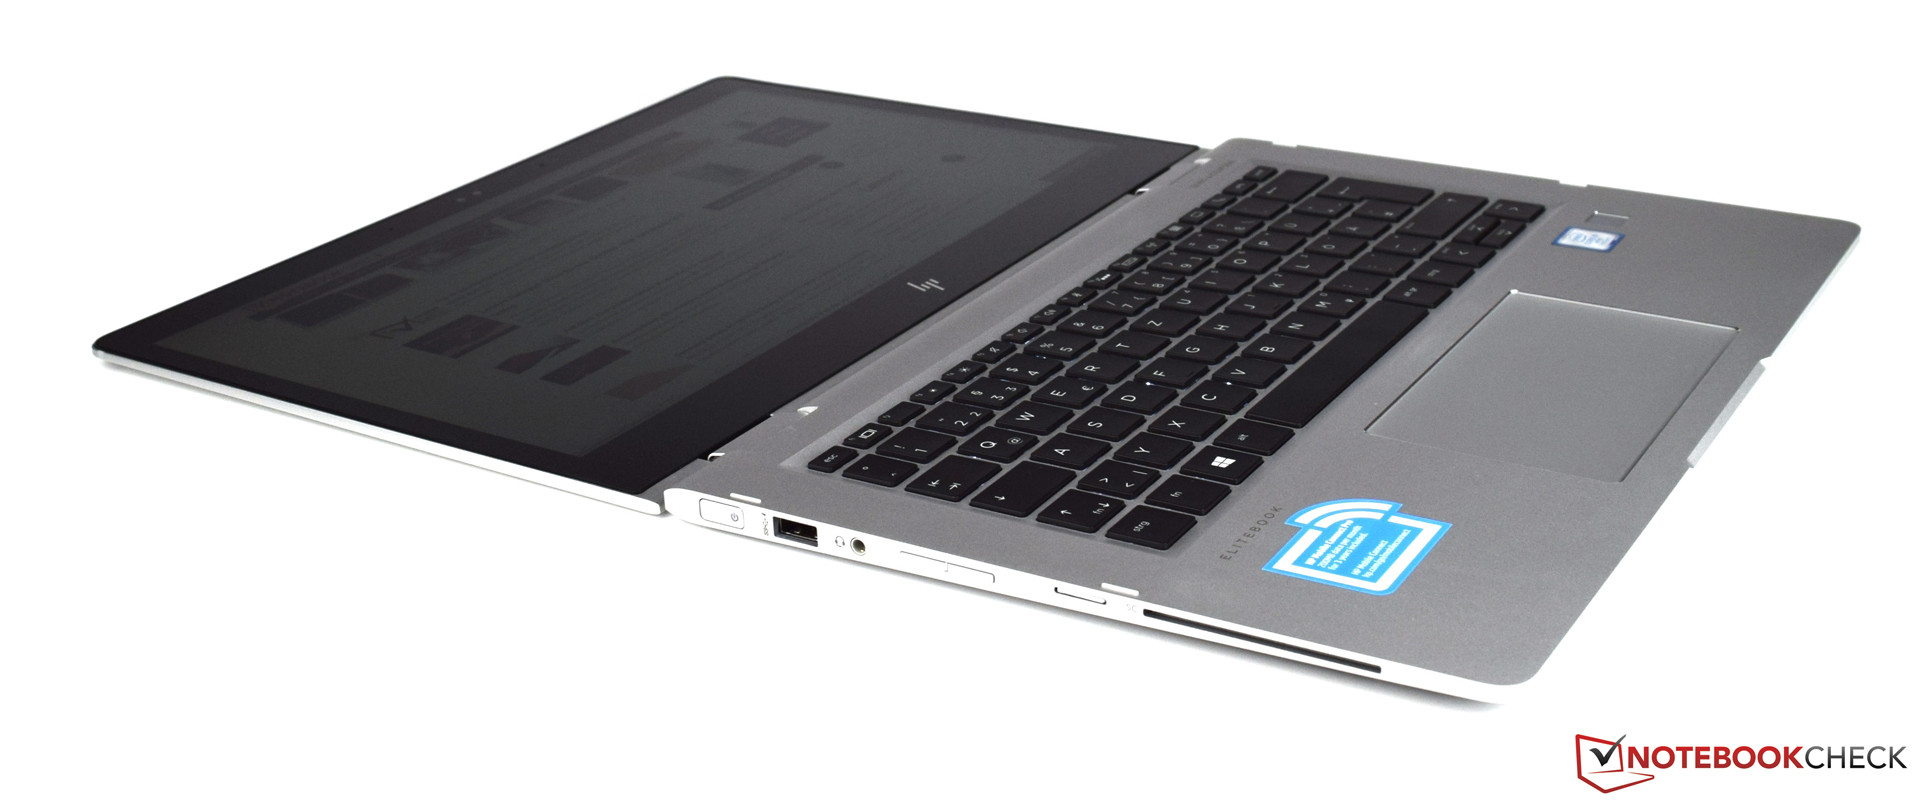
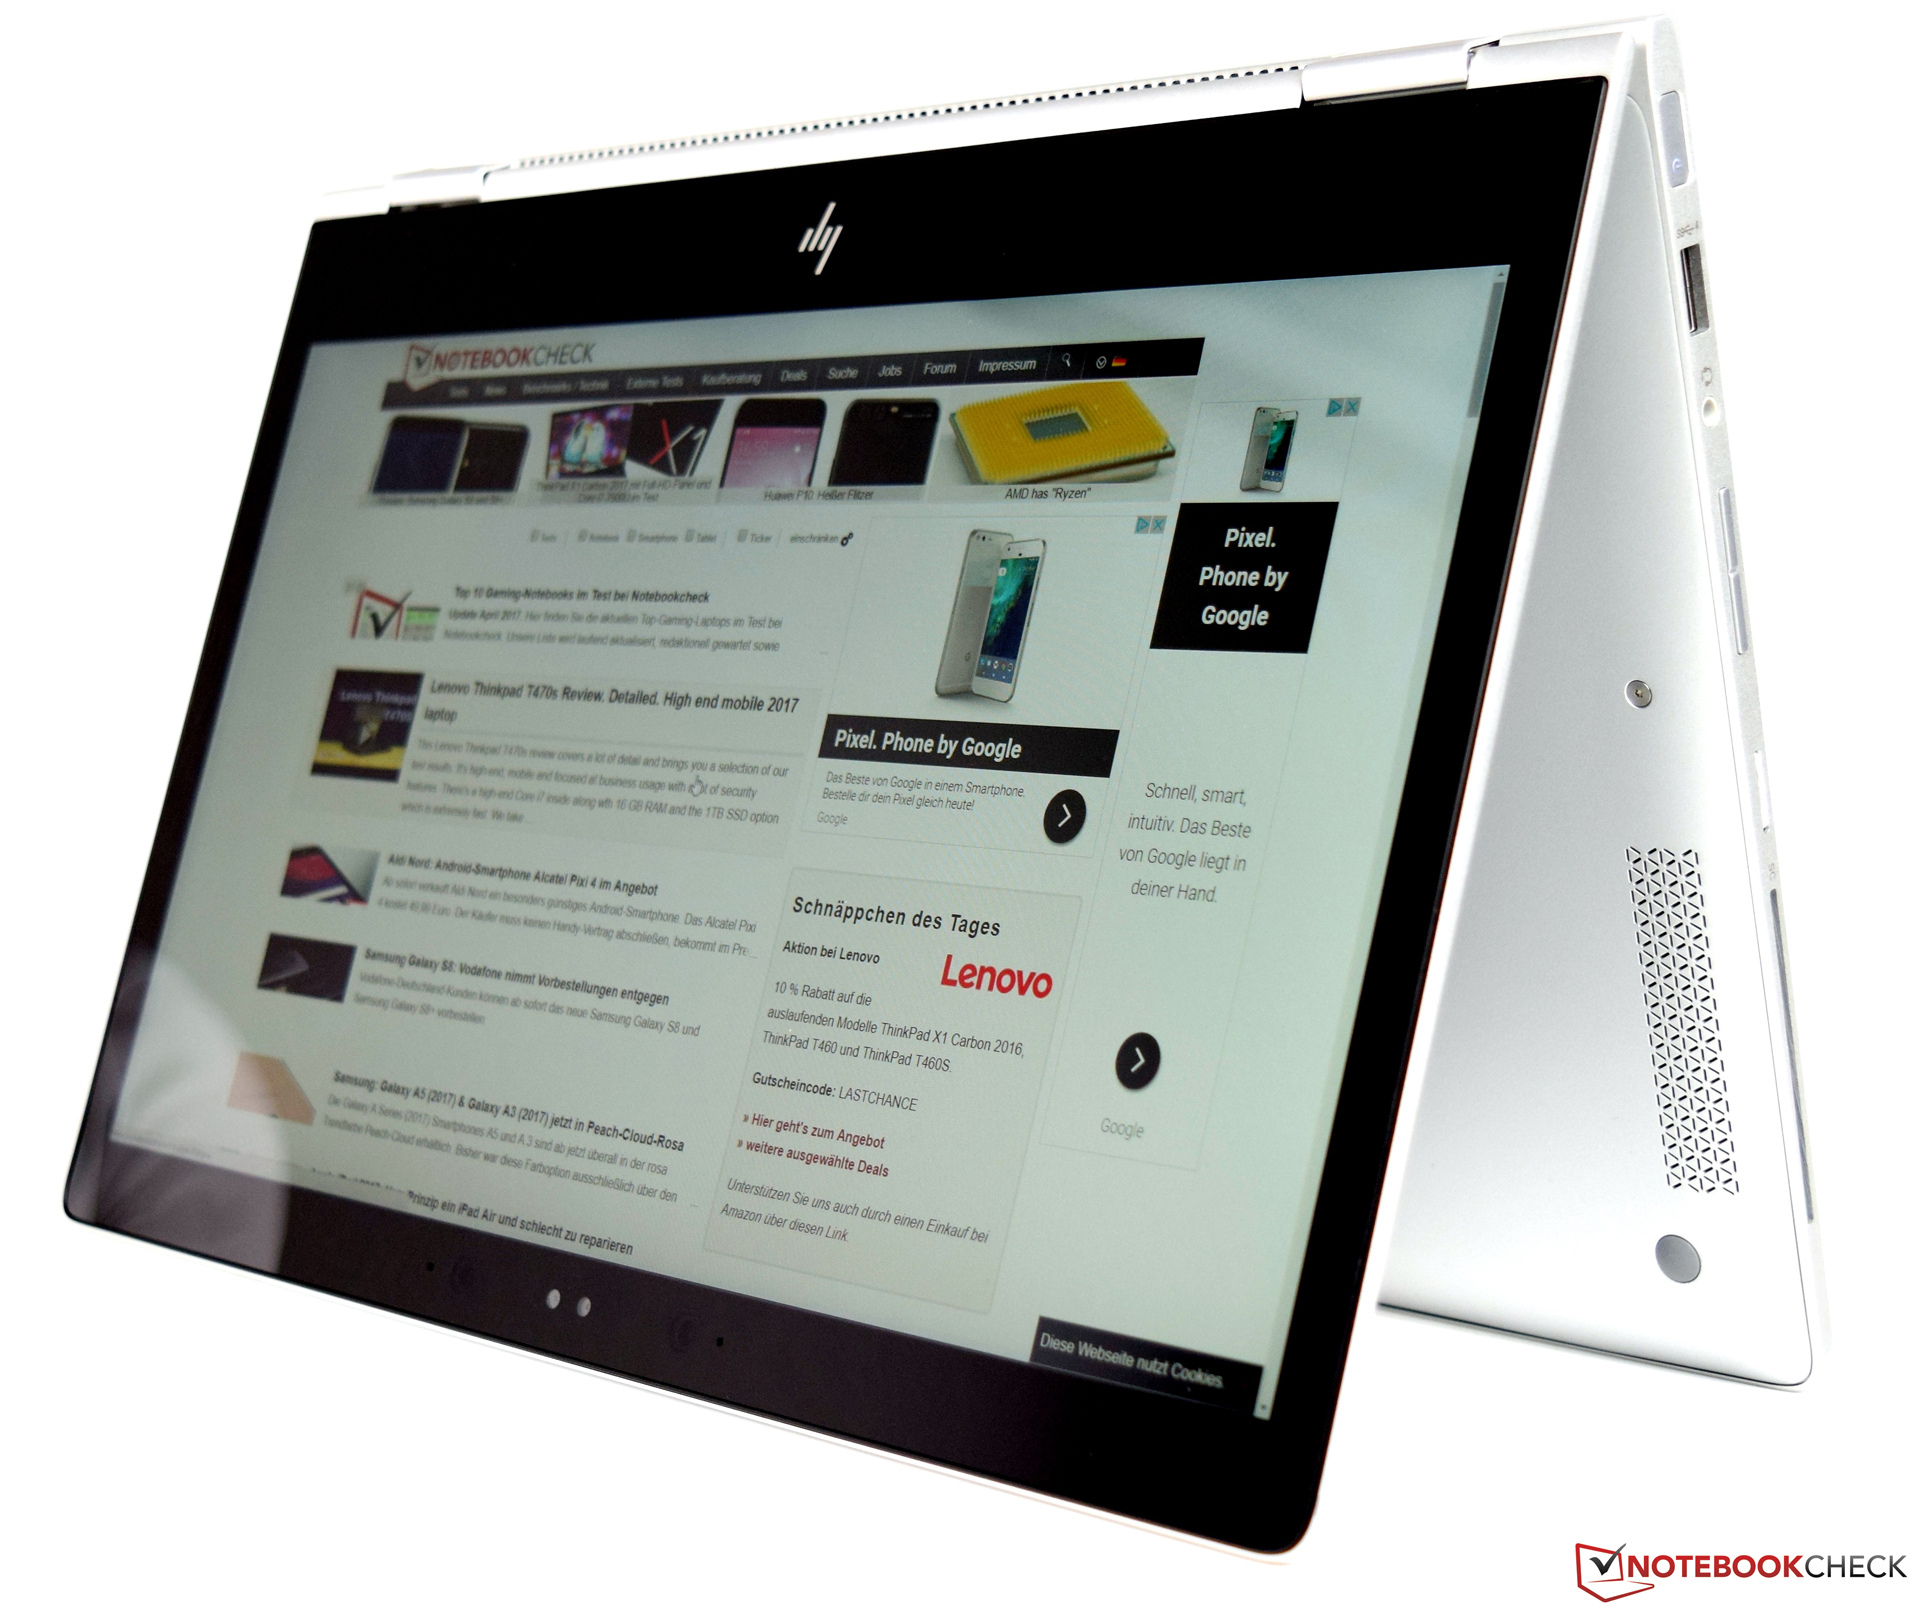
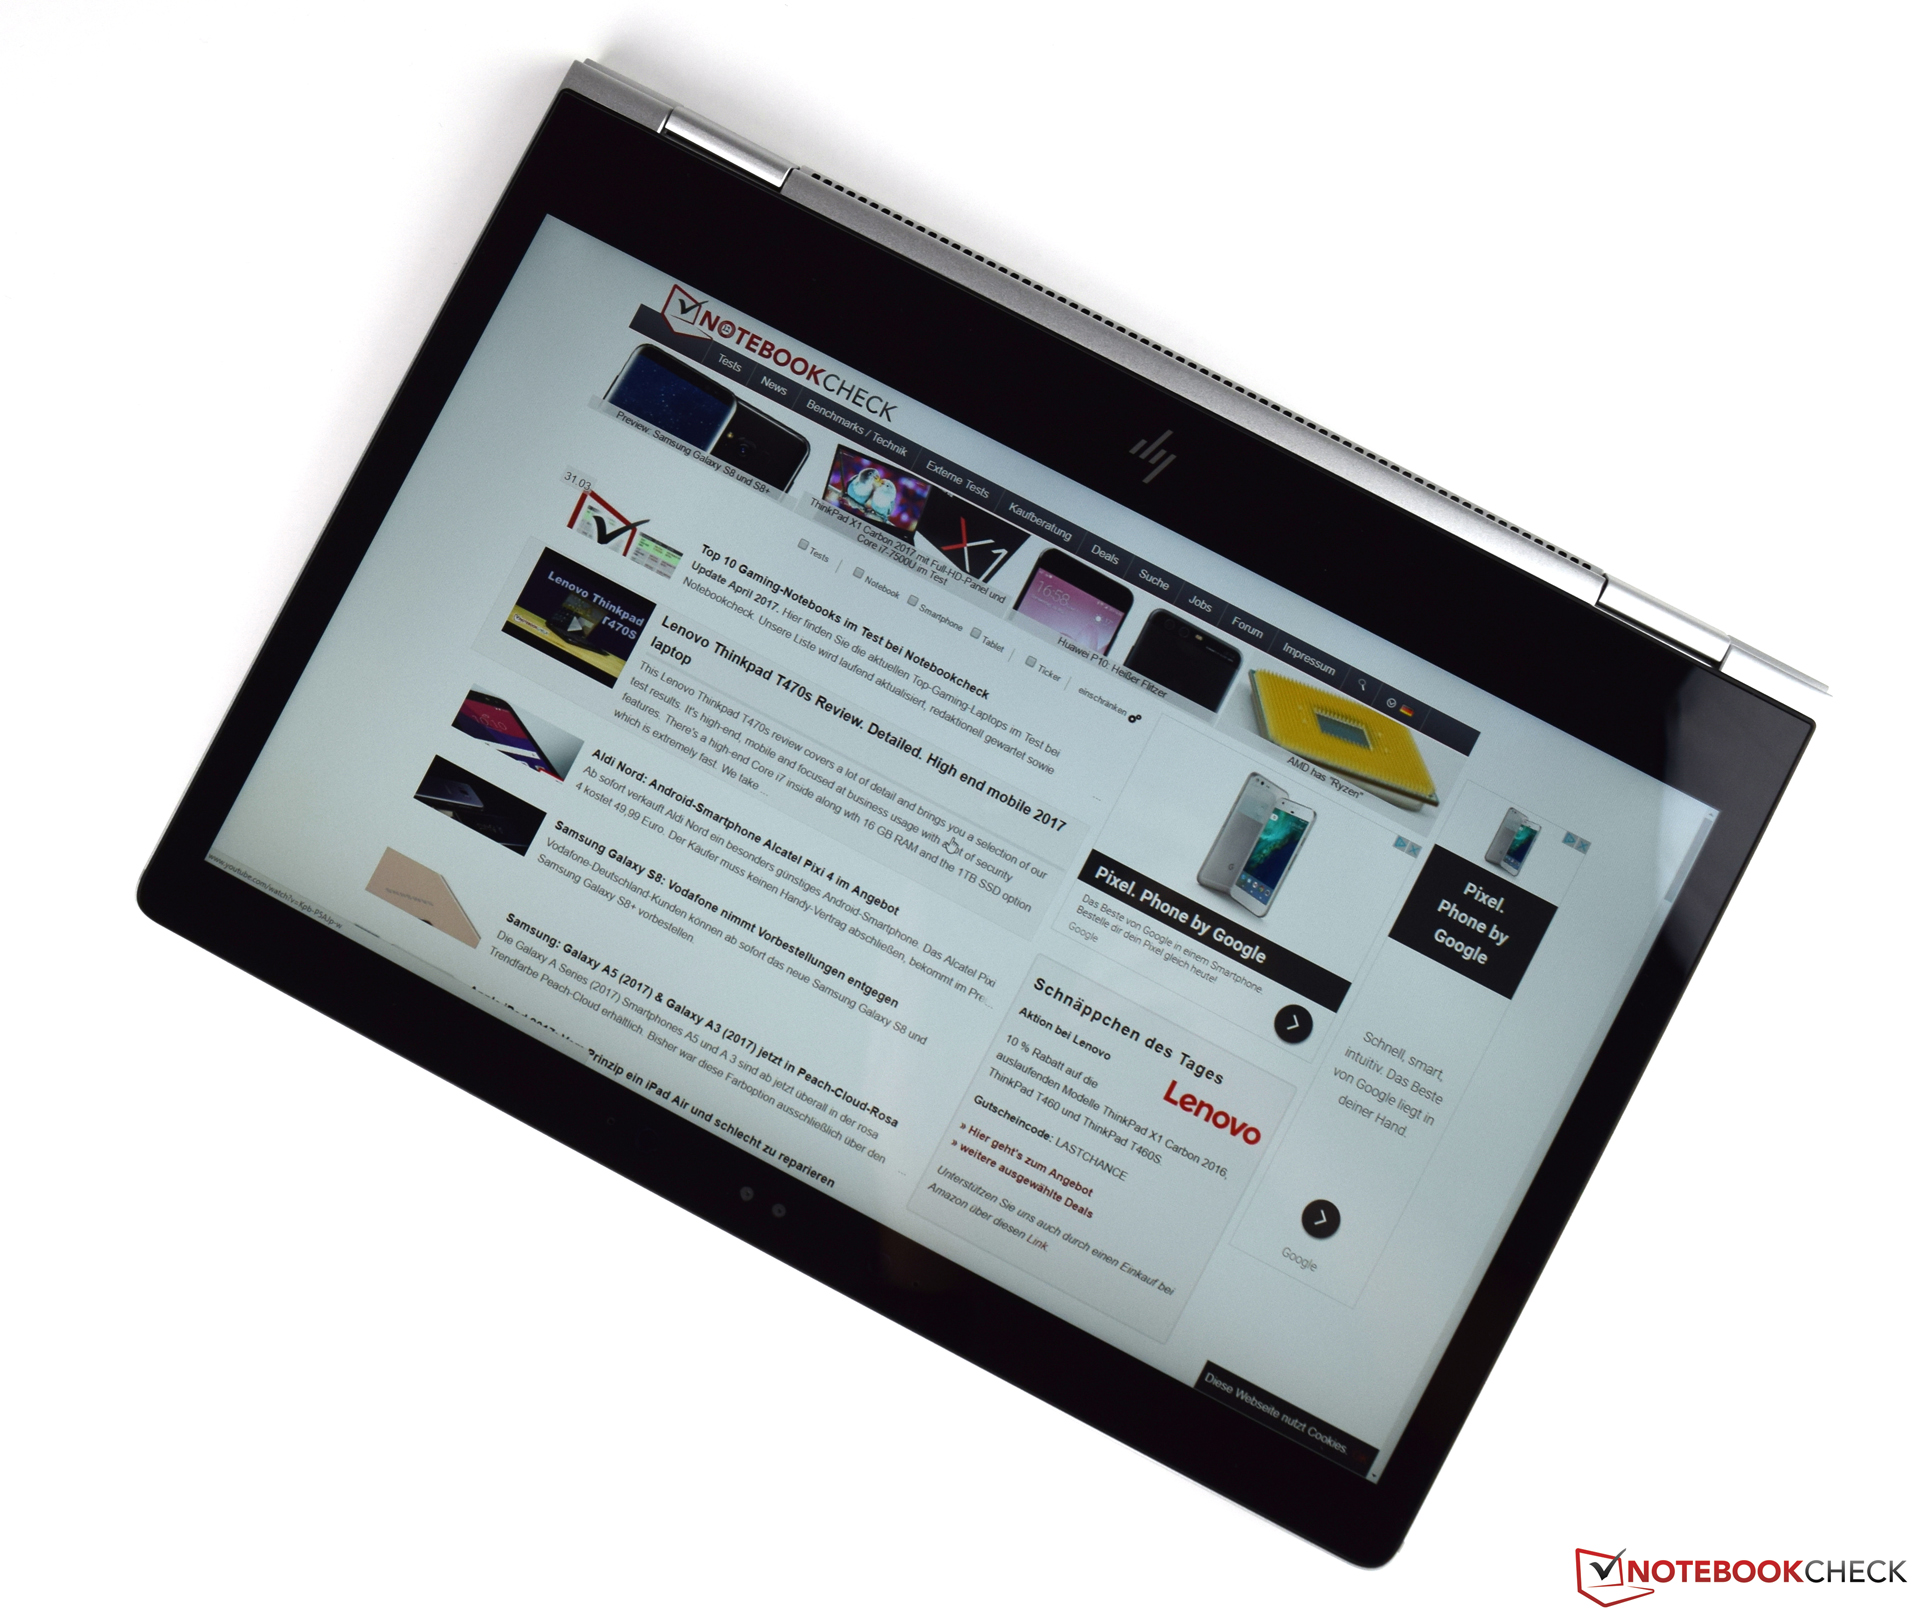
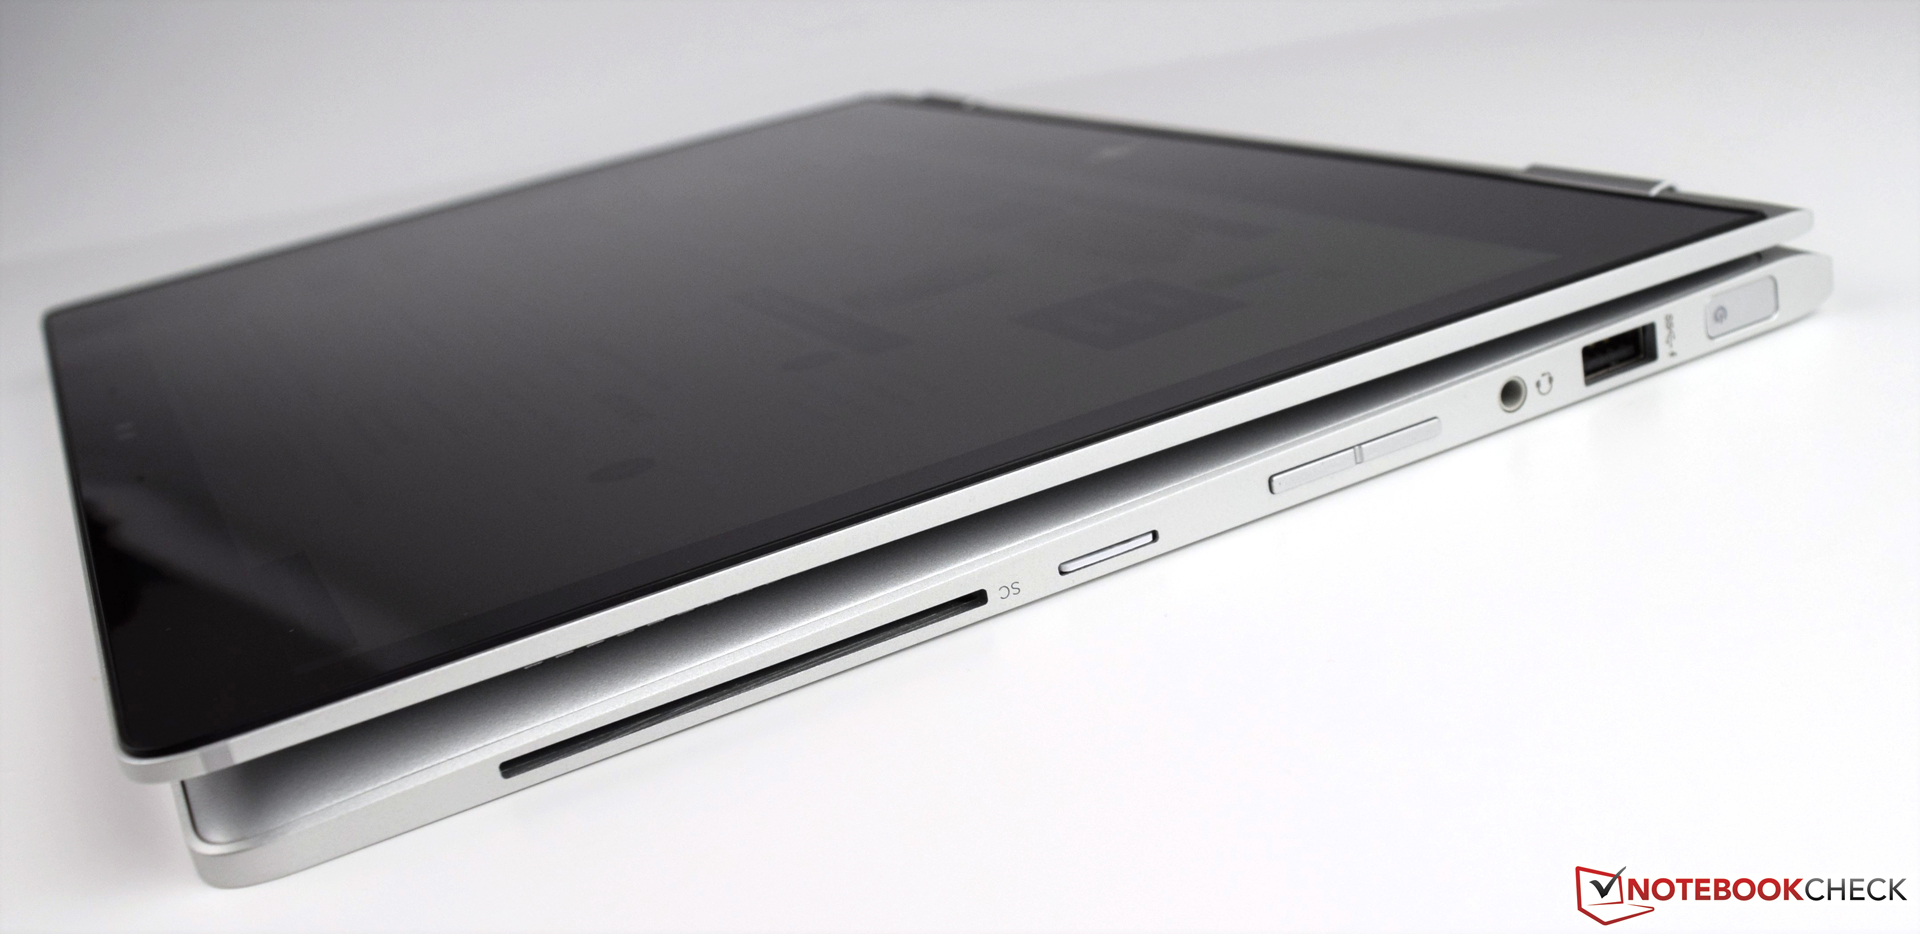
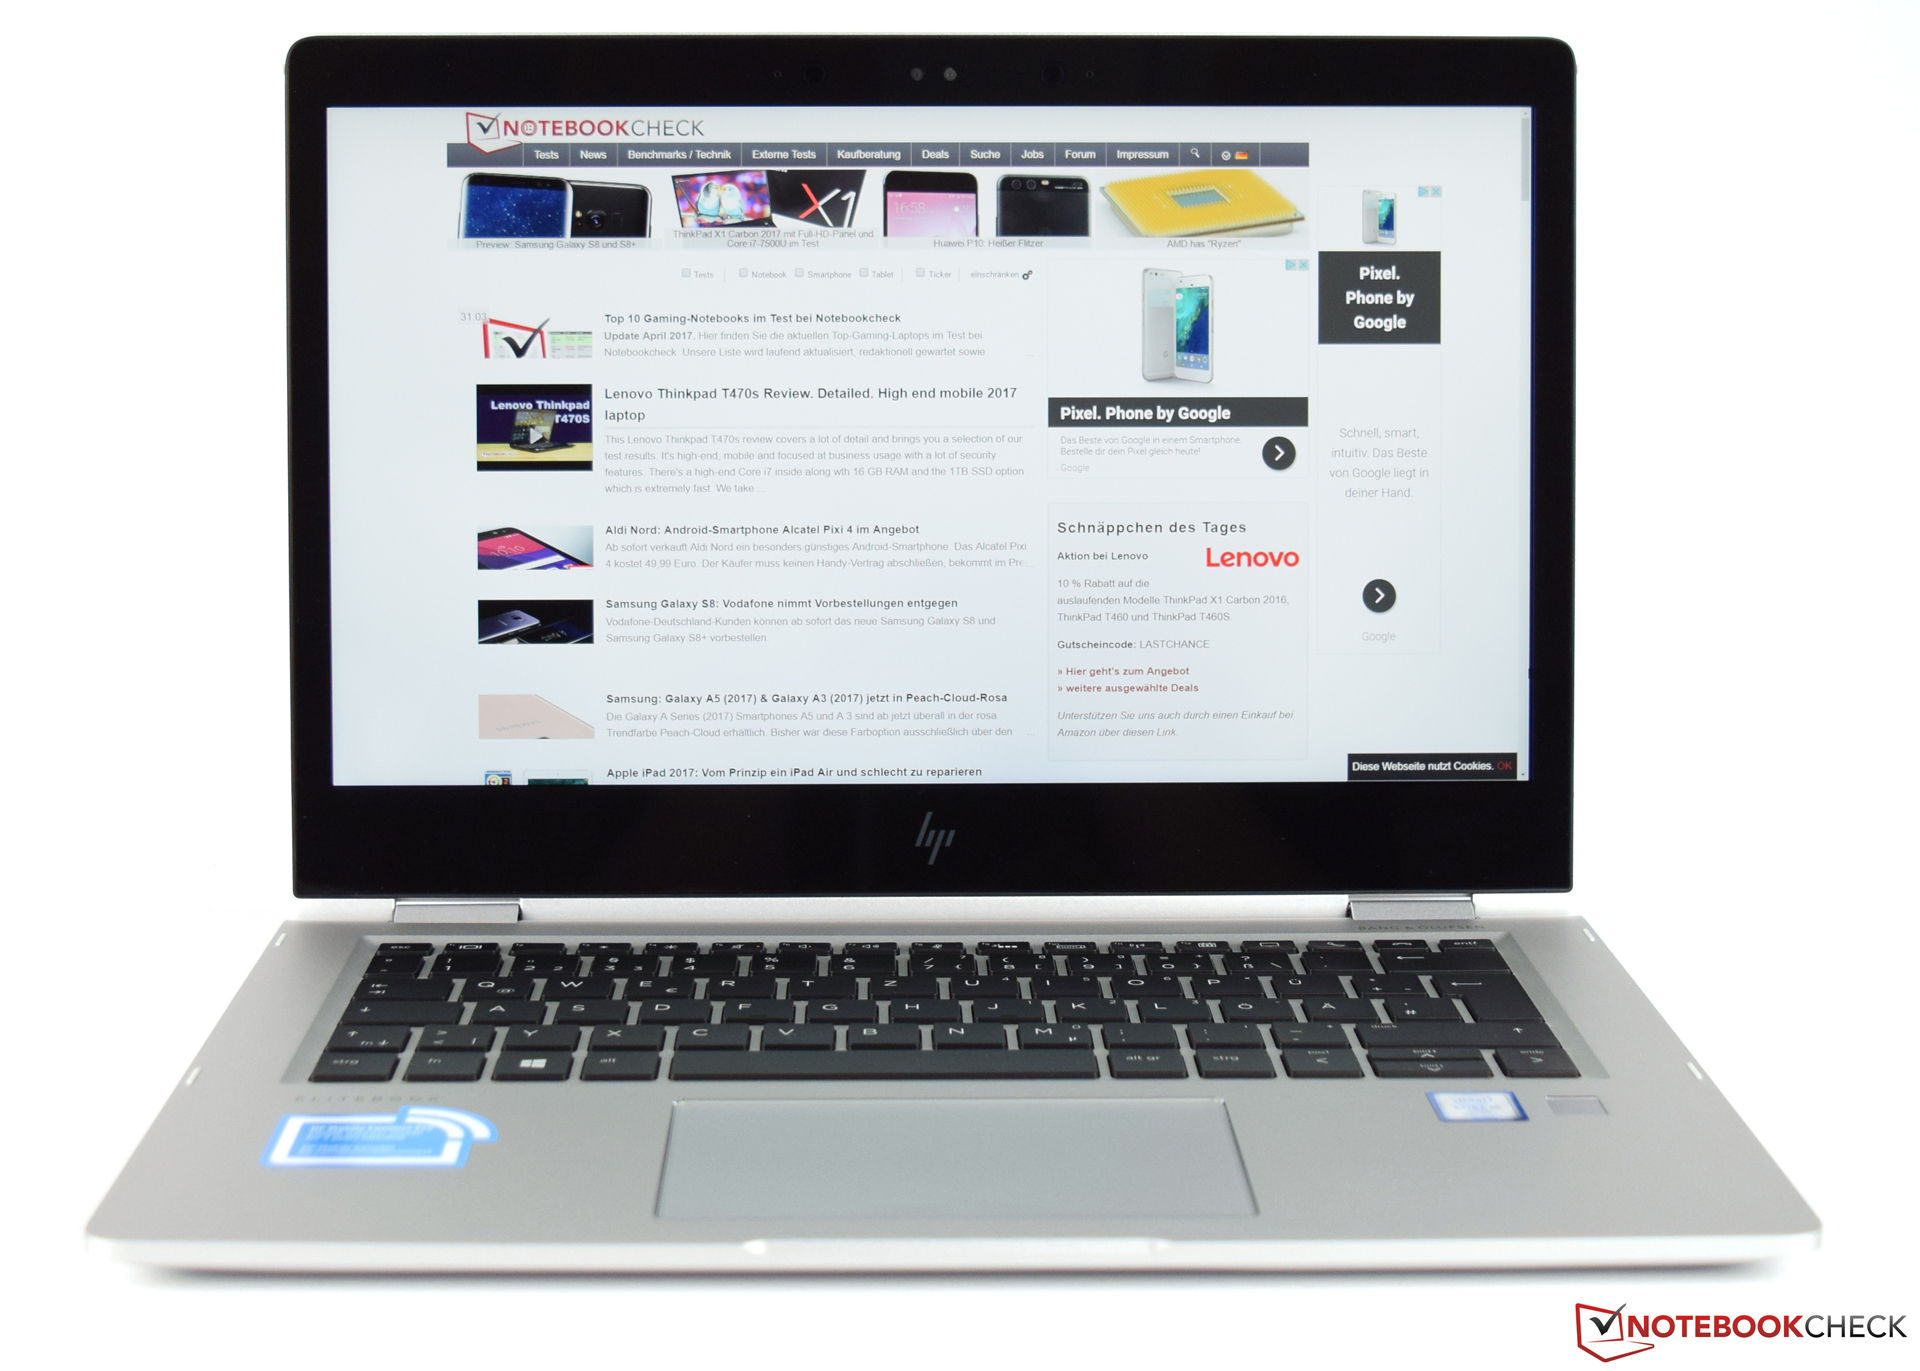
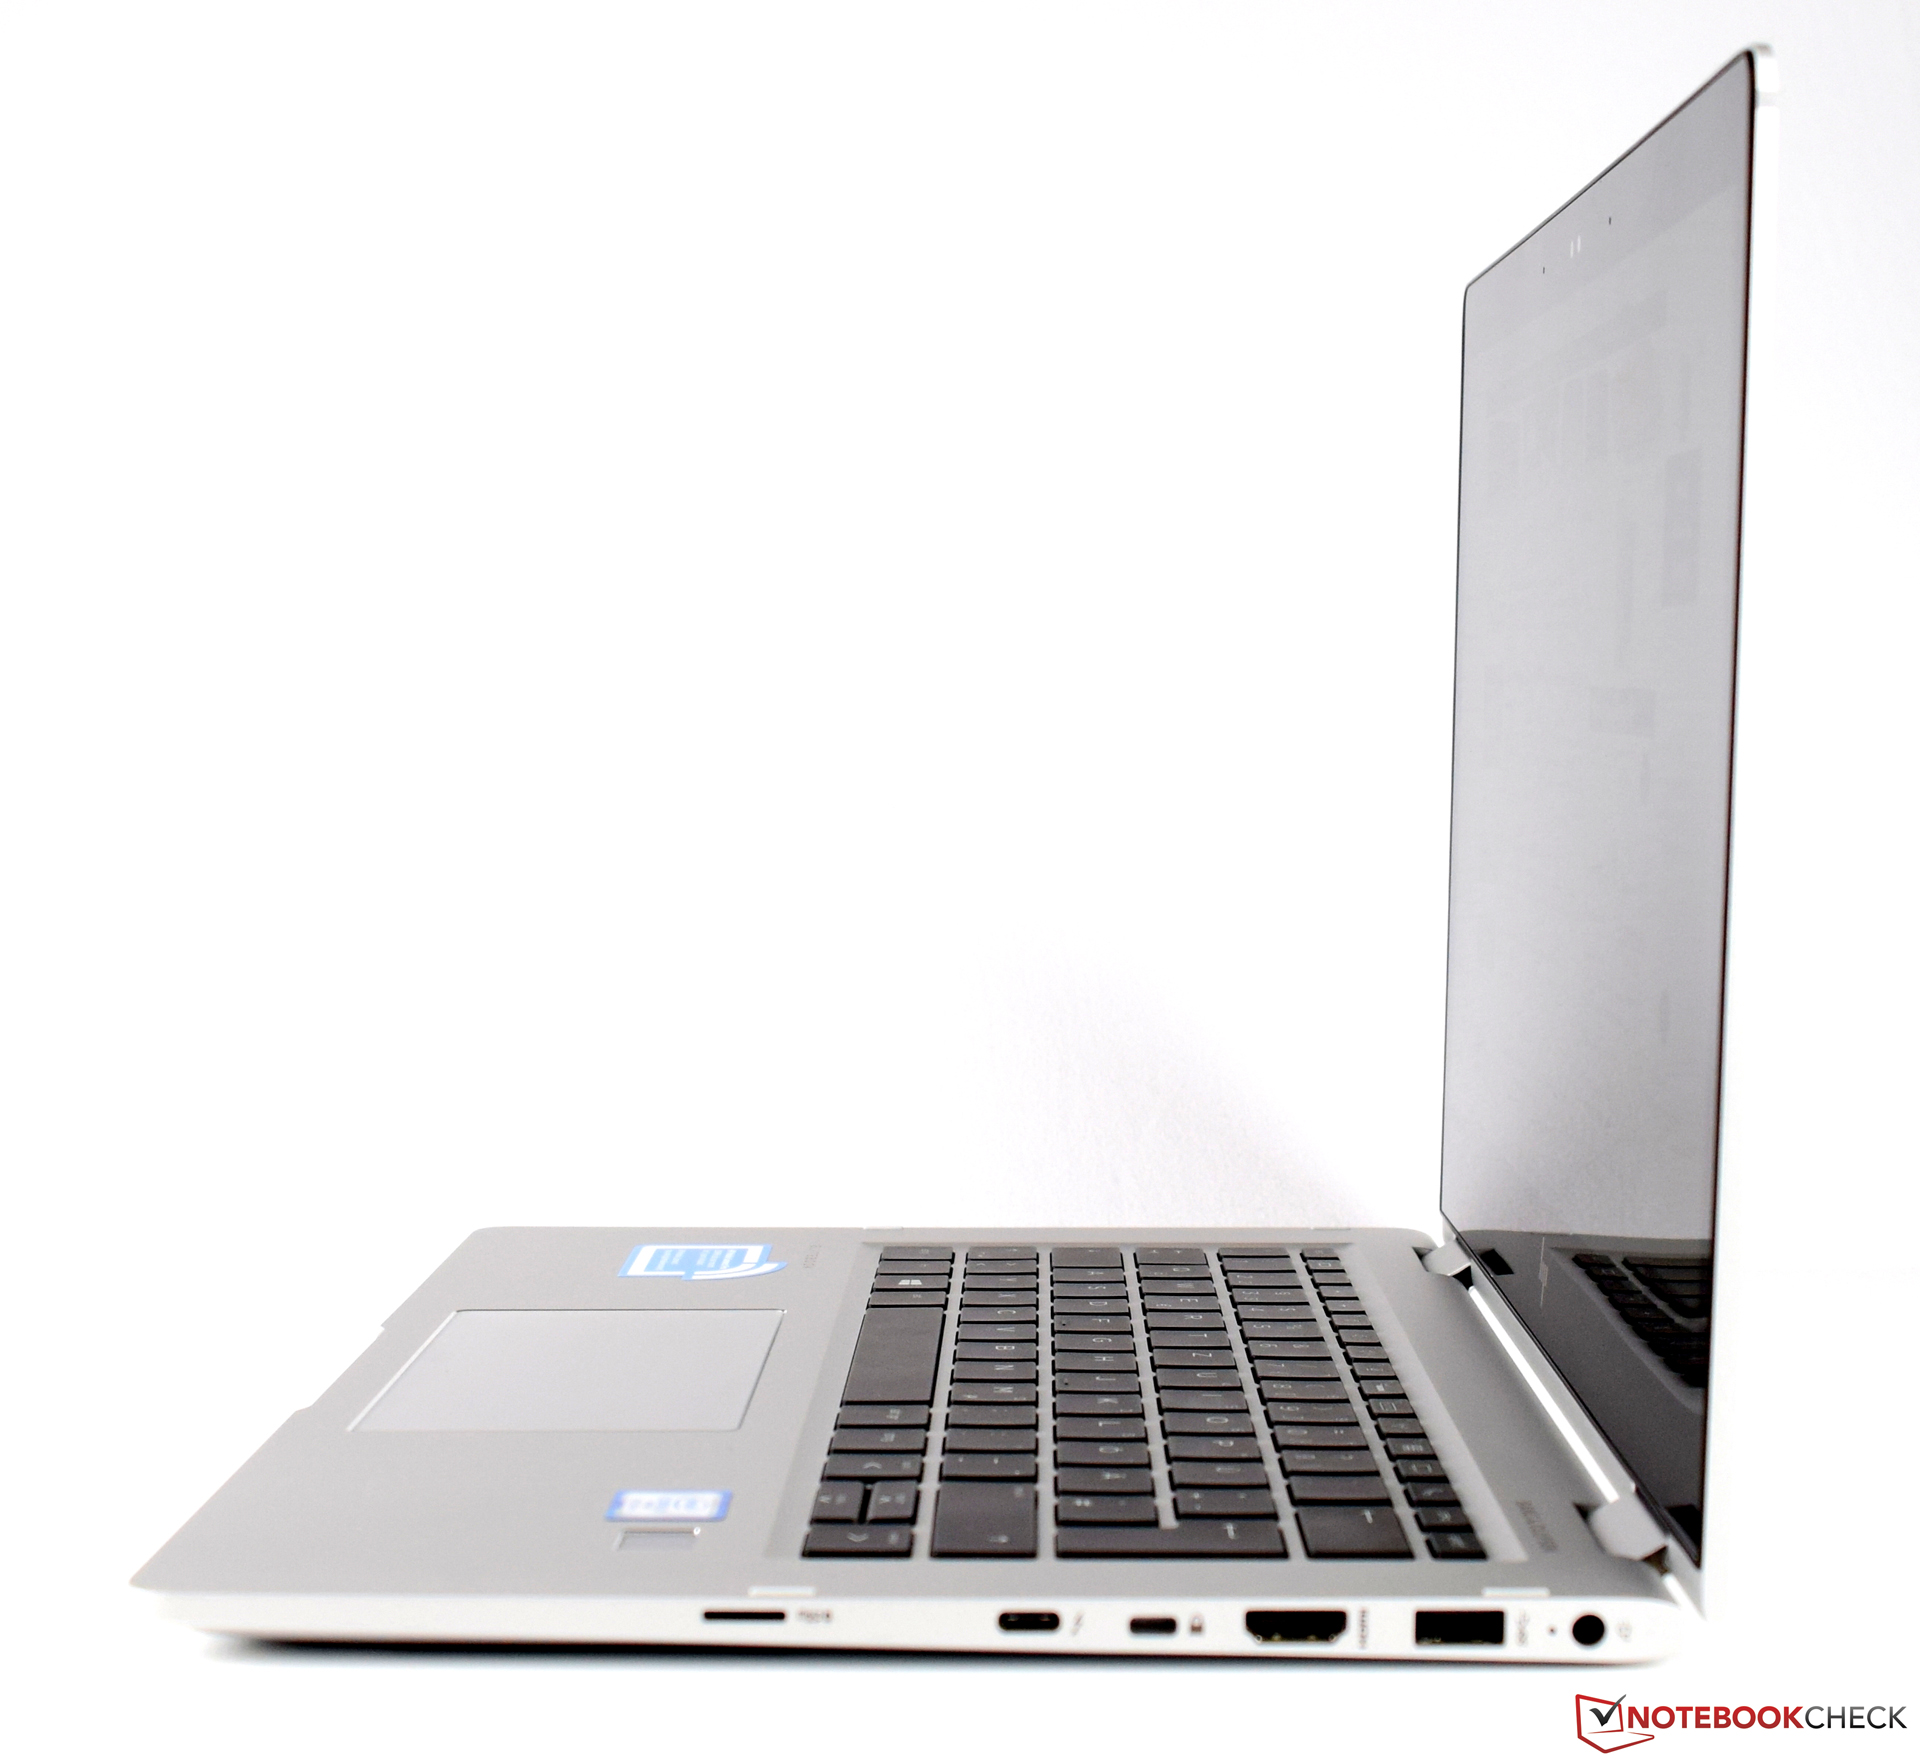
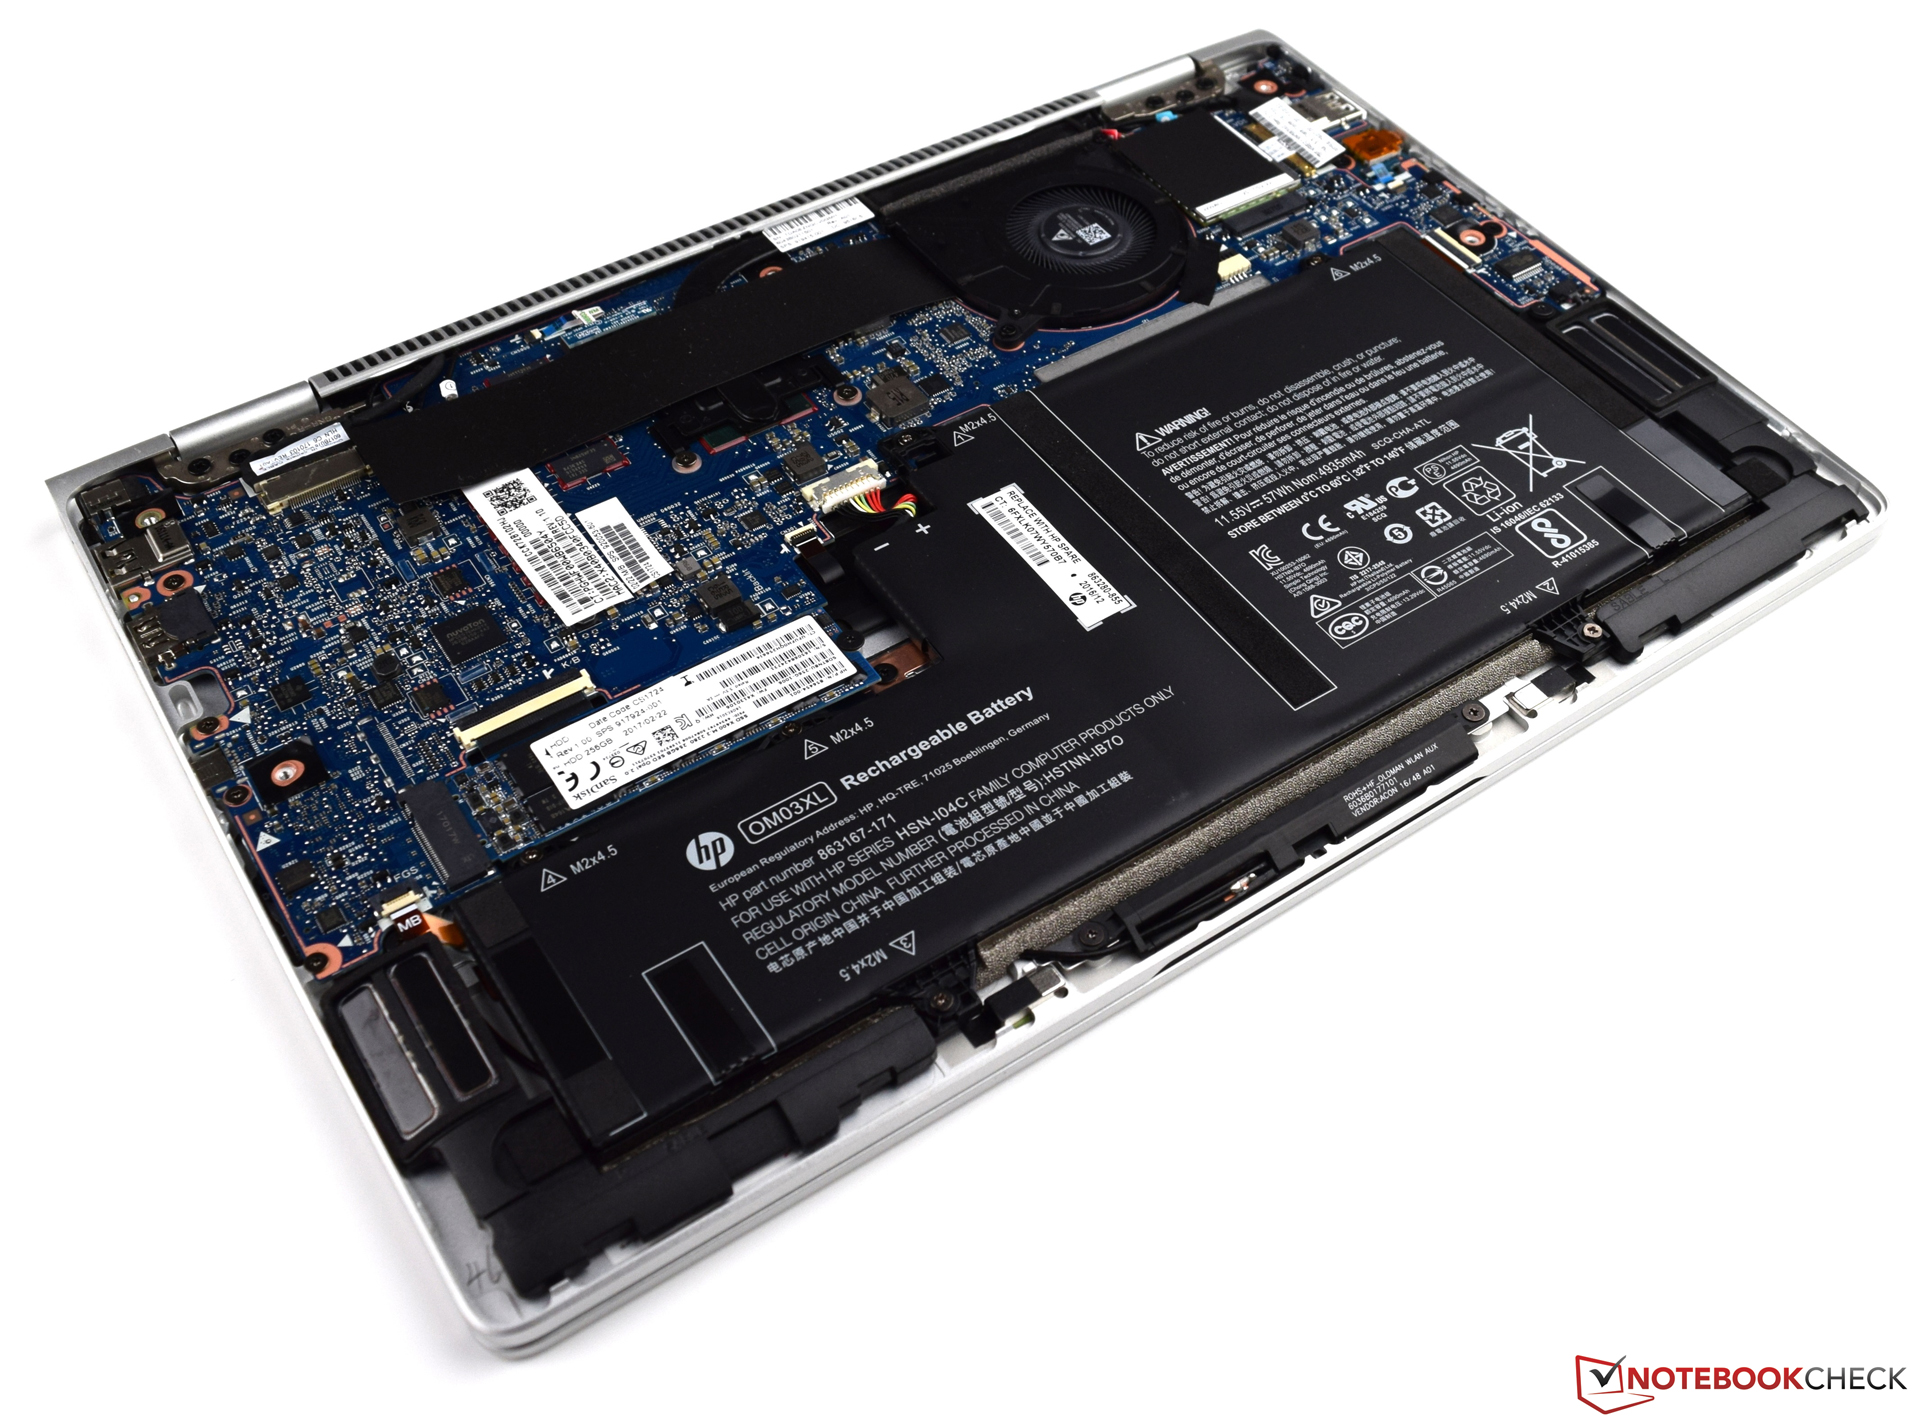
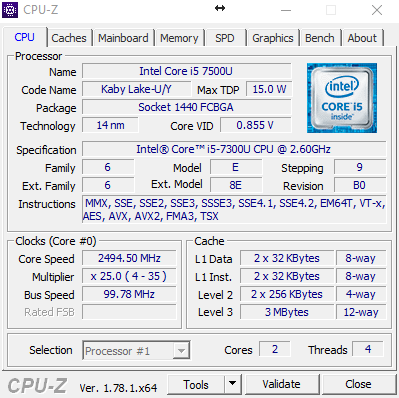
惠普EliteBook x360 1030 G2更接近于一台传统商务笔记本电脑。由于搭配360度屏幕转轴,它可以适合多种用途,而惠普主动式手写笔也可以帮助用户自由发挥创造力。我们测试机的丰富多媒体功能也是一个优势。除了游戏性能不足外,它可以成为一台出色的全能型笔记本电脑。作为一台为商务市场设计的笔记本电脑,它提供了完备的安全功能——这意味着即使是入门级配置的价位也较高。我们的测试机搭配英特尔酷睿i5-7300U处理器和8GB内存。容量256GB的固态硬盘保证了足够的存储空间,而全高清屏幕也对触控输入响应灵敏。这个配置型号在测试时售价2000欧元(约14771人民币)。
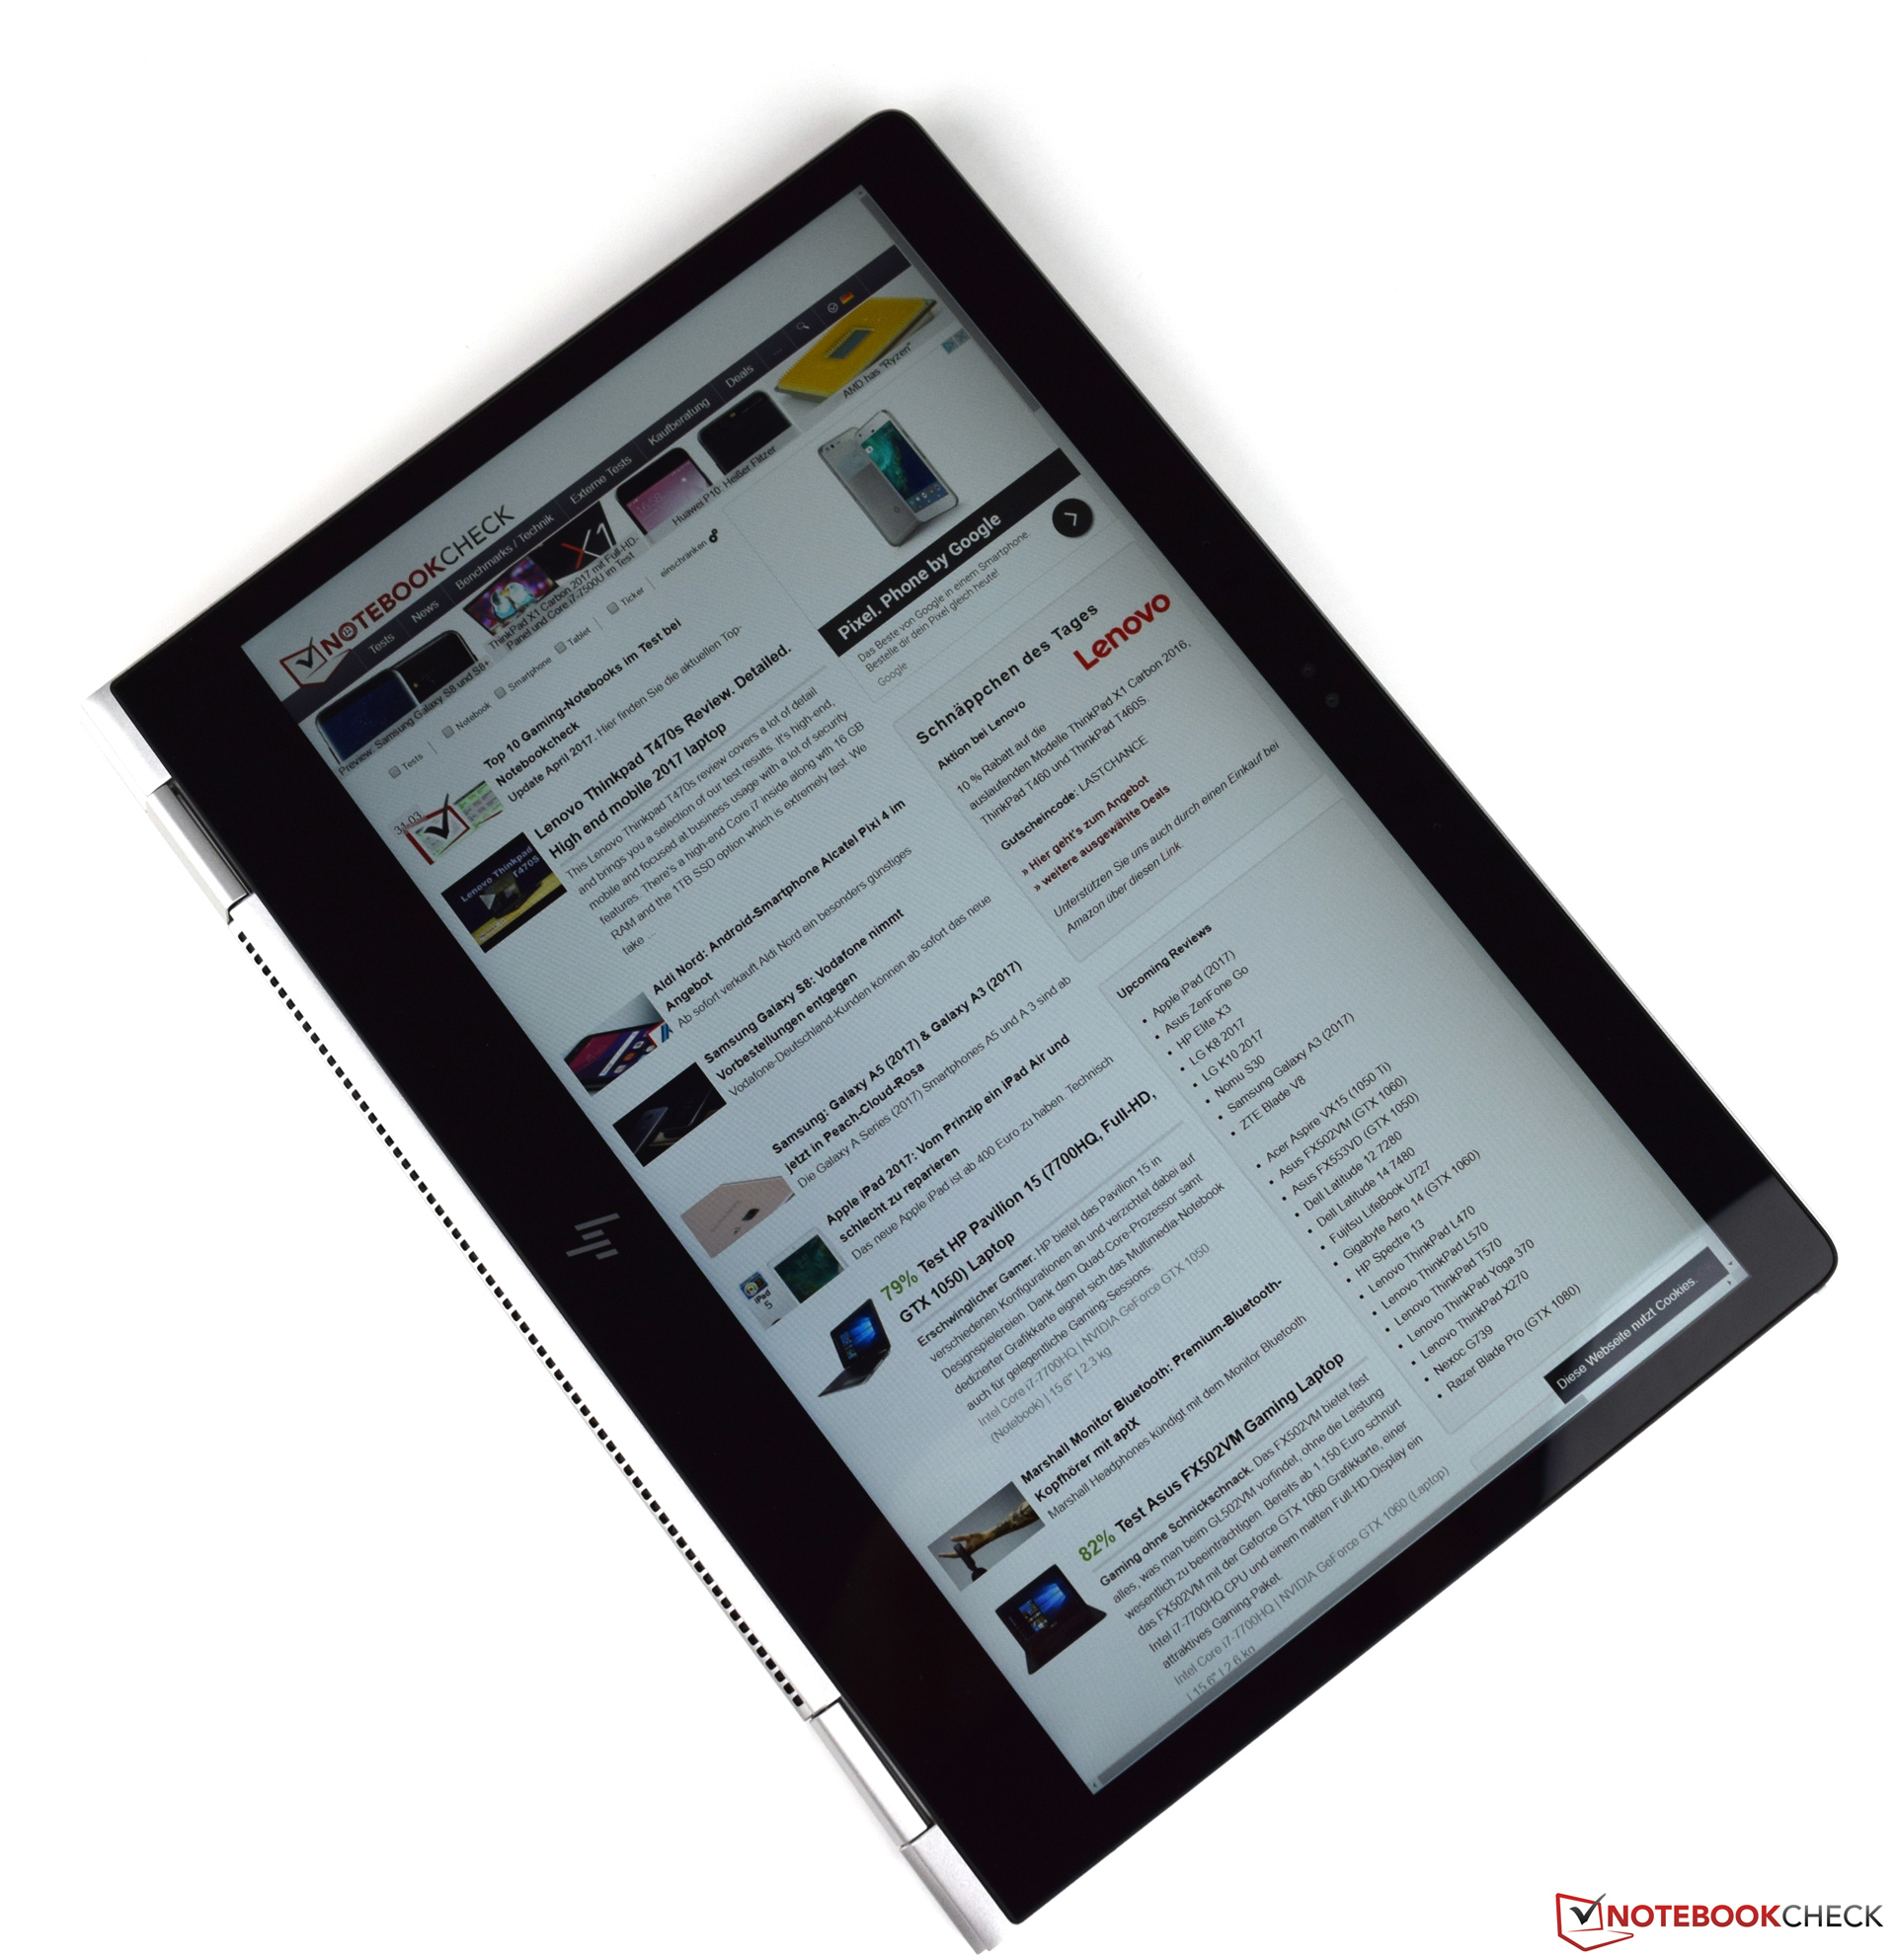
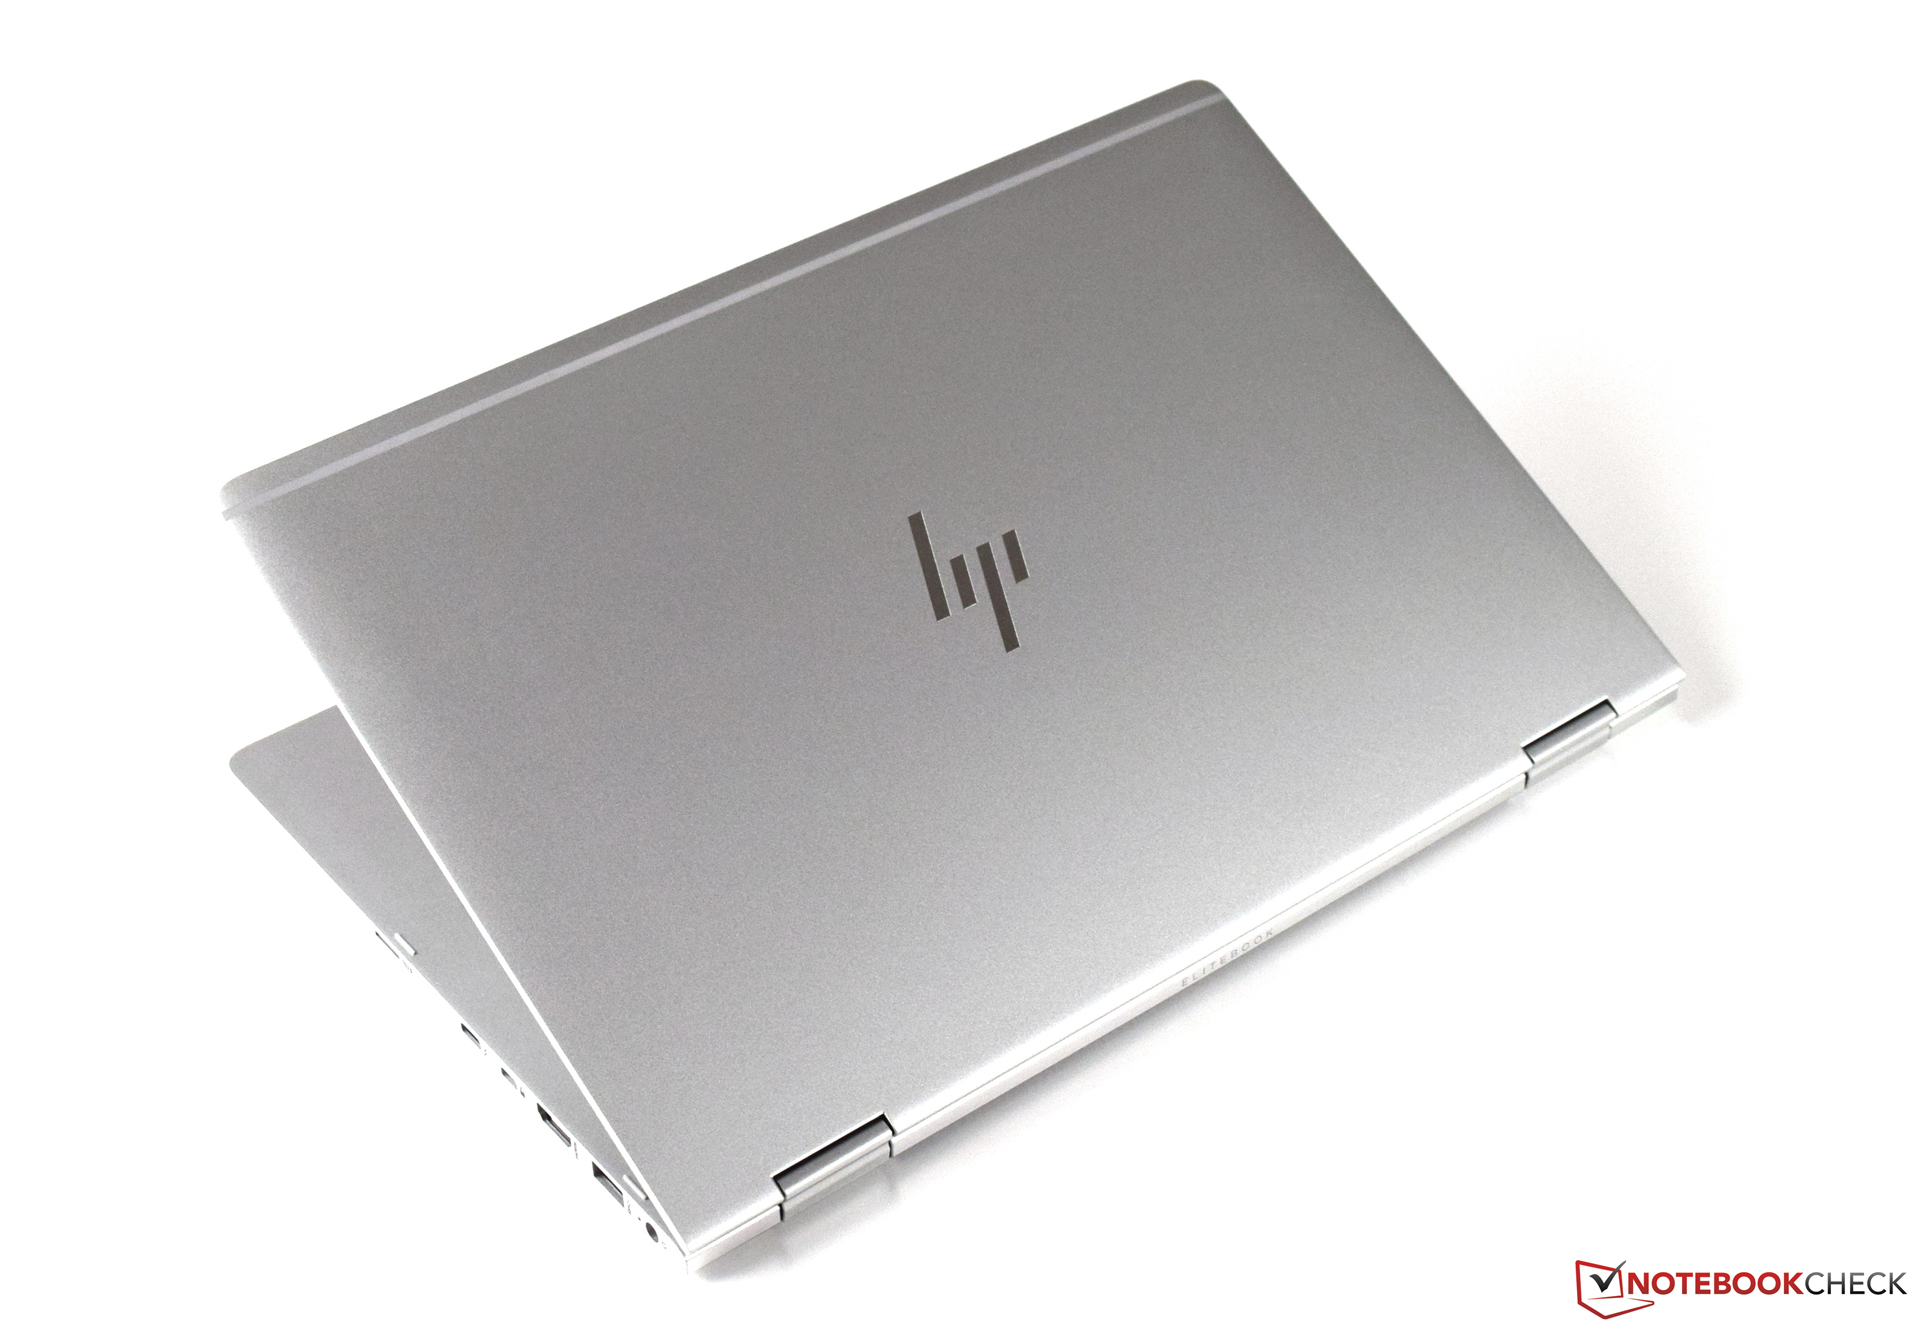
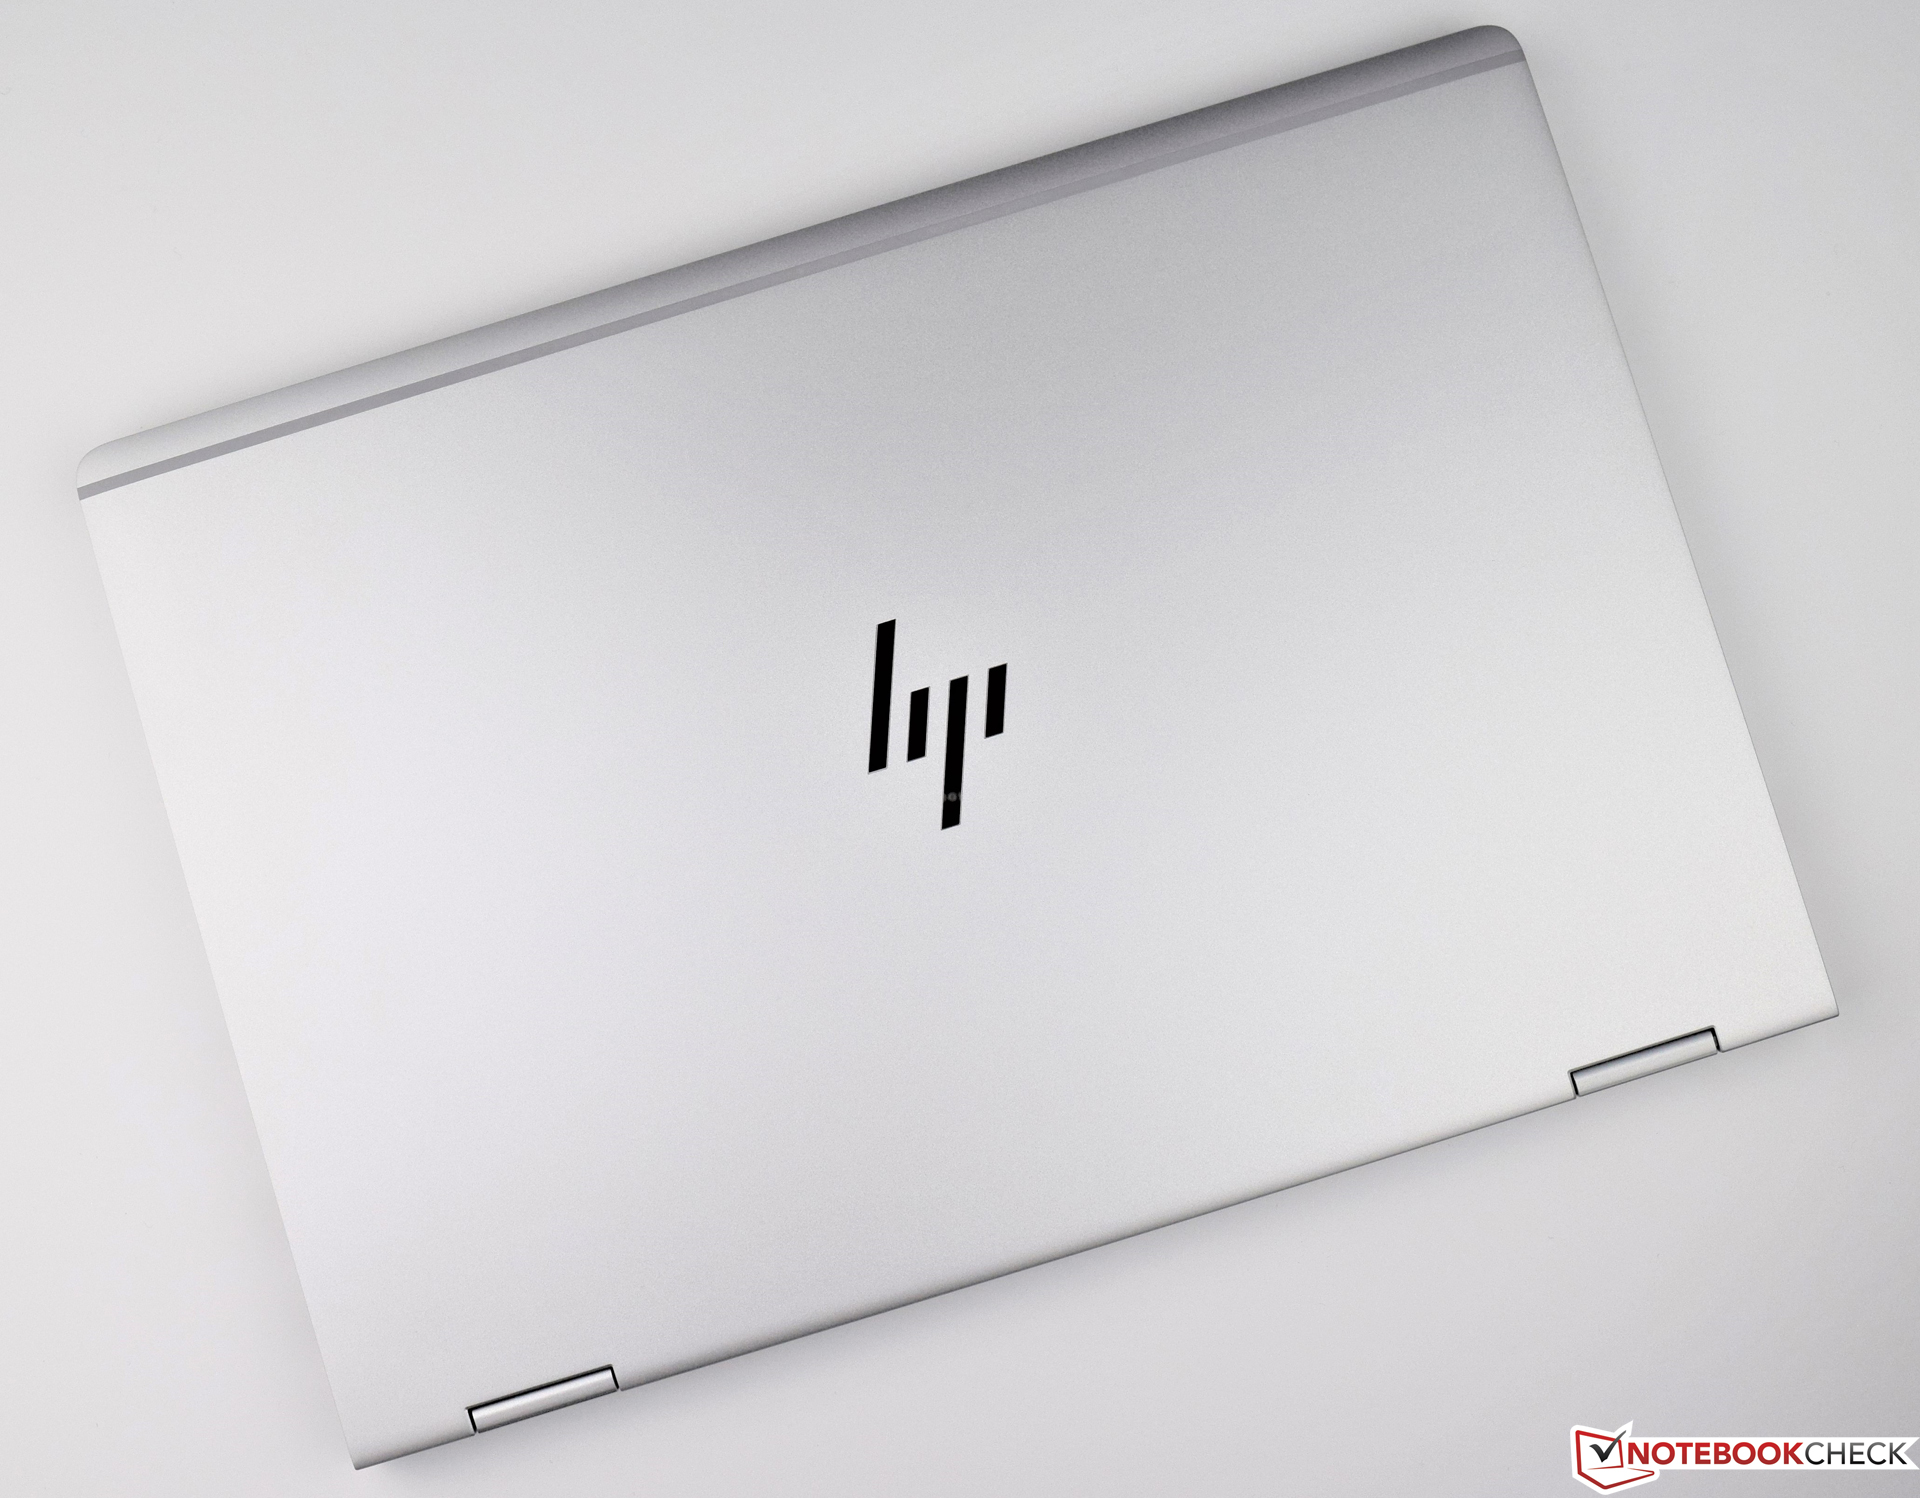
惠普设计了一台十分有魅力的设备。EliteBook x360 1030 G2多变全能,超长电池续航也让我们十分满意。
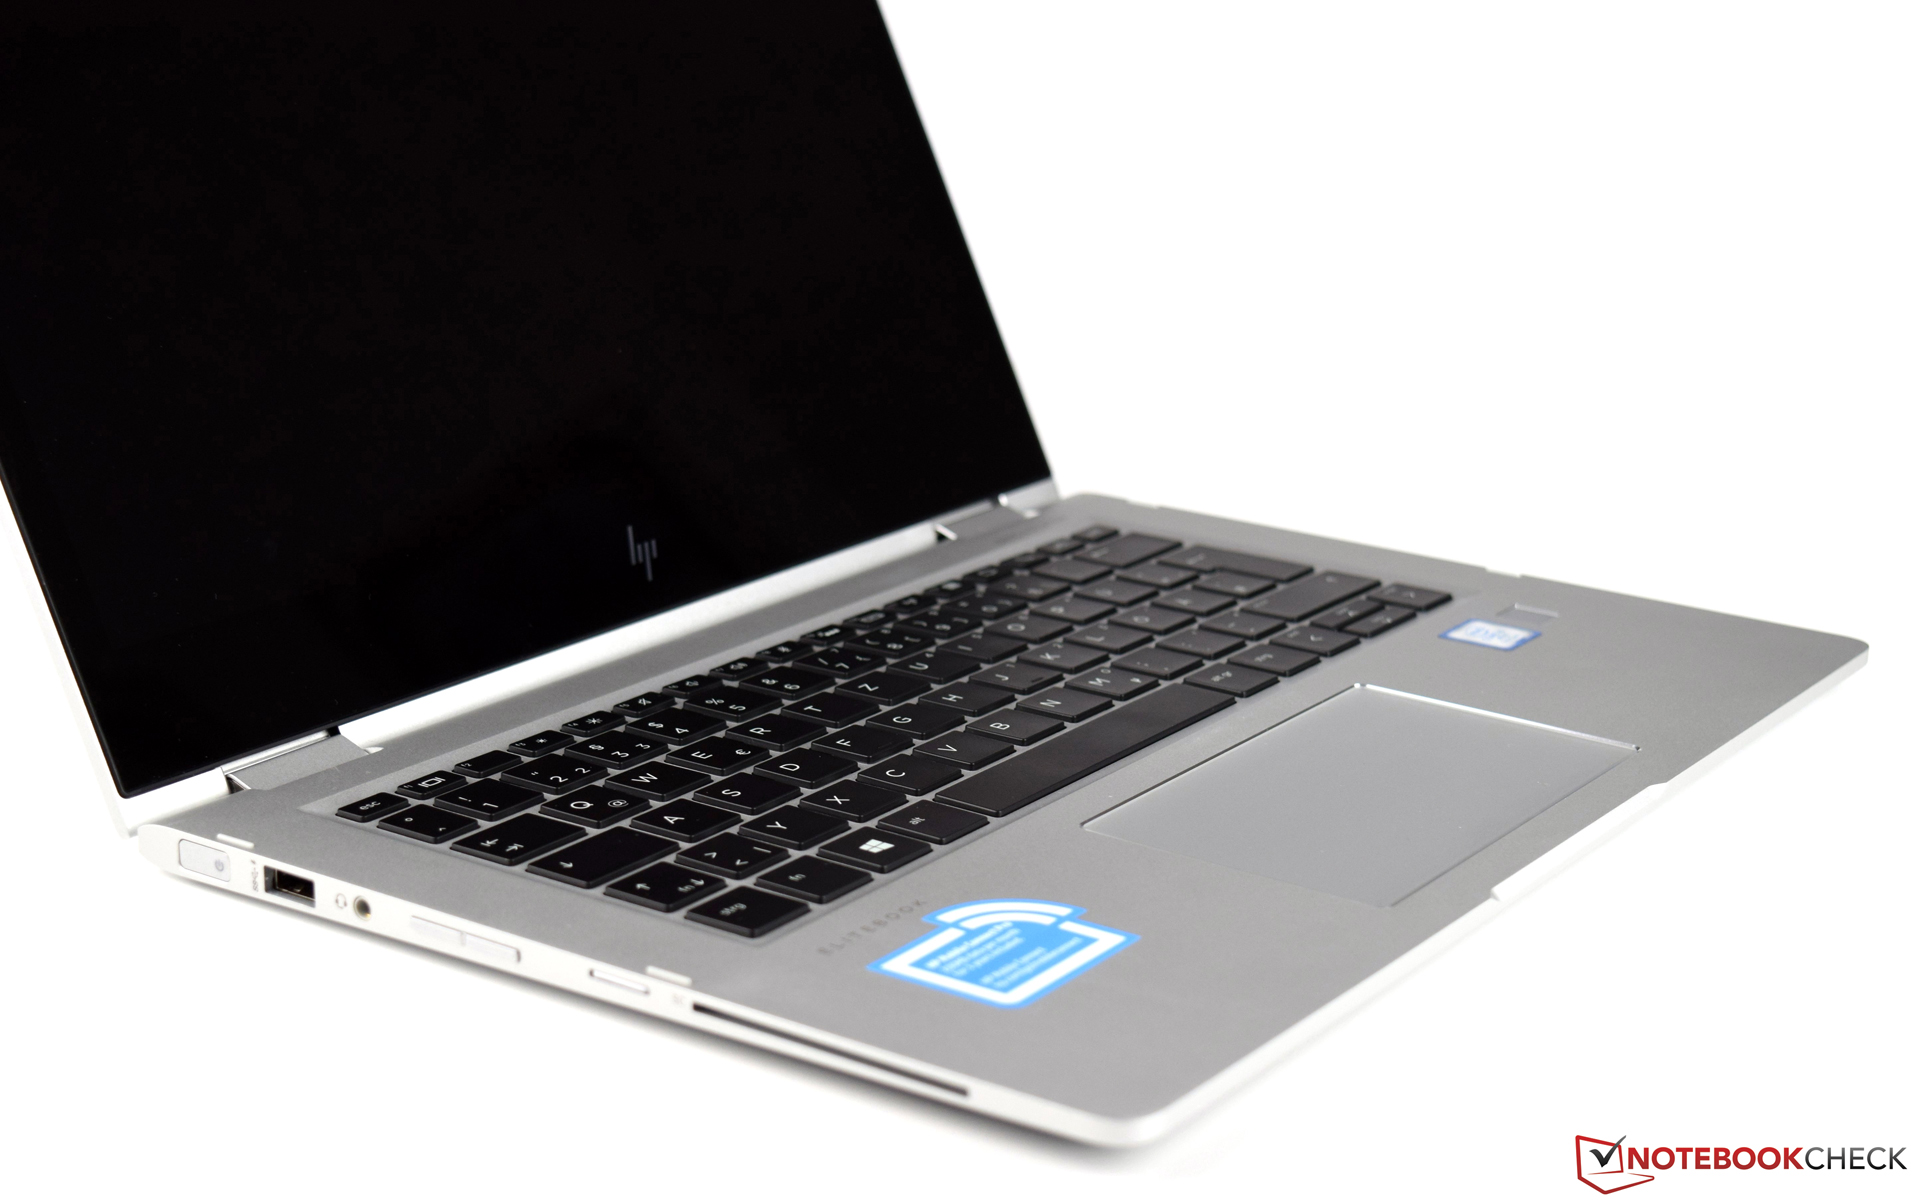
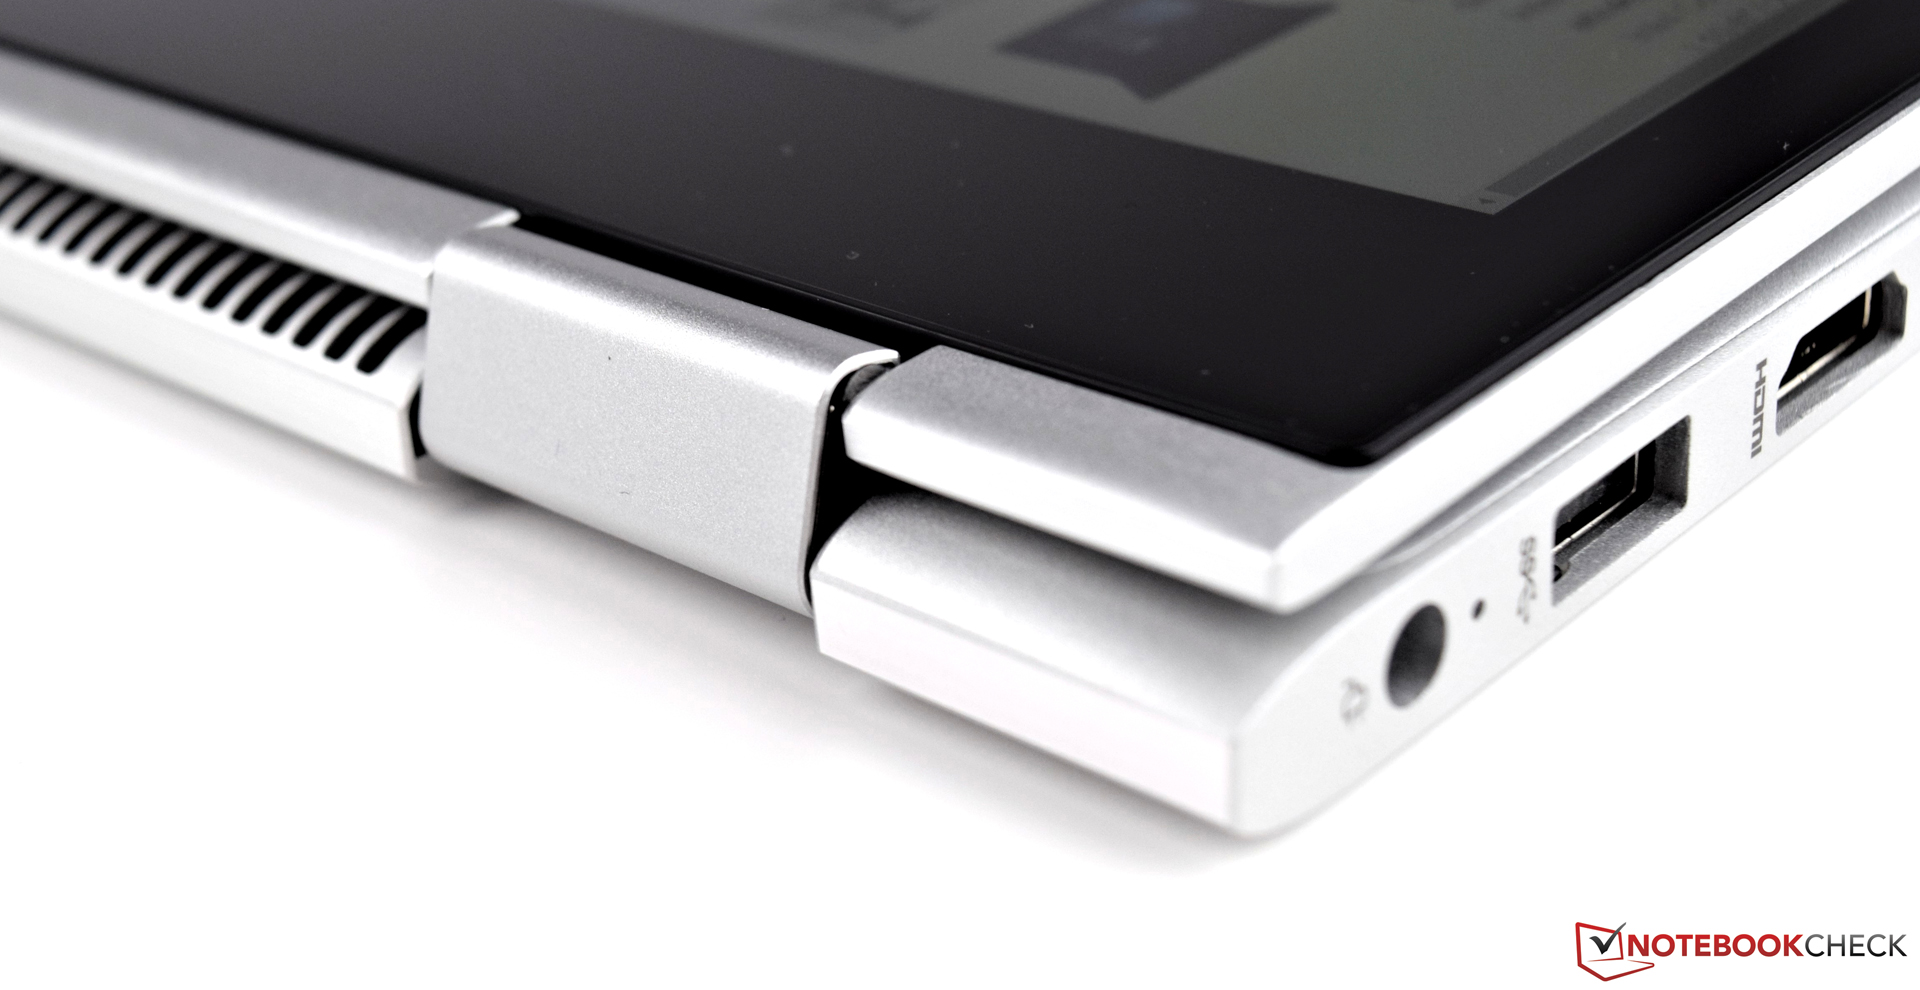
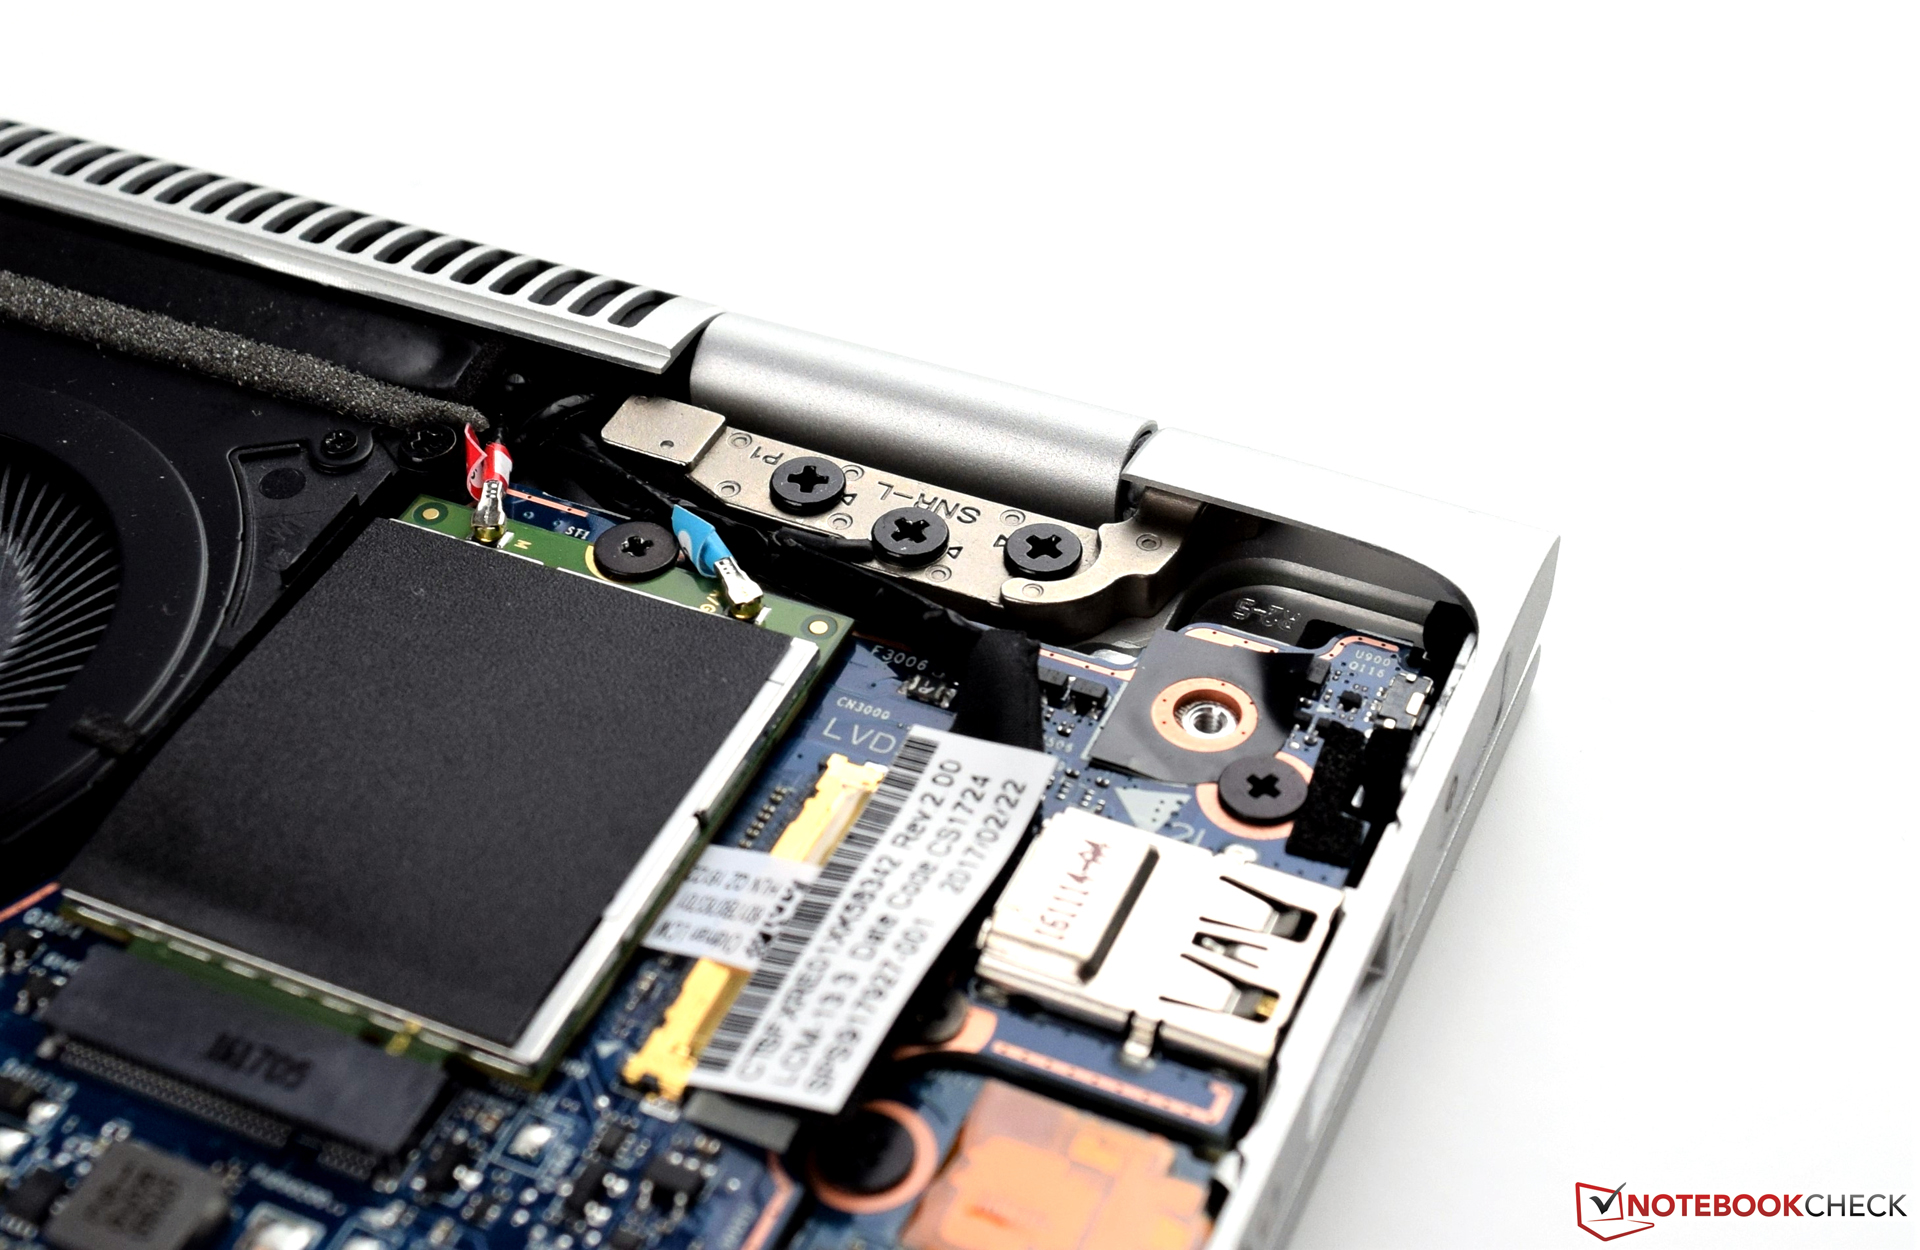
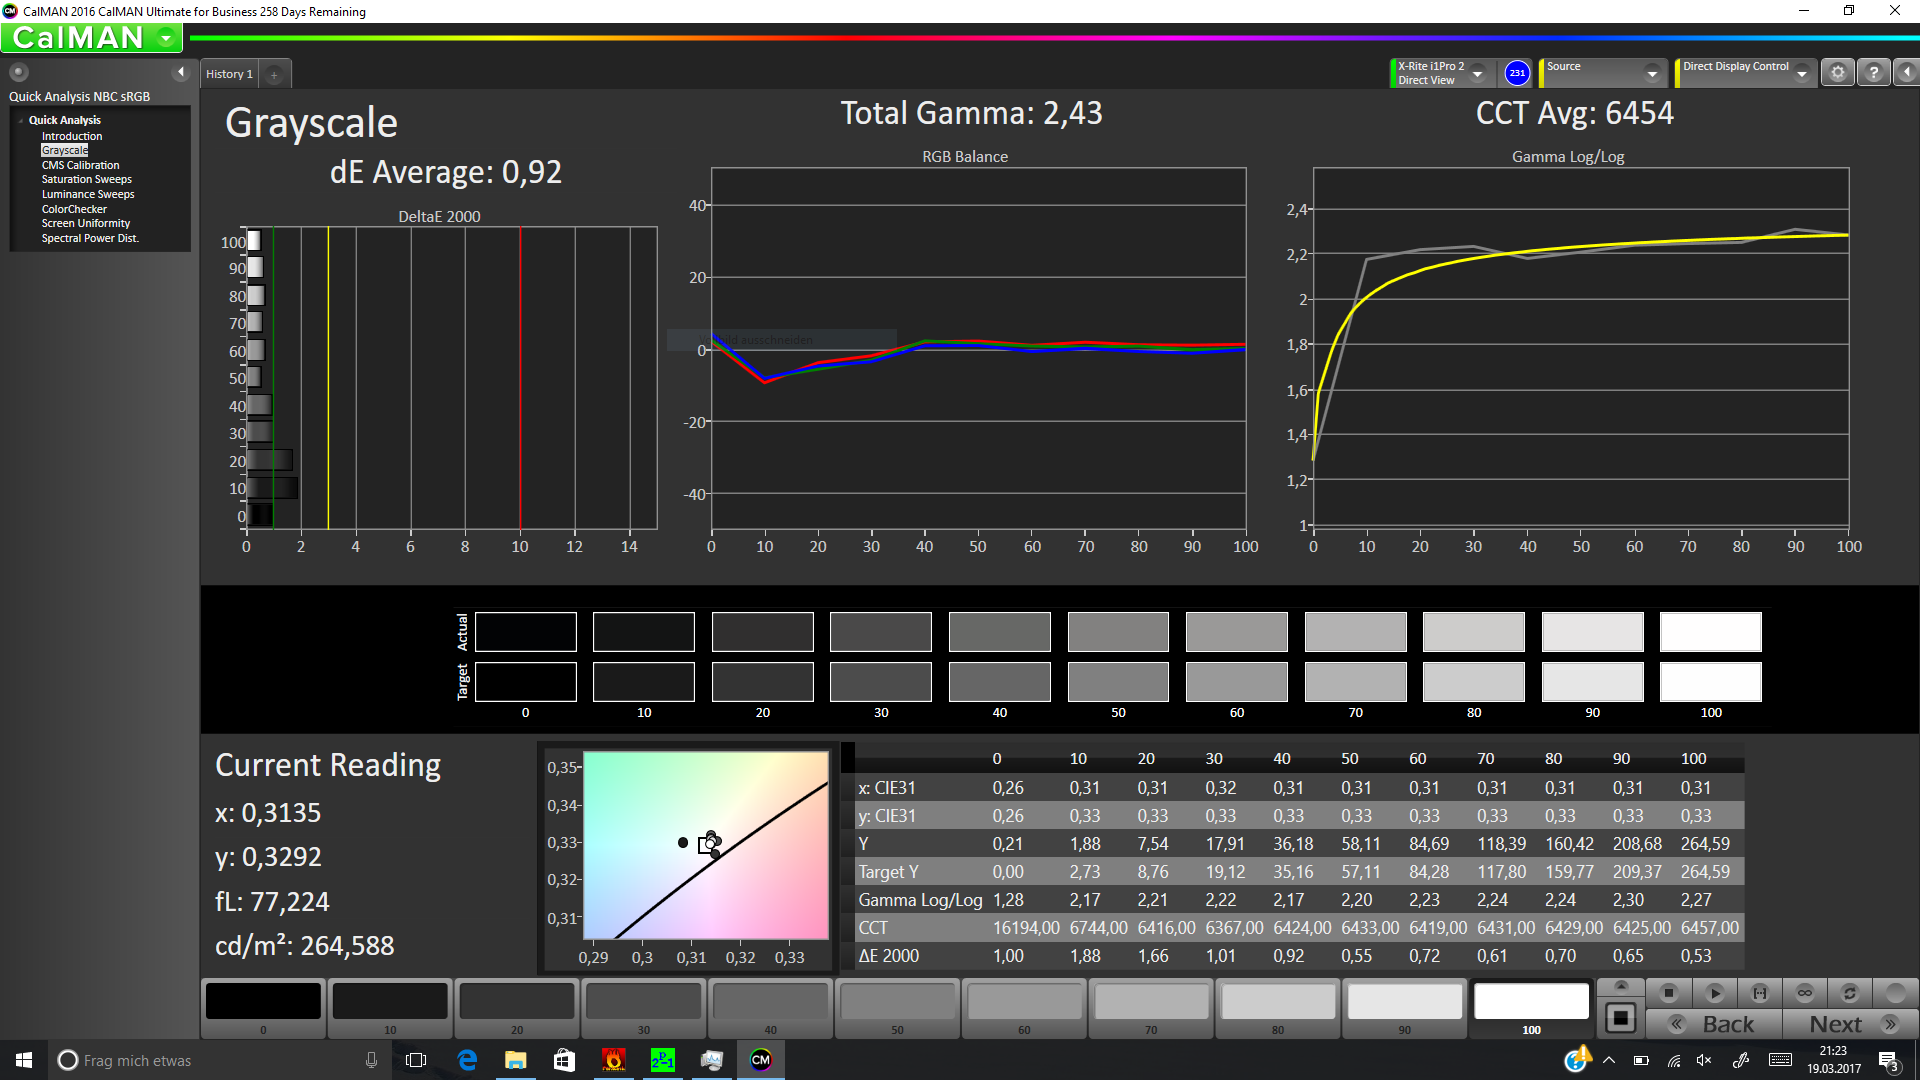
不过我们也有一些不够满意的地方。首先是它的屏幕,尽管可视角度稳定性十分不错,但亮度相对较低。同时固态硬盘的性能也低于同价位设备的表现。惠普应该为它搭配这个价位的标准配置,NVMe固态硬盘。除了不多的几处瑕疵外,惠普EliteBook x360 1030 G2在测试中表现优秀。当然,它纤薄雅致的机身设计也给了我们很好的印象。
注:本文是基于完整评测的缩减版本,阅读完整的英文评测,请点击这里。
HP EliteBook x360 1030 G2
- 04/10/2017 v6 (old)
Sebastian Bade