东芝 Portégé X20W (7600U, 512 GB) 变形本简短评测

| Networking | |
| iperf3 transmit AX12 | |
| Asus Transformer 3 Pro T303UA-GN050T | |
| Toshiba Portege X20W-D-10R | |
| Lenovo Ideapad Miix 720-12IKB | |
| Microsoft Surface Pro 4, Core i5, 128GB (Klaus I211) | |
| iperf3 receive AX12 | |
| Asus Transformer 3 Pro T303UA-GN050T | |
| Lenovo Ideapad Miix 720-12IKB | |
| Toshiba Portege X20W-D-10R | |
| Microsoft Surface Pro 4, Core i5, 128GB (Klaus I211) | |
| |||||||||||||||||||||||||
Brightness Distribution: 86 %
Center on Battery: 442 cd/m²
Contrast: 2009:1 (Black: 0.22 cd/m²)
ΔE ColorChecker Calman: 5.22 | ∀{0.5-29.43 Ø4.71}
ΔE Greyscale Calman: 7.88 | ∀{0.09-98 Ø4.96}
97% sRGB (Argyll 1.6.3 3D)
64% AdobeRGB 1998 (Argyll 1.6.3 3D)
70.4% AdobeRGB 1998 (Argyll 3D)
96.8% sRGB (Argyll 3D)
68.7% Display P3 (Argyll 3D)
Gamma: 2.51
CCT: 6756 K
| Toshiba Portege X20W-D-10R Toshiba TOS508F, , 1920x1080, 12.5" | Lenovo ThinkPad Yoga 260 20FD001XGE LEN40E6 N125HCE-GN1, , 1920x1080, 12.5" | Microsoft Surface Pro 4, Core i5, 128GB Samsung 123YL01-001 ID: SDC3853, , 2736x1824, 12.3" | Acer Aspire Switch Alpha 12 SA5-271-70EQ WST KL.1200W.002 WST2216, , 2160x1440, 12" | Lenovo Ideapad Miix 720-12IKB AUO B120YAN01 / AUO106F, , 2880x1920, 12" | Asus Transformer 3 Pro T303UA-GN050T BOE BOE06AC (NV126A1M-N51), , 2880x1920, 12.6" | |
|---|---|---|---|---|---|---|
| Display | -36% | -3% | -18% | -6% | 13% | |
| Display P3 Coverage (%) | 68.7 | 42.98 -37% | 65 -5% | 55.7 -19% | 65.2 -5% | 81.8 19% |
| sRGB Coverage (%) | 96.8 | 62.8 -35% | 96.5 0% | 82.7 -15% | 91 -6% | 98.3 2% |
| AdobeRGB 1998 Coverage (%) | 70.4 | 44.55 -37% | 67 -5% | 56.9 -19% | 66.1 -6% | 82.2 17% |
| Response Times | 14% | 26% | 49% | 36% | 41% | |
| Response Time Grey 50% / Grey 80% * (ms) | 67 ? | 64 ? 4% | 46 ? 31% | 21 ? 69% | 45 ? 33% | 30 ? 55% |
| Response Time Black / White * (ms) | 39 ? | 30 ? 23% | 31.2 ? 20% | 28 ? 28% | 24 ? 38% | 29 ? 26% |
| PWM Frequency (Hz) | 50 ? | 50 ? | 200 ? | |||
| Screen | -33% | -3% | -31% | -6% | -2% | |
| Brightness middle (cd/m²) | 442 | 371 -16% | 413 -7% | 391 -12% | 406 -8% | 316 -29% |
| Brightness (cd/m²) | 410 | 335 -18% | 396 -3% | 367 -10% | 396 -3% | 307 -25% |
| Brightness Distribution (%) | 86 | 84 -2% | 87 1% | 87 1% | 88 2% | 91 6% |
| Black Level * (cd/m²) | 0.22 | 0.29 -32% | 0.36 -64% | 0.56 -155% | 0.3 -36% | 0.29 -32% |
| Contrast (:1) | 2009 | 1279 -36% | 1147 -43% | 698 -65% | 1353 -33% | 1090 -46% |
| Colorchecker dE 2000 * | 5.22 | 8.51 -63% | 3.09 41% | 6.96 -33% | 5.28 -1% | 3.91 25% |
| Colorchecker dE 2000 max. * | 11.84 | 20.43 -73% | 13.43 -13% | 9.83 17% | 7.9 33% | |
| Greyscale dE 2000 * | 7.88 | 9.23 -17% | 3.92 50% | 7.44 6% | 6.71 15% | 5.37 32% |
| Gamma | 2.51 88% | 2.24 98% | 2.3 96% | 2.41 91% | 2.29 96% | 2.36 93% |
| CCT | 6756 96% | 6759 96% | 7333 89% | 8126 80% | 6532 100% | 7812 83% |
| Color Space (Percent of AdobeRGB 1998) (%) | 64 | 41 -36% | 61 -5% | 53 -17% | 59 -8% | 72 13% |
| Color Space (Percent of sRGB) (%) | 97 | 62 -36% | 97 0% | 83 -14% | 91 -6% | 98 1% |
| Total Average (Program / Settings) | -18% /
-27% | 7% /
1% | 0% /
-18% | 8% /
-0% | 17% /
6% |
* ... smaller is better
Display Response Times
| ↔ Response Time Black to White | ||
|---|---|---|
| 39 ms ... rise ↗ and fall ↘ combined | ↗ 22 ms rise | 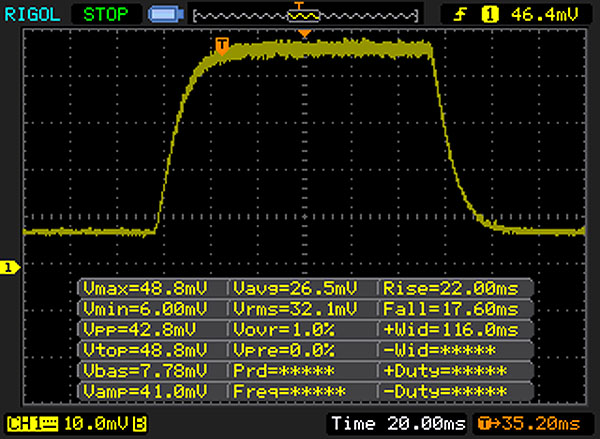 |
| ↘ 17 ms fall | ||
| The screen shows slow response rates in our tests and will be unsatisfactory for gamers. In comparison, all tested devices range from 0.1 (minimum) to 240 (maximum) ms. » 97 % of all devices are better. This means that the measured response time is worse than the average of all tested devices (19.8 ms). | ||
| ↔ Response Time 50% Grey to 80% Grey | ||
| 67 ms ... rise ↗ and fall ↘ combined | ↗ 33 ms rise | 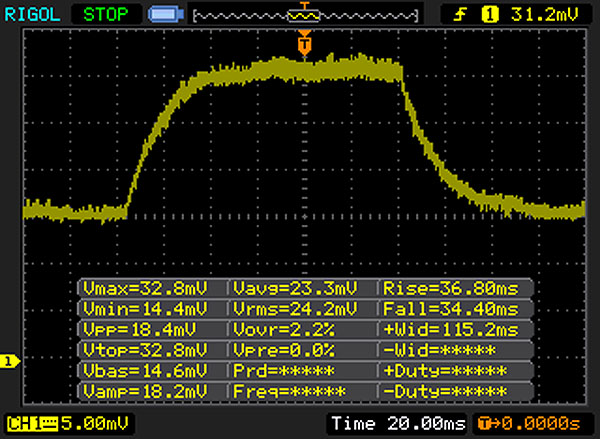 |
| ↘ 34 ms fall | ||
| The screen shows slow response rates in our tests and will be unsatisfactory for gamers. In comparison, all tested devices range from 0.165 (minimum) to 636 (maximum) ms. » 98 % of all devices are better. This means that the measured response time is worse than the average of all tested devices (31 ms). | ||
Screen Flickering / PWM (Pulse-Width Modulation)
| Screen flickering / PWM not detected | ||
In comparison: 52 % of all tested devices do not use PWM to dim the display. If PWM was detected, an average of 7754 (minimum: 5 - maximum: 343500) Hz was measured. | ||
| PCMark 8 Home Score Accelerated v2 | 3654 points | |
| PCMark 8 Work Score Accelerated v2 | 4797 points | |
Help | ||
| Toshiba Portege X20W-D-10R Toshiba SG5 THNSNK512GVN8 | Lenovo ThinkPad Yoga 260 20FD001XGE Samsung SSD PM871 MZNLN256HCHP | Microsoft Surface Pro 4, Core i5, 128GB Samsung MZFLV128 NVMe | Acer Aspire Switch Alpha 12 SA5-271-70EQ Lite-On CV1-8B512 M.2 512 GB | Lenovo Ideapad Miix 720-12IKB Samsung SSD PM961 1TB M.2 PCIe 3.0 x4 NVMe (MZVLW1T0) | Asus Transformer 3 Pro T303UA-GN050T SK Hynix Canvas SC300 512GB M.2 (HFS512G39MND) | |
|---|---|---|---|---|---|---|
| CrystalDiskMark 3.0 | 4% | -8% | 15% | 235% | -1% | |
| Read Seq (MB/s) | 469 | 468.9 0% | 666 42% | 496.6 6% | 2408 413% | 398.9 -15% |
| Write Seq (MB/s) | 277.3 | 297.3 7% | 154.2 -44% | 415.3 50% | 1702 514% | 402 45% |
| Read 512 (MB/s) | 404.4 | 397.9 -2% | 266.3 -34% | 335.9 -17% | 1301 222% | 303.1 -25% |
| Write 512 (MB/s) | 266.6 | 297.1 11% | 154.2 -42% | 384 44% | 1288 383% | 320.3 20% |
| Read 4k (MB/s) | 25.24 | 33.11 31% | 28.51 13% | 32.38 28% | 53.6 112% | 26.11 3% |
| Write 4k (MB/s) | 89.4 | 85.1 -5% | 101.5 14% | 81.8 -9% | 162.2 81% | 57.7 -35% |
| Read 4k QD32 (MB/s) | 322.5 | 398.3 24% | 368.3 14% | 296.3 -8% | 504 56% | 245.8 -24% |
| Write 4k QD32 (MB/s) | 208.1 | 136.6 -34% | 153.6 -26% | 260.3 25% | 420.8 102% | 253.8 22% |

| 3DMark 11 Performance | 1690 points | |
| 3DMark Cloud Gate Standard Score | 6277 points | |
Help | ||
| BioShock Infinite - 1366x768 Medium Preset | |
| Microsoft Surface Pro 4, Core i5, 128GB | |
| Acer Aspire Switch Alpha 12 SA5-271-70EQ | |
| Lenovo Ideapad Miix 720-12IKB | |
| Toshiba Portege X20W-D-10R | |
| Asus Transformer 3 Pro T303UA-GN050T | |
| Thief - 1024x768 Very Low Preset | |
| Acer Aspire Switch Alpha 12 SA5-271-70EQ | |
| Acer Aspire Switch Alpha 12 SA5-271-70EQ | |
| Toshiba Portege X20W-D-10R | |
| Lenovo Ideapad Miix 720-12IKB | |
| Rise of the Tomb Raider - 1024x768 Lowest Preset | |
| Asus Transformer 3 Pro T303UA-GN050T | |
| Lenovo Ideapad Miix 720-12IKB | |
| Toshiba Portege X20W-D-10R | |
| Acer Aspire Switch Alpha 12 SA5-271-70EQ | |
| low | med. | high | ultra | |
|---|---|---|---|---|
| BioShock Infinite (2013) | 43 | 28 | 23.5 | 7.6 |
| Thief (2014) | 23 | |||
| Rise of the Tomb Raider (2016) | 16 | 9.9 |
Noise level
| Idle |
| 30.5 / 30.5 / 30.5 dB(A) |
| Load |
| 31.2 / 31.3 dB(A) |
 | ||
30 dB silent 40 dB(A) audible 50 dB(A) loud |
||
min: | ||
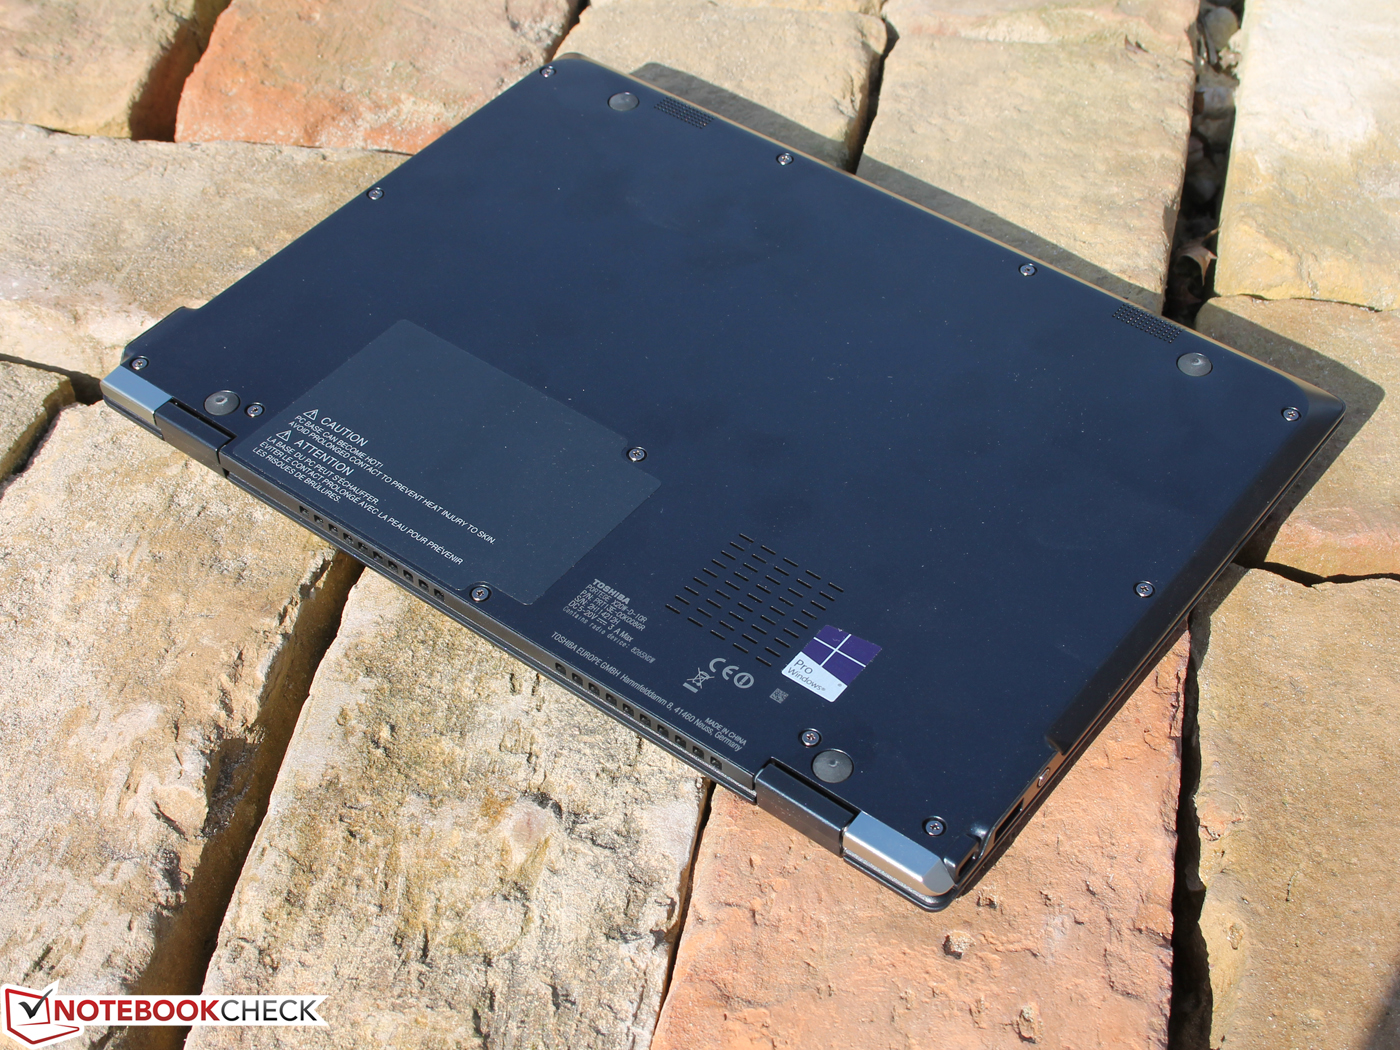
(+) The maximum temperature on the upper side is 35.7 °C / 96 F, compared to the average of 35.4 °C / 96 F, ranging from 19.6 to 60 °C for the class Convertible.
(+) The bottom heats up to a maximum of 24.2 °C / 76 F, compared to the average of 36.9 °C / 98 F
(+) In idle usage, the average temperature for the upper side is 22.3 °C / 72 F, compared to the device average of 30.3 °C / 87 F.
(+) The palmrests and touchpad are cooler than skin temperature with a maximum of 24.8 °C / 76.6 F and are therefore cool to the touch.
(+) The average temperature of the palmrest area of similar devices was 28 °C / 82.4 F (+3.2 °C / 5.8 F).
Toshiba Portege X20W-D-10R audio analysis
(-) | not very loud speakers (64 dB)
Bass 100 - 315 Hz
(-) | nearly no bass - on average 24.3% lower than median
(±) | linearity of bass is average (11.3% delta to prev. frequency)
Mids 400 - 2000 Hz
(+) | balanced mids - only 3.5% away from median
(±) | linearity of mids is average (7.9% delta to prev. frequency)
Highs 2 - 16 kHz
(+) | balanced highs - only 4.8% away from median
(+) | highs are linear (6.2% delta to prev. frequency)
Overall 100 - 16.000 Hz
(±) | linearity of overall sound is average (27% difference to median)
Compared to same class
» 83% of all tested devices in this class were better, 3% similar, 14% worse
» The best had a delta of 6%, average was 20%, worst was 57%
Compared to all devices tested
» 83% of all tested devices were better, 4% similar, 14% worse
» The best had a delta of 4%, average was 23%, worst was 134%
Lenovo Ideapad Miix 720-12IKB audio analysis
(-) | not very loud speakers (64 dB)
Bass 100 - 315 Hz
(±) | reduced bass - on average 9.9% lower than median
(-) | bass is not linear (16.2% delta to prev. frequency)
Mids 400 - 2000 Hz
(±) | higher mids - on average 7.3% higher than median
(±) | linearity of mids is average (13.3% delta to prev. frequency)
Highs 2 - 16 kHz
(+) | balanced highs - only 3.3% away from median
(±) | linearity of highs is average (12.2% delta to prev. frequency)
Overall 100 - 16.000 Hz
(±) | linearity of overall sound is average (25.1% difference to median)
Compared to same class
» 76% of all tested devices in this class were better, 7% similar, 17% worse
» The best had a delta of 6%, average was 20%, worst was 57%
Compared to all devices tested
» 77% of all tested devices were better, 5% similar, 18% worse
» The best had a delta of 4%, average was 23%, worst was 134%
| Off / Standby | |
| Idle | |
| Load |
|
Key:
min: | |
| Toshiba Portege X20W-D-10R i7-7600U, HD Graphics 620, Toshiba SG5 THNSNK512GVN8, IPS, 1920x1080, 12.5" | Lenovo ThinkPad Yoga 260 20FD001XGE 6500U, HD Graphics 520, Samsung SSD PM871 MZNLN256HCHP, IPS, 1920x1080, 12.5" | Microsoft Surface Pro 4, Core i5, 128GB 6300U, HD Graphics 520, Samsung MZFLV128 NVMe, IPS, 2736x1824, 12.3" | Acer Aspire Switch Alpha 12 SA5-271-70EQ 6500U, HD Graphics 520, Lite-On CV1-8B512 M.2 512 GB, IPS, 2160x1440, 12" | Lenovo Ideapad Miix 720-12IKB i7-7500U, HD Graphics 620, Samsung SSD PM961 1TB M.2 PCIe 3.0 x4 NVMe (MZVLW1T0), IPS, 2880x1920, 12" | Asus Transformer 3 Pro T303UA-GN050T 6500U, HD Graphics 520, SK Hynix Canvas SC300 512GB M.2 (HFS512G39MND), IPS, 2880x1920, 12.6" | |
|---|---|---|---|---|---|---|
| Power Consumption | -12% | -26% | -70% | -25% | -66% | |
| Idle Minimum * (Watt) | 3.4 | 3.6 -6% | 4.4 -29% | 5.5 -62% | 3.5 -3% | 6.7 -97% |
| Idle Average * (Watt) | 5.8 | 6.3 -9% | 9 -55% | 9.8 -69% | 7.2 -24% | 10.3 -78% |
| Idle Maximum * (Watt) | 6.7 | 7.6 -13% | 10.7 -60% | 11.9 -78% | 7.9 -18% | 13.5 -101% |
| Load Average * (Watt) | 21.4 | 27.2 -27% | 19.6 8% | 36.1 -69% | 29.6 -38% | 26 -21% |
| Load Maximum * (Watt) | 21.6 | 22.8 -6% | 19.9 8% | 36.7 -70% | 30.8 -43% | 28.8 -33% |
* ... smaller is better
| Toshiba Portege X20W-D-10R i7-7600U, HD Graphics 620, 44 Wh | Lenovo ThinkPad Yoga 260 20FD001XGE 6500U, HD Graphics 520, 44 Wh | Microsoft Surface Pro 4, Core i5, 128GB 6300U, HD Graphics 520, 38 Wh | Acer Aspire Switch Alpha 12 SA5-271-70EQ 6500U, HD Graphics 520, 37 Wh | Lenovo Ideapad Miix 720-12IKB i7-7500U, HD Graphics 620, 41 Wh | Asus Transformer 3 Pro T303UA-GN050T 6500U, HD Graphics 520, 39 Wh | |
|---|---|---|---|---|---|---|
| Battery runtime | -33% | -25% | -40% | -35% | -53% | |
| Reader / Idle (h) | 16.7 | 15.7 -6% | 15 -10% | 10.7 -36% | 11.9 -29% | 7.1 -57% |
| WiFi v1.3 (h) | 12 | 5.8 -52% | 7.1 -41% | 4.9 -59% | 5.8 -52% | 3.7 -69% |
| Load (h) | 2.5 | 1.5 -40% | 1.9 -24% | 1.9 -24% | 1.9 -24% | 1.7 -32% |
| H.264 (h) | 3.4 |
Pros
Cons
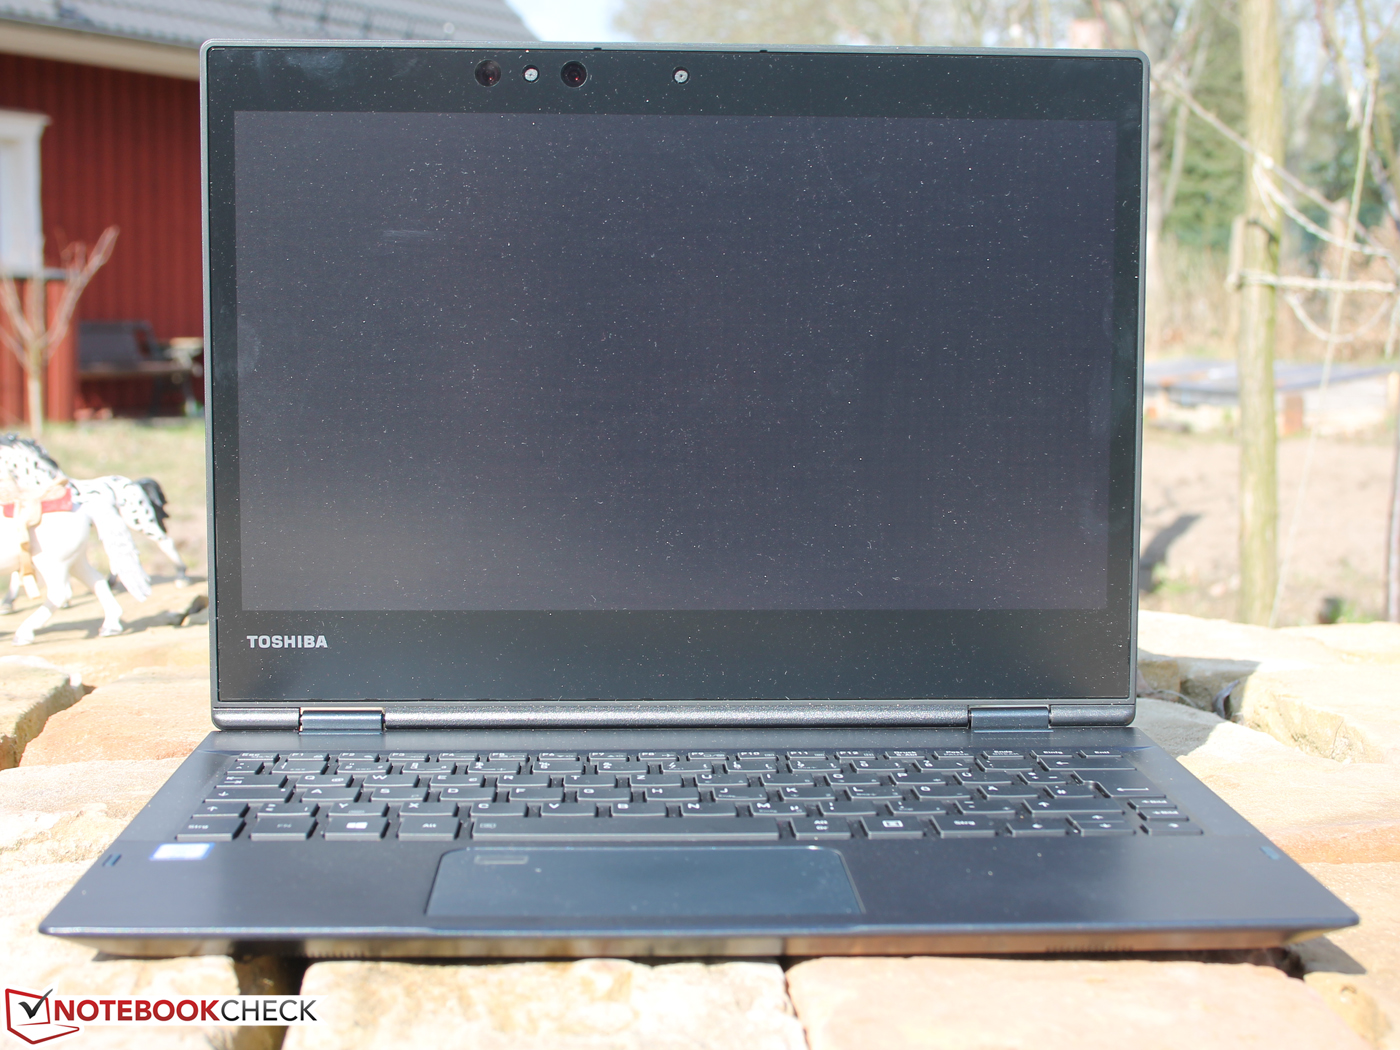
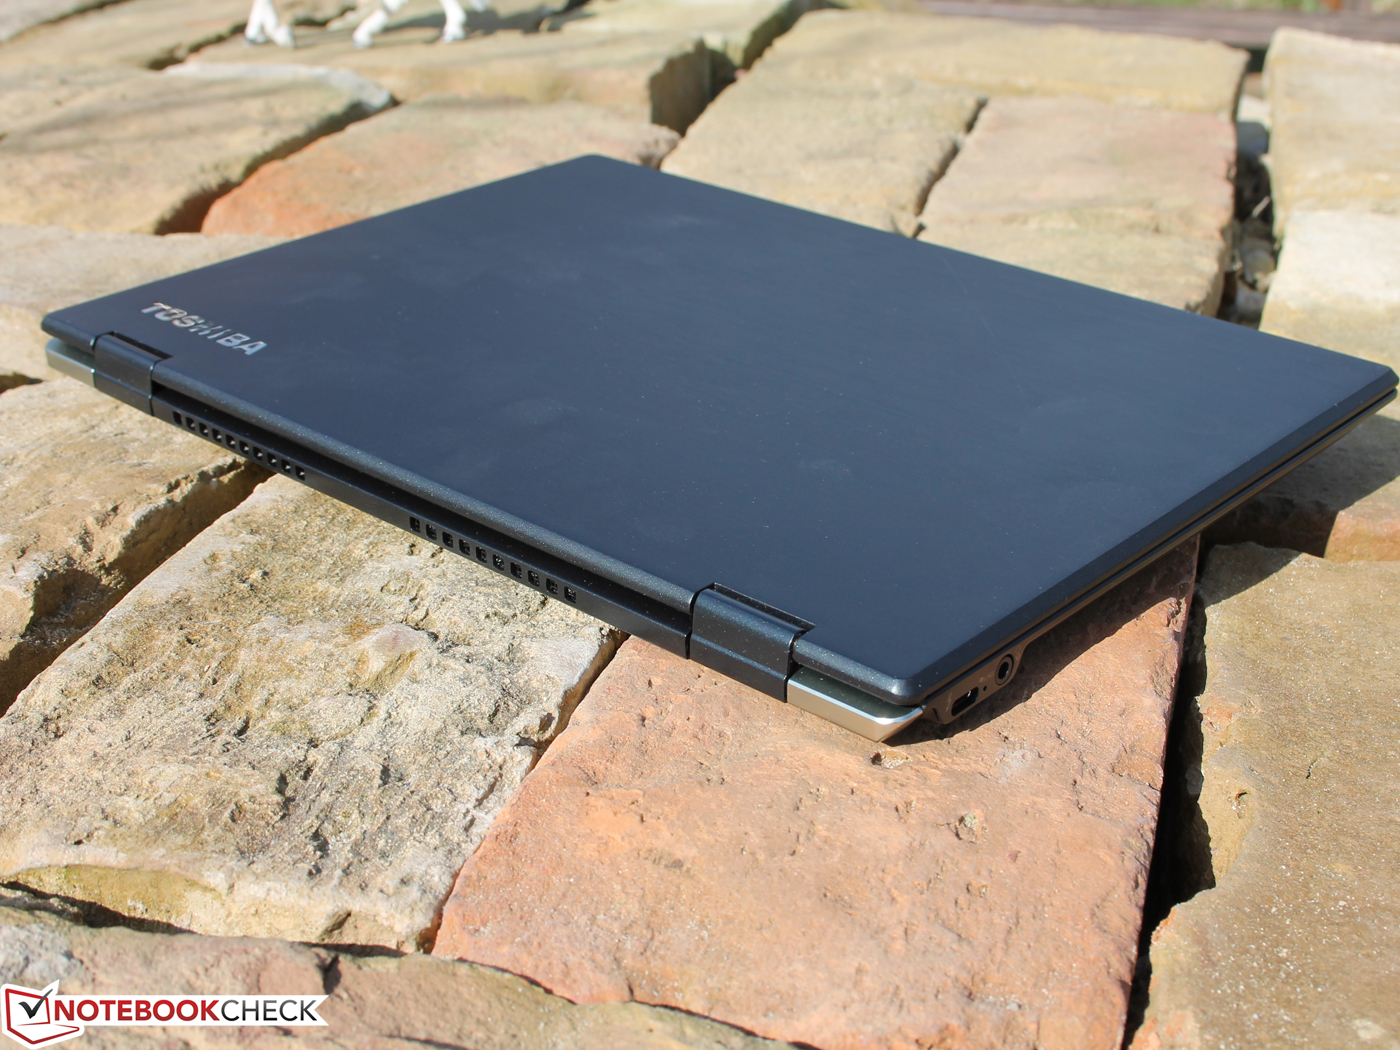
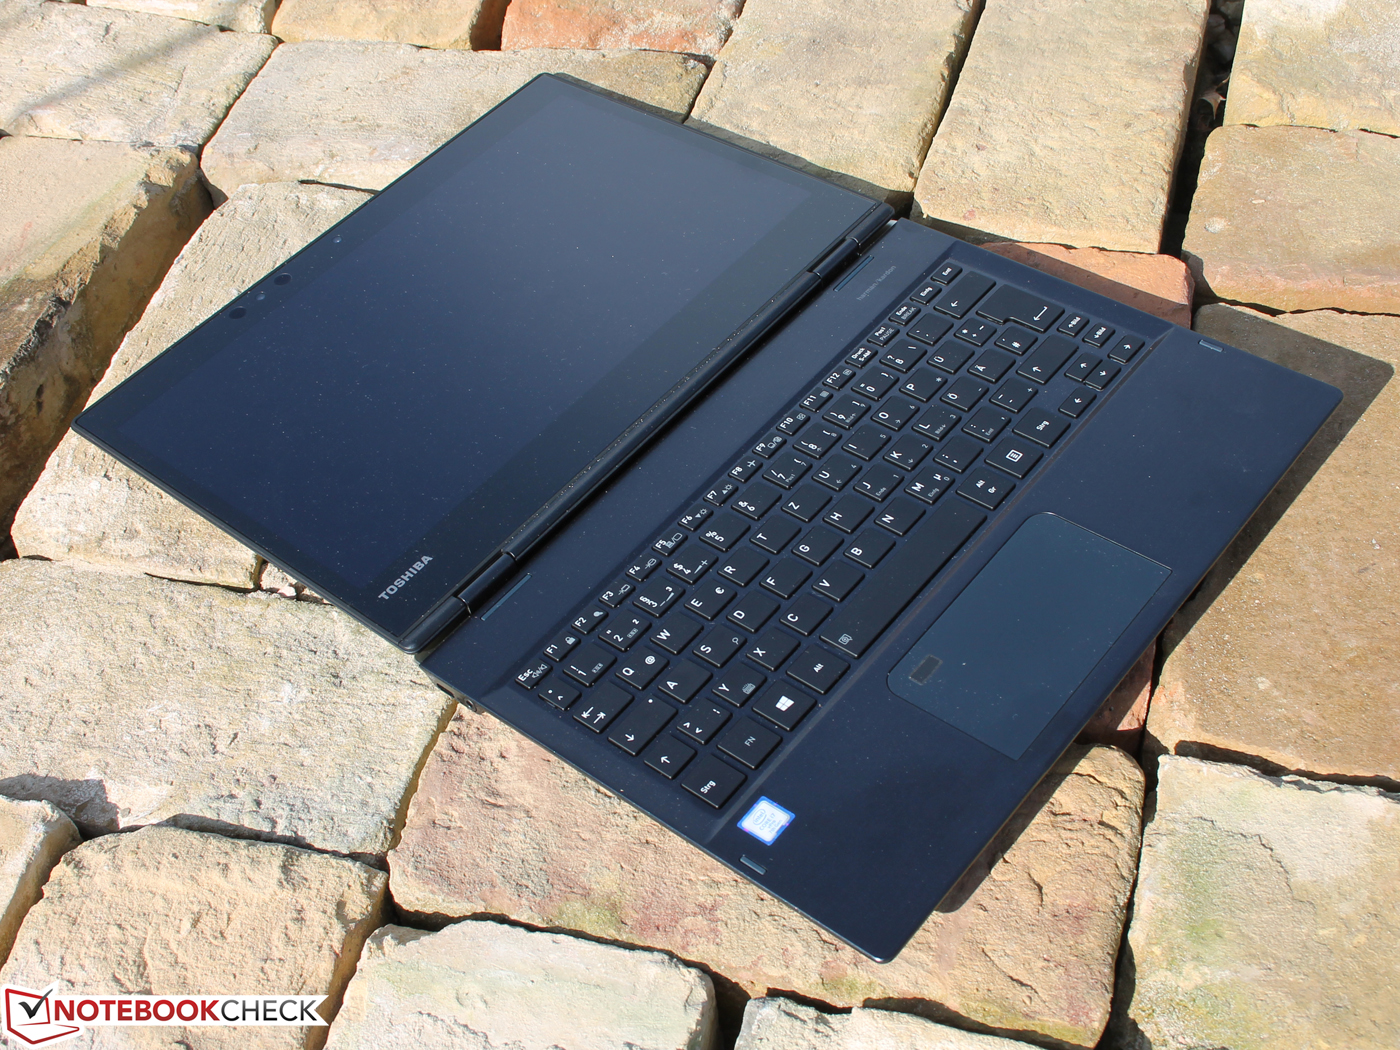
东芝的这台设备在很多方面都设计的十分优秀:较低的重量带来了出色的便携性,防反光屏幕也具备很高的亮度,电池续航则可以达到12到16小时。它的散热系统也毫无瑕疵:小巧的风扇几乎不会发出任何声音。完整的笔记本电脑性能和优秀的Turbo加速利用率与变形本尺寸形成了完美的结合。
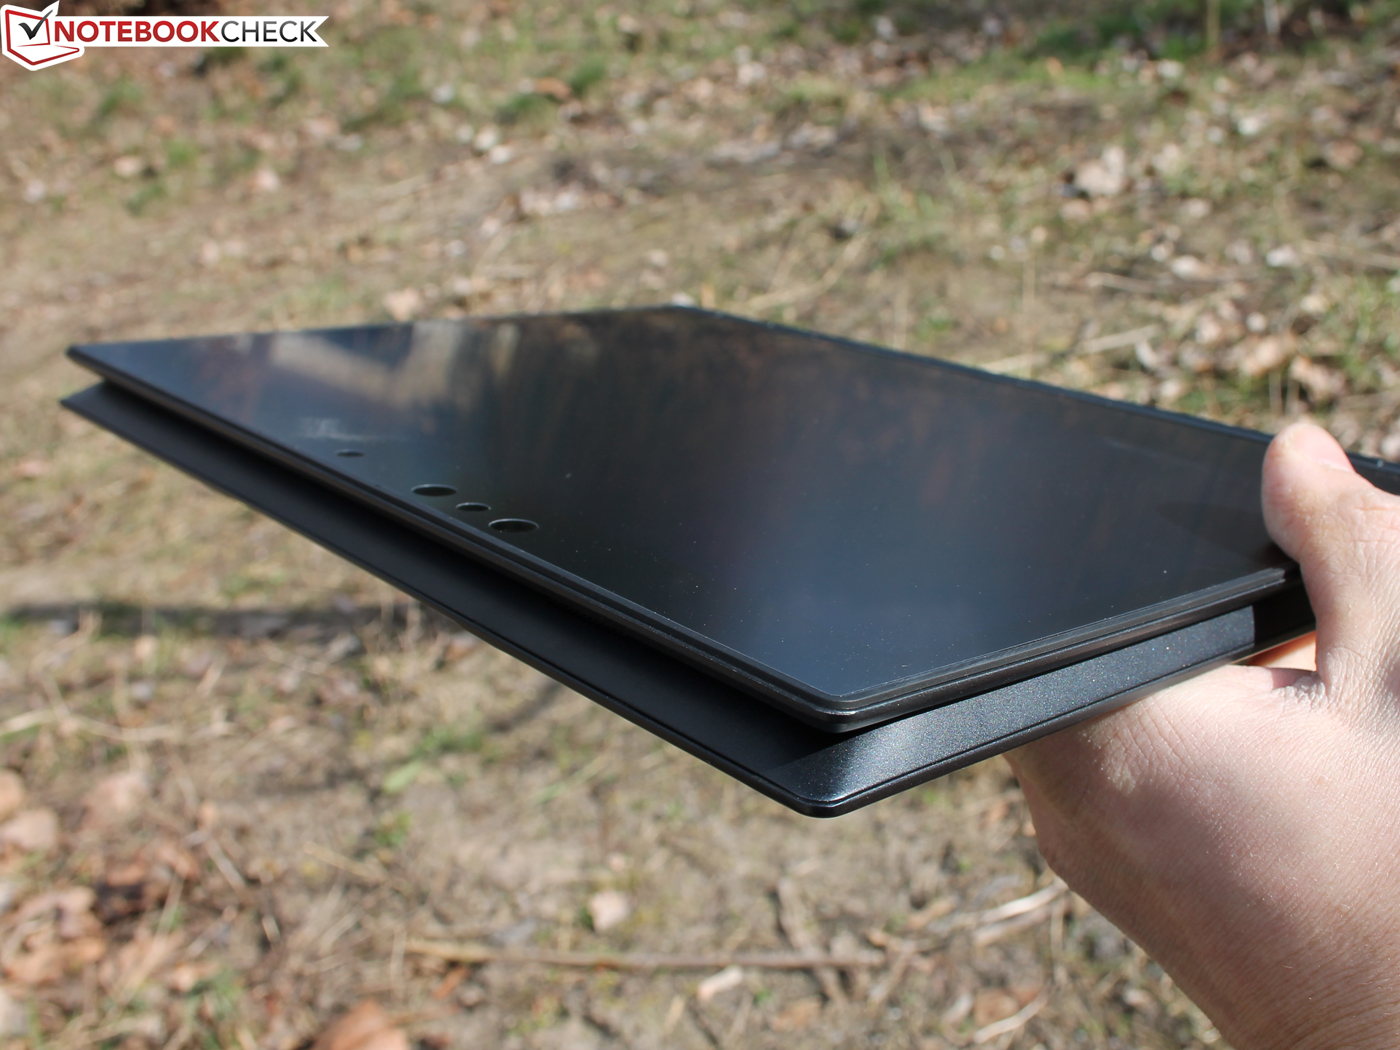
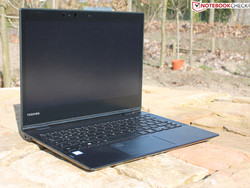
它的镁合金机身仅重1.024千克,甚至低于生产商宣传的1.1千克。因此,Portégé X20w相比其他与Surface Pro 4设计相似(搭配键盘底座)的设备中最轻的。
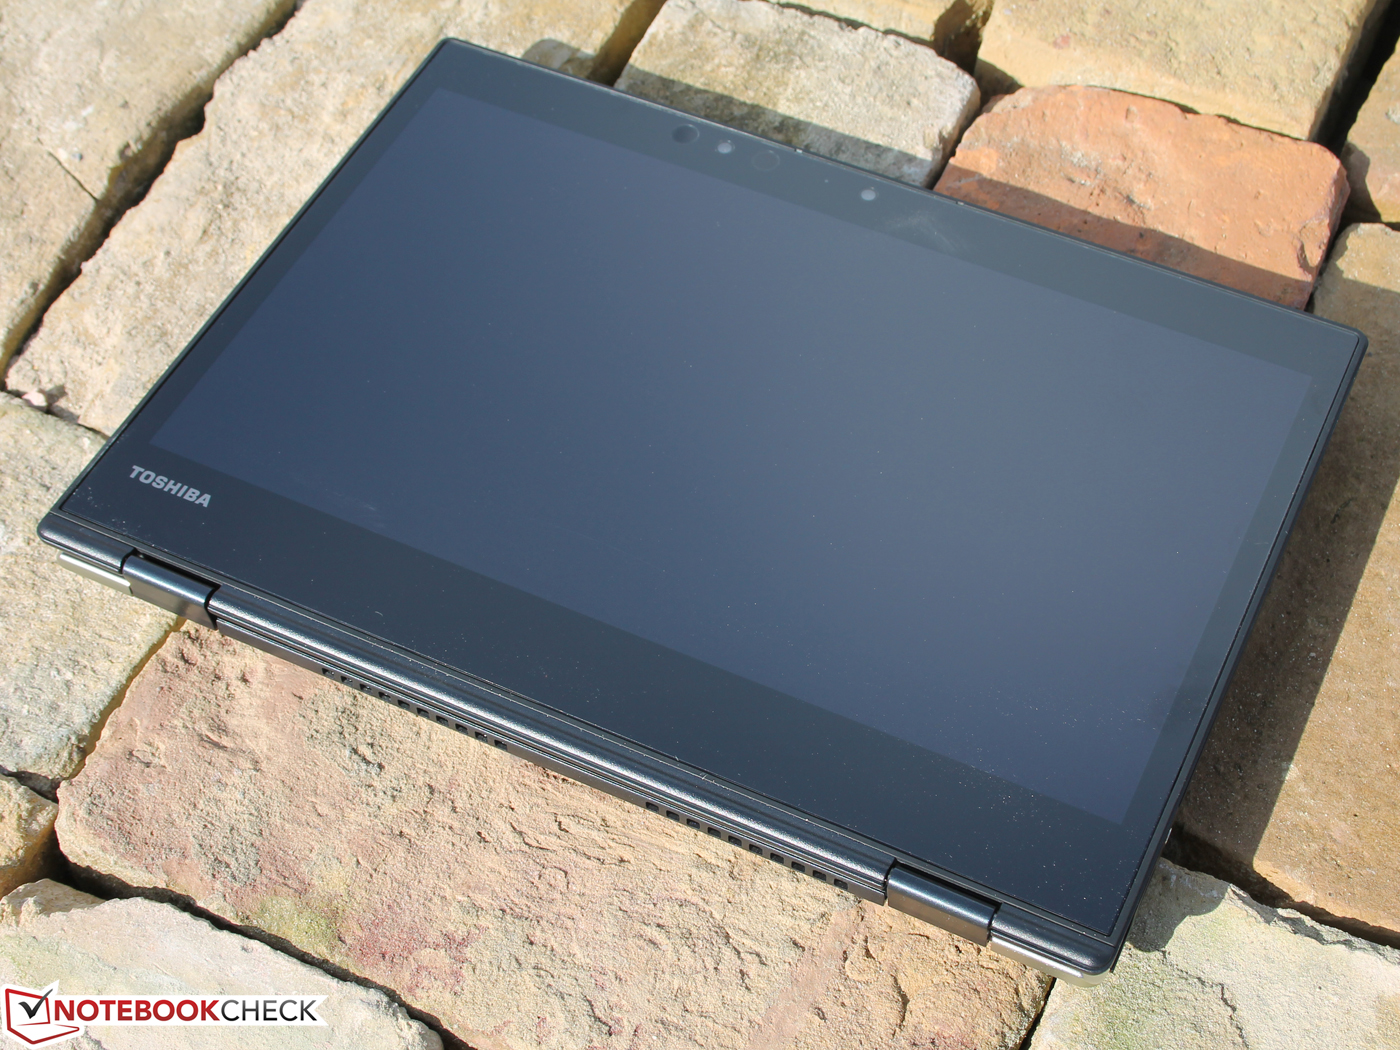
在和其他360度旋转设备相比它也无可匹敌。12.5寸的ThinkPad Yoga 260重量为1.3千克。
企业用户也可能对X20w十分感兴趣,因为它几乎搭配了所有市场上常见的安全功能——除了智能卡。TPM,指纹感应器,支持Windows Hello的IR摄像机,东芝的BIOS系统,英特尔的Active Management技术等等它都提供了支持。除此之外它还支持AES手写笔,这项功能也与它较高的价位相符。
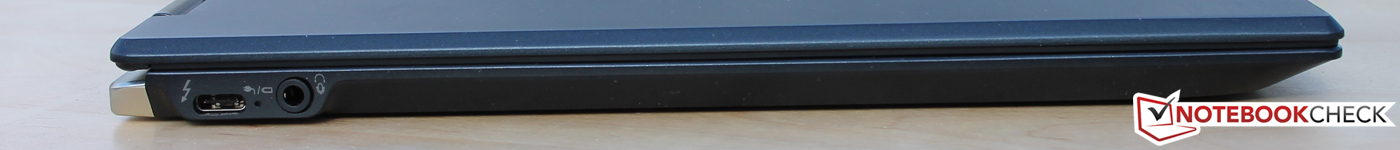
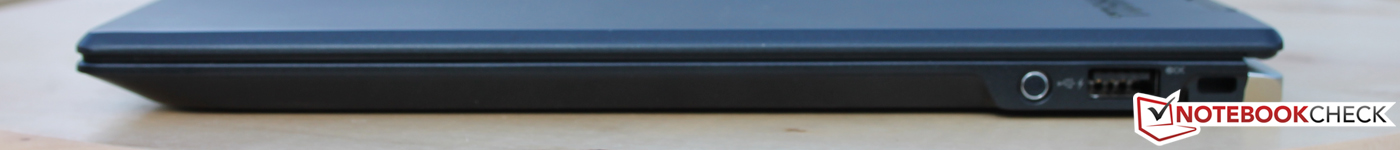
对它得分有负面影响的是一些小细节:我们感觉它的键盘反馈相对较弱。Miix 720在这方面表现更好。较差的摄像头则拉了一流的麦克风的后腿。尽管它的Thunderbolt 3拓展坞提供了各种接口,但出门在外它还是需要转接器才可以连接HDMI或DisplayPort显示器。在这些情况下,这台设备将无法在使用外接显示器的同时通过USB-C充电。
我们可以十分满意地推荐东芝的Portégé X20w-D-10R。它较高的价位可能无法适合所有用户的预算,特别是个人用户或者小企业。
需要一台无降频现象且安静的设备的用户可以考虑采用无风扇散热设计的Aspire Switch Alpha 12。不过,这台设备的电池续航相对有限。相比之下,搭配散热风扇的微软 Surface Pro 4可能更加全面。华硕 Transformer 3 Pro T303UA由于较短的续航可能无法与其他设备竞争。我们正在测试的IdeaPad Miix 720-12IKB则降频问题较为严重,同时噪音过大。
注:本文是基于完整评测的缩减版本,阅读完整的英文评测,请点击这里。
Toshiba Portege X20W-D-10R
- 03/20/2017 v6 (old)
Sebastian Jentsch