戴尔 Latitude 12 E7270 笔记本电脑简短评测

| Networking | |
| iperf Server (receive) TCP 1 m 512KB | |
| Dell Latitude 12 E7270 | |
| Dell Latitude 13 7370 | |
| Lenovo ThinkPad X260-20F6007RGE | |
| iperf Client (transmit) TCP 1 m 512KB | |
| Lenovo ThinkPad X260-20F6007RGE | |
| Dell Latitude 13 7370 | |
| Dell Latitude 12 E7270 | |
| |||||||||||||||||||||||||
Brightness Distribution: 91 %
Center on Battery: 354 cd/m²
Contrast: 751:1 (Black: 0.47 cd/m²)
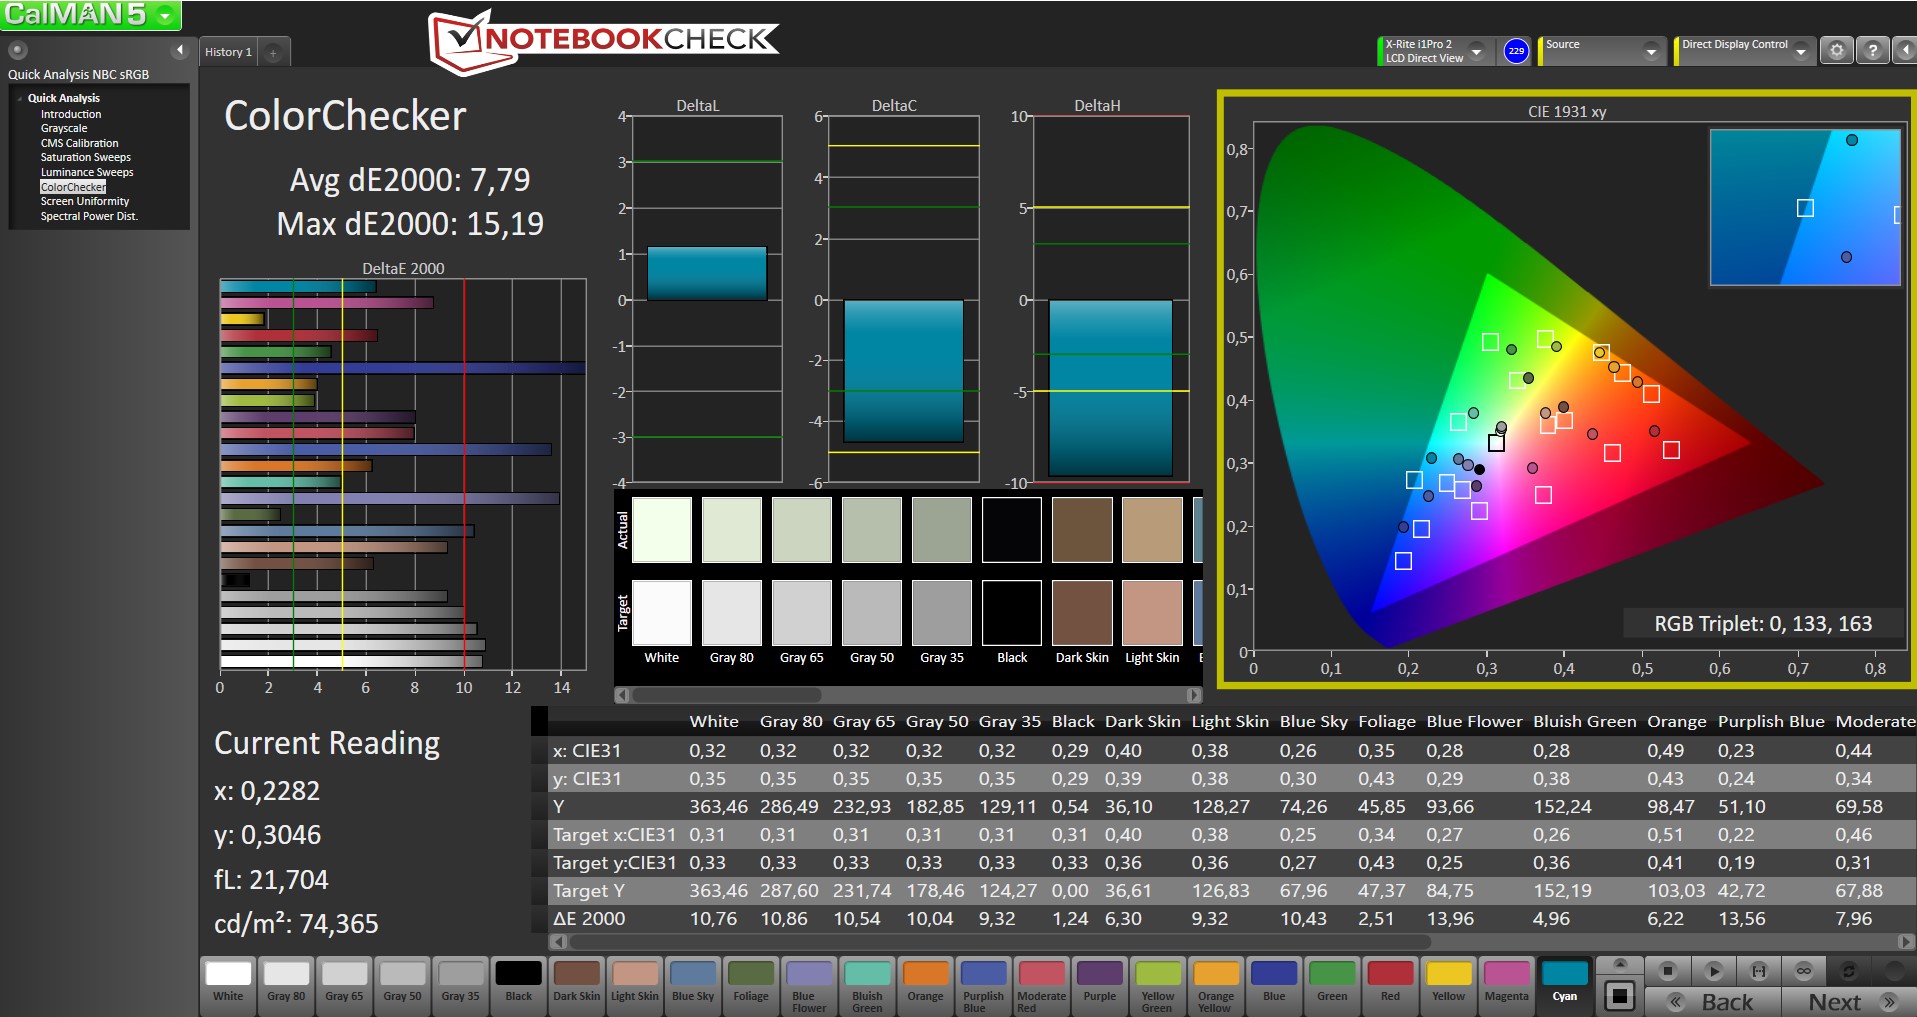
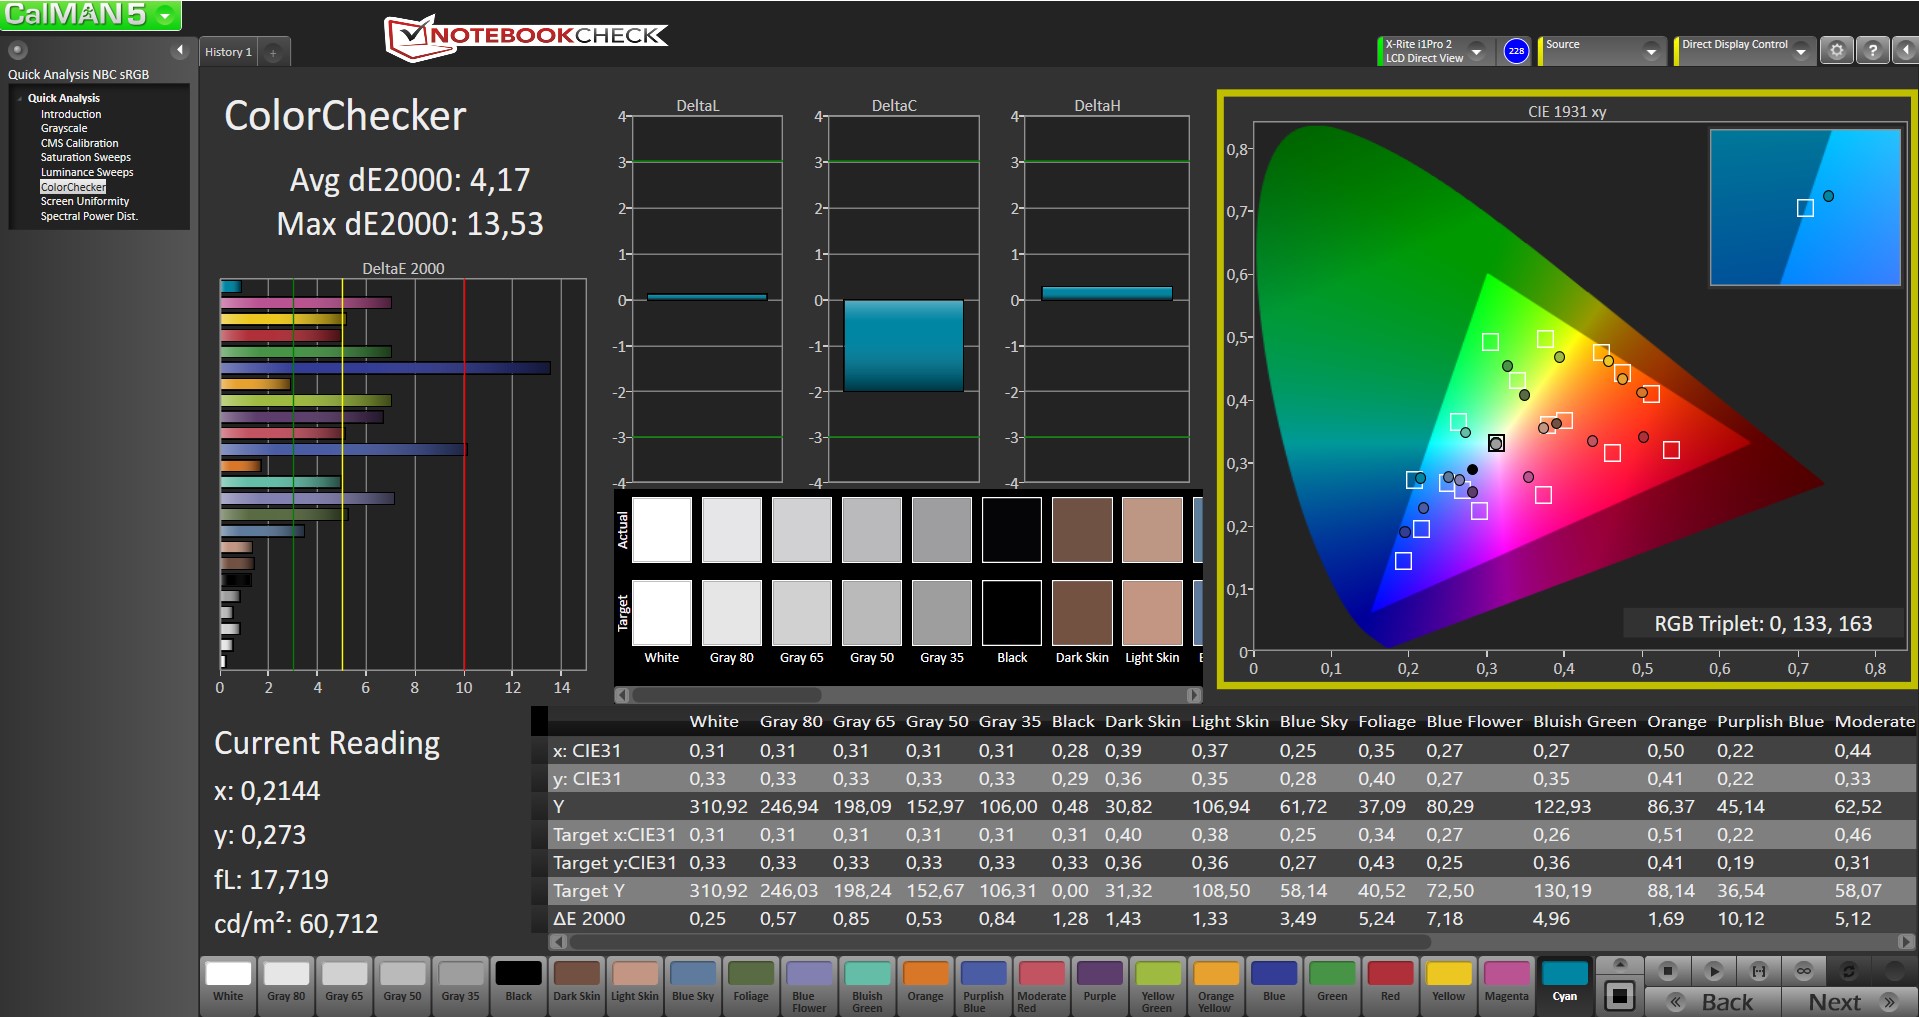
ΔE ColorChecker Calman: 7.79 | ∀{0.5-29.43 Ø4.71}
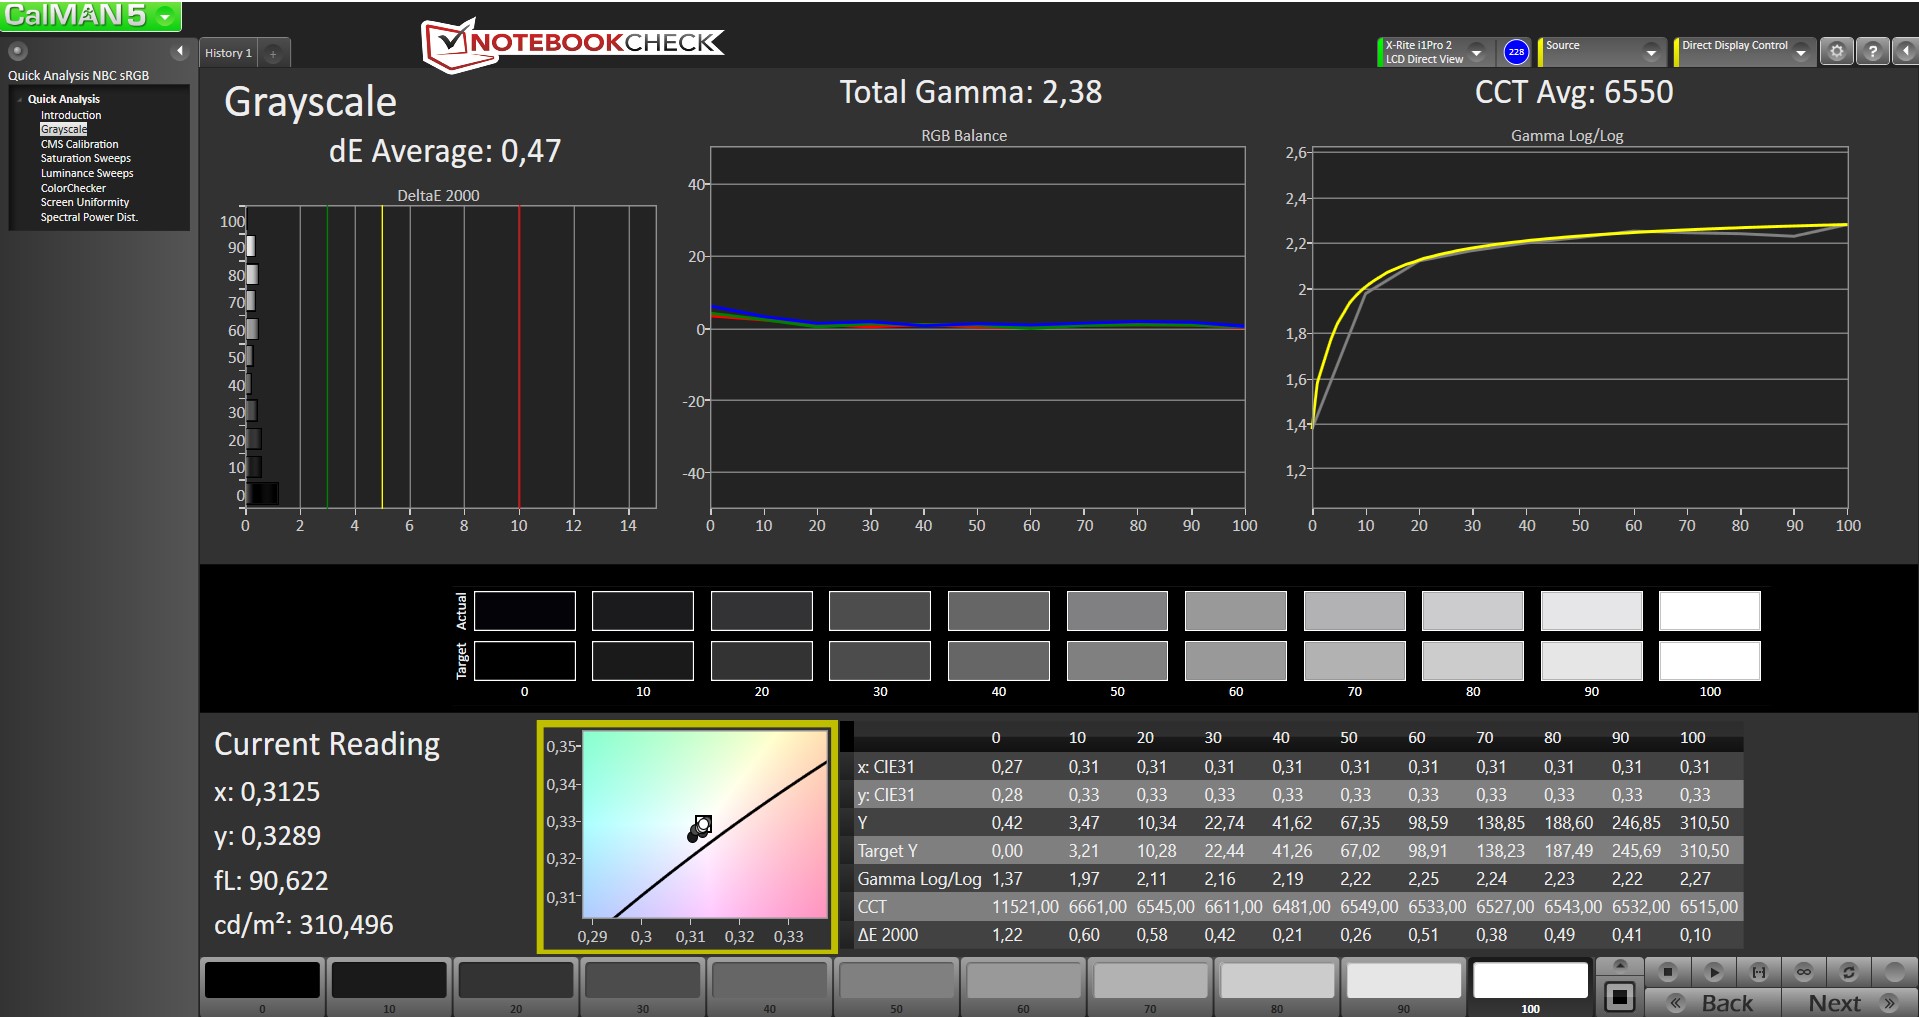
ΔE Greyscale Calman: 7.38 | ∀{0.09-98 Ø4.96}
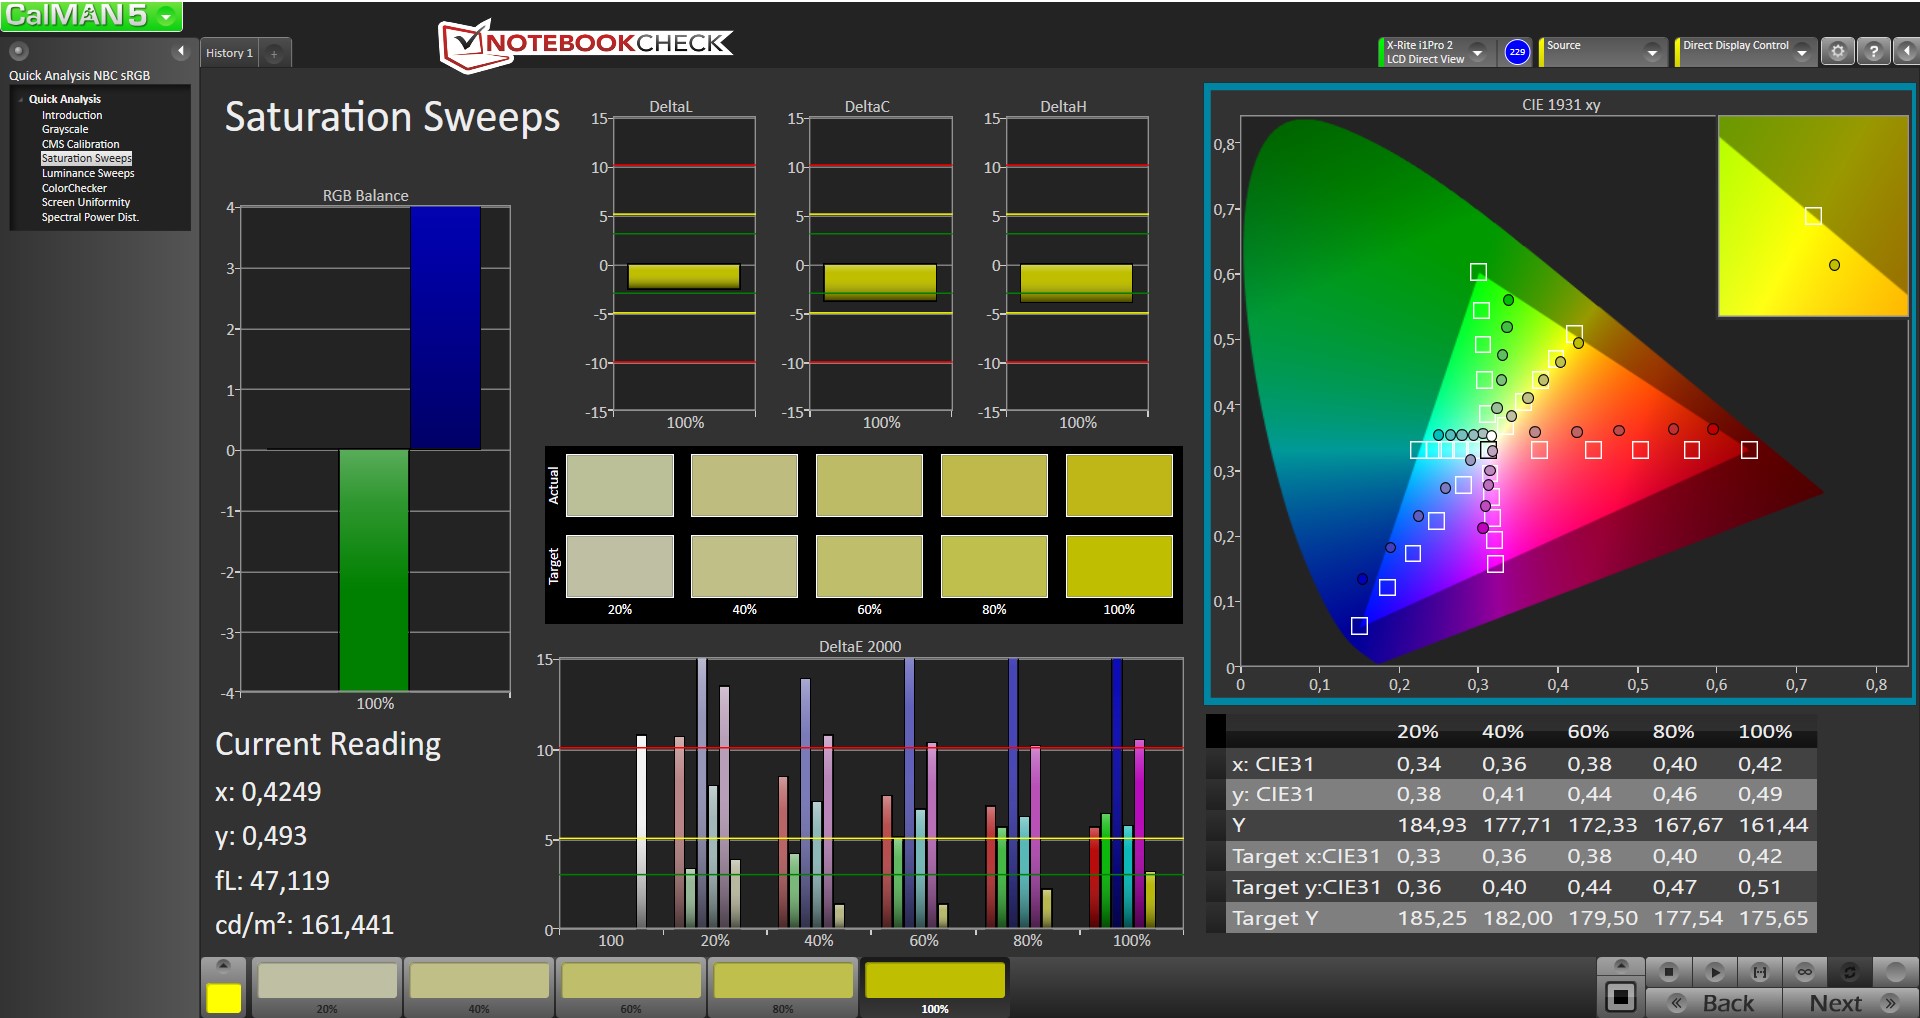
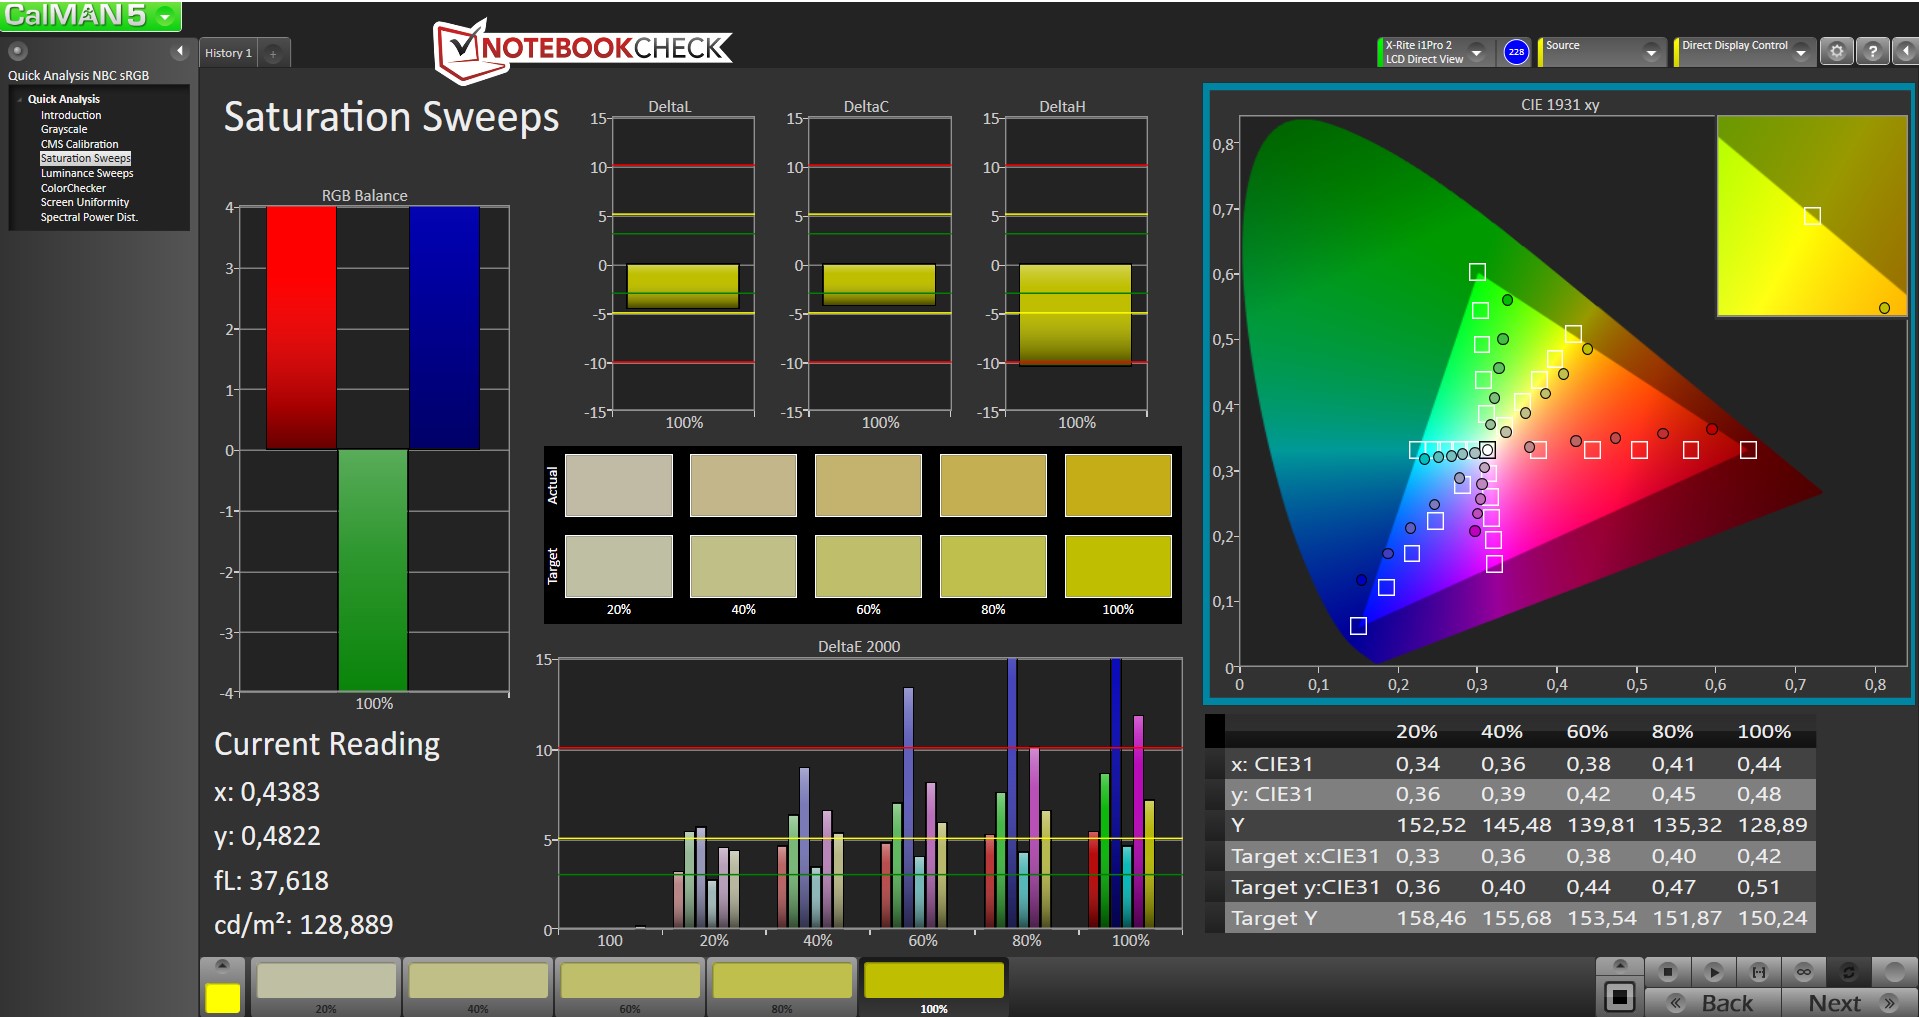
58.87% sRGB (Argyll 1.6.3 3D)
37.72% AdobeRGB 1998 (Argyll 1.6.3 3D)
41.07% AdobeRGB 1998 (Argyll 3D)
59.2% sRGB (Argyll 3D)
39.7% Display P3 (Argyll 3D)
Gamma: 2.43
CCT: 6158 K
| Dell Latitude 12 E7270 IPS LED, 1920x1080 | Lenovo ThinkPad X260-20F6007RGE IPS, 1920x1080 | HP EliteBook 820 G3 TN LED, 1366x768 | Dell Latitude 13 7370 IPS, 1920x1080 | Dell XPS 13 9350 WQXGA IPS, 3200x1800 | |
|---|---|---|---|---|---|
| Display | 13% | -2% | 31% | 58% | |
| Display P3 Coverage (%) | 39.7 | 44.71 13% | 38.9 -2% | 52.2 31% | 63.6 60% |
| sRGB Coverage (%) | 59.2 | 66.1 12% | 58.5 -1% | 78.3 32% | 92.3 56% |
| AdobeRGB 1998 Coverage (%) | 41.07 | 46.23 13% | 40.2 -2% | 53.9 31% | 65.4 59% |
| Response Times | 11% | -26% | -24% | -18% | |
| Response Time Grey 50% / Grey 80% * (ms) | 38.4 ? | 32.8 ? 15% | 58 ? -51% | 50.4 ? -31% | 50.8 ? -32% |
| Response Time Black / White * (ms) | 28.8 ? | 27.2 ? 6% | 29.2 ? -1% | 33.6 ? -17% | 29.6 ? -3% |
| PWM Frequency (Hz) | |||||
| Screen | 14% | -19% | 19% | 37% | |
| Brightness middle (cd/m²) | 353 | 337 -5% | 244 -31% | 261 -26% | 307.5 -13% |
| Brightness (cd/m²) | 334 | 322 -4% | 240 -28% | 241 -28% | 297 -11% |
| Brightness Distribution (%) | 91 | 91 0% | 84 -8% | 85 -7% | 92 1% |
| Black Level * (cd/m²) | 0.47 | 0.32 32% | 0.6 -28% | 0.26 45% | 0.207 56% |
| Contrast (:1) | 751 | 1053 40% | 407 -46% | 1004 34% | 1486 98% |
| Colorchecker dE 2000 * | 7.79 | 5.71 27% | 9 -16% | 4.3 45% | 4.18 46% |
| Colorchecker dE 2000 max. * | 15.19 | 15.39 -1% | 15.73 -4% | 8.66 43% | 7.84 48% |
| Greyscale dE 2000 * | 7.38 | 5.15 30% | 9.48 -28% | 5.82 21% | 4.94 33% |
| Gamma | 2.43 91% | 2.38 92% | 2.44 90% | 2.44 90% | 2.31 95% |
| CCT | 6158 106% | 6881 94% | 11116 58% | 6771 96% | 7645 85% |
| Color Space (Percent of AdobeRGB 1998) (%) | 37.72 | 42.38 12% | 37.18 -1% | 49.18 30% | 59 56% |
| Color Space (Percent of sRGB) (%) | 58.87 | 65.62 11% | 58.63 0% | 77.84 32% | 92 56% |
| Total Average (Program / Settings) | 13% /
13% | -16% /
-16% | 9% /
16% | 26% /
34% |
* ... smaller is better

Display Response Times
| ↔ Response Time Black to White | ||
|---|---|---|
| 28.8 ms ... rise ↗ and fall ↘ combined | ↗ 10.8 ms rise | 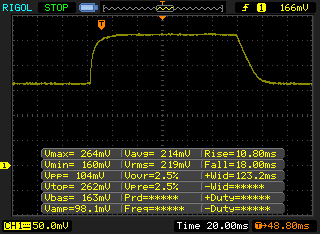 |
| ↘ 18 ms fall | ||
| The screen shows relatively slow response rates in our tests and may be too slow for gamers. In comparison, all tested devices range from 0.1 (minimum) to 240 (maximum) ms. » 76 % of all devices are better. This means that the measured response time is worse than the average of all tested devices (19.8 ms). | ||
| ↔ Response Time 50% Grey to 80% Grey | ||
| 38.4 ms ... rise ↗ and fall ↘ combined | ↗ 17.2 ms rise | 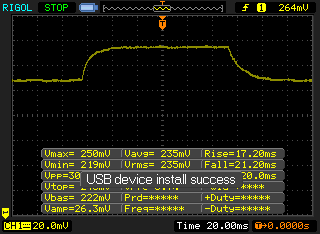 |
| ↘ 21.2 ms fall | ||
| The screen shows slow response rates in our tests and will be unsatisfactory for gamers. In comparison, all tested devices range from 0.165 (minimum) to 636 (maximum) ms. » 58 % of all devices are better. This means that the measured response time is worse than the average of all tested devices (31 ms). | ||
Screen Flickering / PWM (Pulse-Width Modulation)
| Screen flickering / PWM not detected | ||
In comparison: 52 % of all tested devices do not use PWM to dim the display. If PWM was detected, an average of 7754 (minimum: 5 - maximum: 343500) Hz was measured. | ||
| PCMark 8 Home Score Accelerated v2 | 3420 points | |
| PCMark 8 Work Score Accelerated v2 | 4395 points | |
Help | ||
| CrystalDiskMark 3.0 | |
| Write 4k | |
| Samsung SM951 MZVPV256HDGL m.2 PCI-e | |
| Liteon L8H-256V2G | |
| Liteonit LCH-512V2S | |
| Read 4k | |
| Samsung SM951 MZVPV256HDGL m.2 PCI-e | |
| Liteonit LCH-512V2S | |
| Liteon L8H-256V2G | |

| 3DMark - 1280x720 Cloud Gate Standard Score | |
| Dell XPS 13 9350 WQXGA | |
| Lenovo ThinkPad X260-20F6007RGE | |
| Dell Latitude 12 E7270 | |
| HP EliteBook 820 G3 | |
| Dell Latitude 12 E7250 | |
| Dell Latitude 13 7370 | |
| 3DMark 11 - 1280x720 Performance | |
| Dell XPS 13 9350 WQXGA | |
| Dell Latitude 12 E7270 | |
| HP EliteBook 820 G3 | |
| Lenovo ThinkPad X260-20F6007RGE | |
| Dell Latitude 13 7370 | |
| Dell Latitude 12 E7250 | |
| 3DMark 11 Performance | 1433 points | |
| 3DMark Ice Storm Standard Score | 47956 points | |
| 3DMark Cloud Gate Standard Score | 5250 points | |
| 3DMark Fire Strike Score | 698 points | |
Help | ||
| low | med. | high | ultra | |
|---|---|---|---|---|
| BioShock Infinite (2013) | 38 | 25 | 19 | 5 |
| Battlefield 4 (2013) | 35 | 25 | 16 | 5 |
| Rise of the Tomb Raider (2016) | 14 | 9 | 5 |
Noise level
| Idle |
| 28.9 / 28.9 / 28.9 dB(A) |
| Load |
| 31.3 / 37.6 dB(A) |
 | ||
30 dB silent 40 dB(A) audible 50 dB(A) loud |
||
min: | ||
(±) The maximum temperature on the upper side is 44.3 °C / 112 F, compared to the average of 35.9 °C / 97 F, ranging from 21.4 to 59 °C for the class Subnotebook.
(-) The bottom heats up to a maximum of 52.6 °C / 127 F, compared to the average of 39.2 °C / 103 F
(+) In idle usage, the average temperature for the upper side is 30.2 °C / 86 F, compared to the device average of 30.8 °C / 87 F.
(+) The palmrests and touchpad are reaching skin temperature as a maximum (32.8 °C / 91 F) and are therefore not hot.
(-) The average temperature of the palmrest area of similar devices was 28.2 °C / 82.8 F (-4.6 °C / -8.2 F).
| Off / Standby | |
| Idle | |
| Load |
|
Key:
min: | |
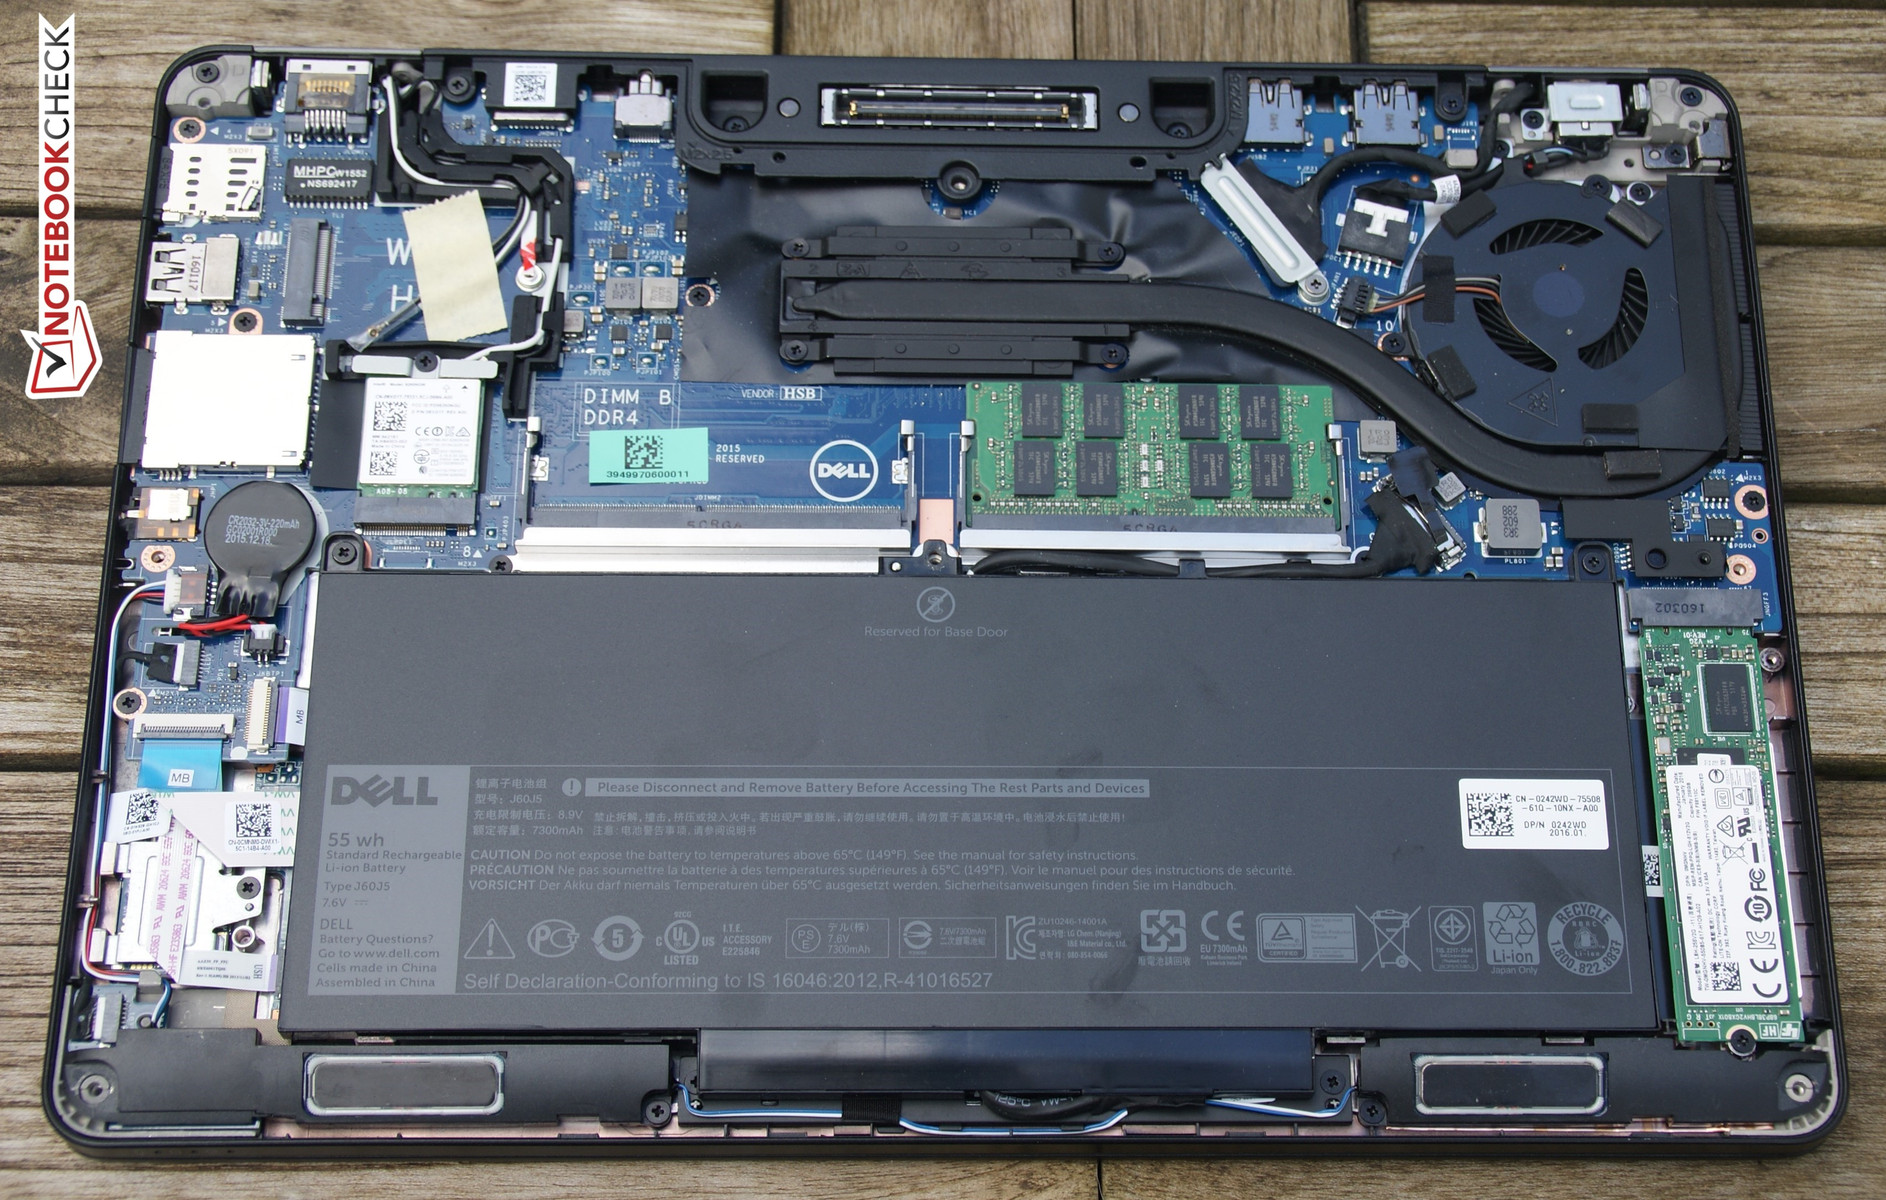
| Dell Latitude 12 E7270 55 Wh | Lenovo ThinkPad X260-20F6007RGE 46 Wh | HP Elitebook 820 G2-J8R58EA 46 Wh | Dell Latitude 12 E7250 52 Wh | Dell XPS 13 9350 WQXGA 56 Wh | Dell Latitude 13 7370 34 Wh | |
|---|---|---|---|---|---|---|
| Power Consumption | -2% | -5% | -23% | -41% | 0% | |
| Idle Minimum * (Watt) | 3.8 | 3.5 8% | 3.1 18% | 4.1 -8% | 7.2 -89% | 5 -32% |
| Idle Average * (Watt) | 6.7 | 5.5 18% | 5.8 13% | 8.3 -24% | 9.3 -39% | 7.5 -12% |
| Idle Maximum * (Watt) | 7.2 | 6.7 7% | 6.5 10% | 9.4 -31% | 11.6 -61% | 8 -11% |
| Load Average * (Watt) | 27.2 | 28.9 -6% | 30.5 -12% | 31.6 -16% | 31.9 -17% | 15.3 44% |
| Load Maximum * (Watt) | 30.2 | 42.1 -39% | 46.3 -53% | 40.4 -34% | 29.9 1% | 26.8 11% |
* ... smaller is better
| Battery Runtime - WiFi Websurfing | |
| Dell Latitude 12 E7270 | |
| Lenovo ThinkPad X260-20F6007RGE | |
| Dell Latitude 13 7370 | |
| HP Elitebook 820 G2-J8R58EA | |
| Dell XPS 13 9350 WQXGA | |
Pros
Cons
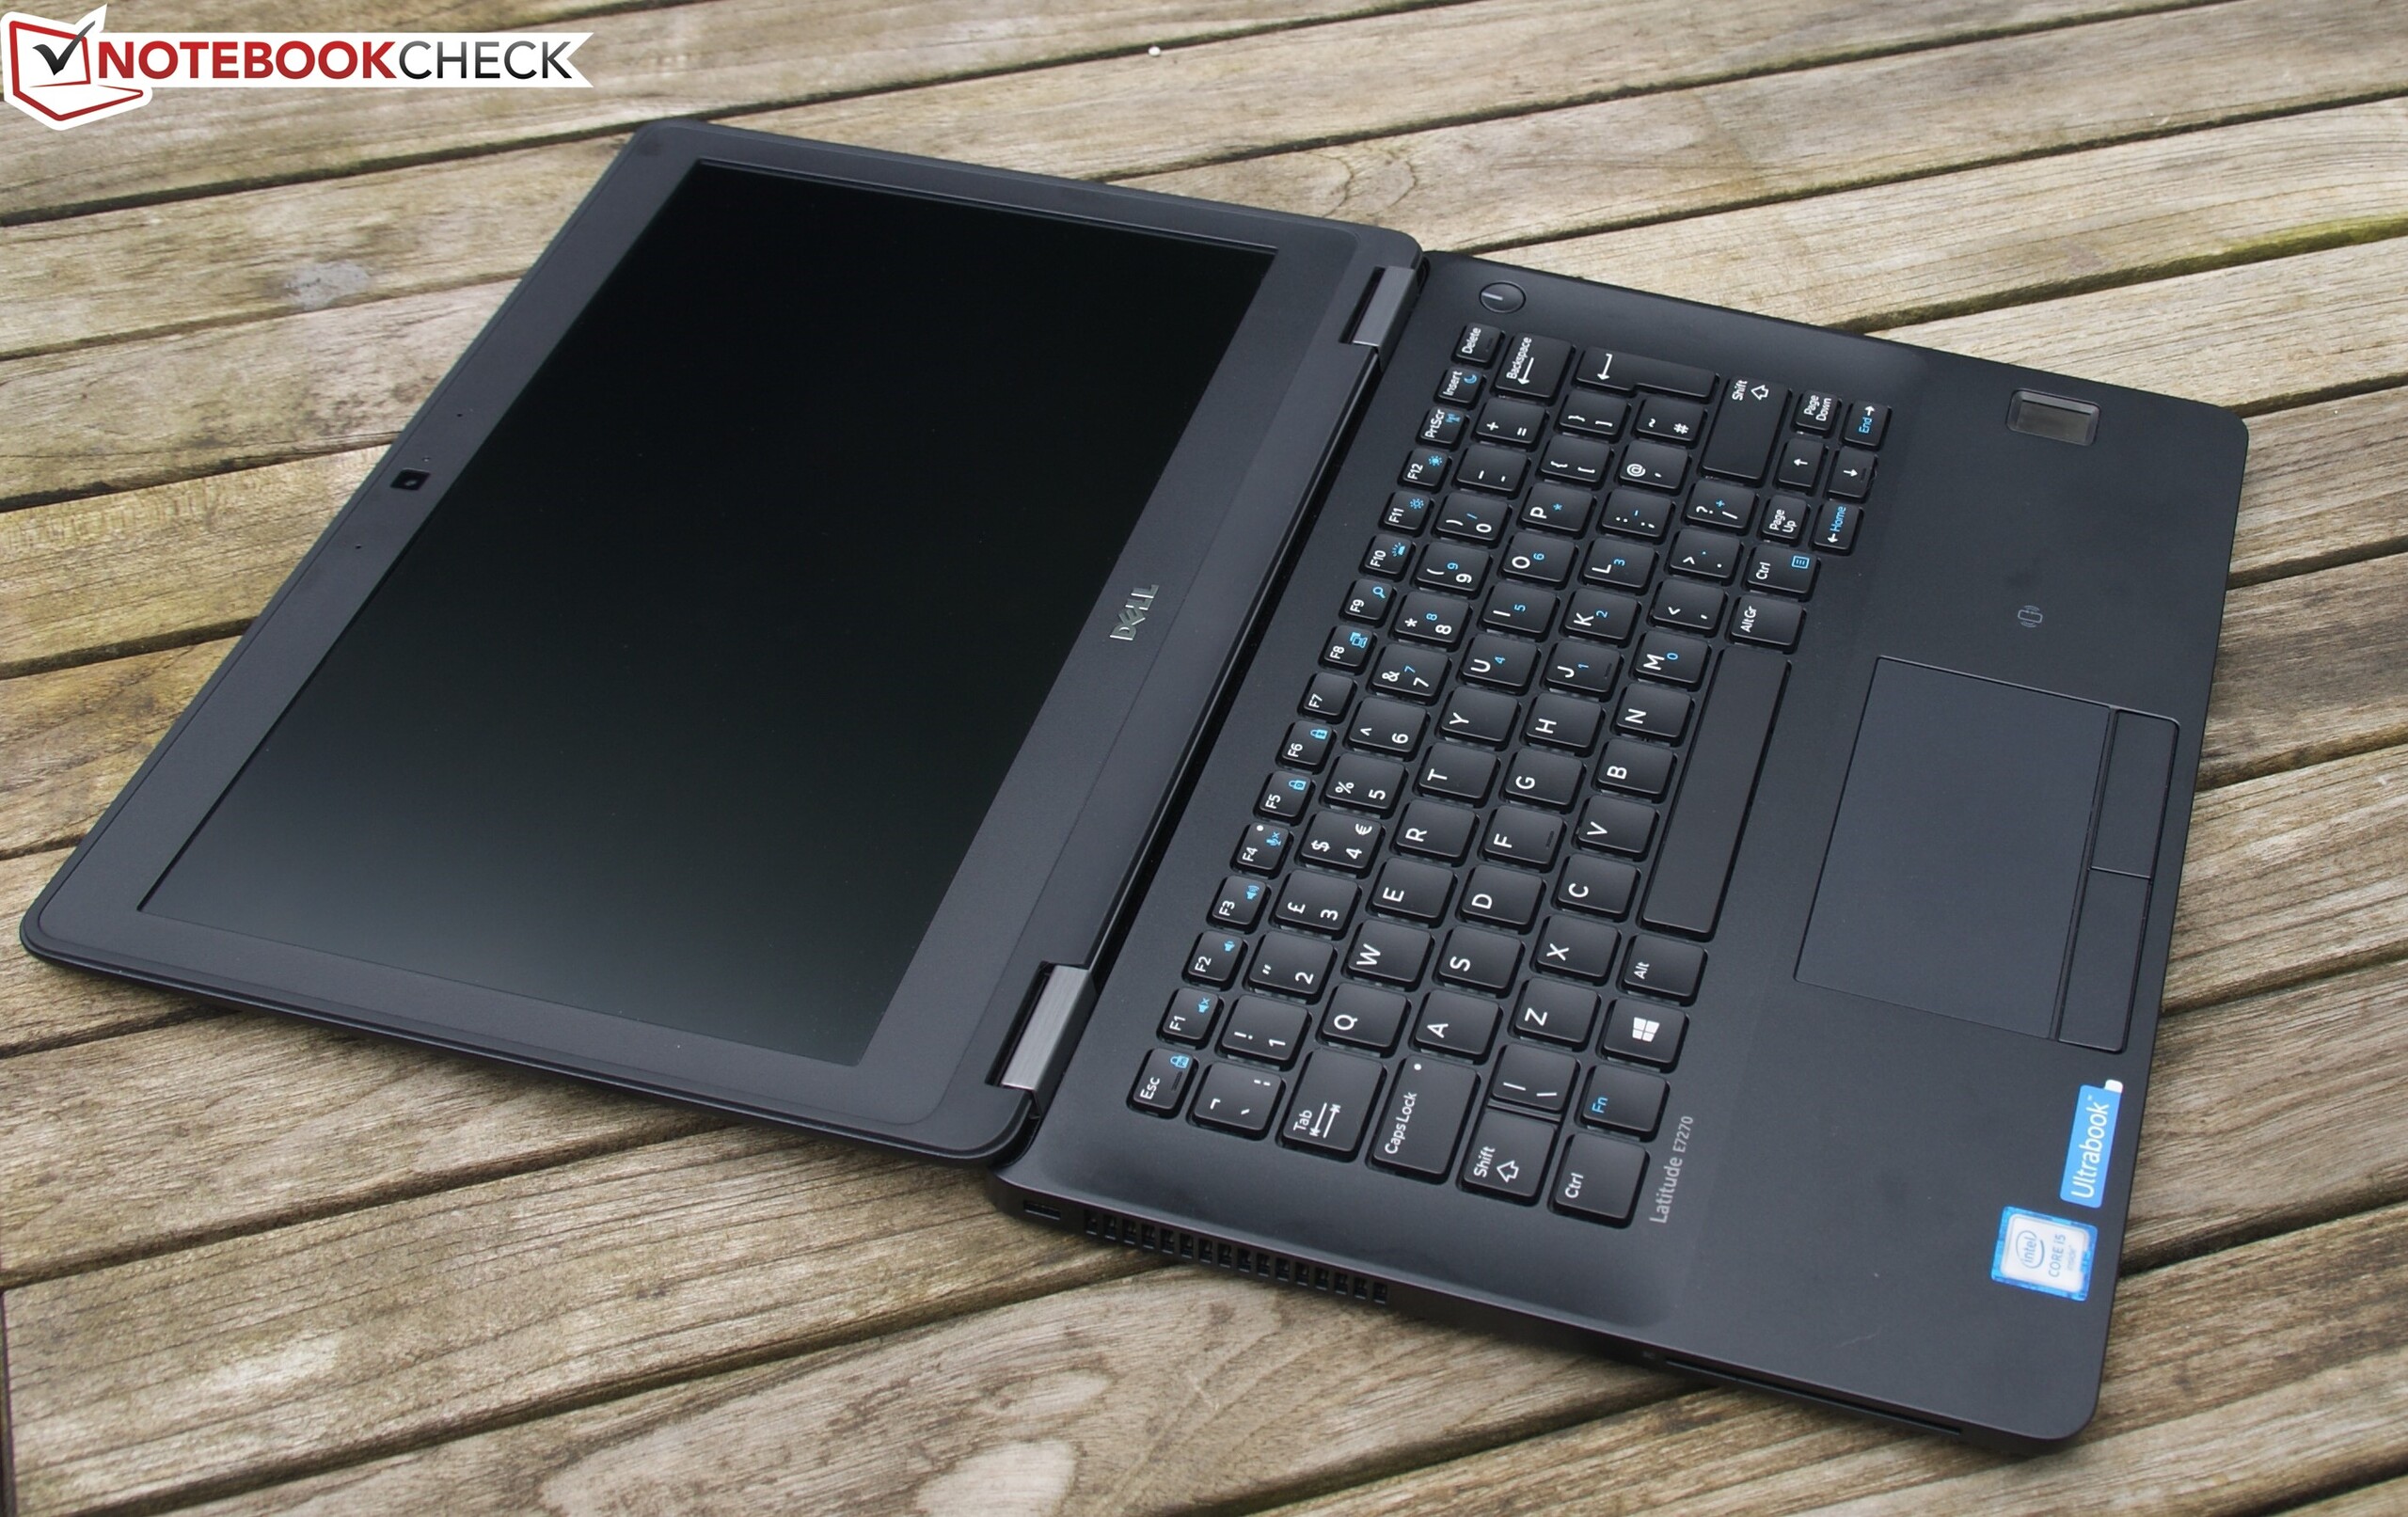
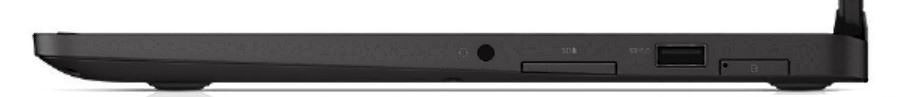
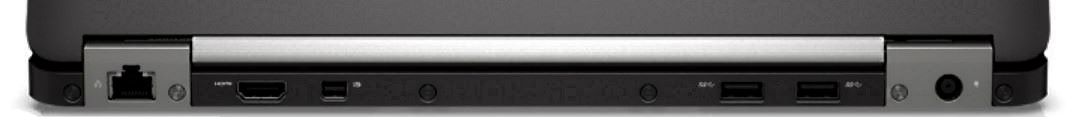
Latitude 7000系列的Skylake更新没有让我们失望。E7270是戴尔为商务用户带来的一款强调高便携性的高品质设备。它的屏幕具备300尼特的高亮度,甚至高于戴尔配置表提供的数字,同时它的电池续航也十分出色,机身小巧轻盈。归功于坚固的机身材质,用户在移动中不需特别担心这台设备的安全。另外E7270也特别灵活多变,它搭配了布局合理的丰富接口,这也是它设计出色的机身的一贯优势。E7270应该完全可以作为便携办公设备满足用户的需要。常见的商务功能如安全功能和扩展坞也一应俱全。
我们认为对于商务用户来说它十分值得推荐。不过,惠普 820 G3和联想 ThinkPad X260也不落于下风。它们的最大区别在于一些细节。这台Latitude没有搭配指点杆,这对于商务设备来说十分让人意外,相比竞争设备可能会成为它的一个弱点。尽管它搭配的55瓦时电池为它在电池续航上占据了一定优势,但联想设备支持Power Bridge技术更胜一筹。E7270的另外一个弱点是它屏幕的色彩还原。不过,联想机型也只是略占上风(我们只测试了惠普的高清屏幕机型,作为比较可能不太公平)。
戴尔带来了一台无懈可击的办公设备。不过,如果用户不需要一些特定的商务功能的话,这台Latitude可能会被自家的XPS 13抢去一些潜在用户。
如果考虑到商务市场之外的设备的话,情况就会比较复杂。戴尔自己的XPS 13提供了尺寸更大更优秀的屏幕,更现代的窄边框设计。同时它的售价较低,由于搭配了Thunderbolt接口也能更好的适应未来使用。另一方面,它的可扩展性不够优秀,在亚笔记本竞争中也缺少一些商务功能的支持。
注:本文是基于完整评测的缩减版本,阅读完整的英文评测,请点击这里。
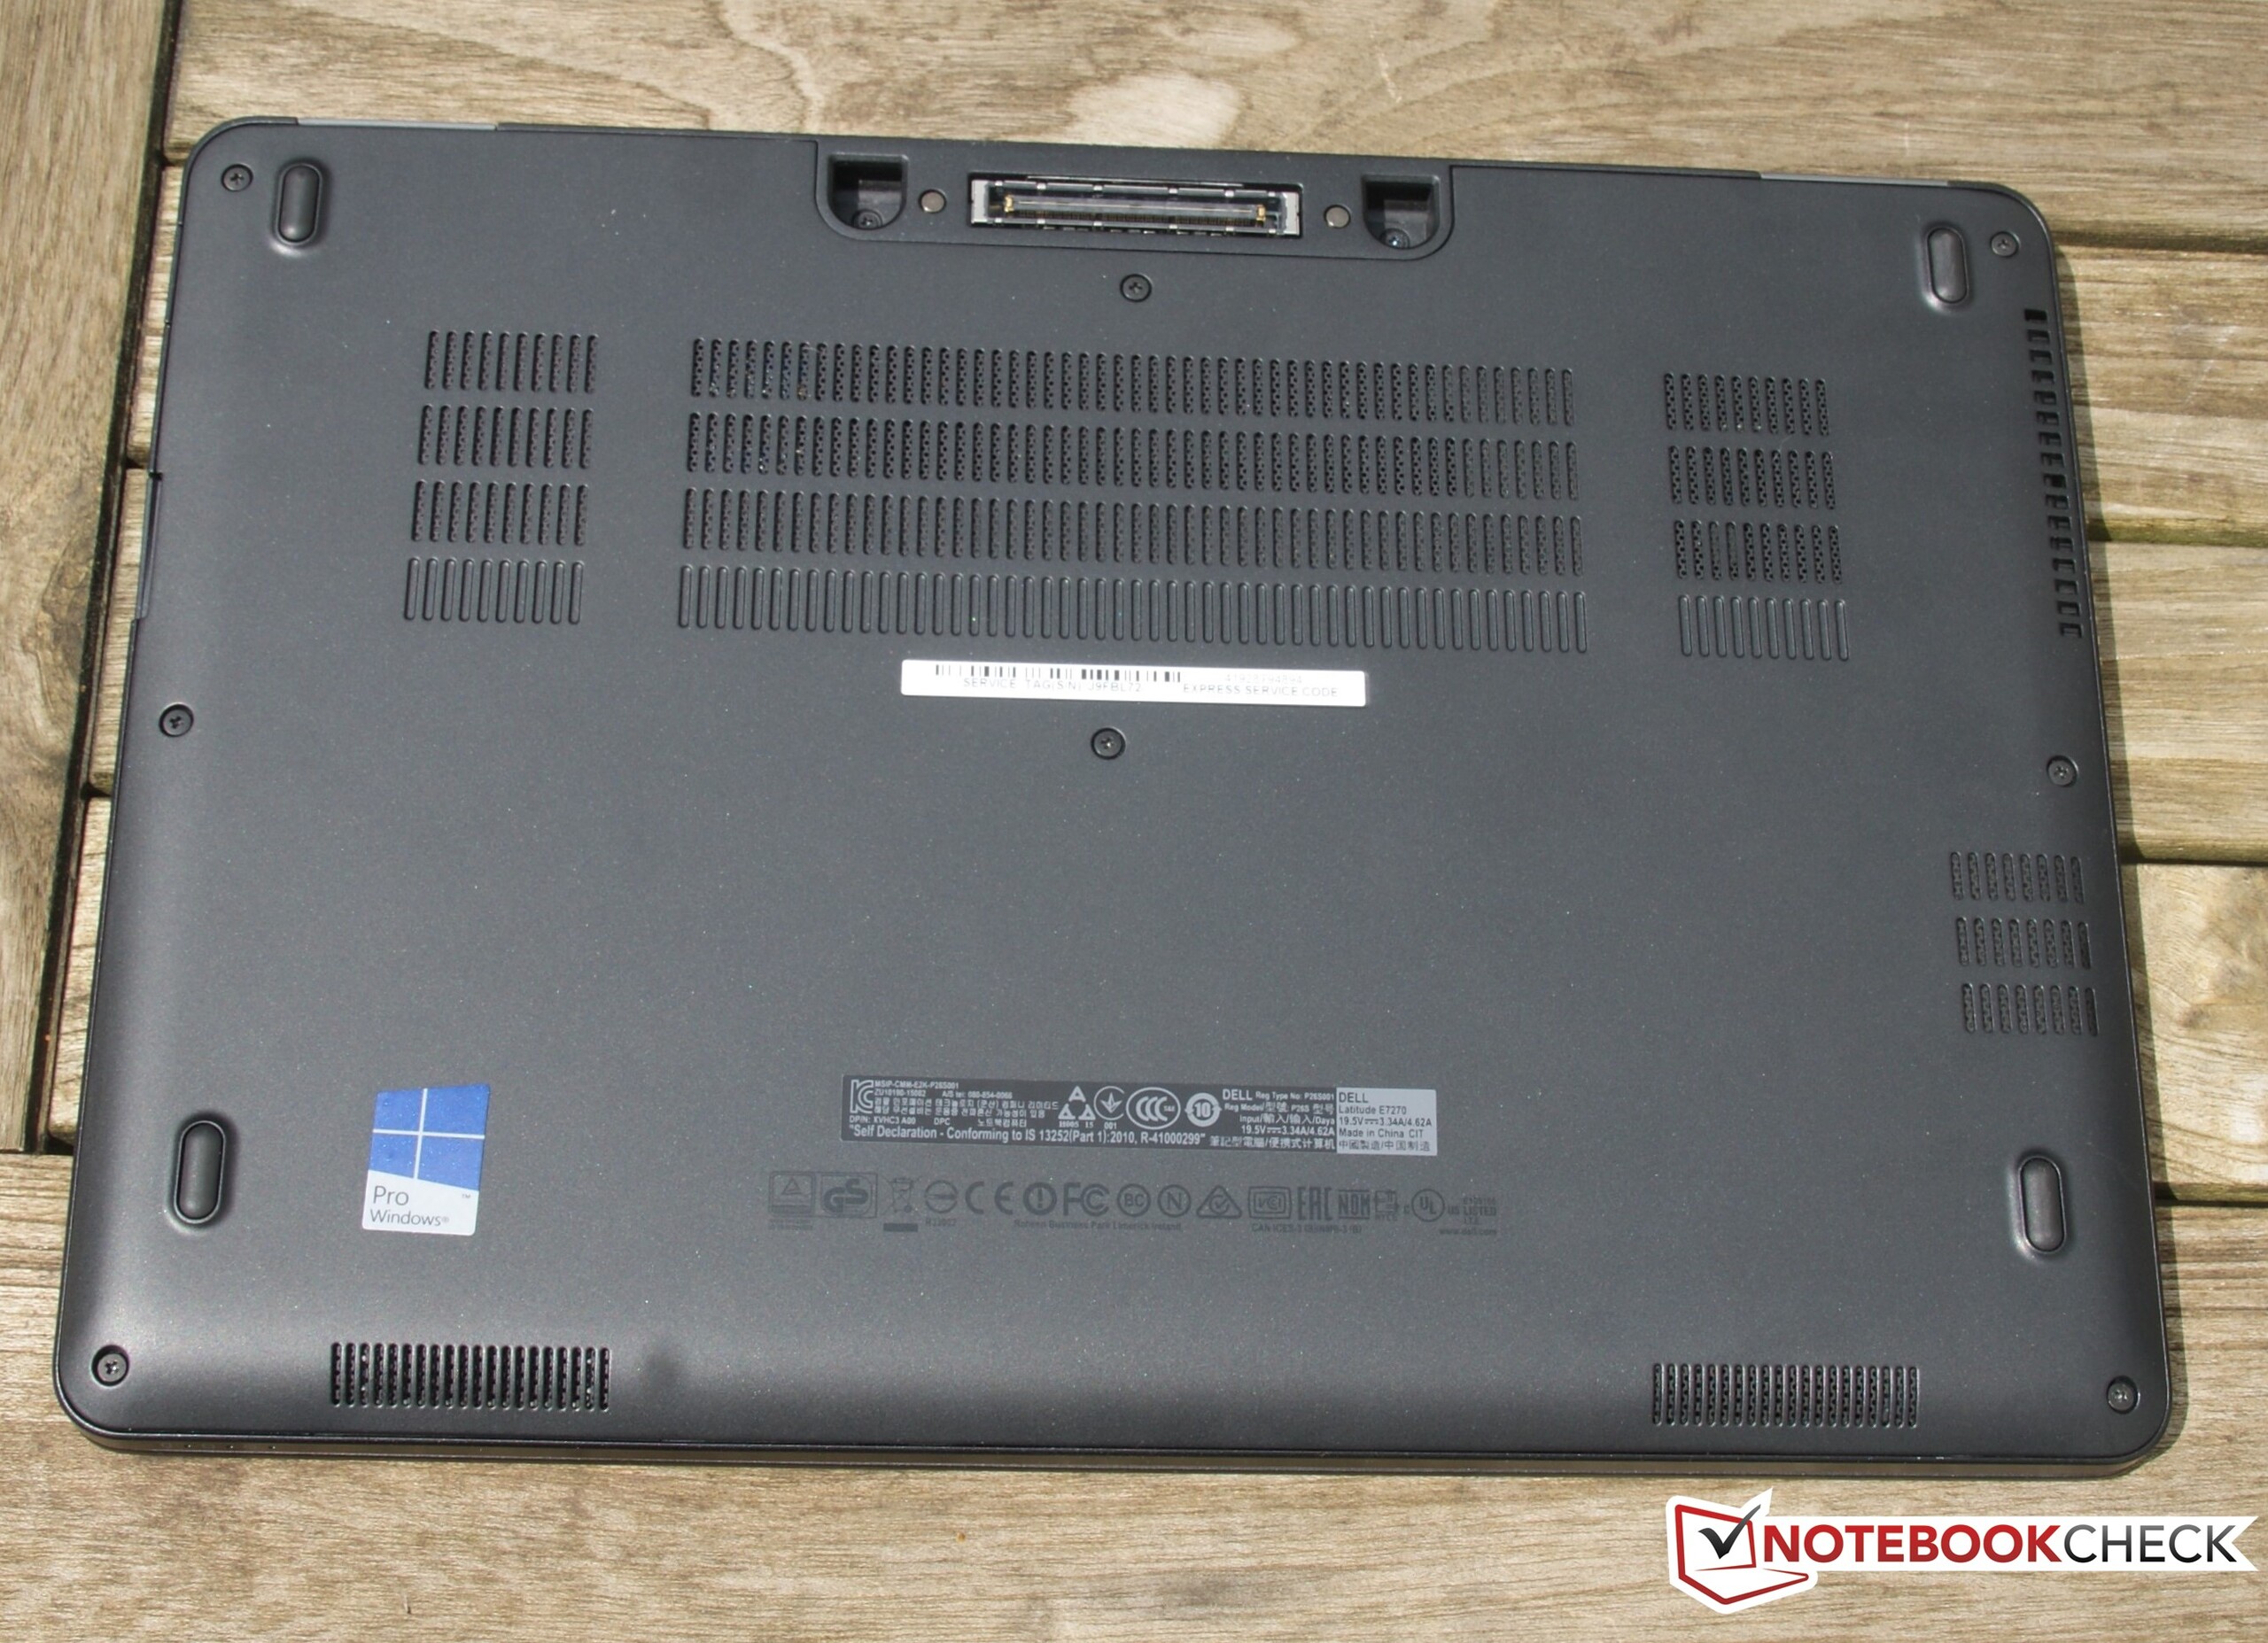
Dell Latitude 12 E7270
- 06/30/2016 v5.1 (old)
Benjamin Herzig