戴尔 Latitude 5580 (全高清, i5-7300U) 笔记本电脑简短评测
| |||||||||||||||||||||||||
Brightness Distribution: 84 %
Center on Battery: 234 cd/m²
Contrast: 1300:1 (Black: 0.18 cd/m²)
ΔE ColorChecker Calman: 5.3 | ∀{0.5-29.43 Ø4.71}
ΔE Greyscale Calman: 4 | ∀{0.09-98 Ø4.96}
60% sRGB (Argyll 1.6.3 3D)
39% AdobeRGB 1998 (Argyll 1.6.3 3D)
42.94% AdobeRGB 1998 (Argyll 3D)
60.7% sRGB (Argyll 3D)
41.57% Display P3 (Argyll 3D)
Gamma: 2.46
CCT: 6441 K
| Dell Latitude 5580 BOE NV15N42, , 1920x1080, 15.6" | Dell Latitude 5580 1366x768, 15.6" | Lenovo ThinkPad T470s-20HGS00V00 B140QAN01.5, , 2560x1440, 14" | |
|---|---|---|---|
| Display | -2% | 62% | |
| Display P3 Coverage (%) | 41.57 | 40.13 -3% | 69 66% |
| sRGB Coverage (%) | 60.7 | 60 -1% | 95.1 57% |
| AdobeRGB 1998 Coverage (%) | 42.94 | 41.5 -3% | 69.6 62% |
| Response Times | 20% | 3% | |
| Response Time Grey 50% / Grey 80% * (ms) | 43 ? | 30 ? 30% | 46.4 ? -8% |
| Response Time Black / White * (ms) | 33 ? | 29.6 ? 10% | 28.8 ? 13% |
| PWM Frequency (Hz) | 1020 ? | 201.6 ? | |
| Screen | -79% | -1% | |
| Brightness middle (cd/m²) | 234 | 238 2% | 327 40% |
| Brightness (cd/m²) | 224 | 216 -4% | 311 39% |
| Brightness Distribution (%) | 84 | 83 -1% | 88 5% |
| Black Level * (cd/m²) | 0.18 | 0.53 -194% | 0.25 -39% |
| Contrast (:1) | 1300 | 449 -65% | 1308 1% |
| Colorchecker dE 2000 * | 5.3 | 10.8 -104% | 6.1 -15% |
| Colorchecker dE 2000 max. * | 9.09 | 29.3 -222% | 12.2 -34% |
| Greyscale dE 2000 * | 4 | 12.1 -203% | 8.8 -120% |
| Gamma | 2.46 89% | 2.25 98% | 2.18 101% |
| CCT | 6441 101% | 14344 45% | 6172 105% |
| Color Space (Percent of AdobeRGB 1998) (%) | 39 | 38.3 -2% | 61.56 58% |
| Color Space (Percent of sRGB) (%) | 60 | 59.9 0% | 94.88 58% |
| Total Average (Program / Settings) | -20% /
-51% | 21% /
12% |
* ... smaller is better
Display Response Times
| ↔ Response Time Black to White | ||
|---|---|---|
| 33 ms ... rise ↗ and fall ↘ combined | ↗ 19 ms rise | 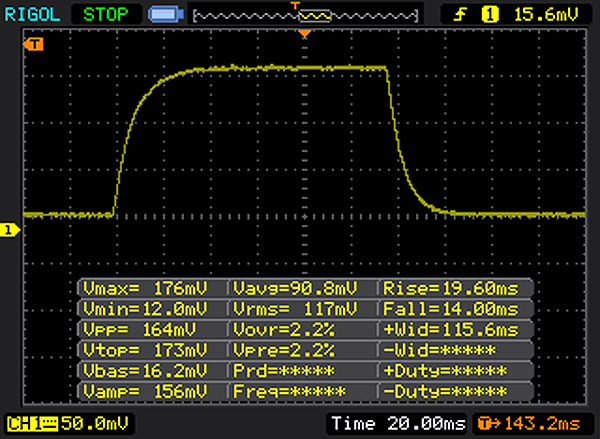 |
| ↘ 14 ms fall | ||
| The screen shows slow response rates in our tests and will be unsatisfactory for gamers. In comparison, all tested devices range from 0.1 (minimum) to 240 (maximum) ms. » 89 % of all devices are better. This means that the measured response time is worse than the average of all tested devices (19.8 ms). | ||
| ↔ Response Time 50% Grey to 80% Grey | ||
| 43 ms ... rise ↗ and fall ↘ combined | ↗ 23 ms rise | 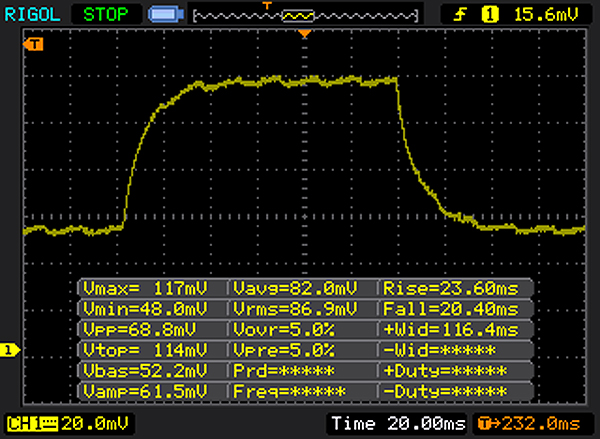 |
| ↘ 20 ms fall | ||
| The screen shows slow response rates in our tests and will be unsatisfactory for gamers. In comparison, all tested devices range from 0.165 (minimum) to 636 (maximum) ms. » 71 % of all devices are better. This means that the measured response time is worse than the average of all tested devices (30.9 ms). | ||
Screen Flickering / PWM (Pulse-Width Modulation)
| Screen flickering / PWM detected | 1020 Hz | 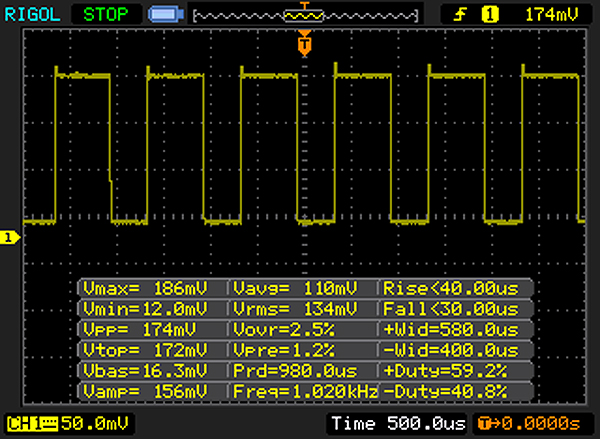 | |
| ≤ 90 cd/m² brightness | |||
The display backlight flickers at 1020 Hz (worst case, e.g., utilizing PWM) Flickering detected at a brightness setting of 90 cd/m² and below. There should be no flickering or PWM above this brightness setting. The frequency of 1020 Hz is quite high, so most users sensitive to PWM should not notice any flickering. Flickering occurs at relatively low brightness settings, so extended use at this brightness setting or lower can cause eyestrain. In comparison: 52 % of all tested devices do not use PWM to dim the display. If PWM was detected, an average of 7744 (minimum: 5 - maximum: 343500) Hz was measured. | |||
| PCMark 8 Home Score Accelerated v2 | 3300 points | |
Help | ||
| 3DMark 11 - 1280x720 Performance GPU | |
| Lenovo ThinkPad T470s-20HGS00V00 | |
| Dell Latitude 5289 | |
| Lenovo ThinkPad T470s-20HF0012US | |
| HP EliteBook x360 1030 G2 | |
| Dell Latitude 5580 | |
| Dell Latitude 5580 | |
| BioShock Infinite | |
| 1280x720 Very Low Preset | |
| Lenovo ThinkPad T470s-20HF0012US | |
| Dell Latitude 5580 | |
| Dell Latitude 5580 | |
| 1366x768 Medium Preset | |
| Lenovo ThinkPad T470s-20HF0012US | |
| Dell Latitude 5580 | |
| Dell Latitude 5580 | |
| low | med. | high | ultra | |
|---|---|---|---|---|
| BioShock Infinite (2013) | 39.7 | 23.6 | 19.6 |
Noise level
| Idle |
| 32.8 / 32.8 / 33.6 dB(A) |
| Load |
| 37.6 / 37.6 dB(A) |
 | ||
30 dB silent 40 dB(A) audible 50 dB(A) loud |
||
min: | ||
(+) The maximum temperature on the upper side is 35.4 °C / 96 F, compared to the average of 34.3 °C / 94 F, ranging from 21.2 to 62.5 °C for the class Office.
(±) The bottom heats up to a maximum of 41.8 °C / 107 F, compared to the average of 36.8 °C / 98 F
(+) In idle usage, the average temperature for the upper side is 27.2 °C / 81 F, compared to the device average of 29.5 °C / 85 F.
(+) The palmrests and touchpad are cooler than skin temperature with a maximum of 28.1 °C / 82.6 F and are therefore cool to the touch.
(±) The average temperature of the palmrest area of similar devices was 27.6 °C / 81.7 F (-0.5 °C / -0.9 F).
| Off / Standby | |
| Idle | |
| Load |
|
Key:
min: | |
| Dell Latitude 5580 i5-7300U, HD Graphics 620, Toshiba MQ01ACF050, IPS, 1920x1080, 15.6" | Lenovo ThinkPad T470s-20HF0012US i5-7300U, HD Graphics 620, Samsung PM961 MZVLW256HEHP, IPS, 1920x1080, 14" | Dell Latitude 5580 i5-7200U, HD Graphics 620, Seagate ST500LM021-1KJ15, TN LED, 1366x768, 15.6" | HP Probook 650 G3 Z2W44ET i5-7200U, HD Graphics 620, Hitachi Travelstar Z7K500 HTS725050A7E630, TN LED, 1920x1080, 15.6" | |
|---|---|---|---|---|
| Power Consumption | -3% | 19% | 17% | |
| Idle Minimum * (Watt) | 4.3 | 4.8 -12% | 3.5 19% | 4 7% |
| Idle Average * (Watt) | 10.1 | 6.6 35% | 6 41% | 6.9 32% |
| Idle Maximum * (Watt) | 11.8 | 7 41% | 7.3 38% | 7.6 36% |
| Load Average * (Watt) | 32 | 39.2 -23% | 30.8 4% | 29 9% |
| Load Maximum * (Watt) | 29 | 44.8 -54% | 31 -7% | 28.7 1% |
* ... smaller is better
| Dell Latitude 5580 i5-7300U, HD Graphics 620, 68 Wh | Lenovo ThinkPad T470s-20HF0012US i5-7300U, HD Graphics 620, 51 Wh | Dell Latitude 5580 i5-7200U, HD Graphics 620, 68 Wh | HP Probook 650 G3 Z2W44ET i5-7200U, HD Graphics 620, 48 Wh | |
|---|---|---|---|---|
| Battery runtime | -21% | 14% | -24% | |
| WiFi v1.3 (h) | 10.2 | 8.1 -21% | 11.6 14% | 7.8 -24% |
| Reader / Idle (h) | 17.7 | 18.4 | 12.8 | |
| Load (h) | 2.9 | 2.2 | 3 | |
| H.264 (h) | 6.7 |
Pros
Cons
乍看起来,这台Latitude 5580和我们已经测试过的那台没有什么不一样。但事实上全高清屏幕产生了很大的不同且使得整个配置更加完备。我们在上次的评测中就对它出色的输入体验赞许有加,它很合适在工作或是在家中的长时间打字操作。戴尔Latitude 5580特别为了商业市场提供了一些重要的安全功能。
配置中的处理器升级说不上是成功。我们的基准测试并没有发现明显的性能提升。它甚至导致续航时间减少了一小时。
戴尔 Latitude 是一台可靠的笔记本,无论是作为一台商务本还是日常用办公本。
但是,消费者也应该考虑一下联想ThinkPad T470s,它有着更快的固态硬盘而且在我们的基准测试中表现得更好。
注:本文是基于完整评测的缩减版本,阅读完整的英文评测,请点击这里。
Dell Latitude 5580
- 07/02/2017 v6 (old)
Nino Ricchizzi