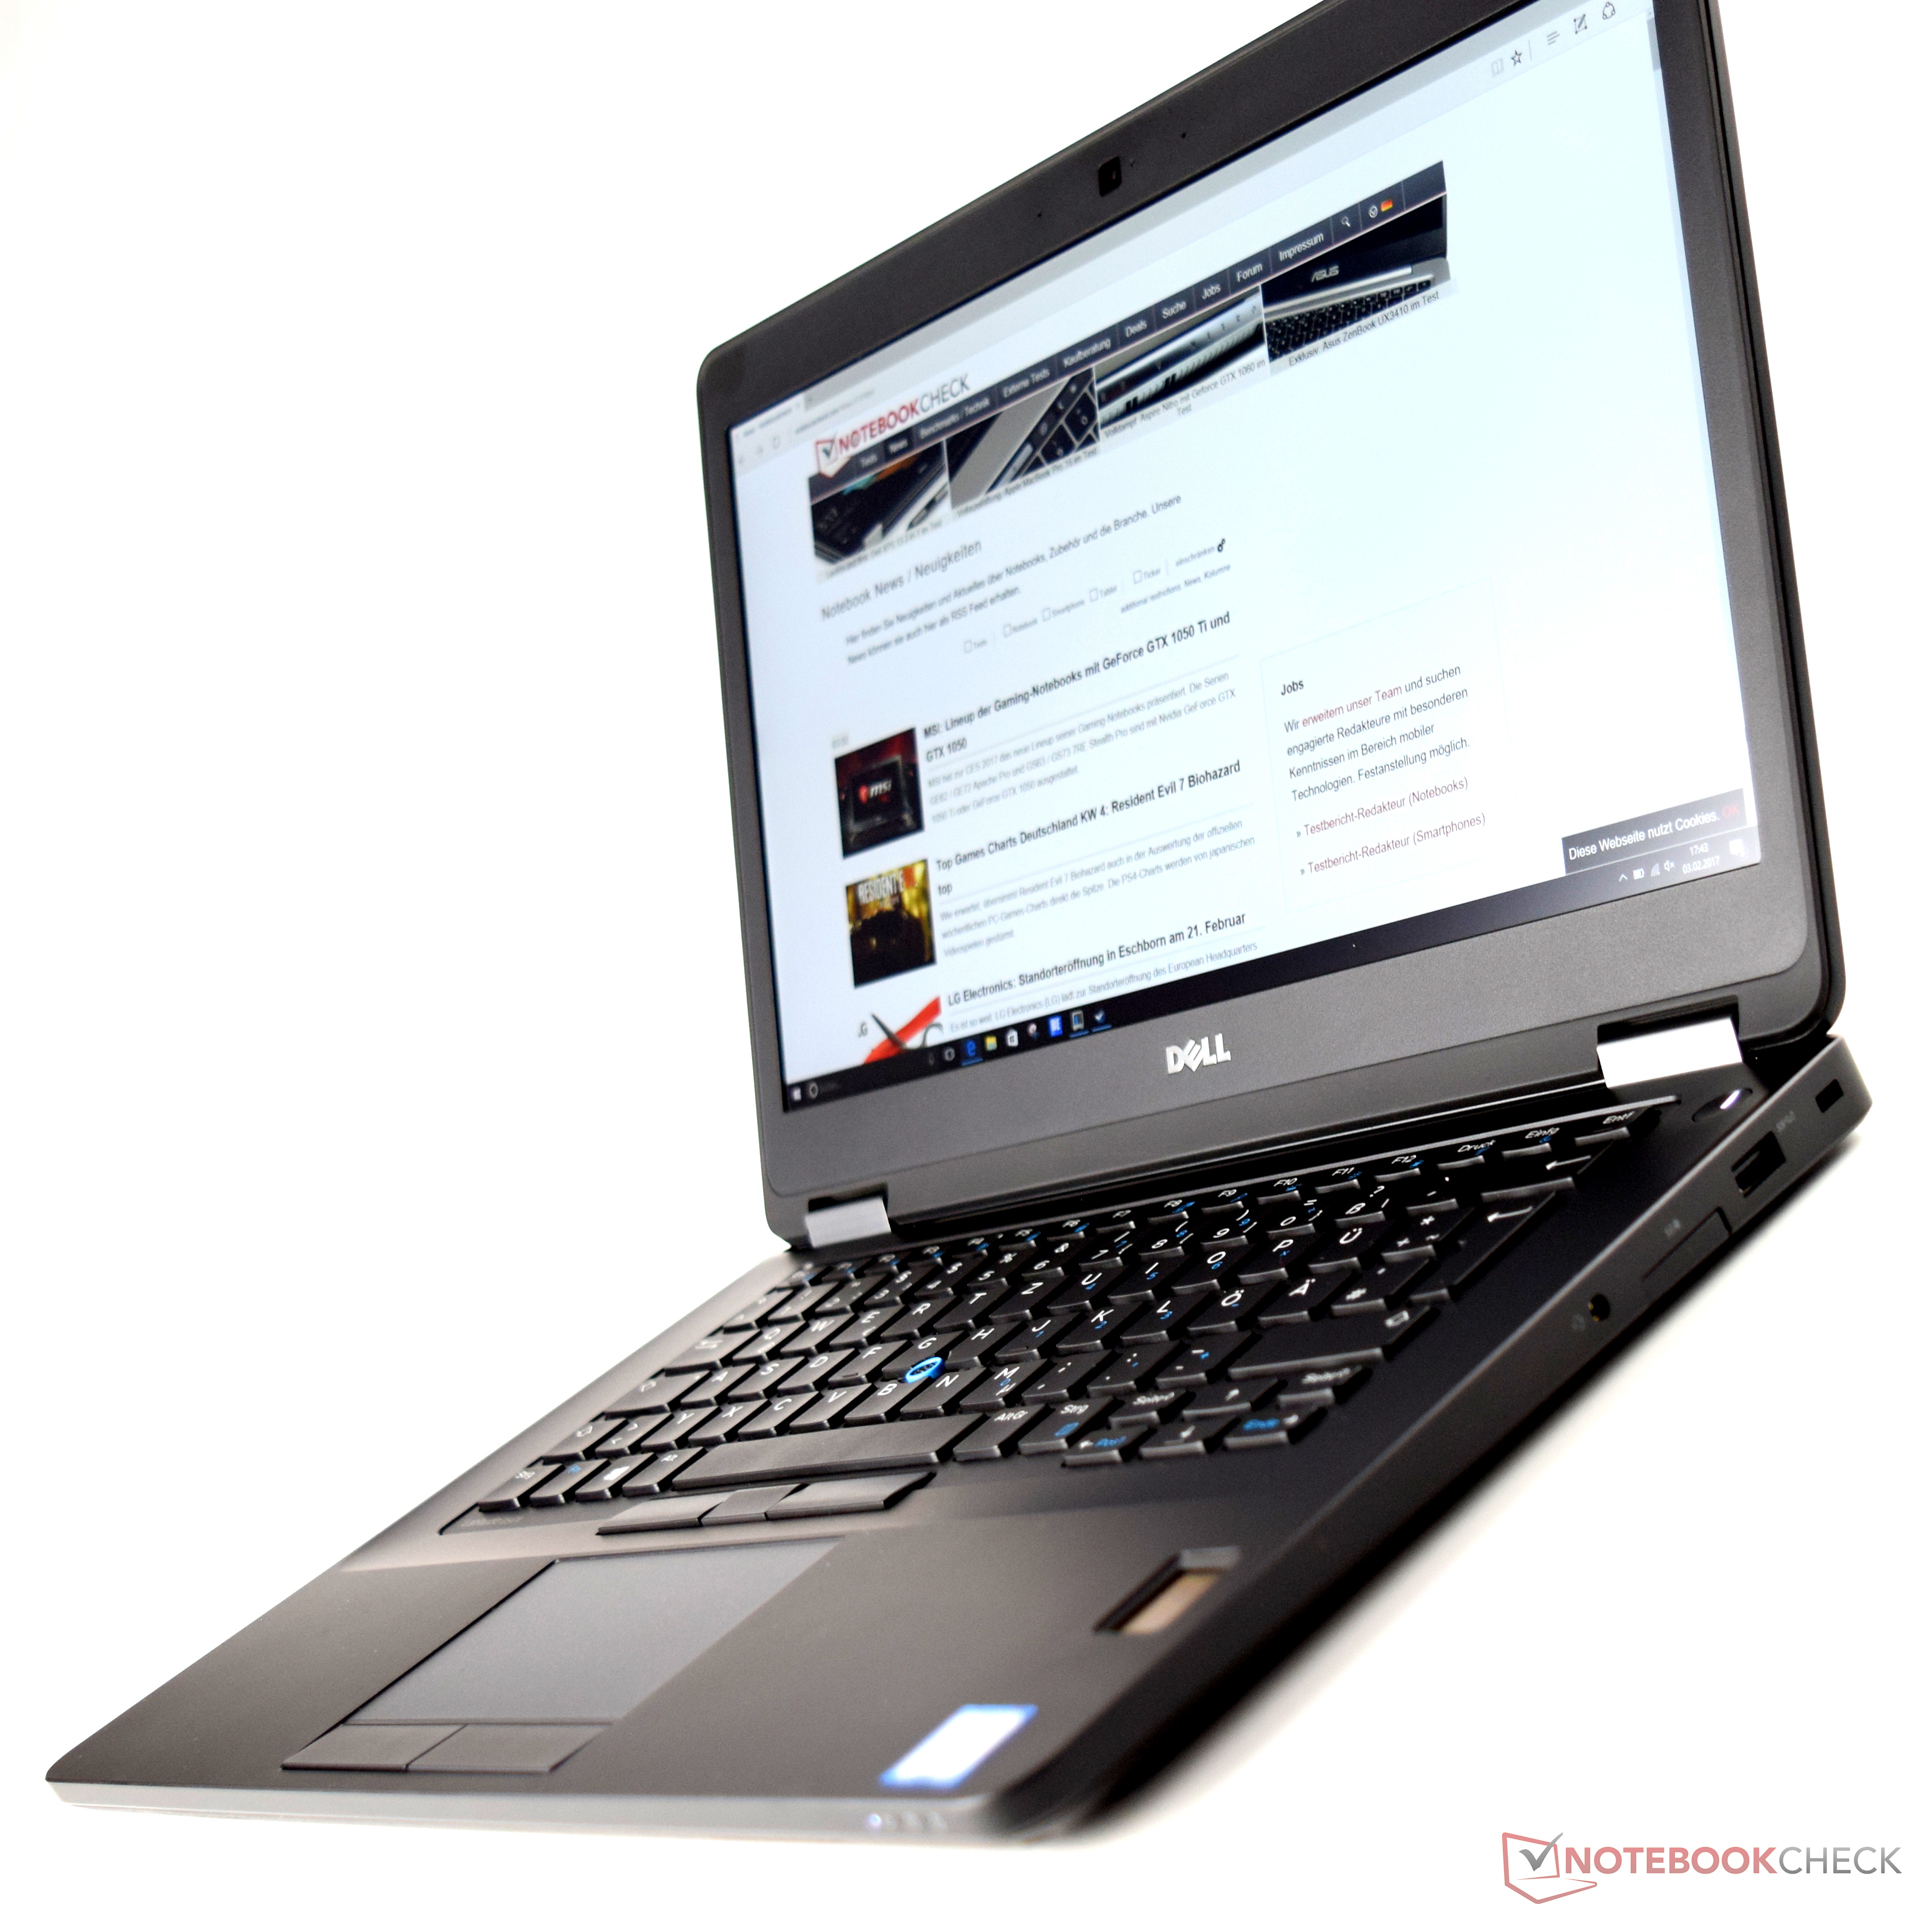
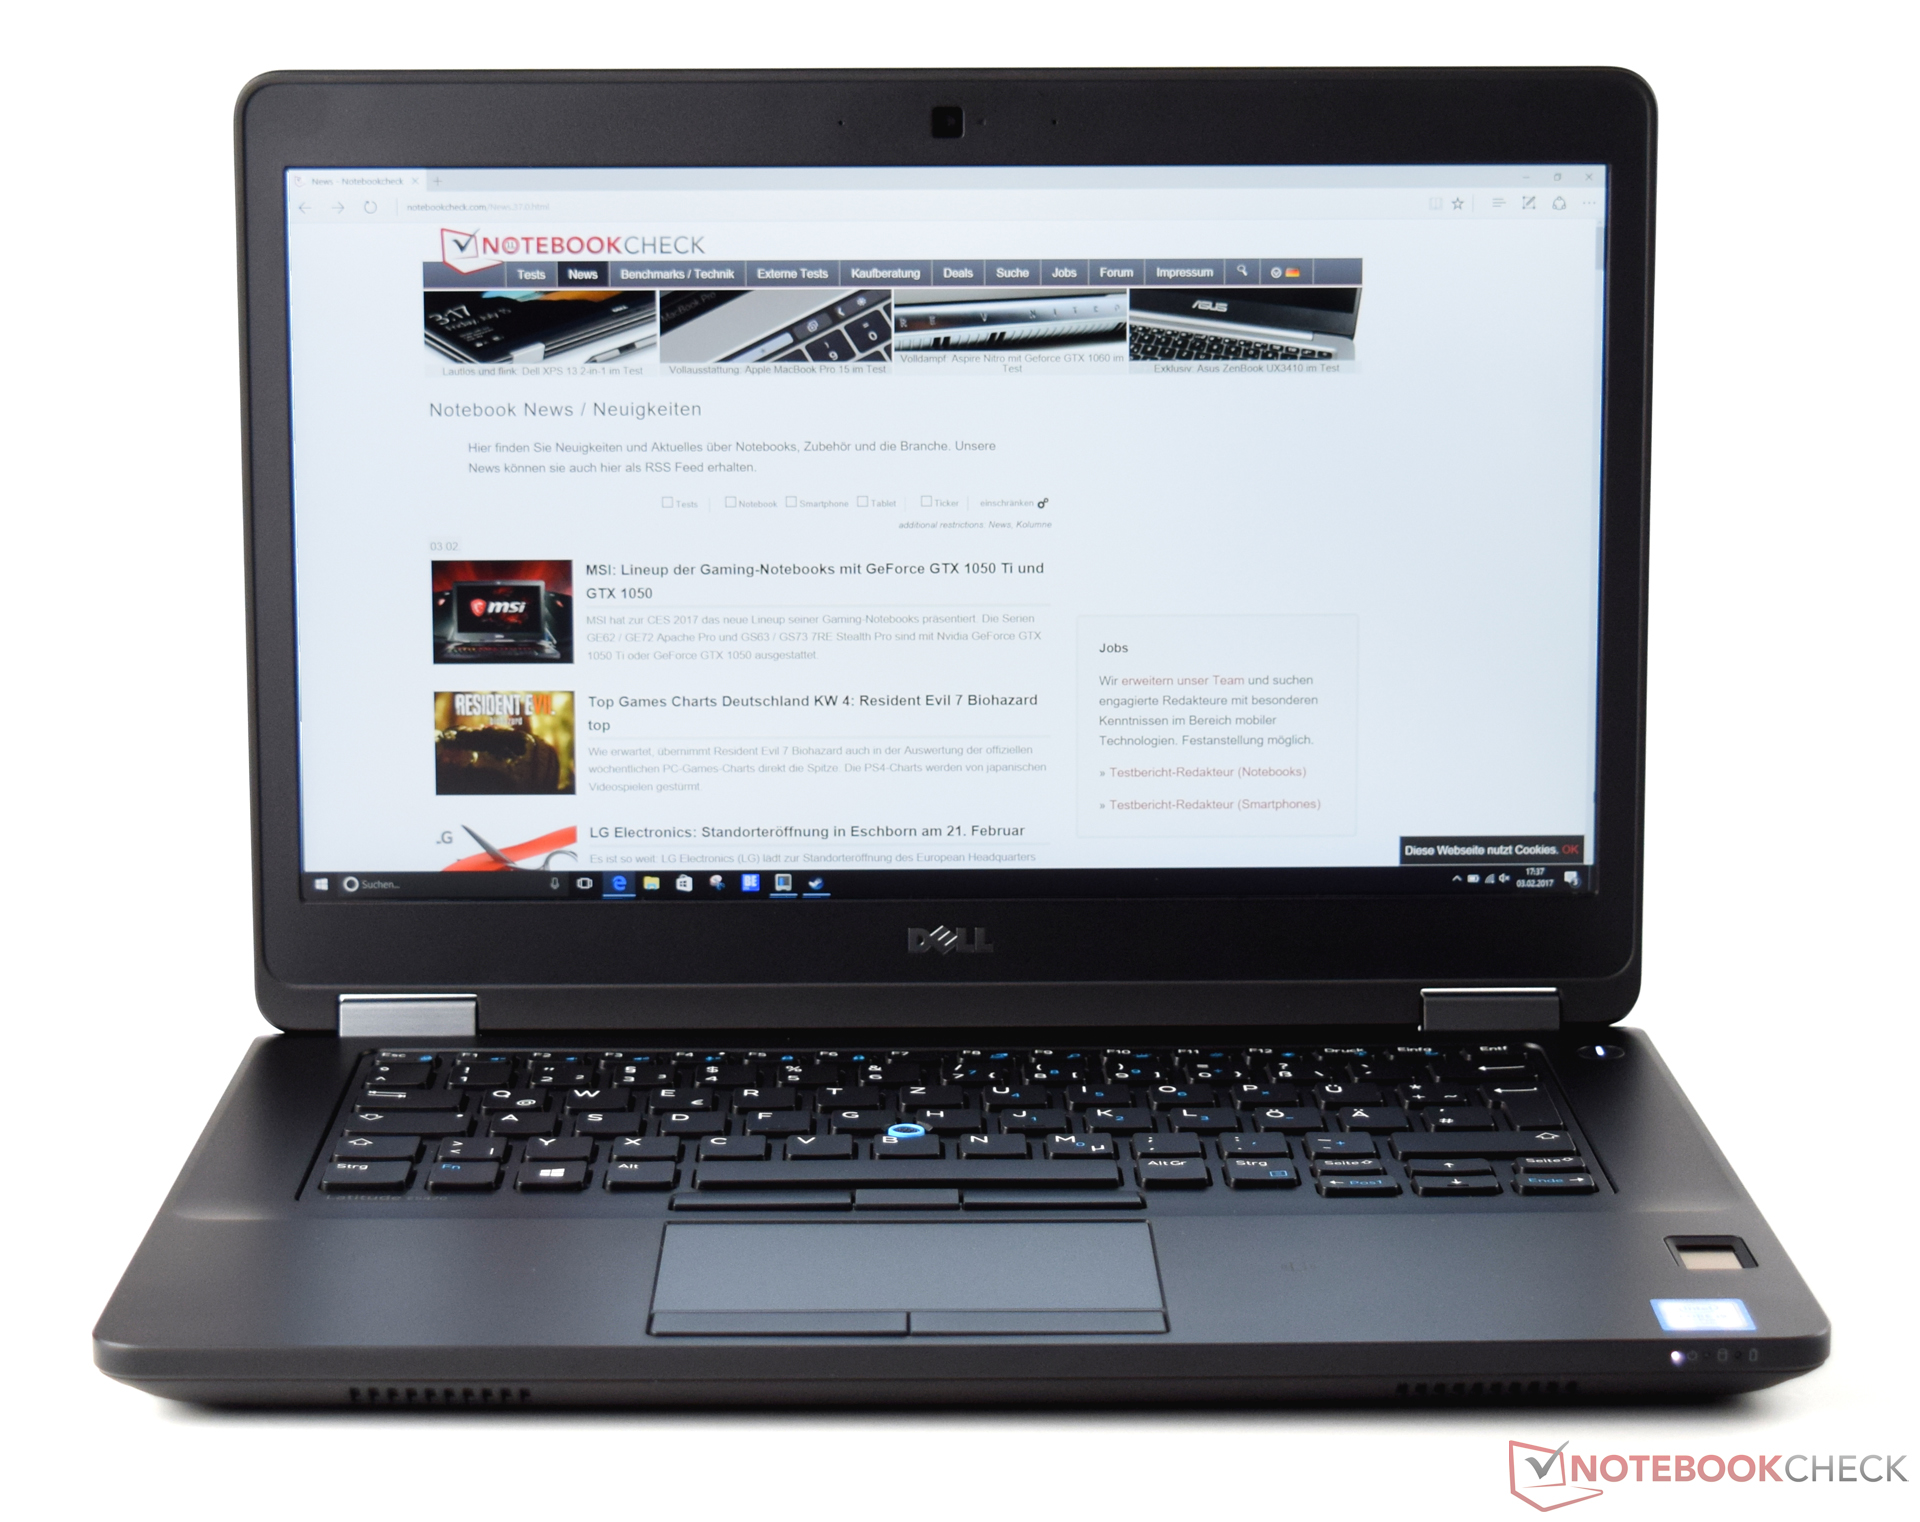
戴尔 Latitude 14 E5470 6440HQ 笔记本电脑简短评测

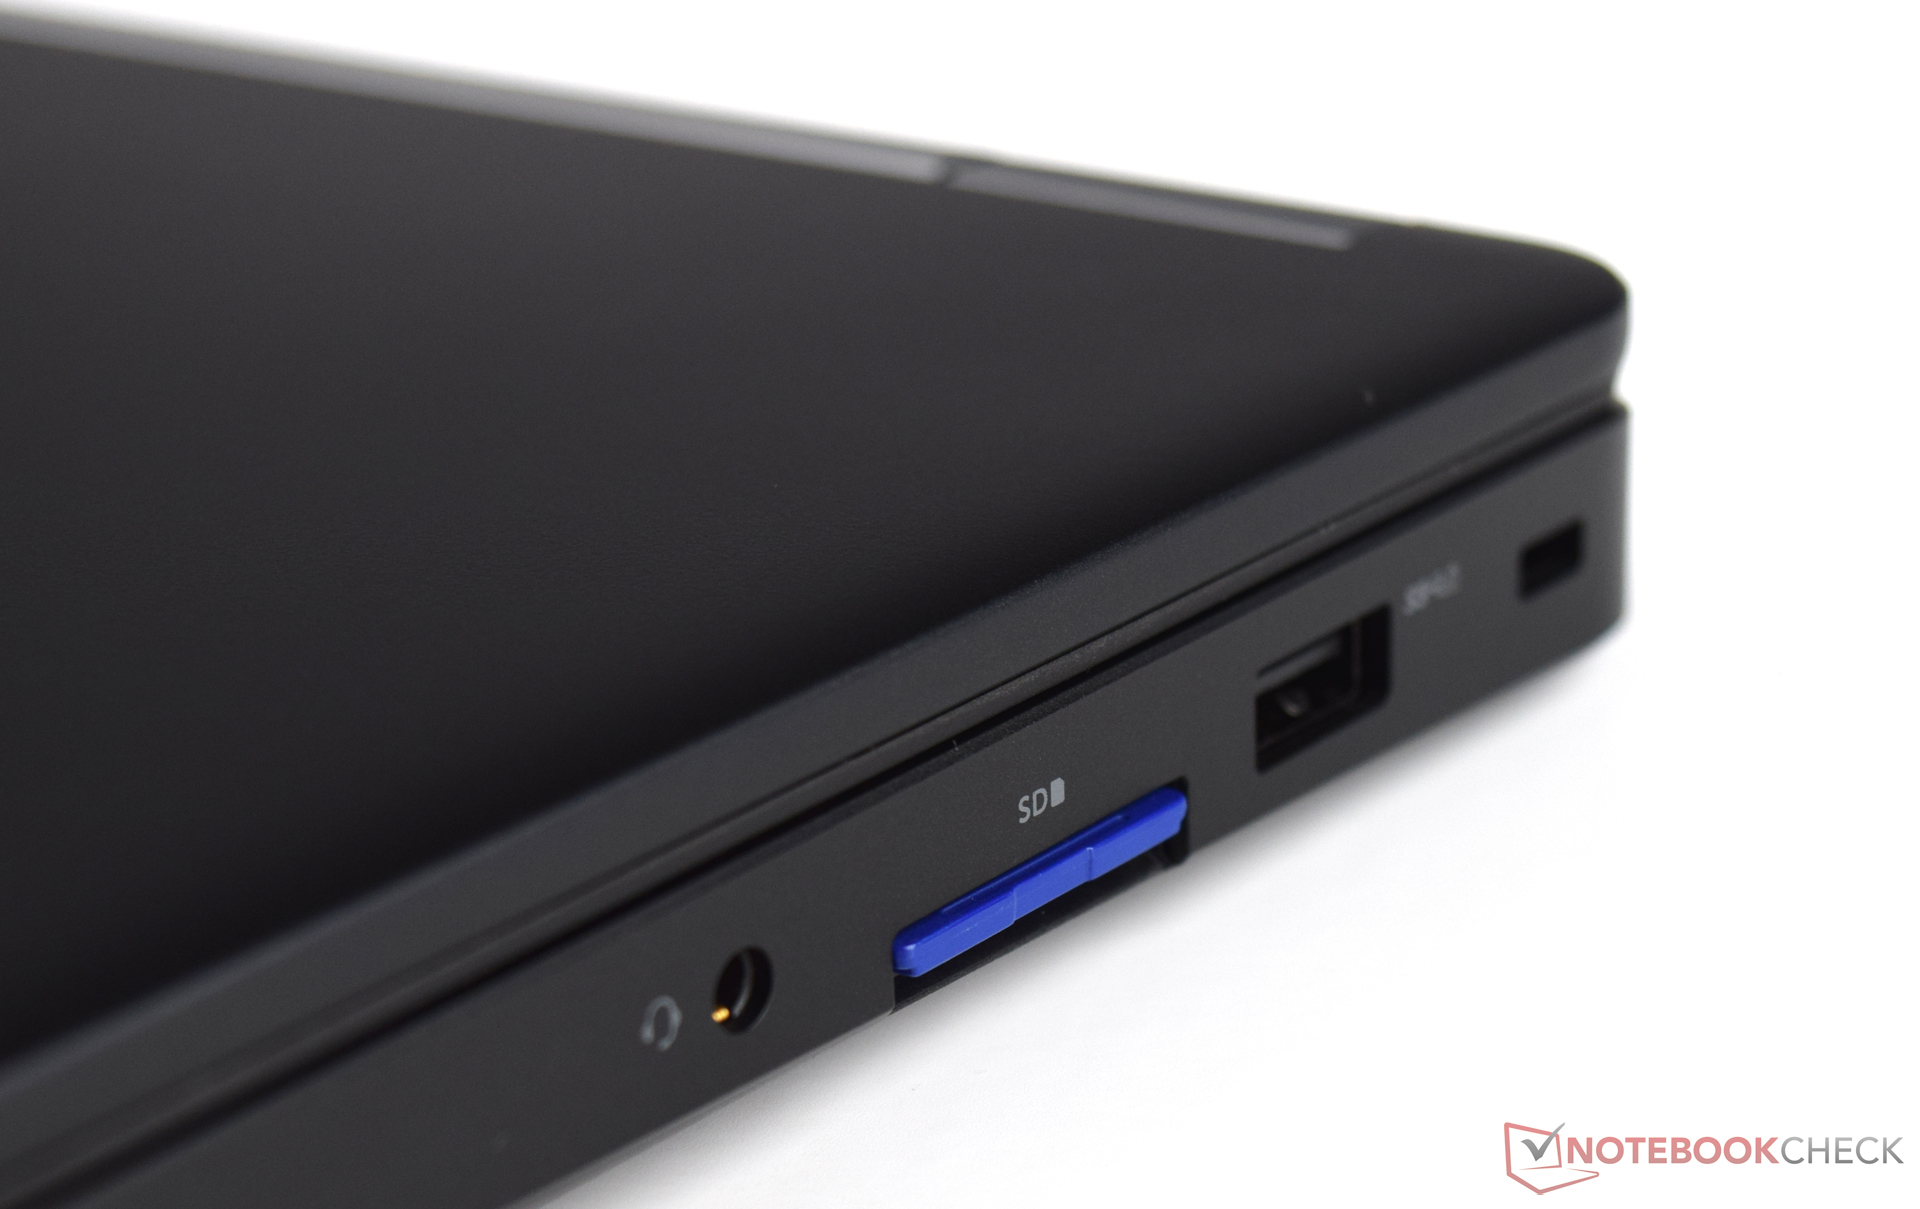
| SD Card Reader | |
| average JPG Copy Test (av. of 3 runs) | |
| Dell Latitude 14 E5470 | |
| Dell Latitude 14 E5470 | |
| HP ProBook 440 G4-Y8B51EA | |
| Acer TravelMate P648-M-757N | |
| Lenovo ThinkPad T460-20FN003LGE | |
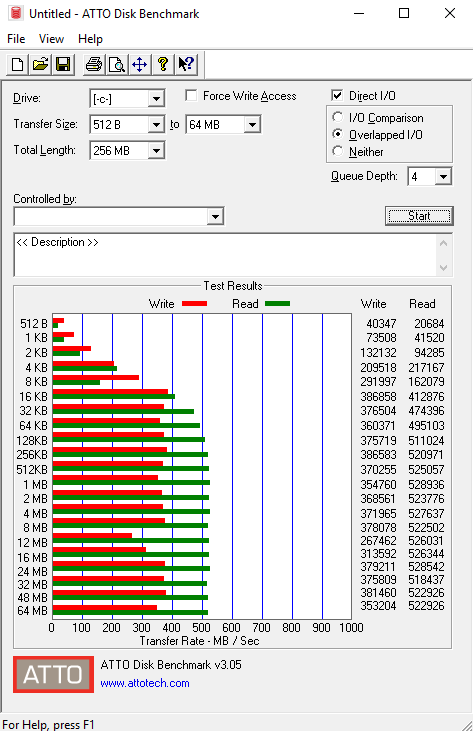
| maximum AS SSD Seq Read Test (1GB) | |
| Dell Latitude 14 E5470 | |
| Dell Latitude 14 E5470 | |
| Lenovo ThinkPad T460-20FN003LGE | |
| HP ProBook 440 G4-Y8B51EA | |
| Networking | |
| iperf3 transmit AX12 | |
| Lenovo IdeaPad 710S Plus-13IKB | |
| Dell Vostro 15-5568 | |
| Dell Latitude 14 E5470 (jseb) | |
| HP Pavilion 14-al103ng | |
| iperf3 receive AX12 | |
| Dell Latitude 14 E5470 (jseb) | |
| Lenovo IdeaPad 710S Plus-13IKB | |
| Dell Vostro 15-5568 | |
| HP Pavilion 14-al103ng | |
| |||||||||||||||||||||||||
Brightness Distribution: 79 %
Center on Battery: 323 cd/m²
Contrast: 567:1 (Black: 0.57 cd/m²)
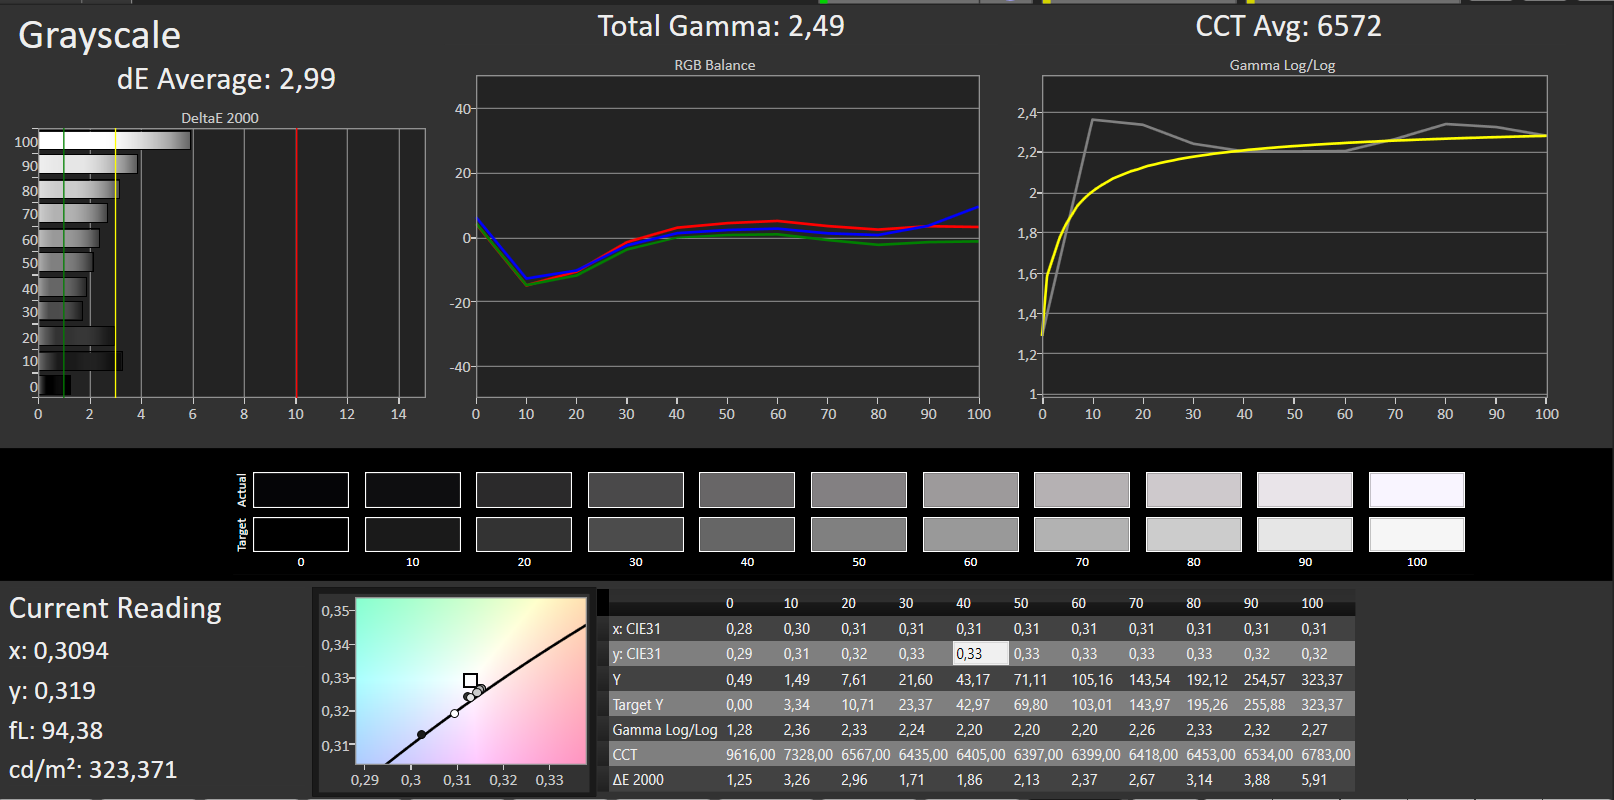
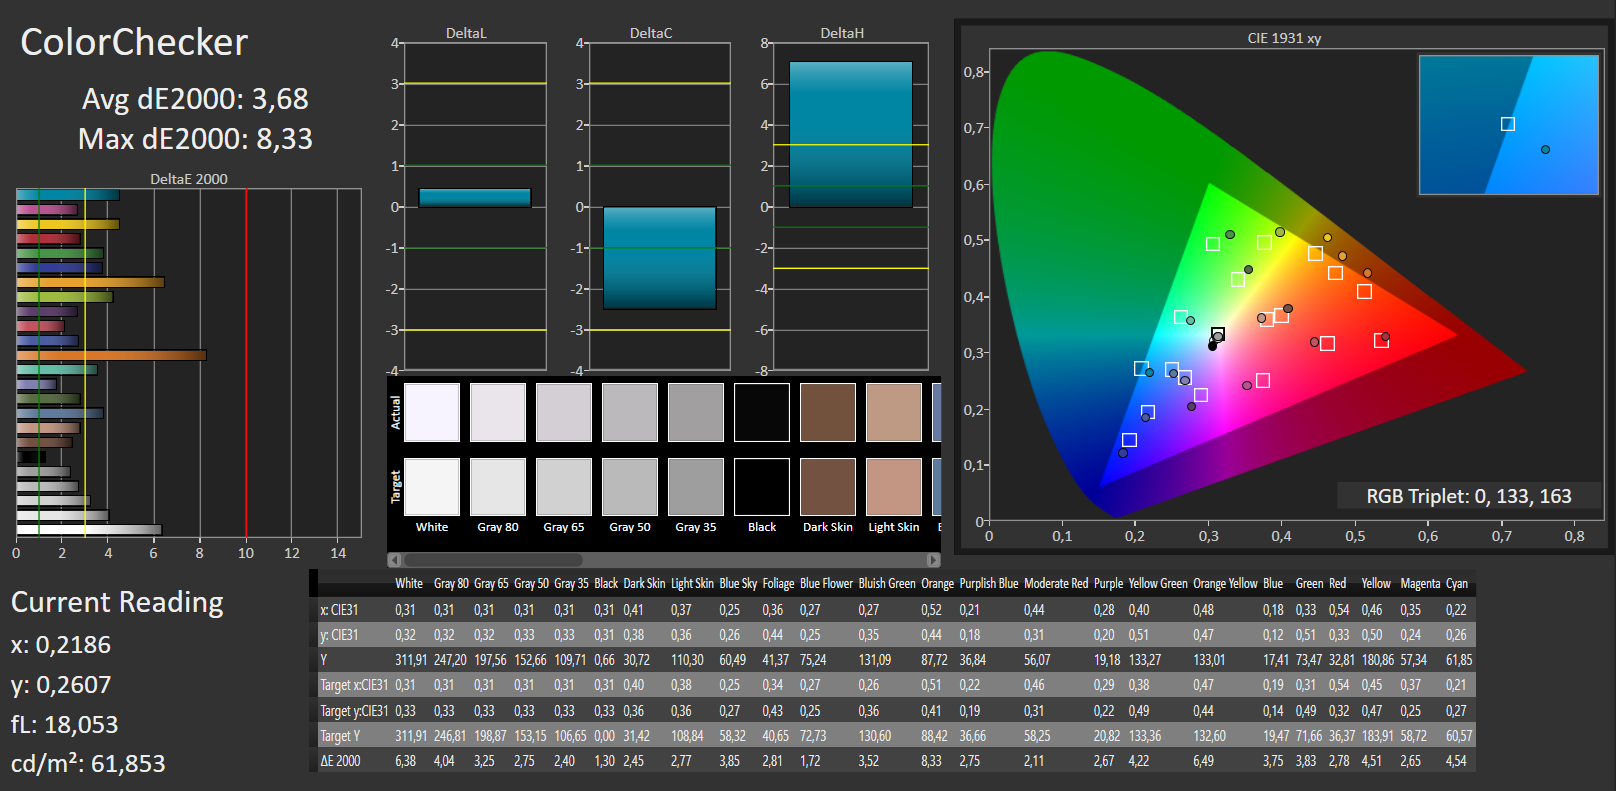
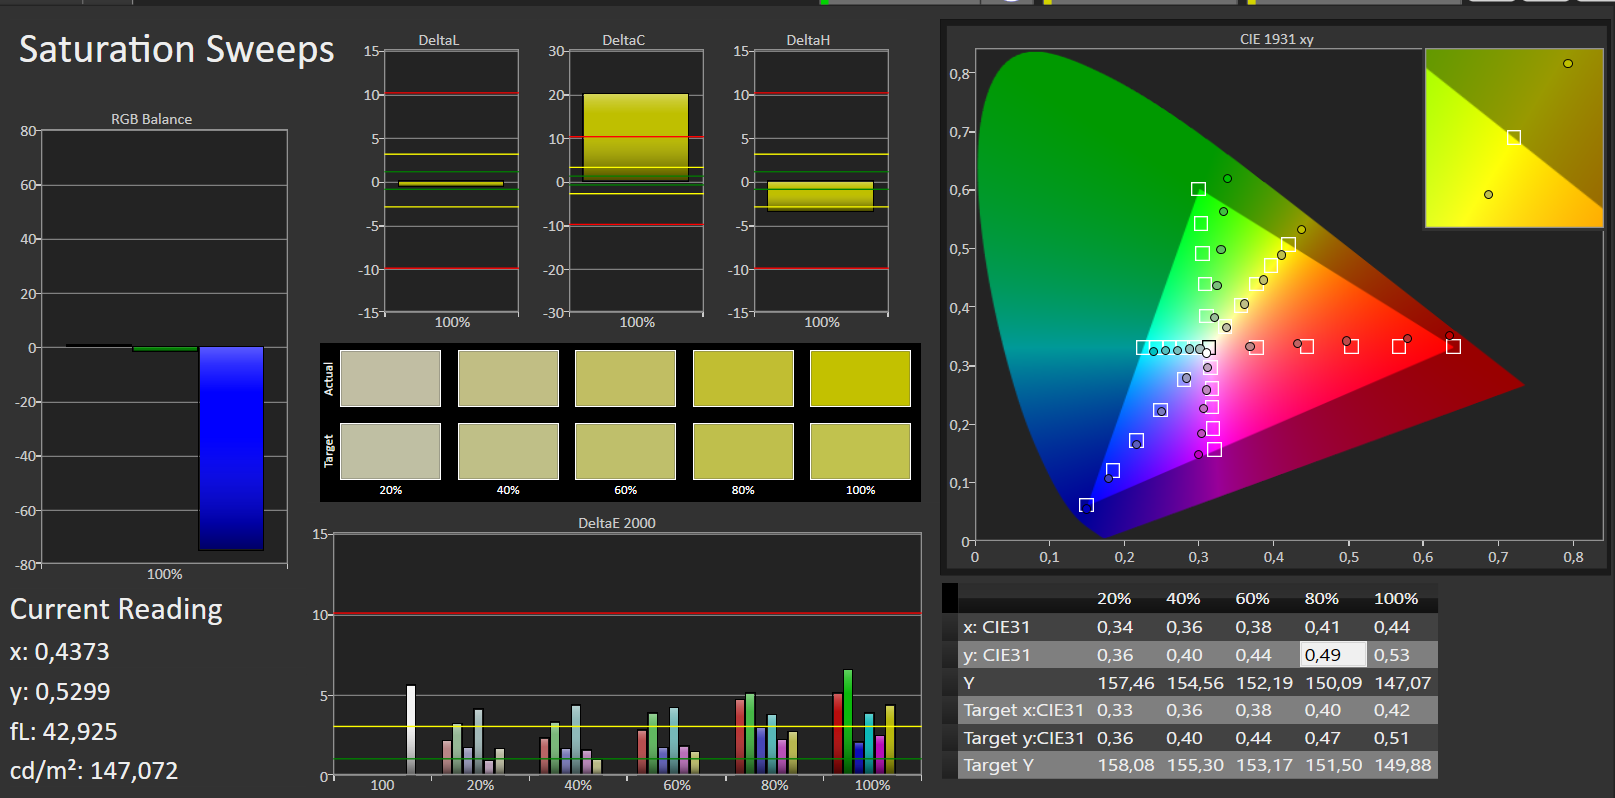
ΔE ColorChecker Calman: 3.68 | ∀{0.5-29.43 Ø4.71}
ΔE Greyscale Calman: 2.99 | ∀{0.09-98 Ø4.96}
85% sRGB (Argyll 1.6.3 3D)
55% AdobeRGB 1998 (Argyll 1.6.3 3D)
62% AdobeRGB 1998 (Argyll 3D)
84.8% sRGB (Argyll 3D)
64.8% Display P3 (Argyll 3D)
Gamma: 2.49
CCT: 6572 K
| Dell Latitude 14 E5470 LP140WF3, 1920x1080, 14" | Dell Latitude 14 E5470 LG Philips LGD04B1 140WHU, 1366x768, 14" | HP ProBook 440 G4-Y8B51EA AUO1E3D, 1920x1080, 14" | Lenovo ThinkPad T460-20FN003LGE Lenovo LEN40A9 / N140HCE-EAA, 1920x1080, 14" | Acer TravelMate P648-M-757N AU Optronics B140HAN02.1, 1920x1080, 14" | |
|---|---|---|---|---|---|
| Display | -33% | -37% | -31% | -41% | |
| Display P3 Coverage (%) | 64.8 | 40.06 -38% | 37.6 -42% | 42.09 -35% | 35.53 -45% |
| sRGB Coverage (%) | 84.8 | 60.3 -29% | 56.6 -33% | 62 -27% | 53.3 -37% |
| AdobeRGB 1998 Coverage (%) | 62 | 41.42 -33% | 38.85 -37% | 43.6 -30% | 36.72 -41% |
| Response Times | -29% | -3% | -2% | -5% | |
| Response Time Grey 50% / Grey 80% * (ms) | 39 ? | 56.8 ? -46% | 43.2 ? -11% | 42.4 ? -9% | 44 ? -13% |
| Response Time Black / White * (ms) | 26 ? | 28.8 ? -11% | 24.4 ? 6% | 24.8 ? 5% | 25 ? 4% |
| PWM Frequency (Hz) | |||||
| Screen | -73% | -57% | -35% | 5% | |
| Brightness middle (cd/m²) | 323 | 229 -29% | 216 -33% | 230 -29% | 254 -21% |
| Brightness (cd/m²) | 316 | 207 -34% | 203 -36% | 216 -32% | 243 -23% |
| Brightness Distribution (%) | 79 | 80 1% | 83 5% | 85 8% | 90 14% |
| Black Level * (cd/m²) | 0.57 | 0.69 -21% | 0.47 18% | 0.26 54% | 0.19 67% |
| Contrast (:1) | 567 | 332 -41% | 460 -19% | 885 56% | 1337 136% |
| Colorchecker dE 2000 * | 3.68 | 10.16 -176% | 8.98 -144% | 7.32 -99% | 4.93 -34% |
| Colorchecker dE 2000 max. * | 8.33 | 17.18 -106% | 14.07 -69% | 18.14 -118% | 10.14 -22% |
| Greyscale dE 2000 * | 2.99 | 10.87 -264% | 9.61 -221% | 6.98 -133% | 2.71 9% |
| Gamma | 2.49 88% | 2.41 91% | 2.63 84% | 2.5 88% | 2.36 93% |
| CCT | 6572 99% | 12881 50% | 11265 58% | 6683 97% | 6914 94% |
| Color Space (Percent of AdobeRGB 1998) (%) | 55 | 38.4 -30% | 35.9 -35% | 39.97 -27% | 34 -38% |
| Color Space (Percent of sRGB) (%) | 85 | 60.4 -29% | 56.7 -33% | 61.55 -28% | 53 -38% |
| Total Average (Program / Settings) | -45% /
-59% | -32% /
-46% | -23% /
-30% | -14% /
-5% |
* ... smaller is better
Display Response Times
| ↔ Response Time Black to White | ||
|---|---|---|
| 26 ms ... rise ↗ and fall ↘ combined | ↗ 5 ms rise | 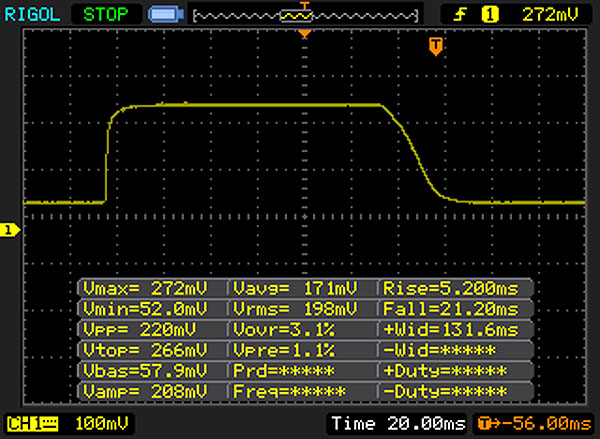 |
| ↘ 21 ms fall | ||
| The screen shows relatively slow response rates in our tests and may be too slow for gamers. In comparison, all tested devices range from 0.1 (minimum) to 240 (maximum) ms. » 63 % of all devices are better. This means that the measured response time is worse than the average of all tested devices (19.8 ms). | ||
| ↔ Response Time 50% Grey to 80% Grey | ||
| 39 ms ... rise ↗ and fall ↘ combined | ↗ 15 ms rise | 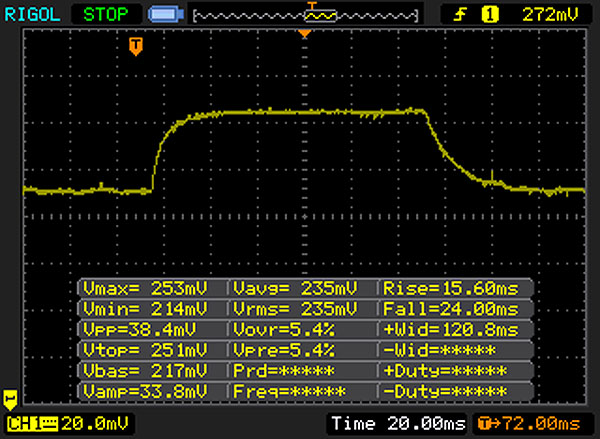 |
| ↘ 24 ms fall | ||
| The screen shows slow response rates in our tests and will be unsatisfactory for gamers. In comparison, all tested devices range from 0.165 (minimum) to 636 (maximum) ms. » 59 % of all devices are better. This means that the measured response time is worse than the average of all tested devices (30.9 ms). | ||
Screen Flickering / PWM (Pulse-Width Modulation)
| Screen flickering / PWM not detected | ||
In comparison: 52 % of all tested devices do not use PWM to dim the display. If PWM was detected, an average of 7748 (minimum: 5 - maximum: 343500) Hz was measured. | ||

| Cinebench R11.5 | |
| CPU Multi 64Bit | |
| Dell Latitude 14 E5470 | |
| HP ProBook 440 G4-Y8B51EA | |
| Dell Latitude 14 E5470 | |
| Acer TravelMate P648-M-757N | |
| CPU Single 64Bit | |
| HP ProBook 440 G4-Y8B51EA | |
| Dell Latitude 14 E5470 | |
| Dell Latitude 14 E5470 | |
| Acer TravelMate P648-M-757N | |
| Cinebench R10 | |
| Rendering Multiple CPUs 64Bit | |
| Dell Latitude 14 E5470 | |
| Dell Latitude 14 E5470 | |
| Rendering Single CPUs 64Bit | |
| Dell Latitude 14 E5470 | |
| Dell Latitude 14 E5470 | |
| JetStream 1.1 - 1.1 Total | |
| Dell Latitude 14 E5470 | |
| HP ProBook 440 G4-Y8B51EA | |
| Lenovo ThinkPad T460-20FN003LGE | |
| Acer TravelMate P648-M-757N | |
| Octane V2 - Total Score | |
| Dell Latitude 14 E5470 | |
| HP ProBook 440 G4-Y8B51EA | |
| Dell Latitude 14 E5470 | |
| Lenovo ThinkPad T460-20FN003LGE | |
| Acer TravelMate P648-M-757N | |
| Mozilla Kraken 1.1 - Total | |
| Acer TravelMate P648-M-757N | |
| Lenovo ThinkPad T460-20FN003LGE | |
| Dell Latitude 14 E5470 | |
| Dell Latitude 14 E5470 | |
| HP ProBook 440 G4-Y8B51EA | |
* ... smaller is better
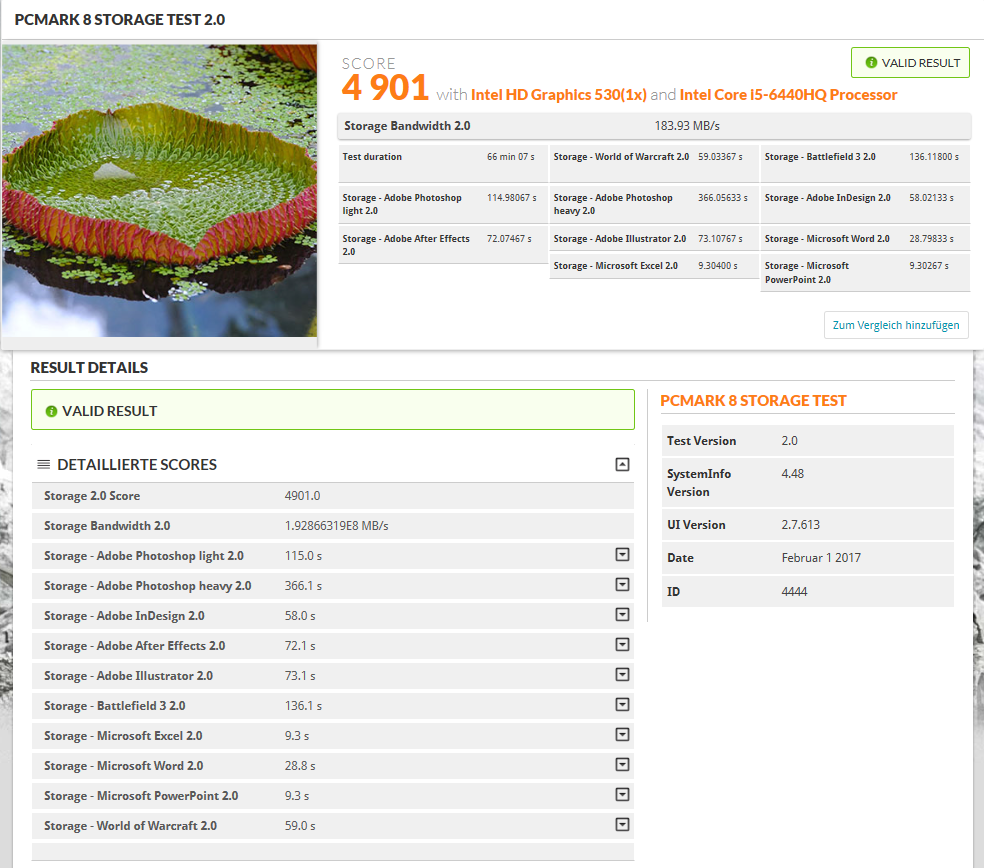
| PCMark 8 | |
| Home Score Accelerated v2 | |
| HP ProBook 440 G4-Y8B51EA | |
| Acer TravelMate P648-M-757N | |
| Dell Latitude 14 E5470 | |
| Dell Latitude 14 E5470 | |
| Lenovo ThinkPad T460-20FN003LGE | |
| Work Score Accelerated v2 | |
| HP ProBook 440 G4-Y8B51EA | |
| Dell Latitude 14 E5470 | |
| Dell Latitude 14 E5470 | |
| Acer TravelMate P648-M-757N | |
| Lenovo ThinkPad T460-20FN003LGE | |
| Creative Score Accelerated v2 | |
| HP ProBook 440 G4-Y8B51EA | |
| Dell Latitude 14 E5470 | |
| Dell Latitude 14 E5470 | |
| Acer TravelMate P648-M-757N | |
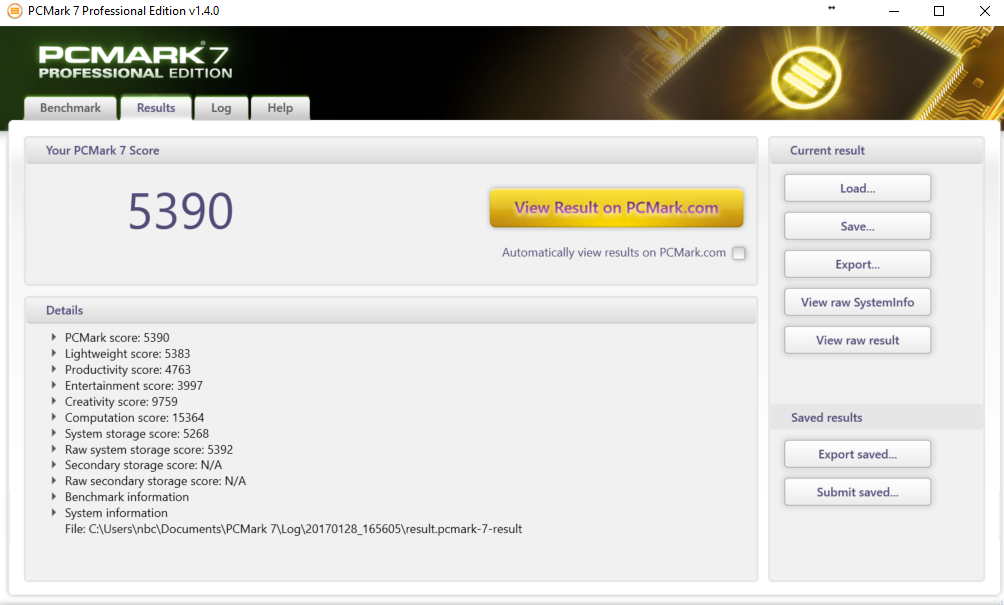
| PCMark 7 Score | 5390 points | |
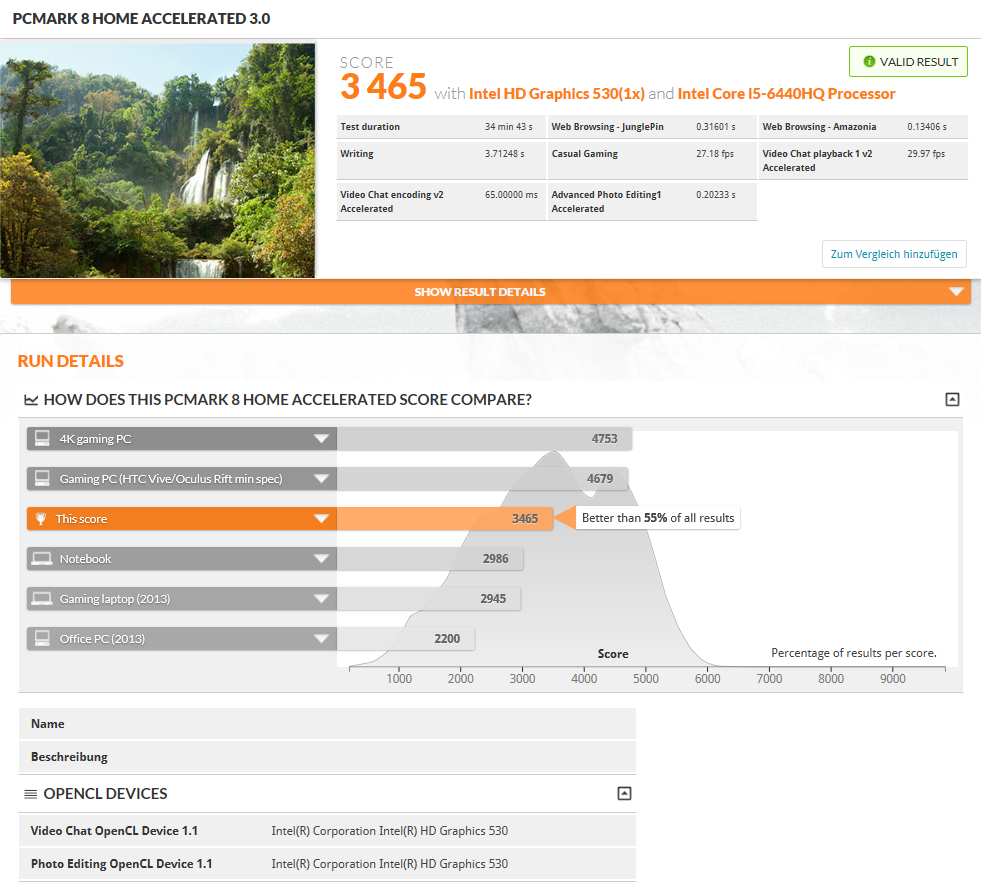
| PCMark 8 Home Score Accelerated v2 | 3465 points | |
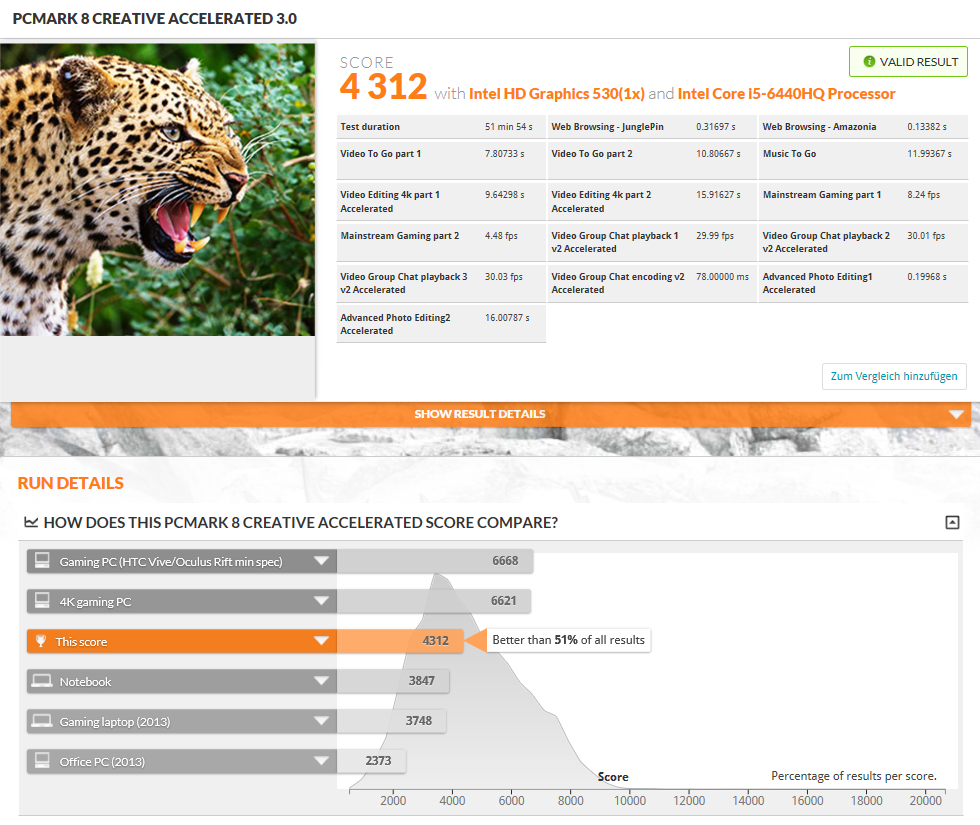
| PCMark 8 Creative Score Accelerated v2 | 4312 points | |
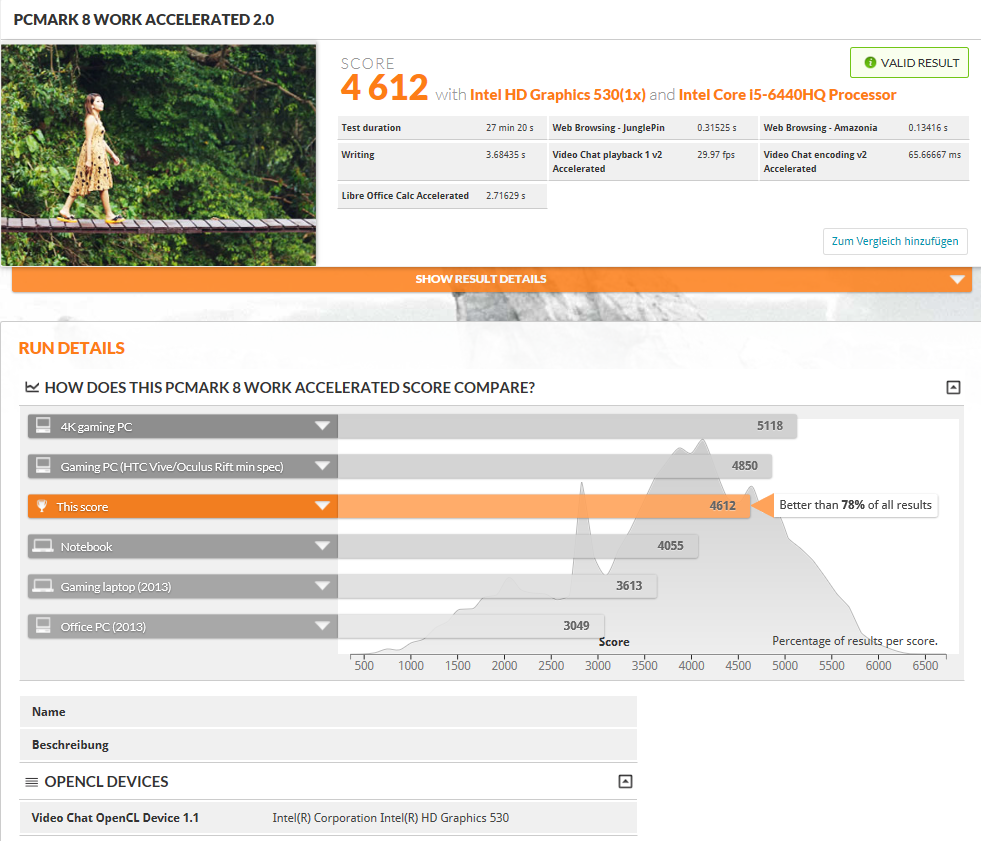
| PCMark 8 Work Score Accelerated v2 | 4612 points | |
Help | ||
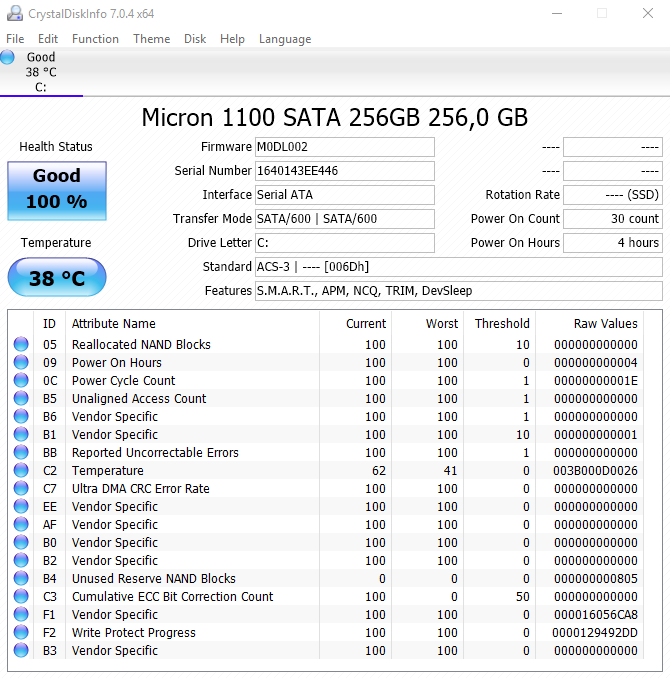
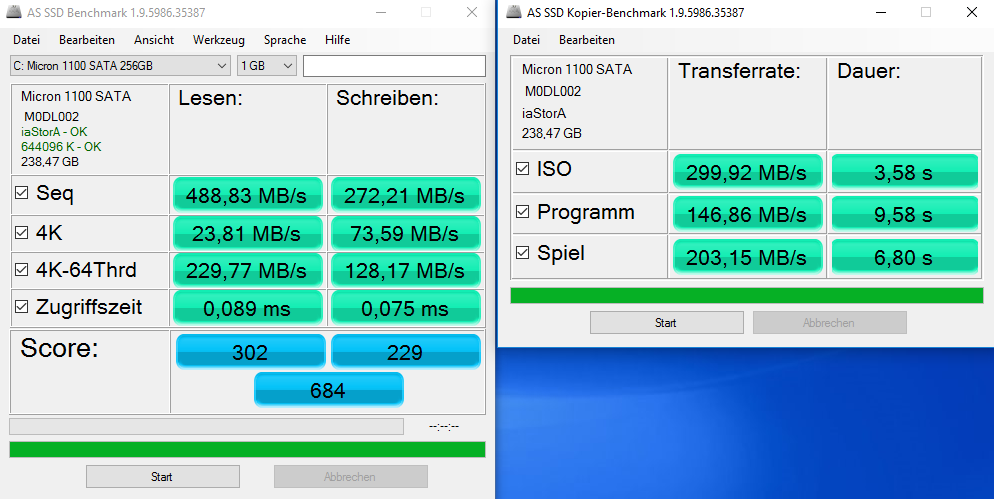
| Dell Latitude 14 E5470 Micron SSD 1100 (MTFDDAV256TBN) | Dell Latitude 14 E5470 Liteon L8H-256V2G | HP ProBook 440 G4-Y8B51EA SanDisk SD8SNAT256G1002 | Lenovo ThinkPad T460-20FN003LGE Toshiba HG6 THNSFJ256GCSU | Acer TravelMate P648-M-757N Lite-On CV1-8B256 | |
|---|---|---|---|---|---|
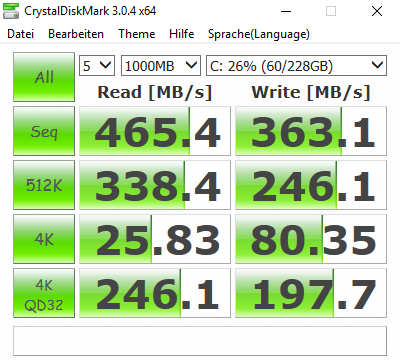
| CrystalDiskMark 3.0 | 12% | -6% | 6% | 13% | |
| Read Seq (MB/s) | 465.4 | 508 9% | 491.2 6% | 458.9 -1% | 531 14% |
| Write Seq (MB/s) | 363.1 | 360.6 -1% | 322.2 -11% | 394.4 9% | 358.8 -1% |
| Read 512 (MB/s) | 338.4 | 374.1 11% | 310.1 -8% | 371.3 10% | 384.8 14% |
| Write 512 (MB/s) | 246.1 | 300.2 22% | 276 12% | 232.7 -5% | 363 48% |
| Read 4k (MB/s) | 25.83 | 31.98 24% | 19.57 -24% | 21.7 -16% | 31.3 21% |
| Write 4k (MB/s) | 80.3 | 93.1 16% | 77.8 -3% | 72.9 -9% | 80.3 0% |
| Read 4k QD32 (MB/s) | 246.1 | 274.7 12% | 146.3 -41% | 369.9 50% | 239.4 -3% |
| Write 4k QD32 (MB/s) | 197.7 | 205.6 4% | 241.4 22% | 216 9% | 225.3 14% |

| 3DMark | |
| 1280x720 Cloud Gate Standard Graphics | |
| HP ProBook 440 G4-Y8B51EA | |
| Acer TravelMate P648-M-757N | |
| Dell Latitude 14 E5470 | |
| Dell Latitude 14 E5470 | |
| Lenovo ThinkPad T460-20FN003LGE | |
| 1920x1080 Fire Strike Graphics | |
| HP ProBook 440 G4-Y8B51EA | |
| Acer TravelMate P648-M-757N | |
| Dell Latitude 14 E5470 | |
| Dell Latitude 14 E5470 | |
| 3DMark 11 - 1280x720 Performance GPU | |
| HP ProBook 440 G4-Y8B51EA | |
| Dell Latitude 14 E5470 | |
| Dell Latitude 14 E5470 | |
| Acer TravelMate P648-M-757N | |
| Lenovo ThinkPad T460-20FN003LGE | |
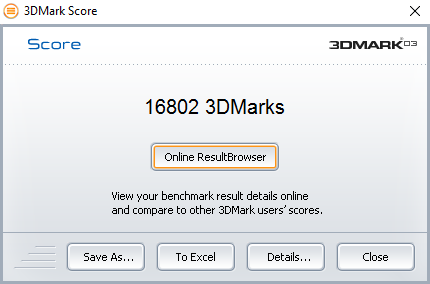
| 3DMark 03 Standard | 16802 points | |
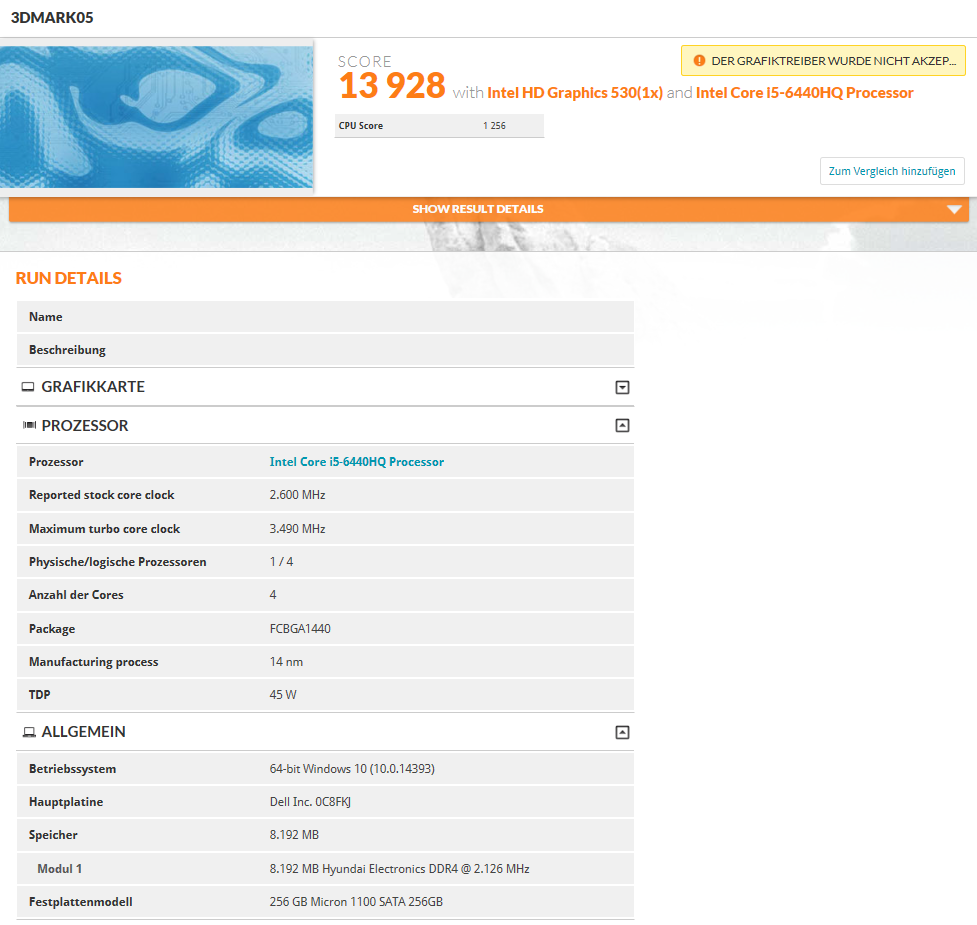
| 3DMark 05 Standard | 13920 points | |
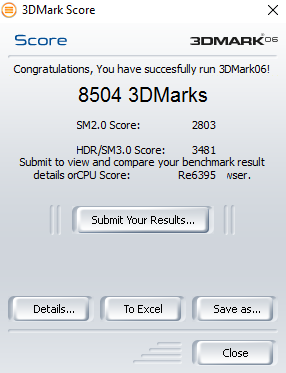
| 3DMark 06 Standard Score | 8504 points | |
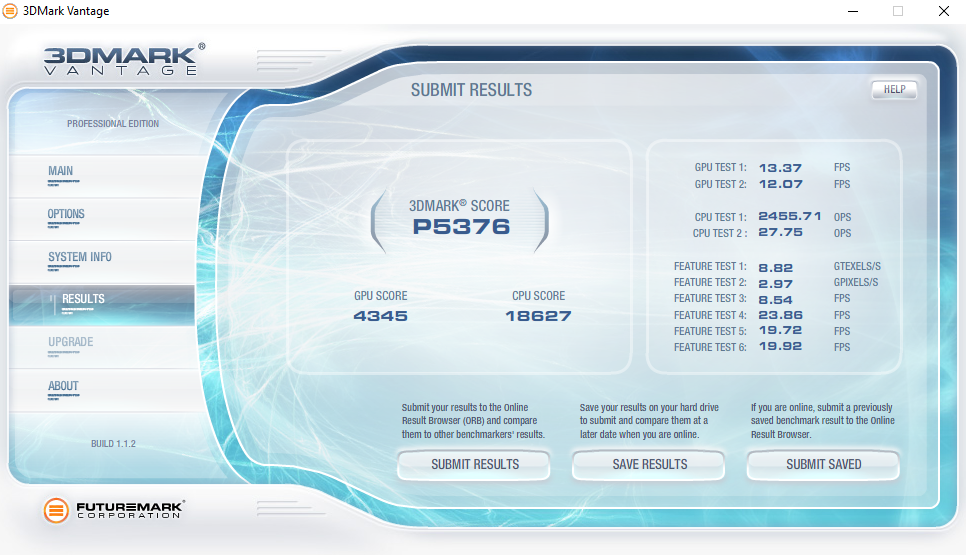
| 3DMark Vantage P Result | 5376 points | |
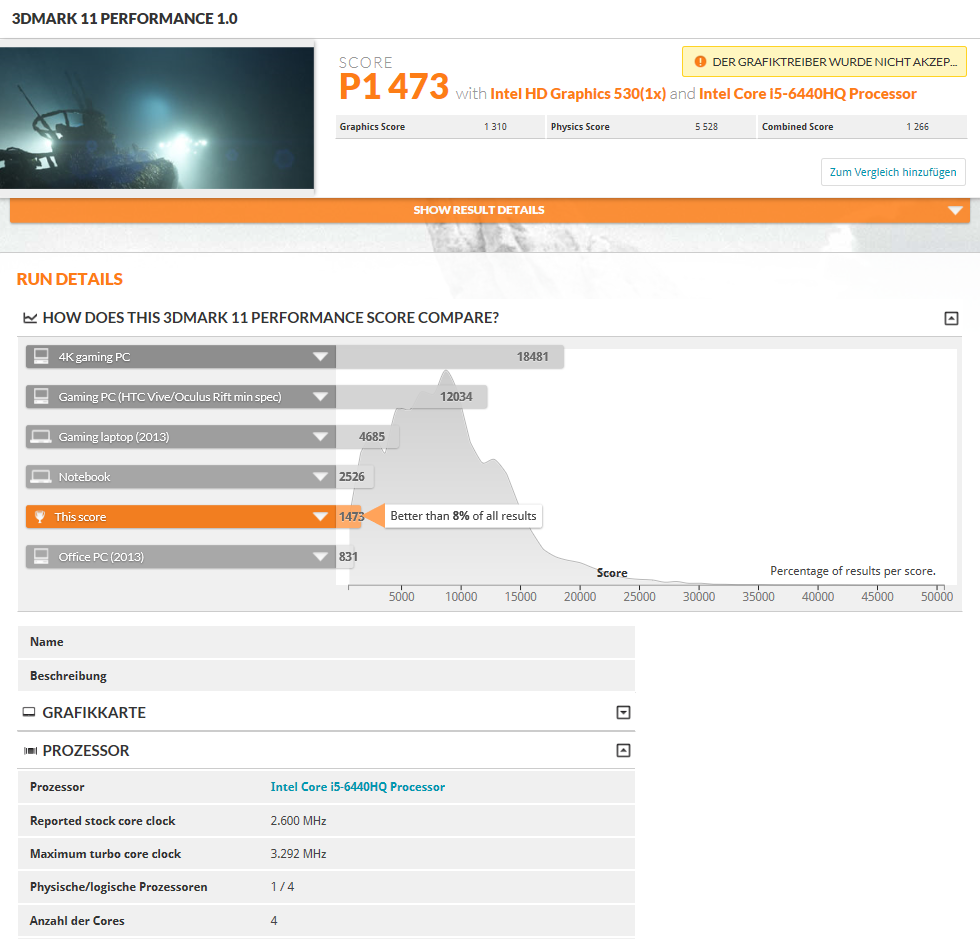
| 3DMark 11 Performance | 1473 points | |
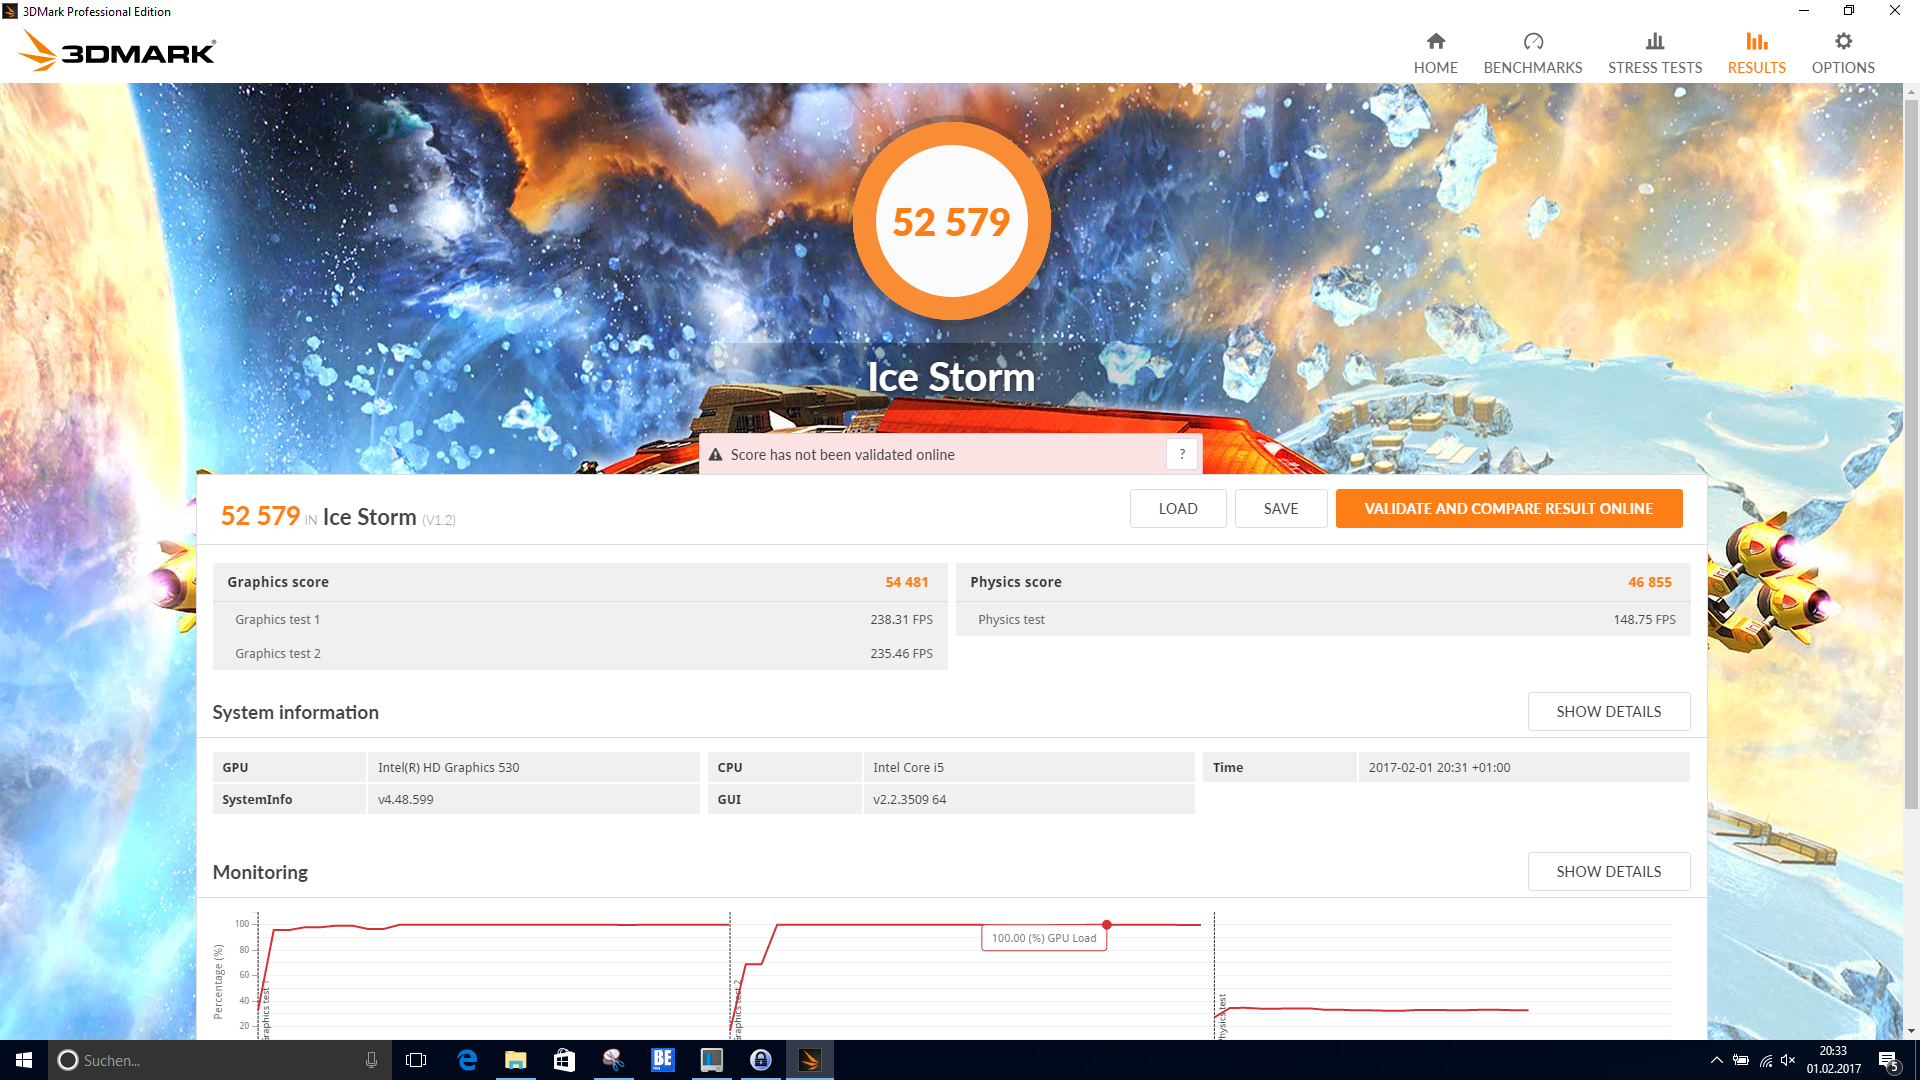
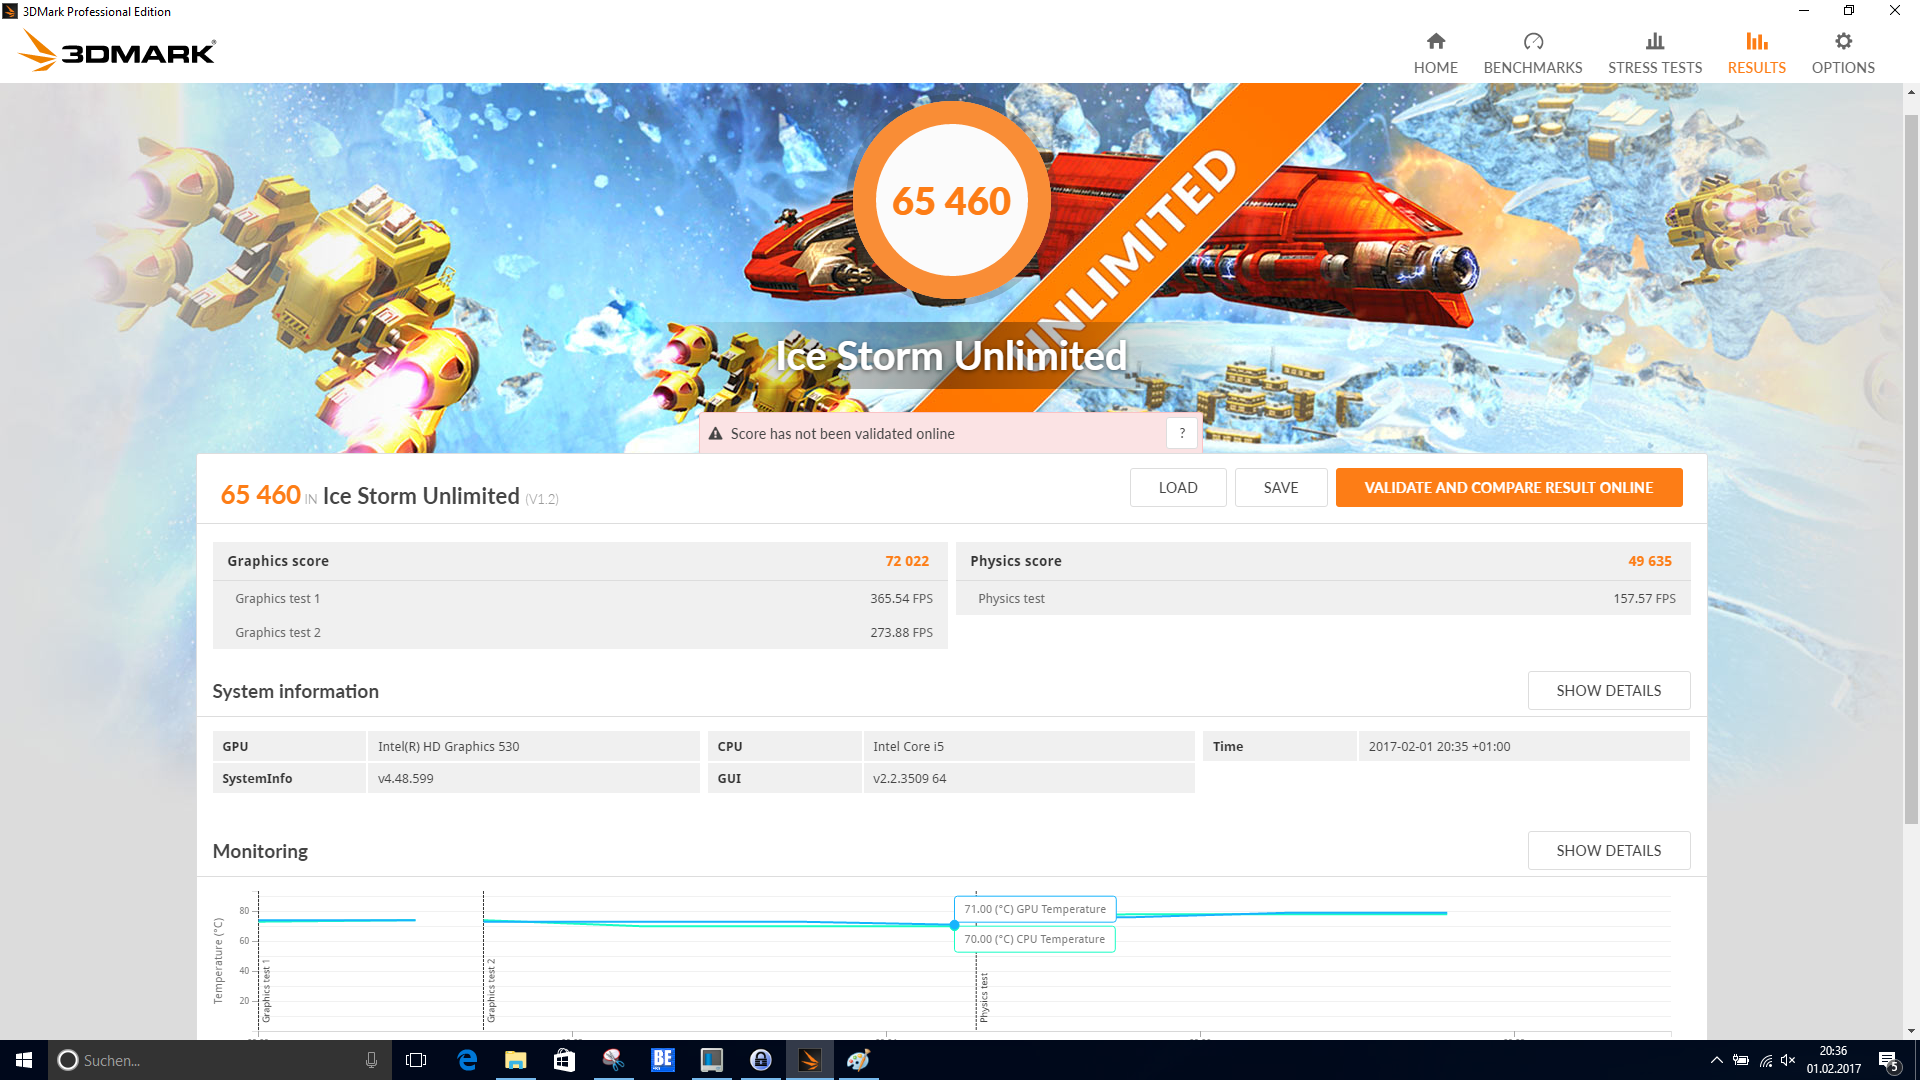
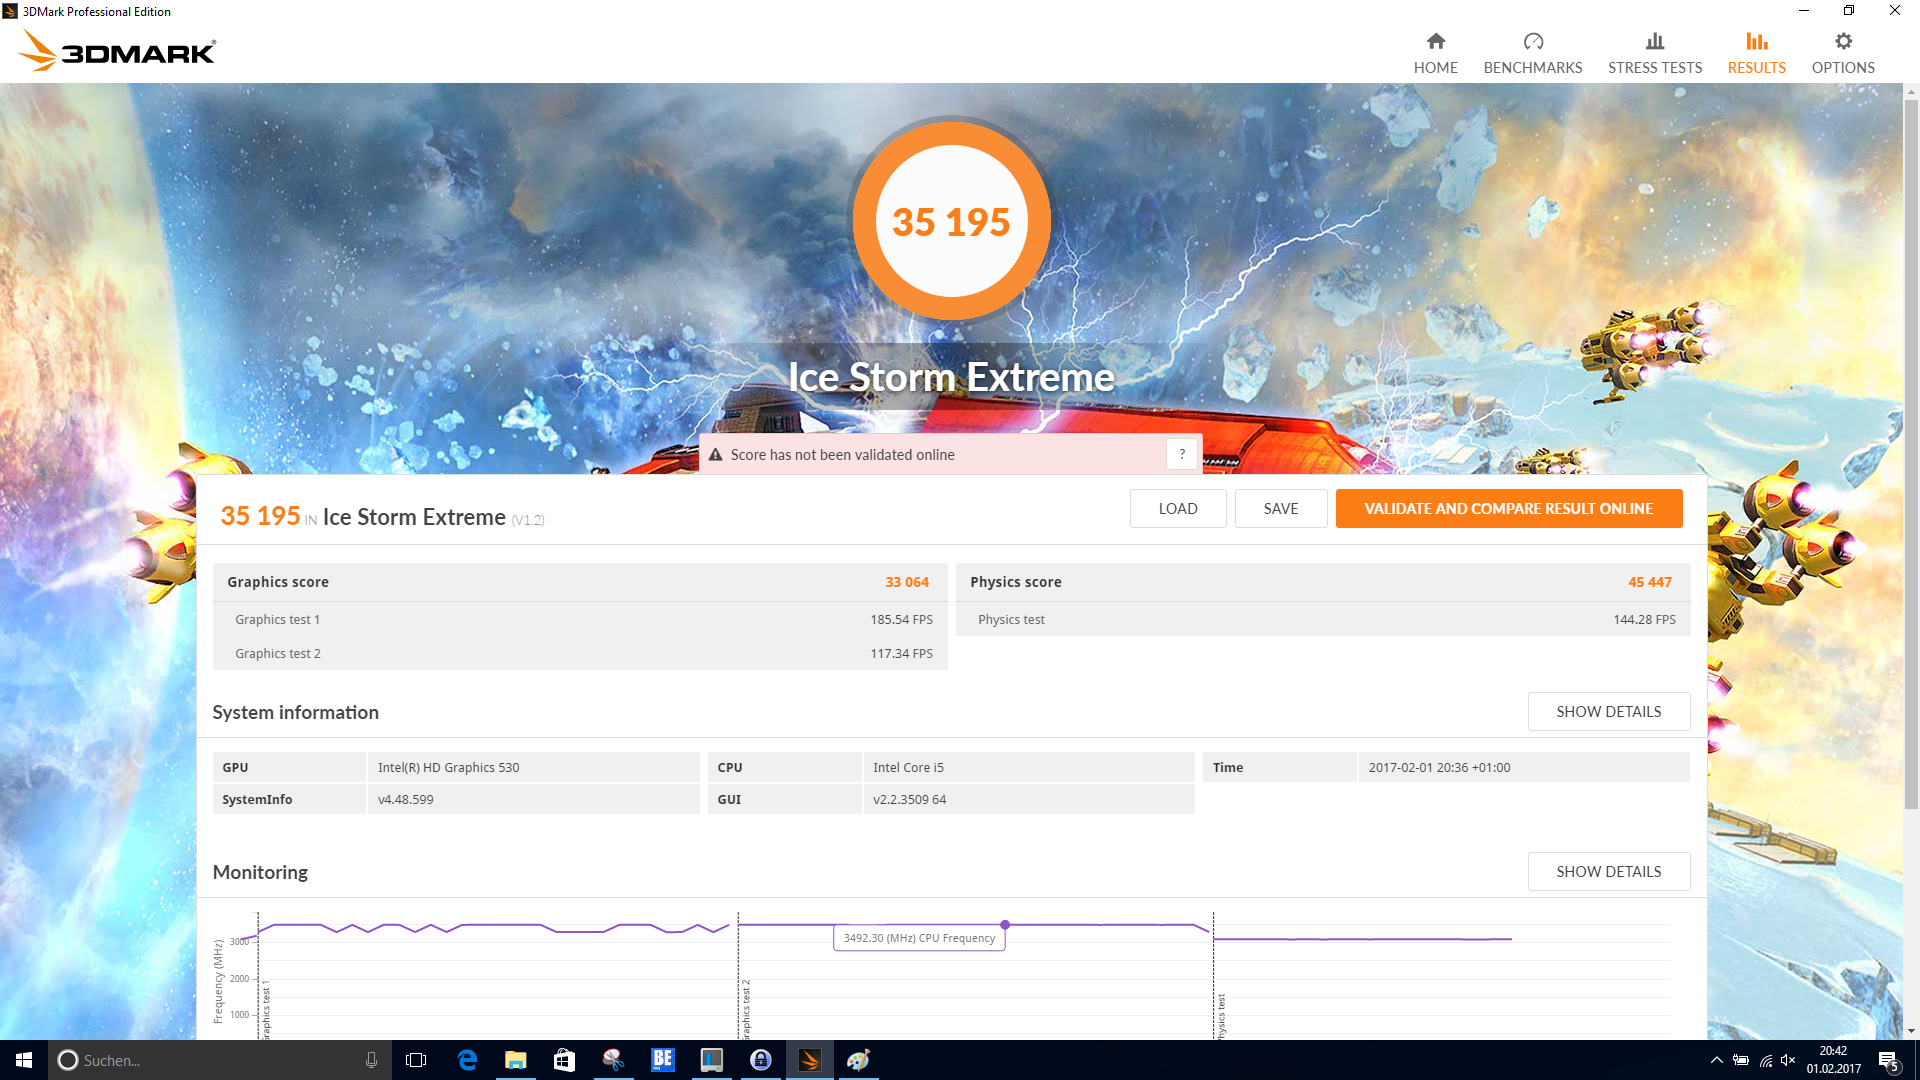
| 3DMark Ice Storm Standard Score | 52579 points | |
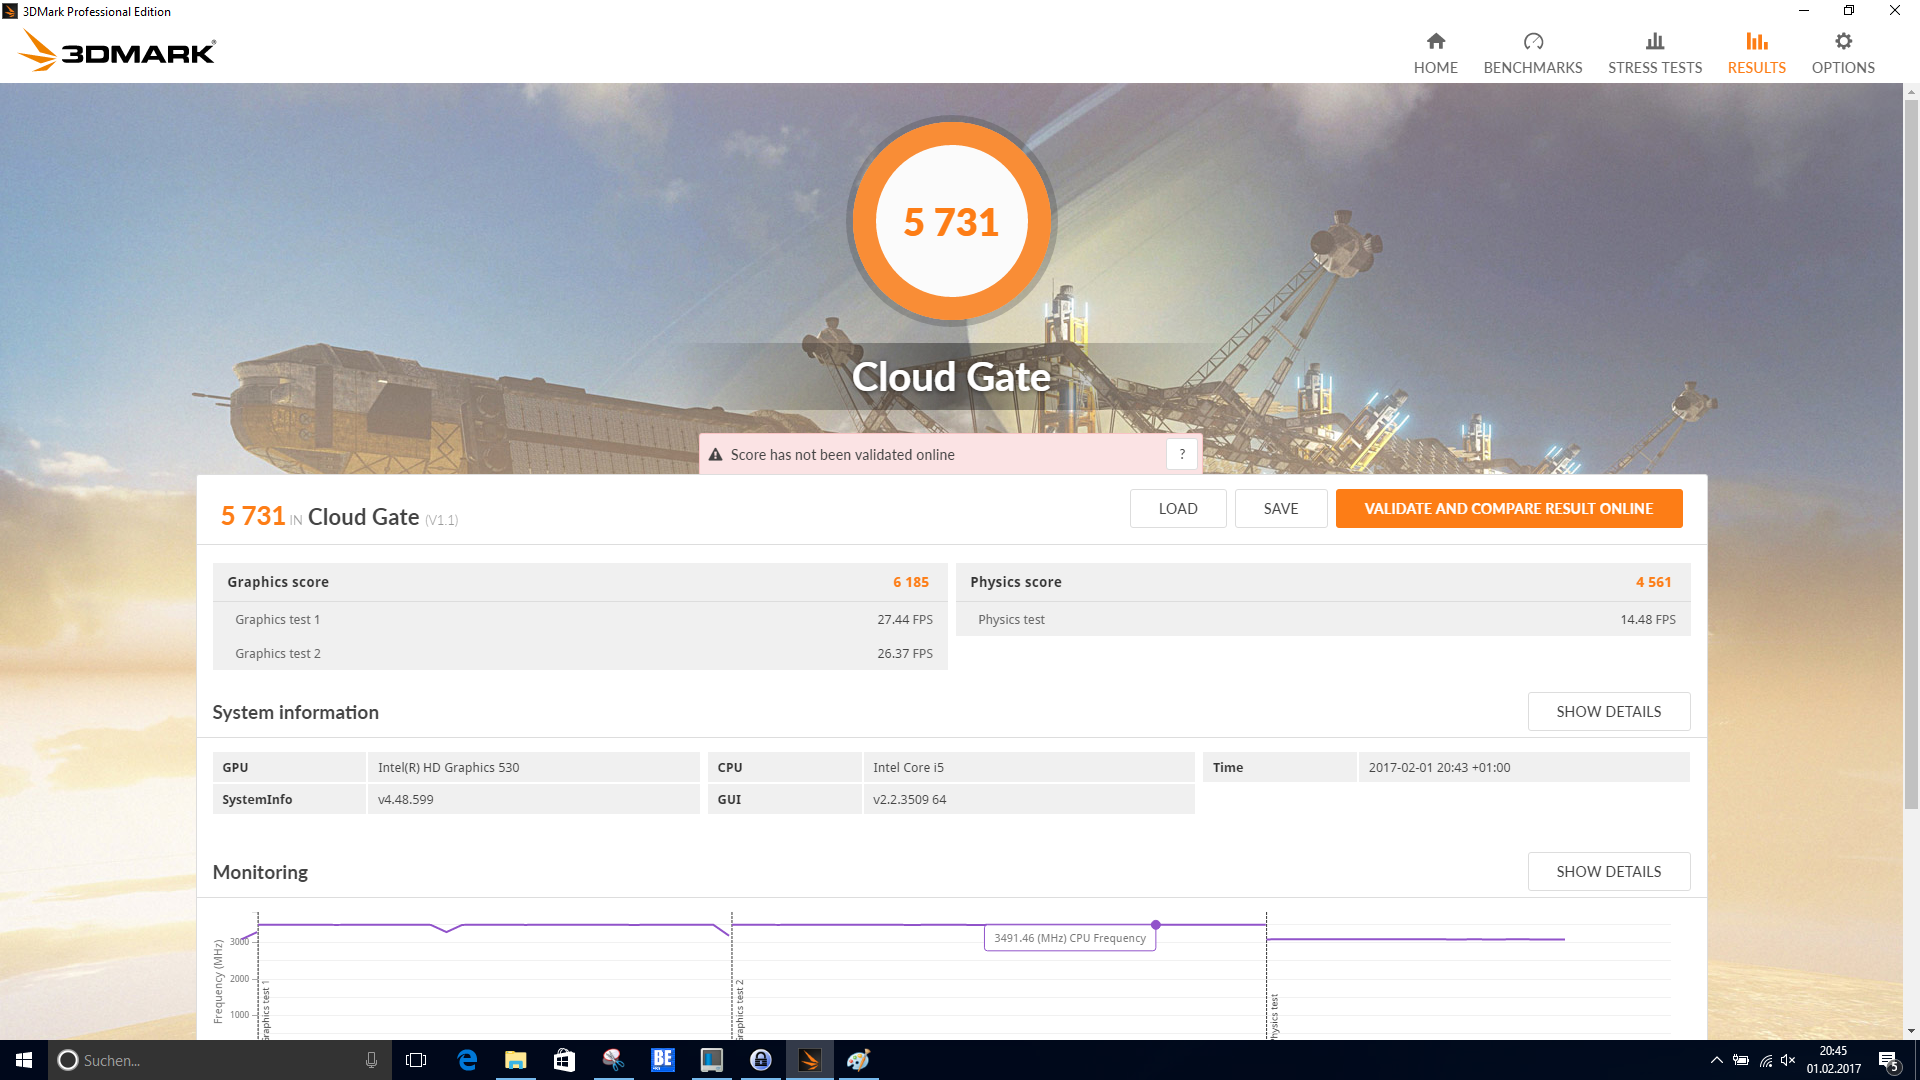
| 3DMark Cloud Gate Standard Score | 5731 points | |
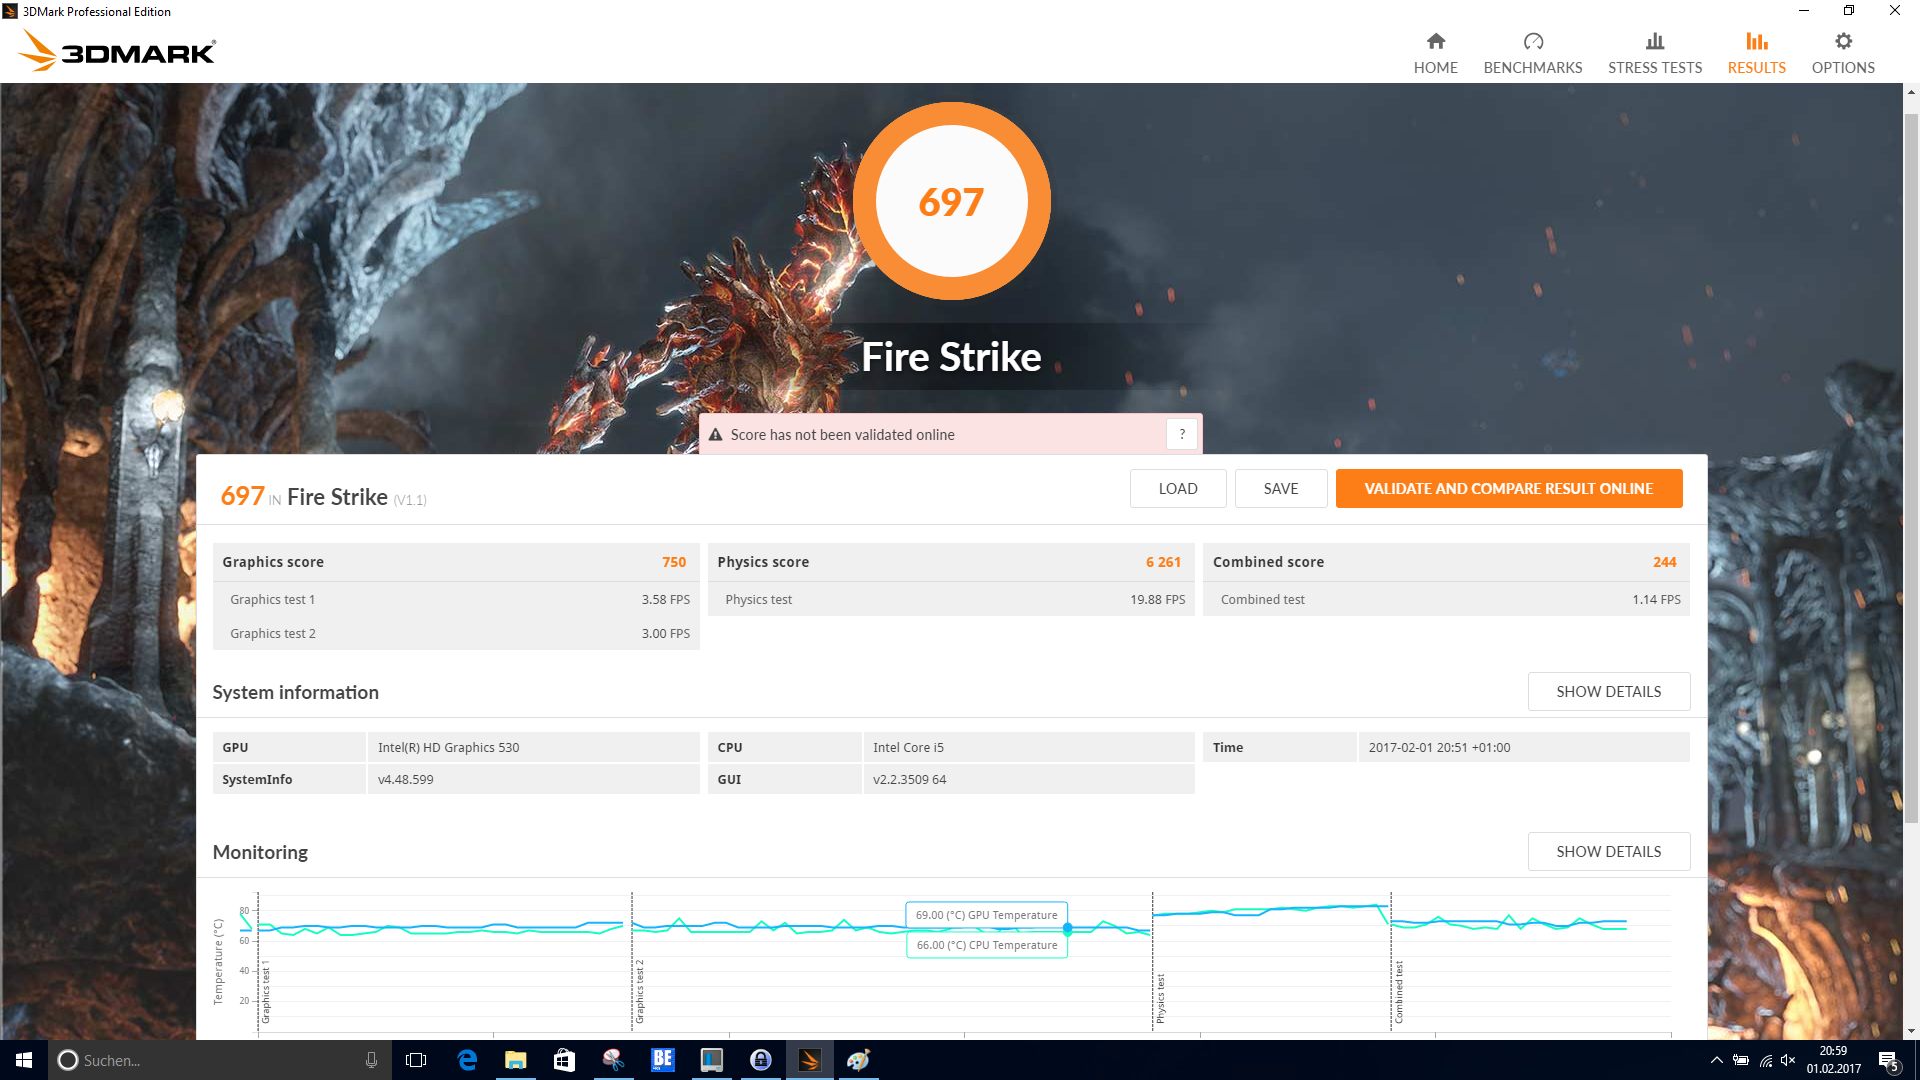
| 3DMark Fire Strike Score | 697 points | |
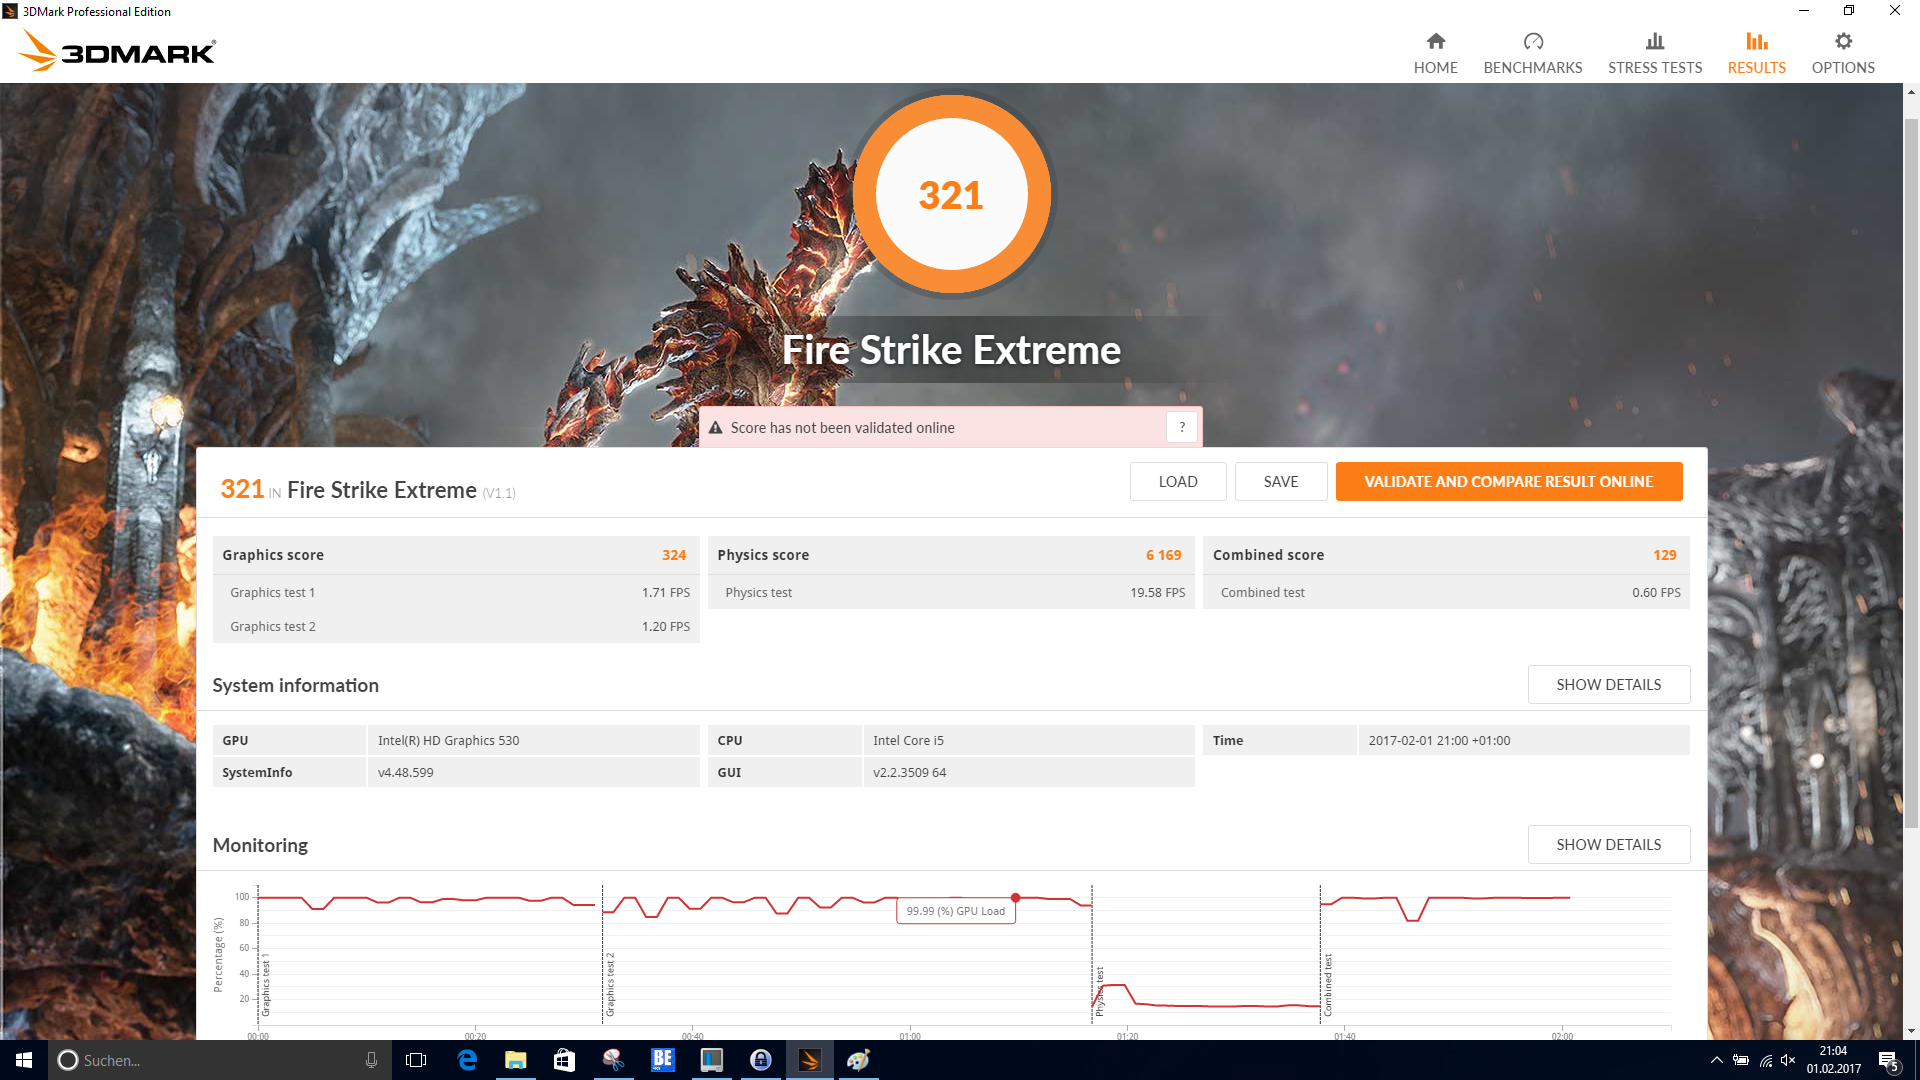
| 3DMark Fire Strike Extreme Score | 321 points | |
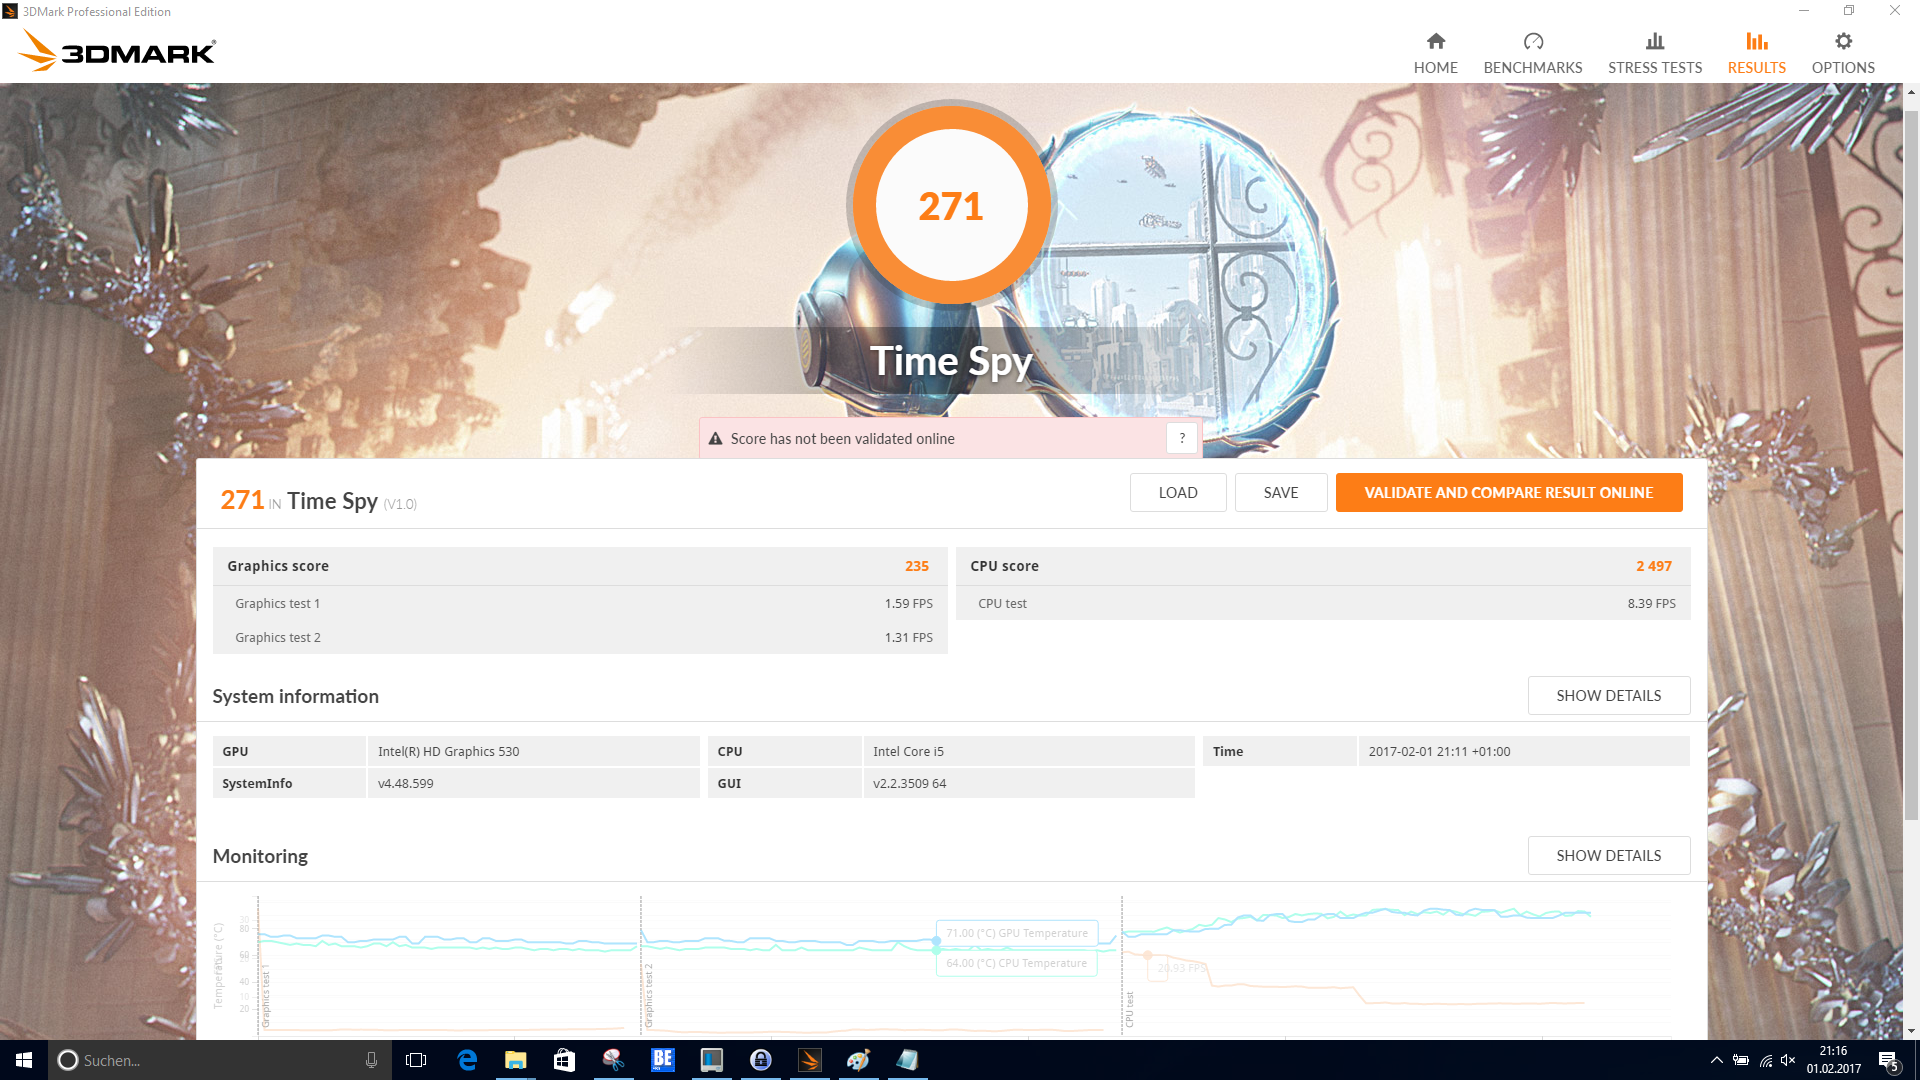
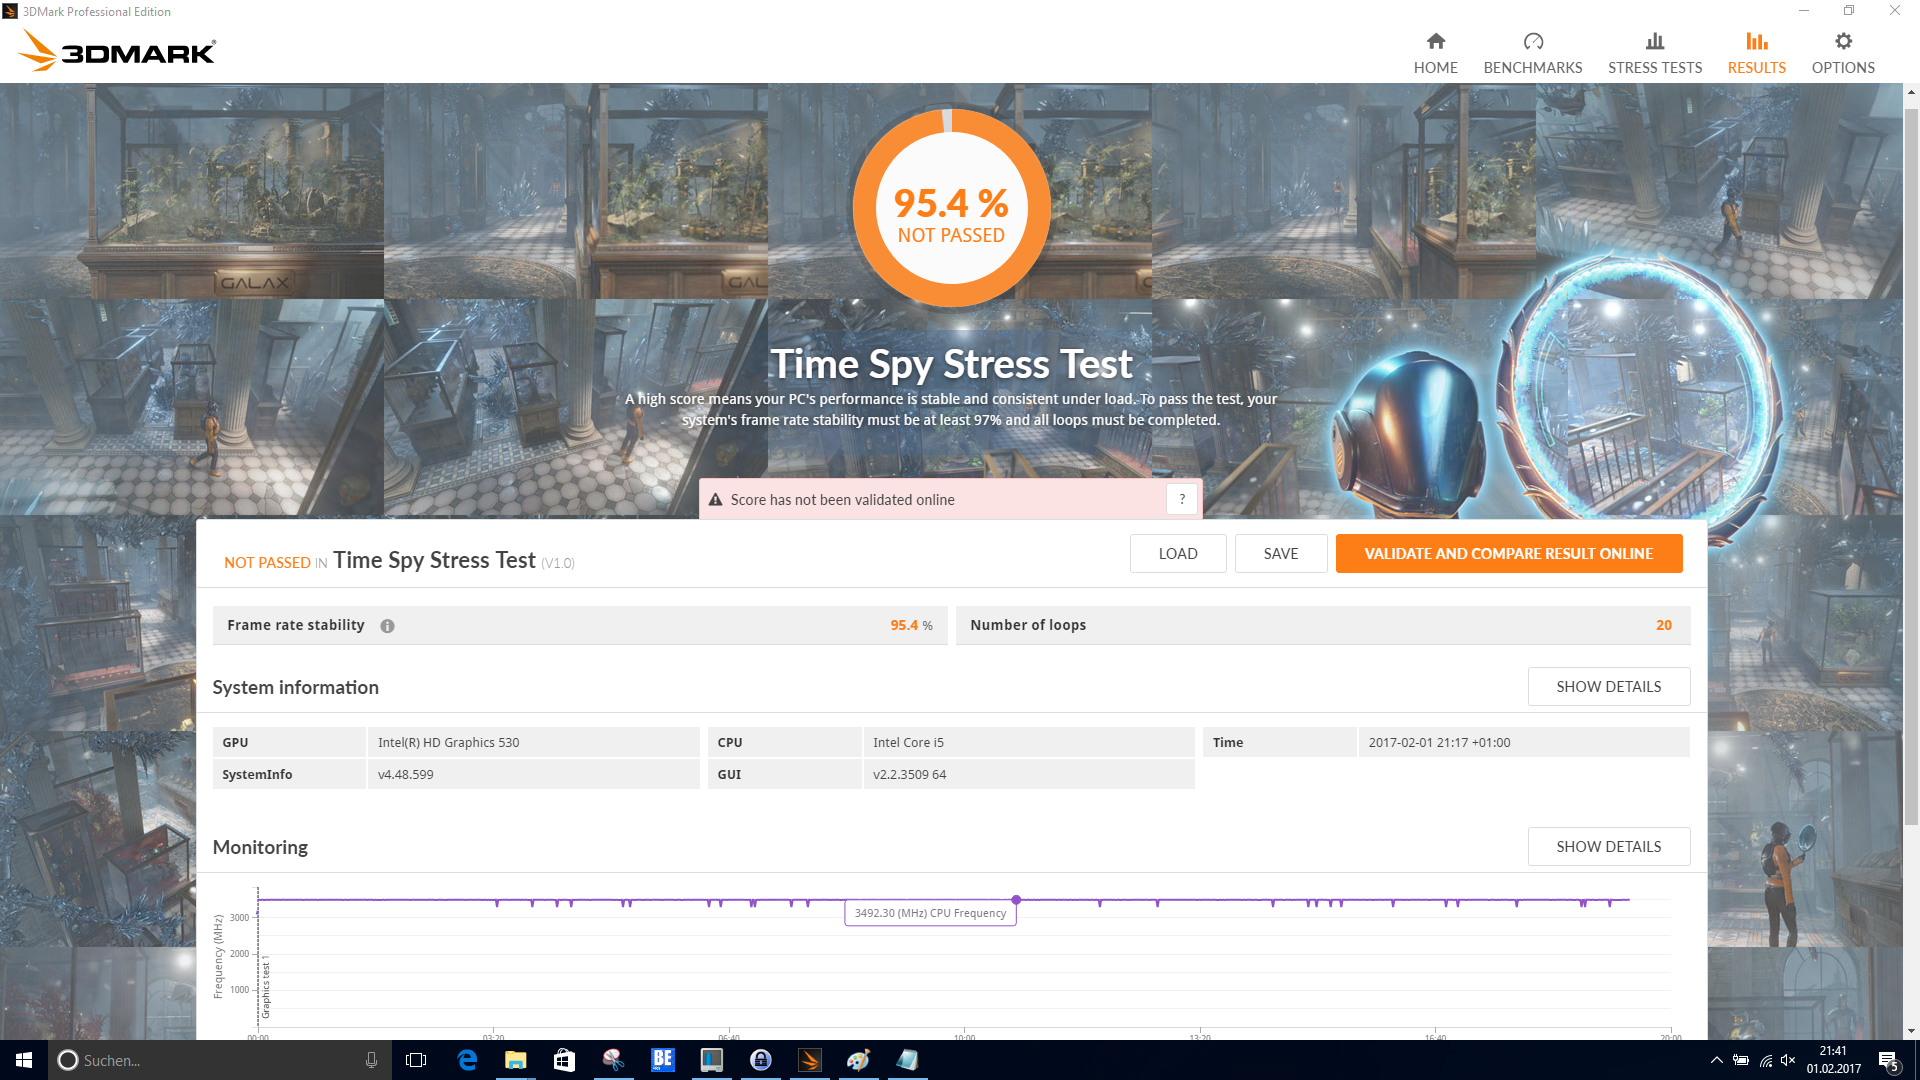
| 3DMark Time Spy Score | 271 points | |
Help | ||
| BioShock Infinite - 1366x768 Medium Preset | |
| HP ProBook 440 G4-Y8B51EA | |
| Acer TravelMate P648-M-757N | |
| Dell Latitude 14 E5470 | |
| Dell Latitude 14 E5470 | |
| Lenovo ThinkPad T460-20FN003LGE | |
| Battlefield 4 - 1366x768 Medium Preset | |
| HP ProBook 440 G4-Y8B51EA | |
| Dell Latitude 14 E5470 | |
| Acer TravelMate P648-M-757N | |
| Dell Latitude 14 E5470 | |
| Lenovo ThinkPad T460-20FN003LGE | |
| low | med. | high | ultra | |
|---|---|---|---|---|
| BioShock Infinite (2013) | 45.6 | 23.7 | 19.5 | 5.5 |
| Battlefield 4 (2013) | 41.2 | 27.8 | 18.3 | 4.9 |
| Rise of the Tomb Raider (2016) | 15 |
Noise level
| Idle |
| 30.3 / 30.3 / 30.3 dB(A) |
| Load |
| 31.6 / 35 dB(A) |
 | ||
30 dB silent 40 dB(A) audible 50 dB(A) loud |
||
min: | ||
| Dell Latitude 14 E5470 6440HQ, HD Graphics 530 | Dell Latitude 14 E5470 6300U, HD Graphics 520 | HP ProBook 440 G4-Y8B51EA i7-7500U, GeForce 930MX | Lenovo ThinkPad T460-20FN003LGE 6200U, HD Graphics 520 | Acer TravelMate P648-M-757N 6500U, HD Graphics 520 | |
|---|---|---|---|---|---|
| Noise | 2% | -2% | 0% | -2% | |
| off / environment * (dB) | 30.3 | 29.2 4% | 29 4% | 29 4% | 31.2 -3% |
| Idle Minimum * (dB) | 30.3 | 29.2 4% | 29 4% | 29 4% | 31.2 -3% |
| Idle Average * (dB) | 30.3 | 29.2 4% | 29 4% | 29 4% | 31.2 -3% |
| Idle Maximum * (dB) | 30.3 | 29.2 4% | 29 4% | 29 4% | 31.6 -4% |
| Load Average * (dB) | 31.6 | 32.1 -2% | 37.4 -18% | 34.2 -8% | 33.3 -5% |
| Load Maximum * (dB) | 35 | 36.8 -5% | 39 -11% | 37.8 -8% | 32.4 7% |
* ... smaller is better
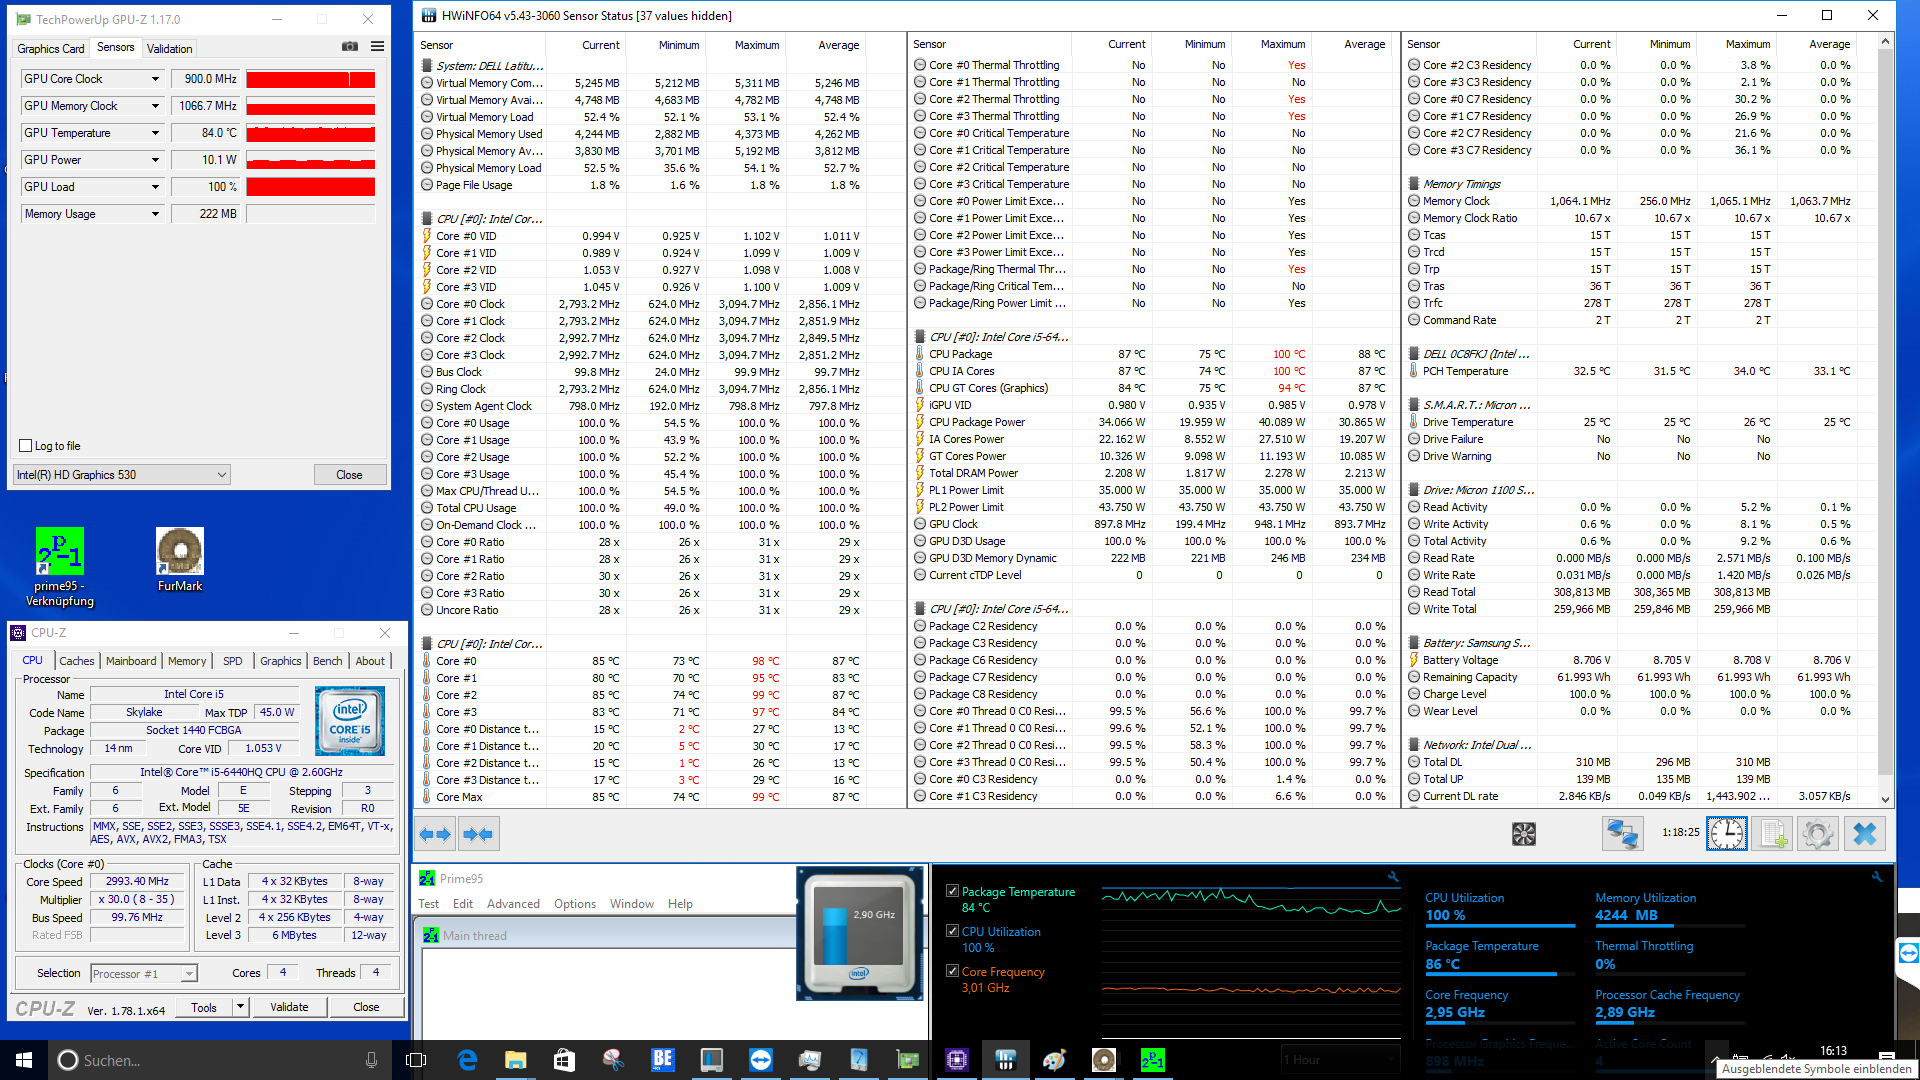
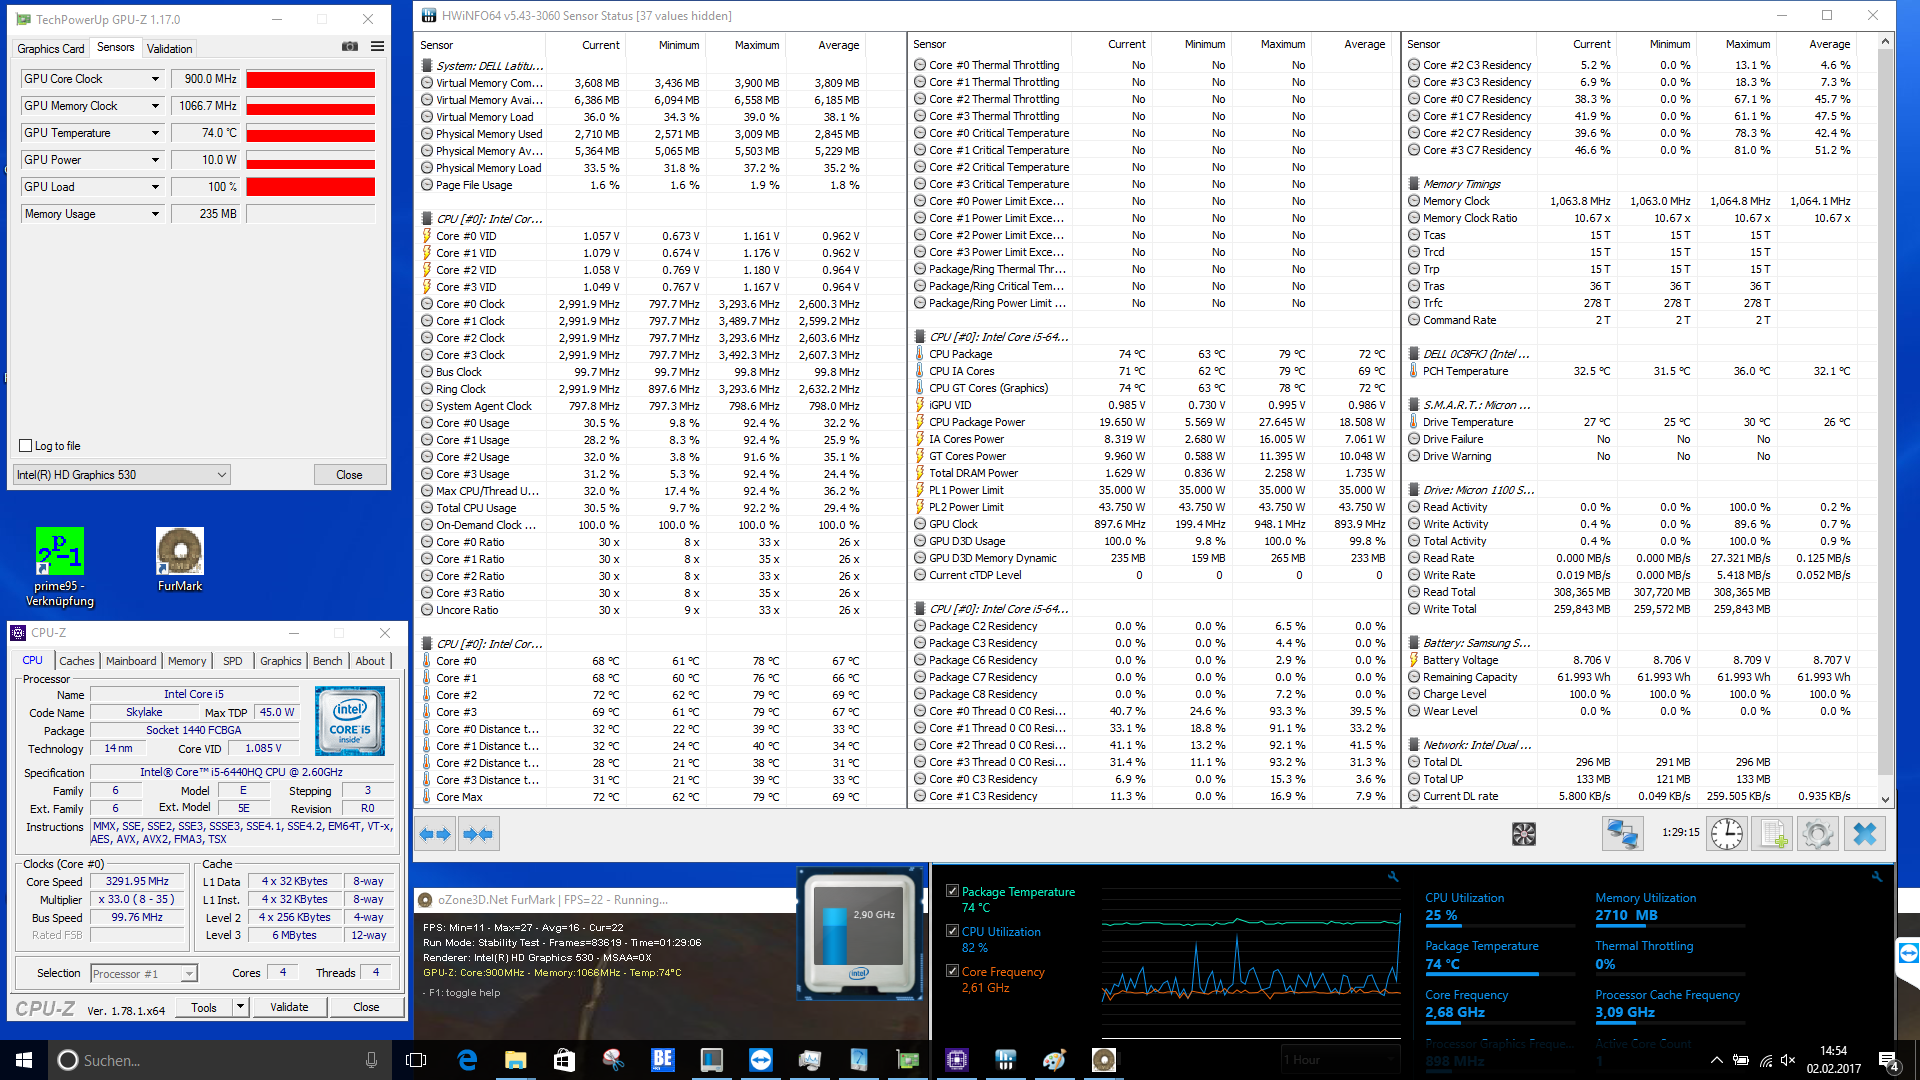
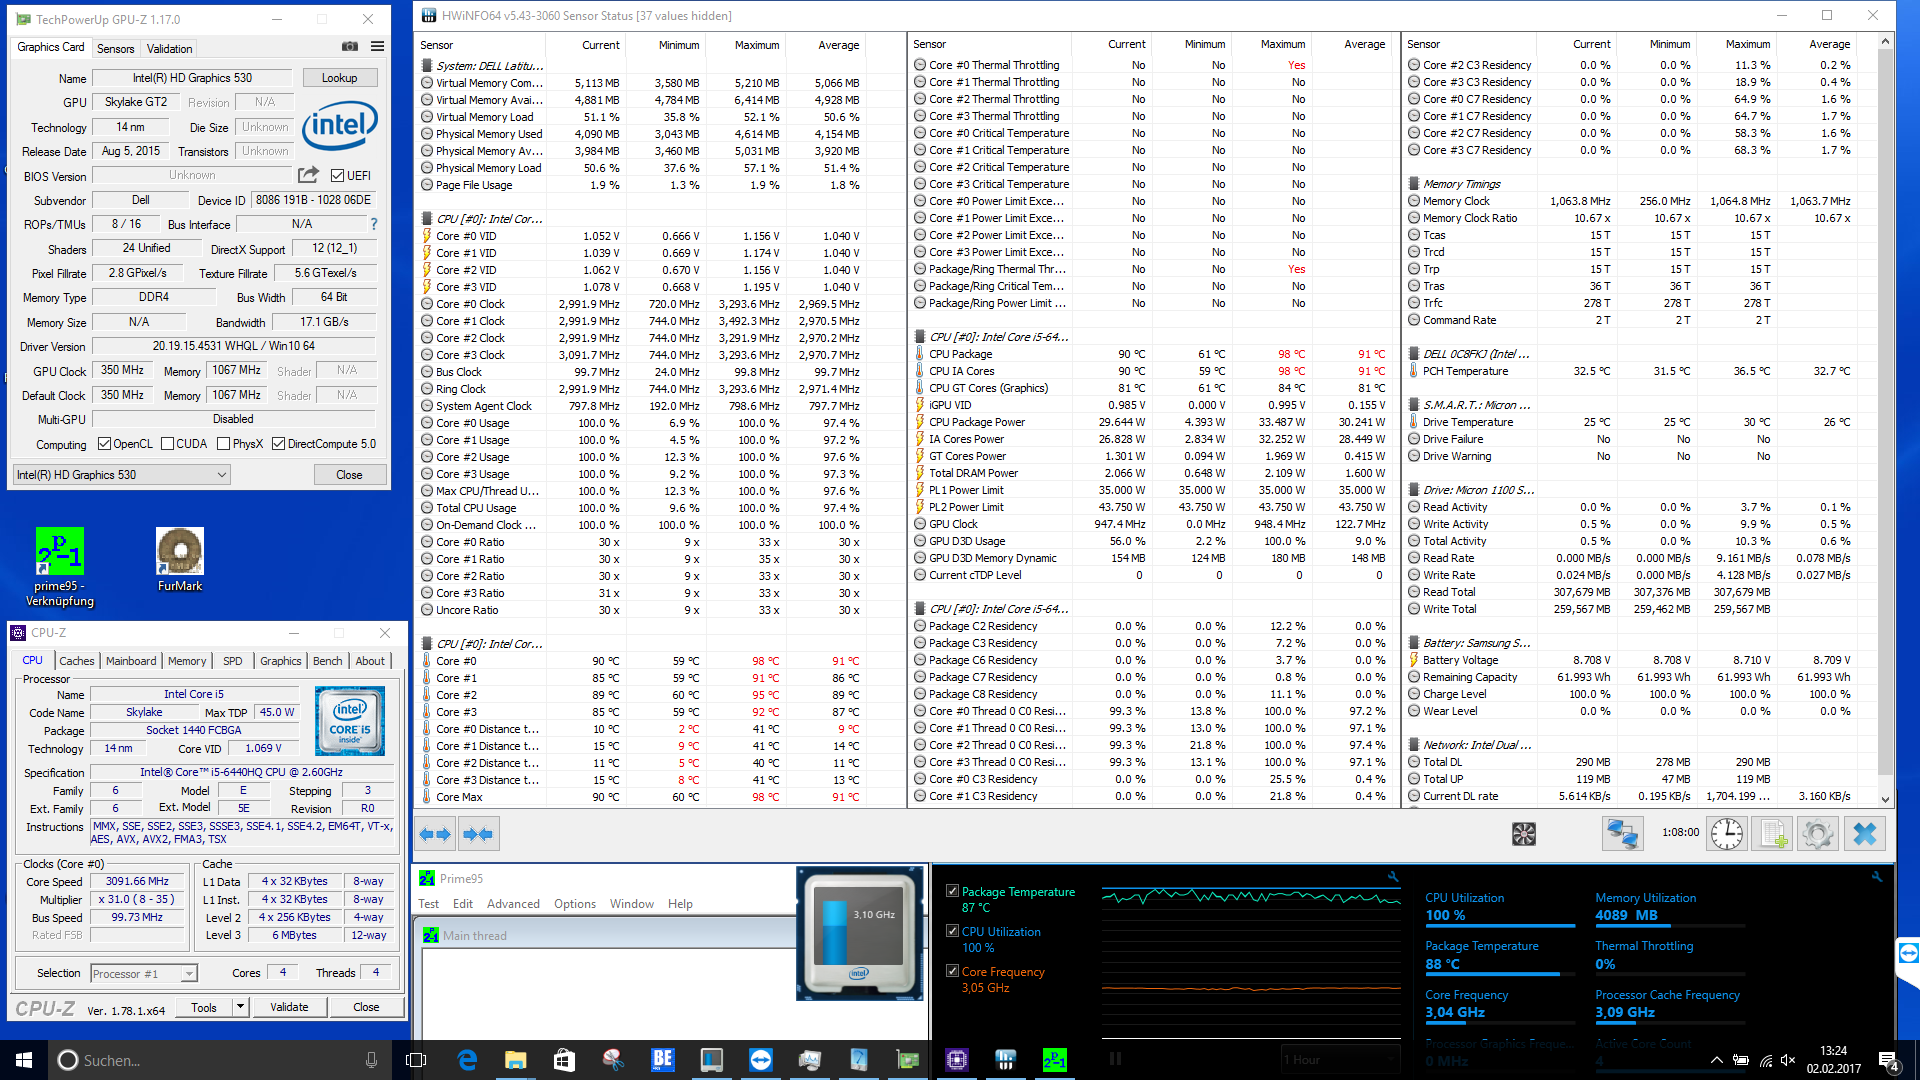
(±) The maximum temperature on the upper side is 43 °C / 109 F, compared to the average of 34.3 °C / 94 F, ranging from 21.2 to 62.5 °C for the class Office.
(±) The bottom heats up to a maximum of 43 °C / 109 F, compared to the average of 36.8 °C / 98 F
(+) In idle usage, the average temperature for the upper side is 27.8 °C / 82 F, compared to the device average of 29.5 °C / 85 F.
(+) The palmrests and touchpad are cooler than skin temperature with a maximum of 26.2 °C / 79.2 F and are therefore cool to the touch.
(±) The average temperature of the palmrest area of similar devices was 27.5 °C / 81.5 F (+1.3 °C / 2.3 F).
| Dell Latitude 14 E5470 6440HQ, HD Graphics 530 | Dell Latitude 14 E5470 6300U, HD Graphics 520 | HP ProBook 440 G4-Y8B51EA i7-7500U, GeForce 930MX | Lenovo ThinkPad T460-20FN003LGE 6200U, HD Graphics 520 | Acer TravelMate P648-M-757N 6500U, HD Graphics 520 | |
|---|---|---|---|---|---|
| Heat | 7% | 8% | 5% | 7% | |
| Maximum Upper Side * (°C) | 43 | 41.5 3% | 41.5 3% | 37.3 13% | 38.5 10% |
| Maximum Bottom * (°C) | 43 | 41.4 4% | 38.1 11% | 44.3 -3% | 36.7 15% |
| Idle Upper Side * (°C) | 31.2 | 26.9 14% | 28.4 9% | 29 7% | 31.5 -1% |
| Idle Bottom * (°C) | 31.3 | 29.6 5% | 28.3 10% | 30.1 4% | 29.6 5% |
* ... smaller is better
Dell Latitude 14 E5470 audio analysis
(±) | speaker loudness is average but good (73 dB)
Bass 100 - 315 Hz
(-) | nearly no bass - on average 16.2% lower than median
(+) | bass is linear (4.3% delta to prev. frequency)
Mids 400 - 2000 Hz
(±) | higher mids - on average 5.3% higher than median
(+) | mids are linear (5.2% delta to prev. frequency)
Highs 2 - 16 kHz
(±) | higher highs - on average 6.8% higher than median
(+) | highs are linear (2.9% delta to prev. frequency)
Overall 100 - 16.000 Hz
(±) | linearity of overall sound is average (19.7% difference to median)
Compared to same class
» 41% of all tested devices in this class were better, 7% similar, 51% worse
» The best had a delta of 7%, average was 21%, worst was 53%
Compared to all devices tested
» 50% of all tested devices were better, 7% similar, 43% worse
» The best had a delta of 4%, average was 23%, worst was 134%
Apple MacBook 12 (Early 2016) 1.1 GHz audio analysis
(+) | speakers can play relatively loud (83.6 dB)
Bass 100 - 315 Hz
(±) | reduced bass - on average 11.3% lower than median
(±) | linearity of bass is average (14.2% delta to prev. frequency)
Mids 400 - 2000 Hz
(+) | balanced mids - only 2.4% away from median
(+) | mids are linear (5.5% delta to prev. frequency)
Highs 2 - 16 kHz
(+) | balanced highs - only 2% away from median
(+) | highs are linear (4.5% delta to prev. frequency)
Overall 100 - 16.000 Hz
(+) | overall sound is linear (10.2% difference to median)
Compared to same class
» 7% of all tested devices in this class were better, 2% similar, 90% worse
» The best had a delta of 5%, average was 18%, worst was 53%
Compared to all devices tested
» 5% of all tested devices were better, 1% similar, 94% worse
» The best had a delta of 4%, average was 23%, worst was 134%
| Off / Standby | |
| Idle | |
| Load |
|
Key:
min: | |
| Dell Latitude 14 E5470 6440HQ, HD Graphics 530, Micron SSD 1100 (MTFDDAV256TBN) | Dell Latitude 14 E5470 6300U, HD Graphics 520, Liteon L8H-256V2G | HP ProBook 440 G4-Y8B51EA i7-7500U, GeForce 930MX, SanDisk SD8SNAT256G1002 | Lenovo ThinkPad T460-20FN003LGE 6200U, HD Graphics 520, Toshiba HG6 THNSFJ256GCSU | Acer TravelMate P648-M-757N 6500U, HD Graphics 520, Lite-On CV1-8B256 | |
|---|---|---|---|---|---|
| Power Consumption | 29% | 14% | 23% | -0% | |
| Idle Minimum * (Watt) | 4.1 | 3.5 15% | 3 27% | 3.5 15% | 5.3 -29% |
| Idle Average * (Watt) | 8.1 | 5.3 35% | 5.4 33% | 6.7 17% | 9.3 -15% |
| Idle Maximum * (Watt) | 11.4 | 6 47% | 6.3 45% | 7.3 36% | 11.5 -1% |
| Load Average * (Watt) | 33.5 | 26.3 21% | 37.5 -12% | 28.2 16% | 30.8 8% |
| Load Maximum * (Watt) | 49 | 36.6 25% | 61.1 -25% | 34.6 29% | 32 35% |
* ... smaller is better
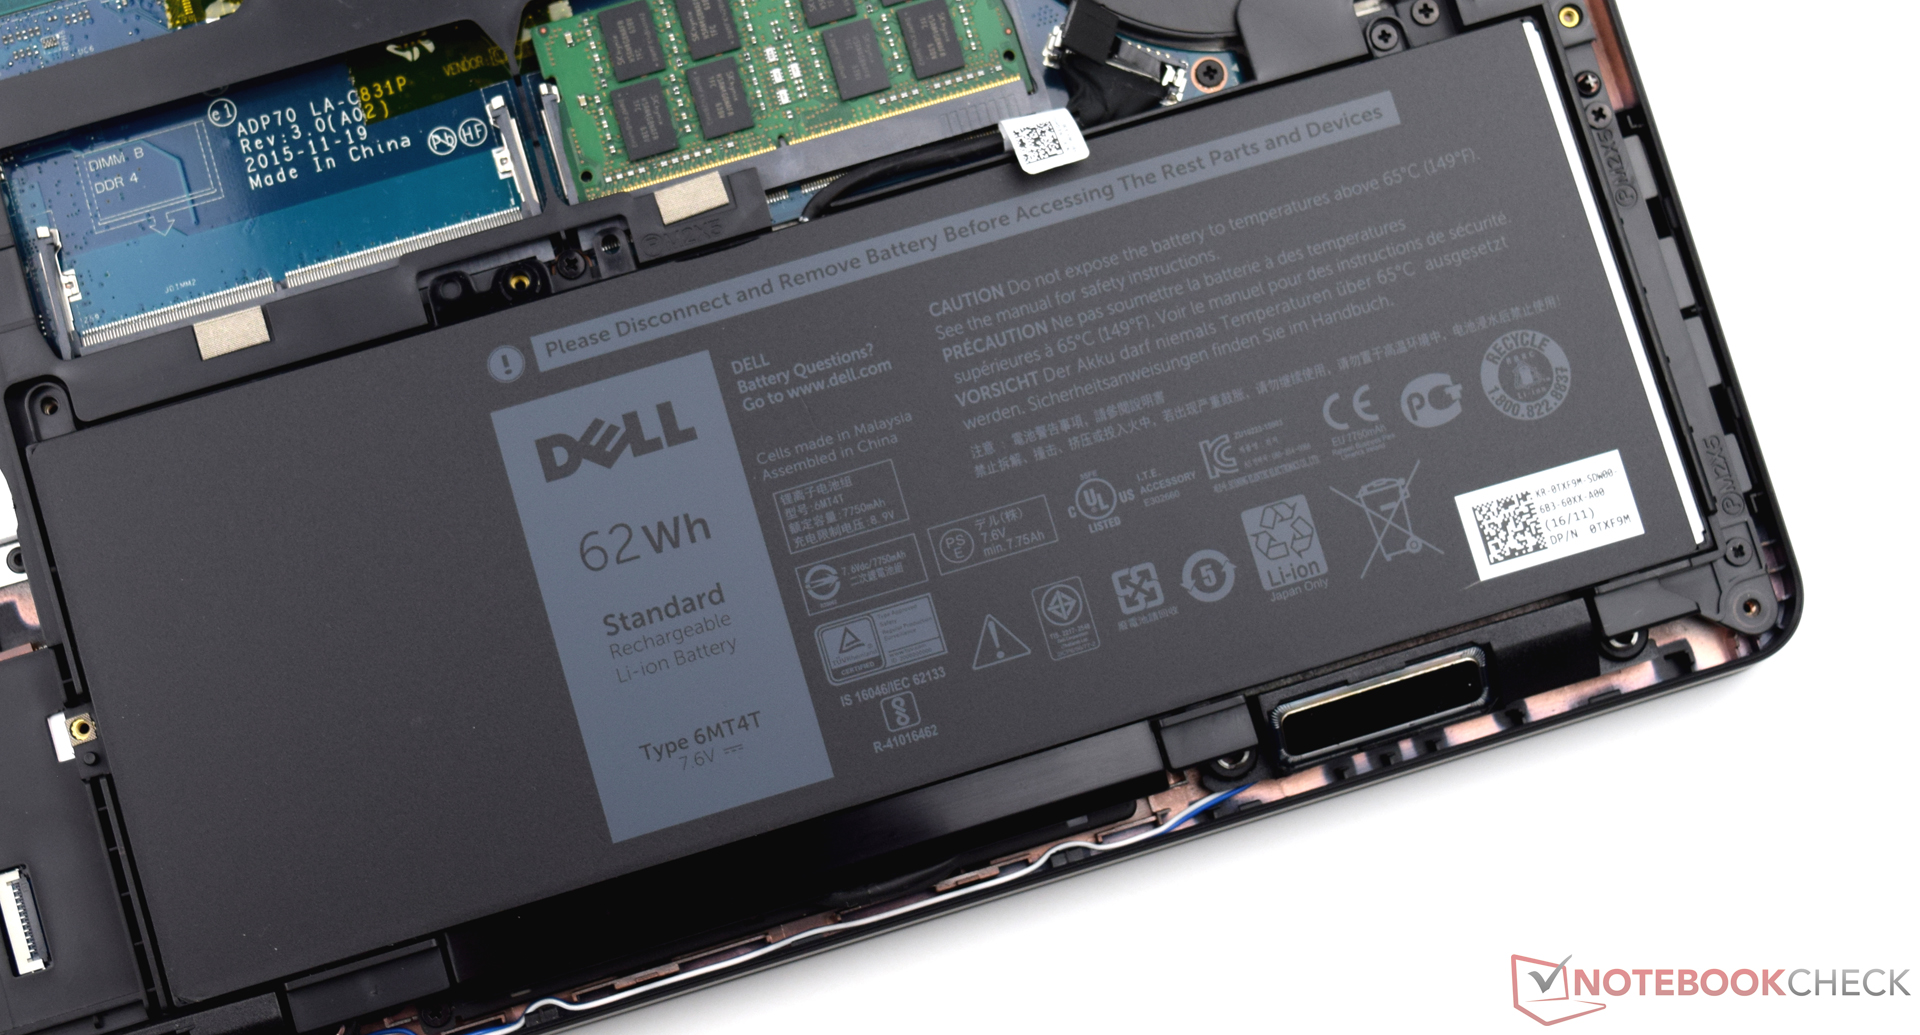

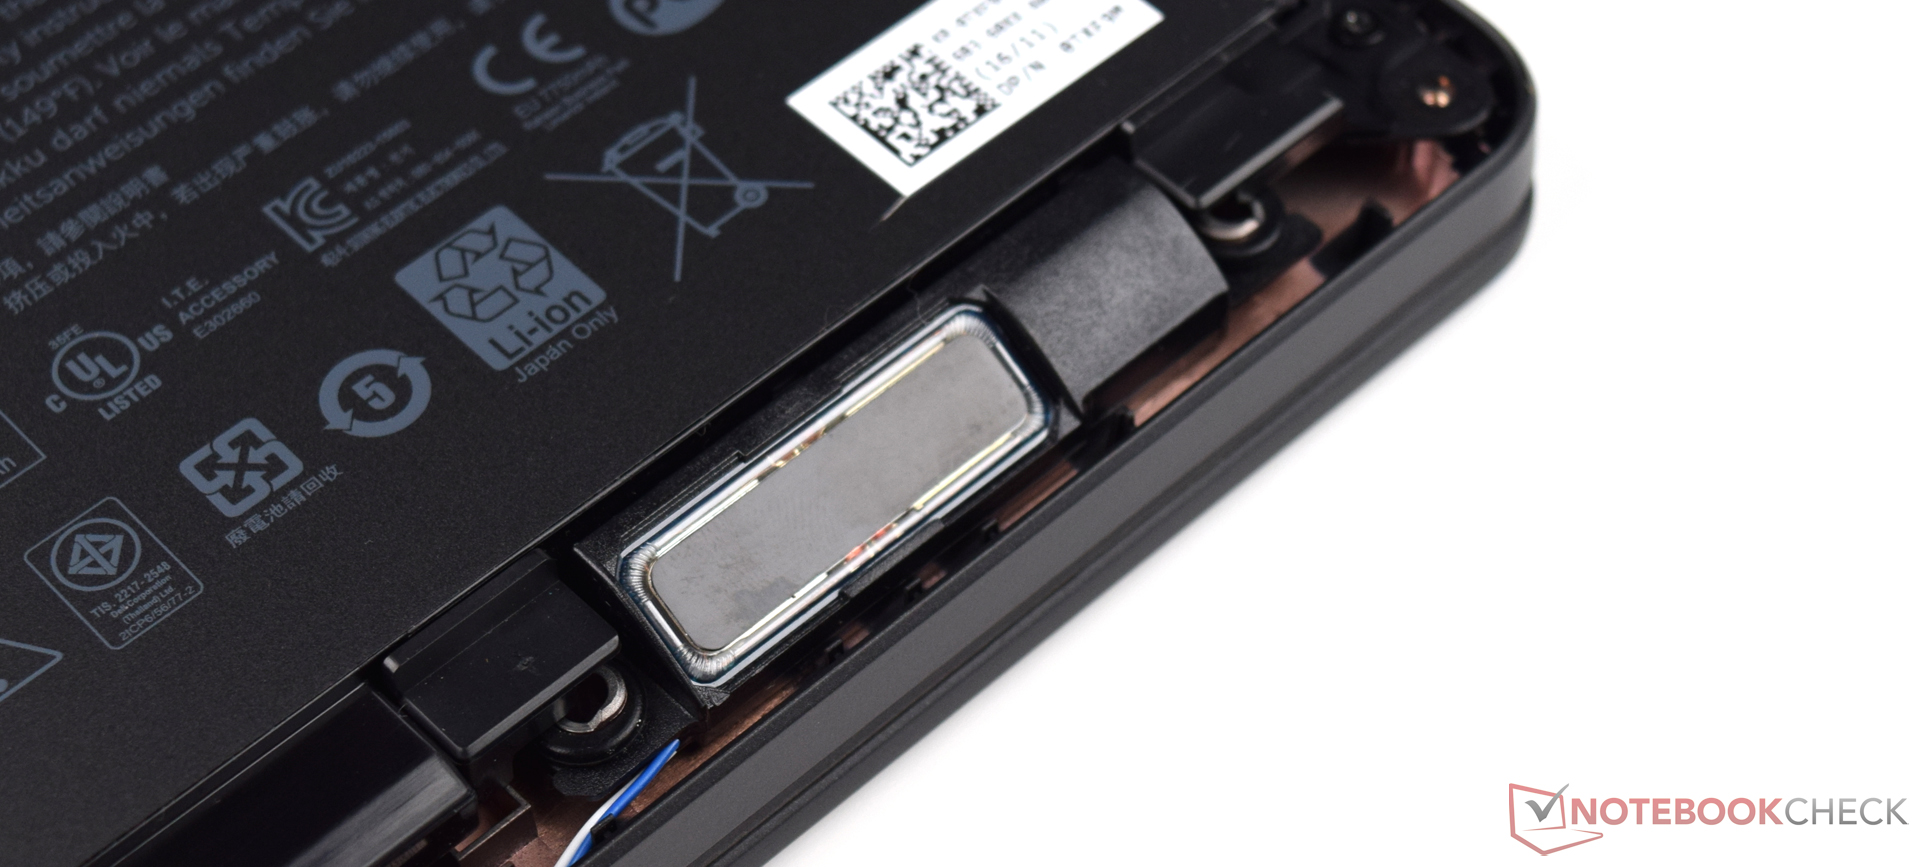
| Dell Latitude 14 E5470 6440HQ, HD Graphics 530, 62 Wh | Dell Latitude 14 E5470 6300U, HD Graphics 520, 62 Wh | HP ProBook 440 G4-Y8B51EA i7-7500U, GeForce 930MX, 48 Wh | Lenovo ThinkPad T460-20FN003LGE 6200U, HD Graphics 520, 46 Wh | Acer TravelMate P648-M-757N 6500U, HD Graphics 520, 54 Wh | |
|---|---|---|---|---|---|
| Battery runtime | 65% | 33% | 5% | 27% | |
| Reader / Idle (h) | 15.2 | 21.7 43% | 18.1 19% | 15.9 5% | 18.1 19% |
| H.264 (h) | 6.9 | 10.8 57% | 9.5 38% | 8.5 23% | 9.1 32% |
| WiFi v1.3 (h) | 7.2 | 11.1 54% | 6.9 -4% | 5.6 -22% | 9.1 26% |
| Load (h) | 1.4 | 2.9 107% | 2.5 79% | 1.6 14% | 1.8 29% |
Pros
Cons
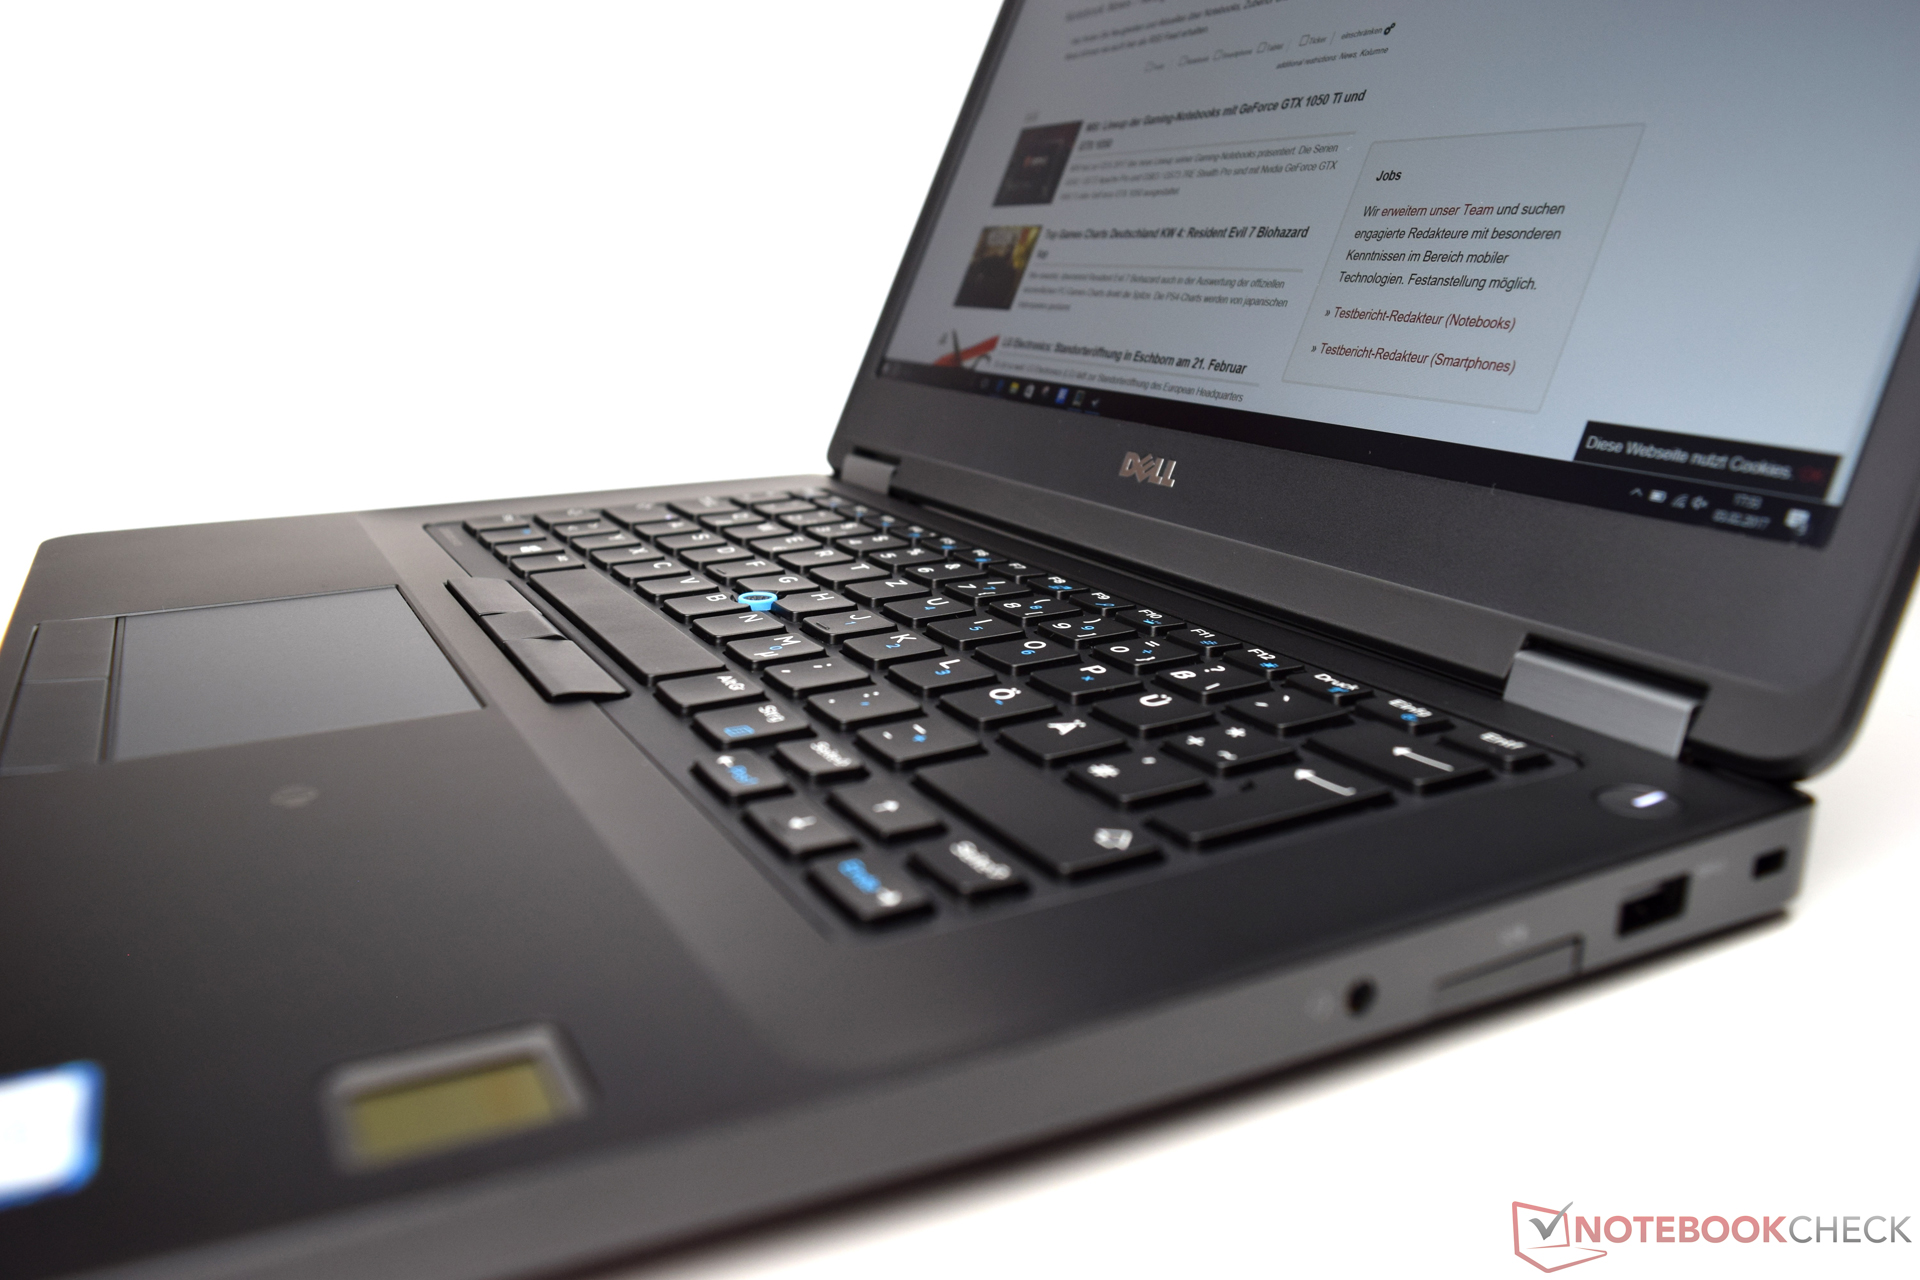
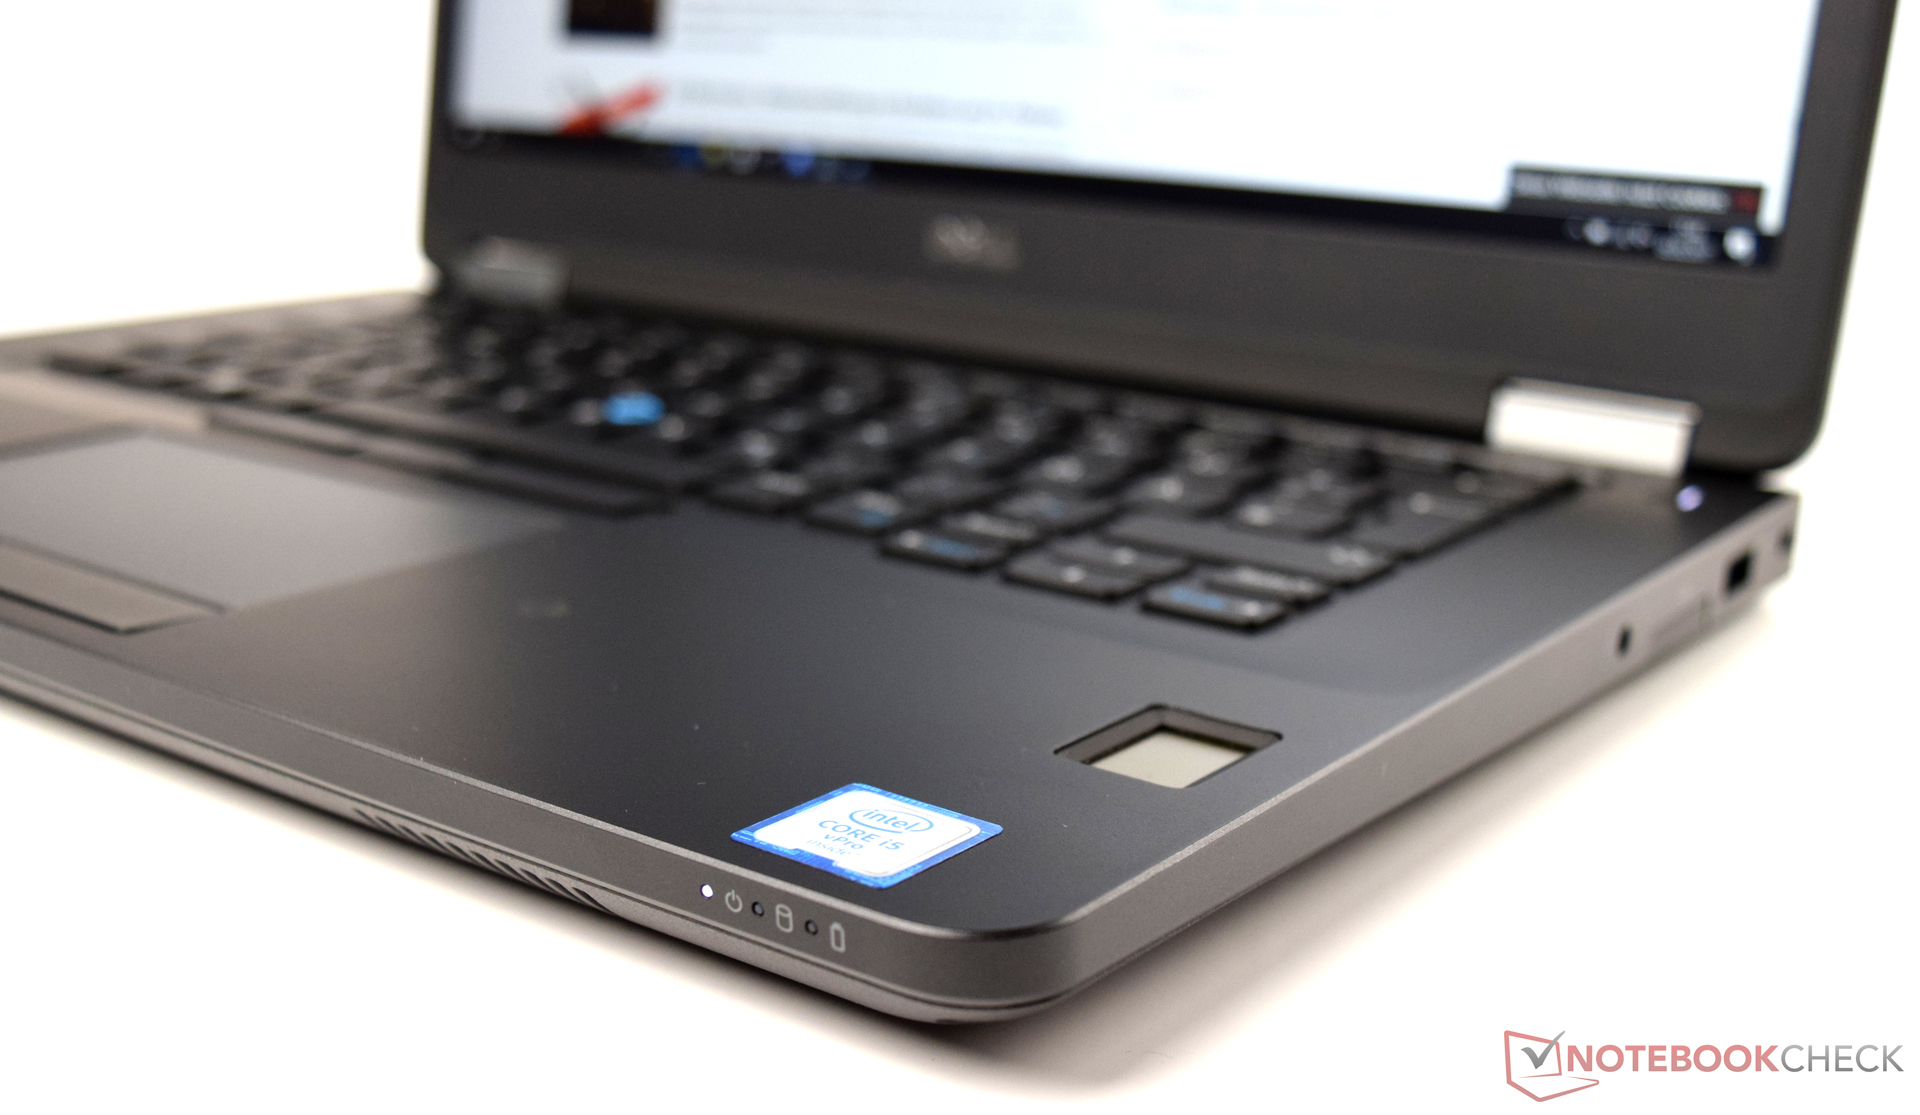
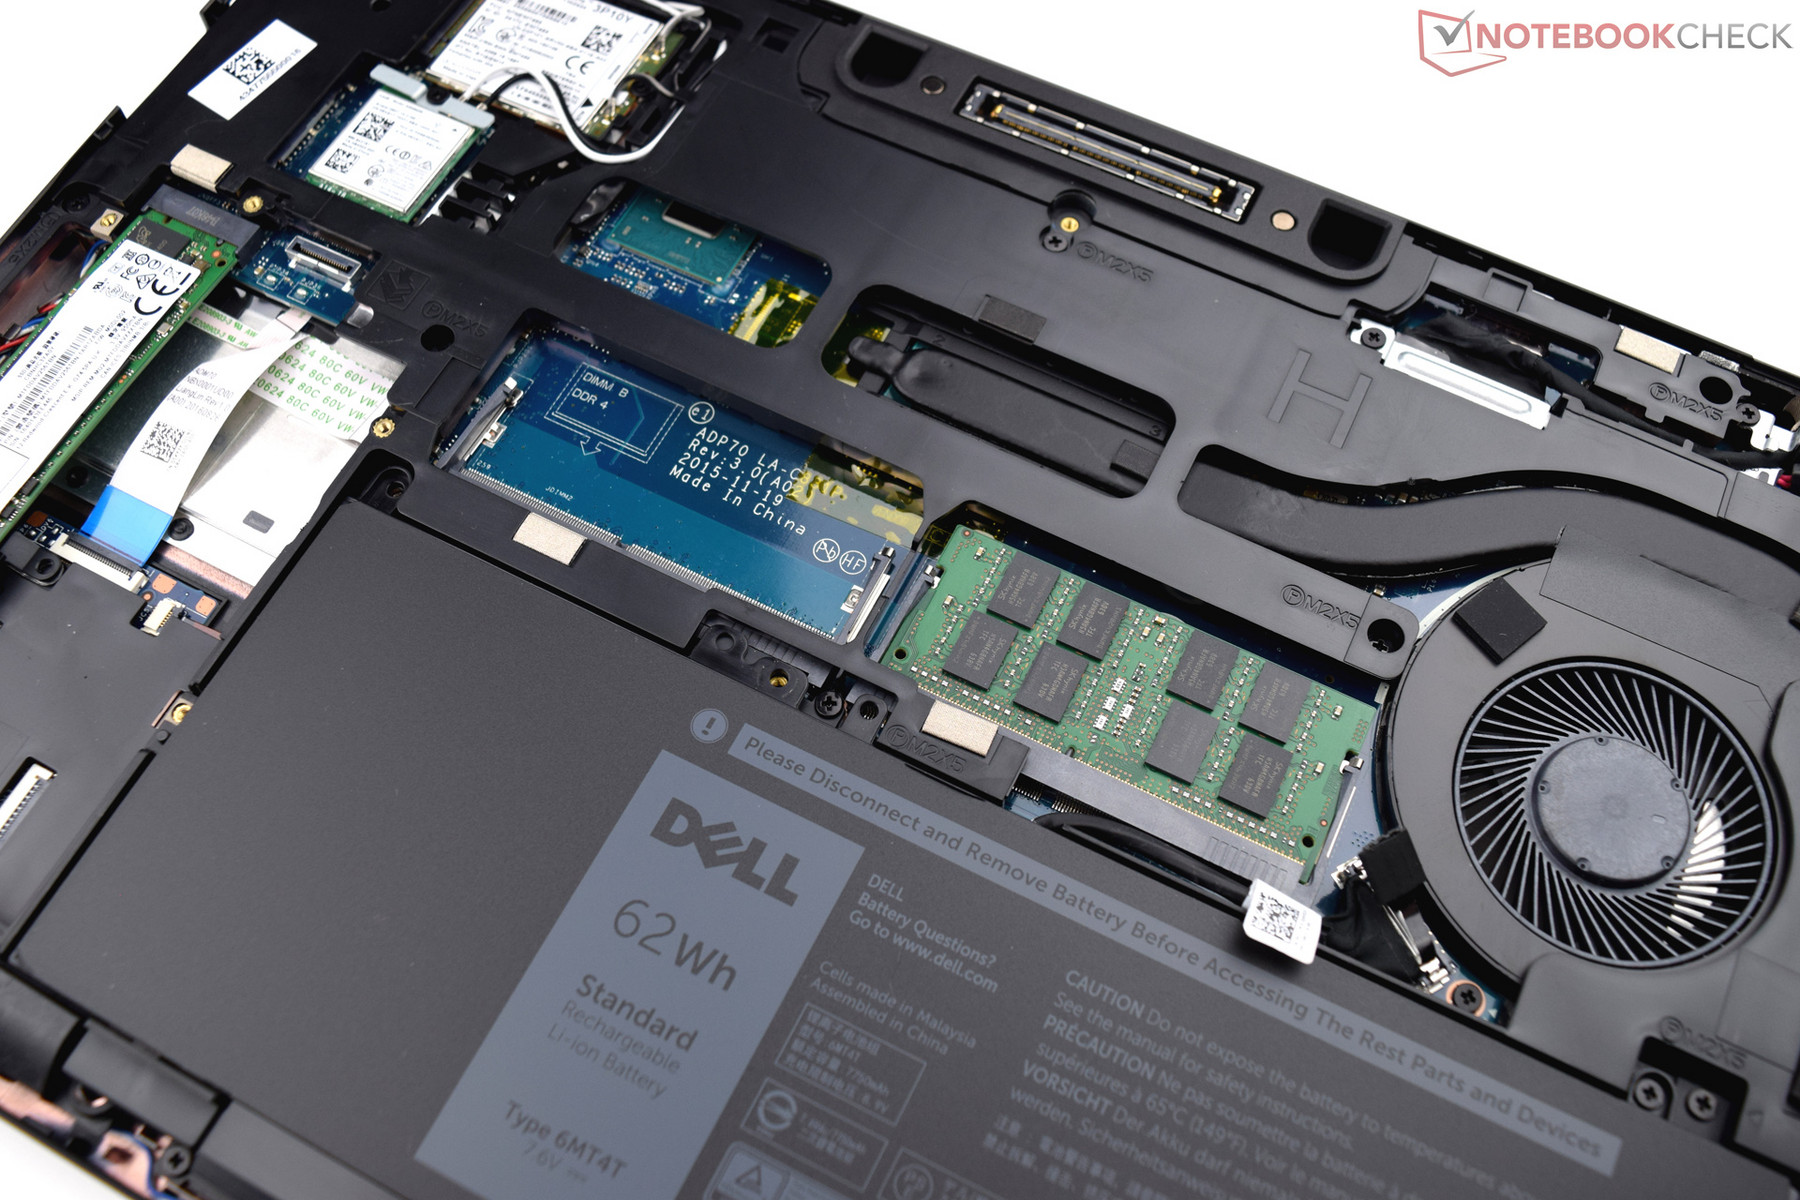
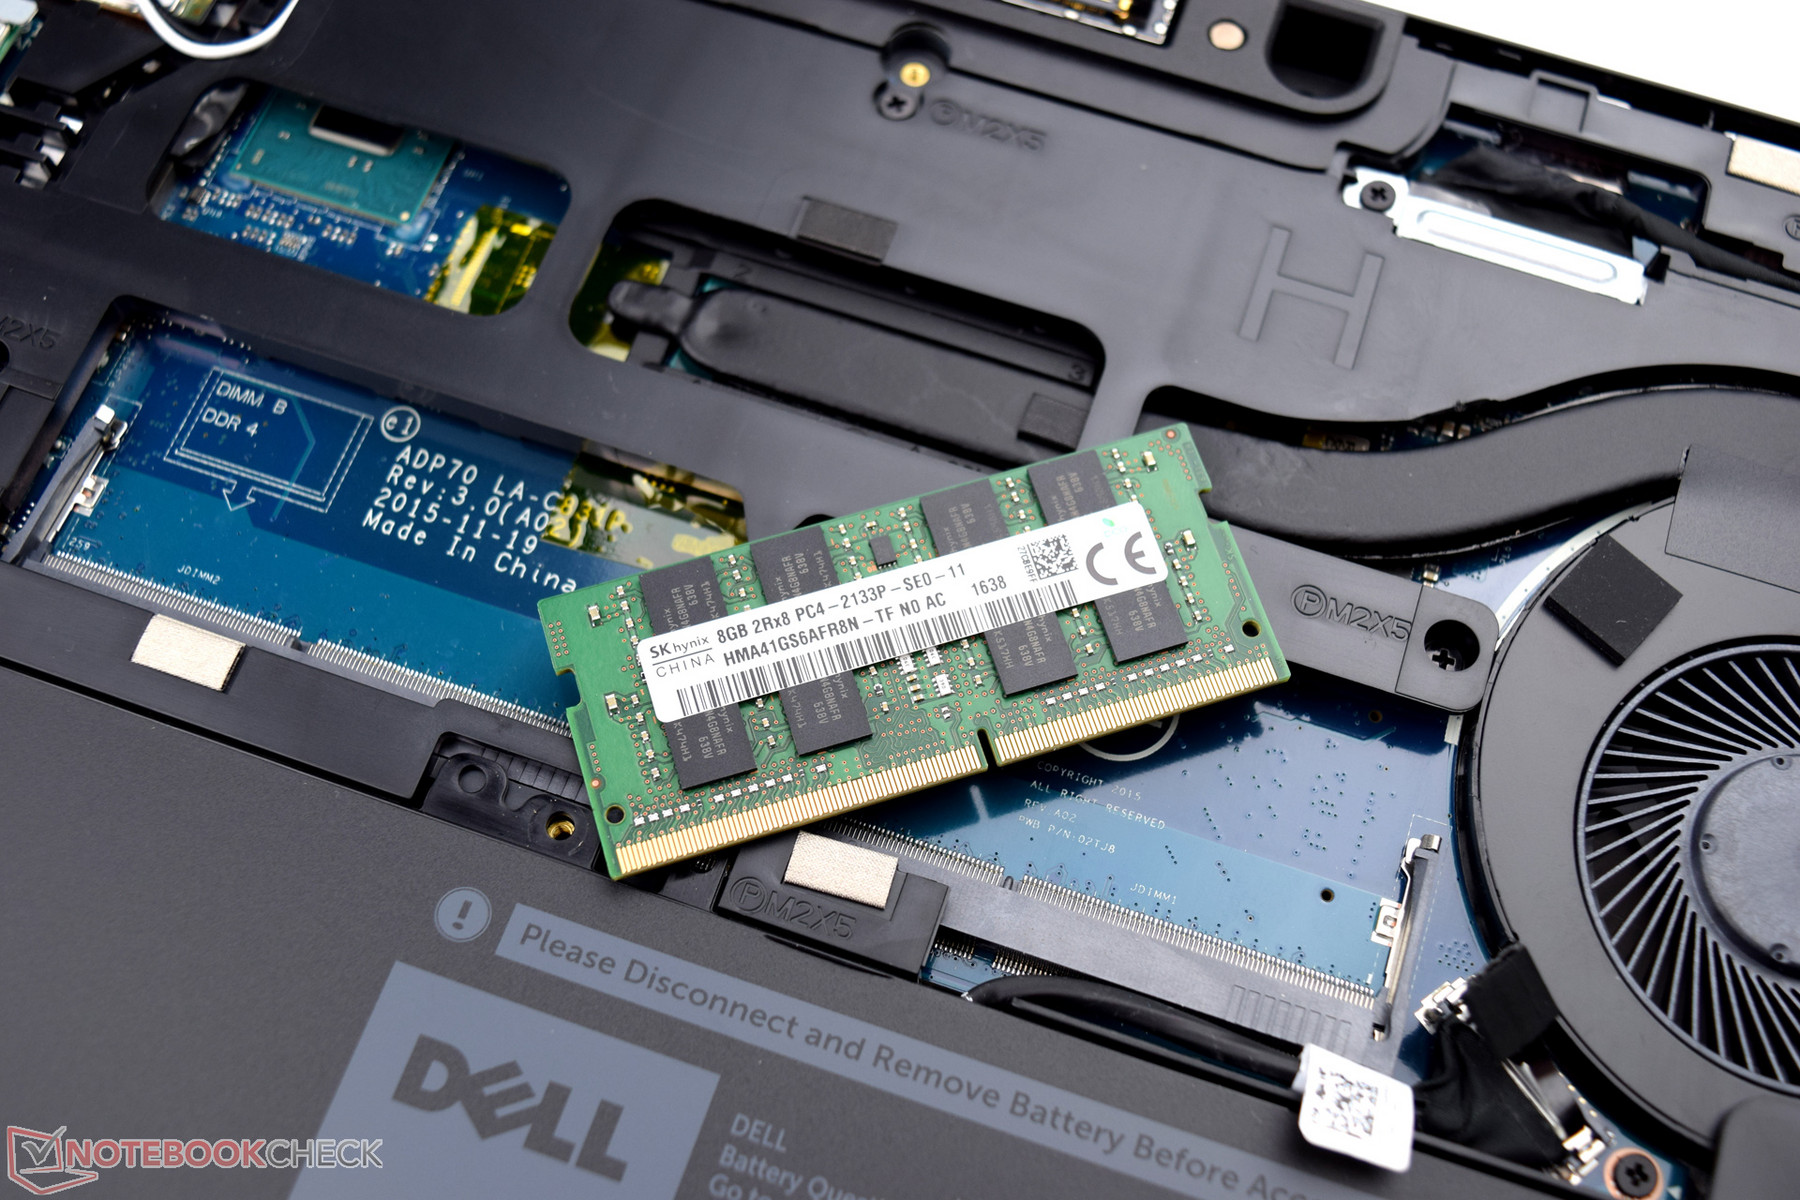
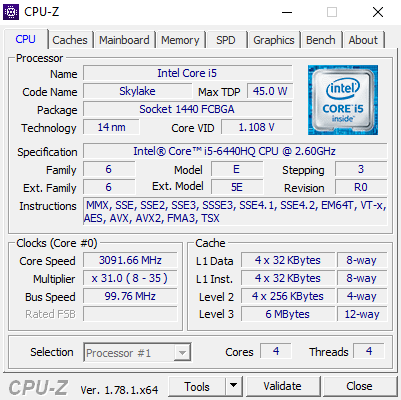
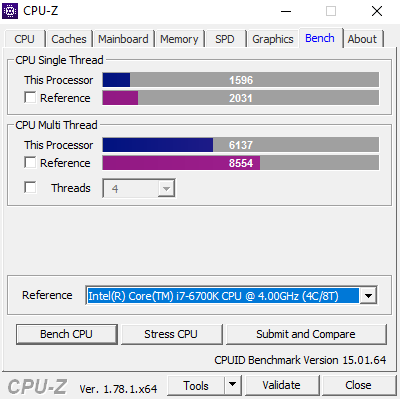
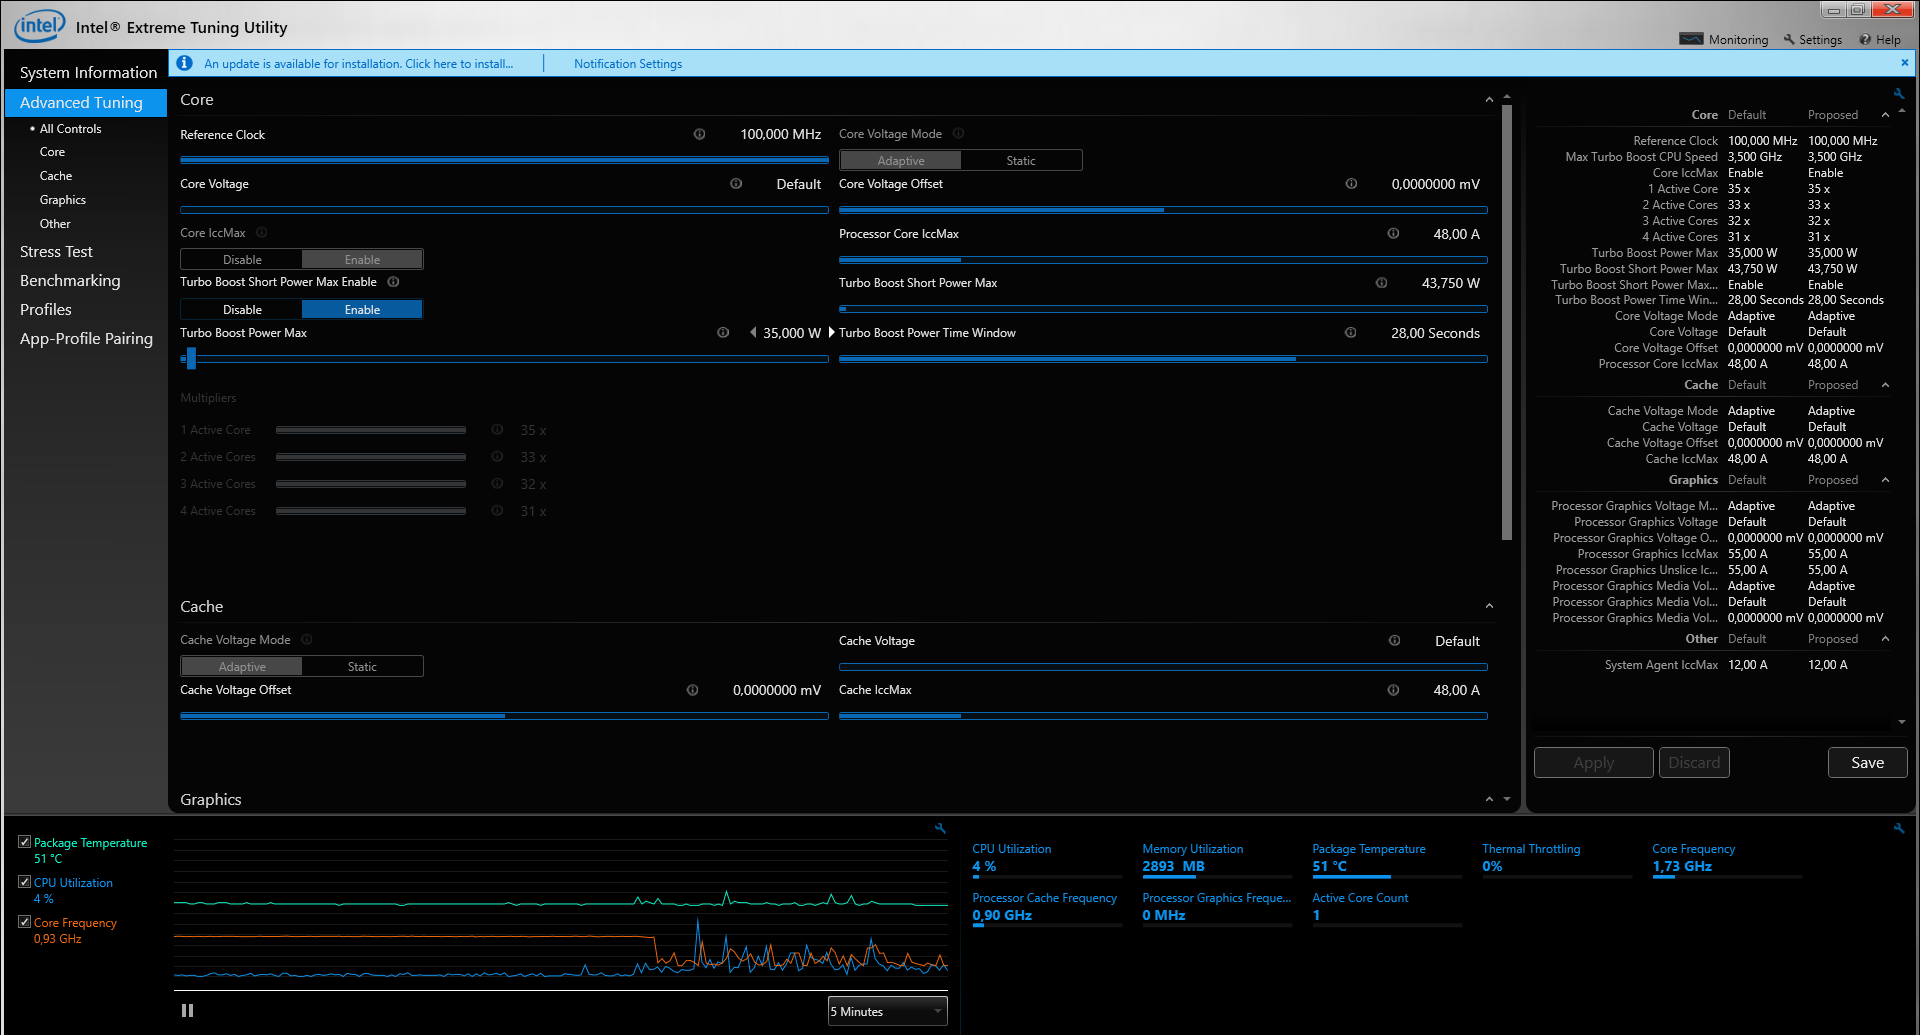
戴尔为我们带来了一台具备优秀性能的高品质商务笔记本电脑。尽管Latitude 14 E5470搭配了较老的Skylake处理器,不过最新的Kaby Lake处理器也会在某些情况下处于劣势。四颗物理核心在支持多线程的程序中会更高效。强劲的处理器搭配8GB内存和256GB固态硬盘保证了流畅的系统运行。
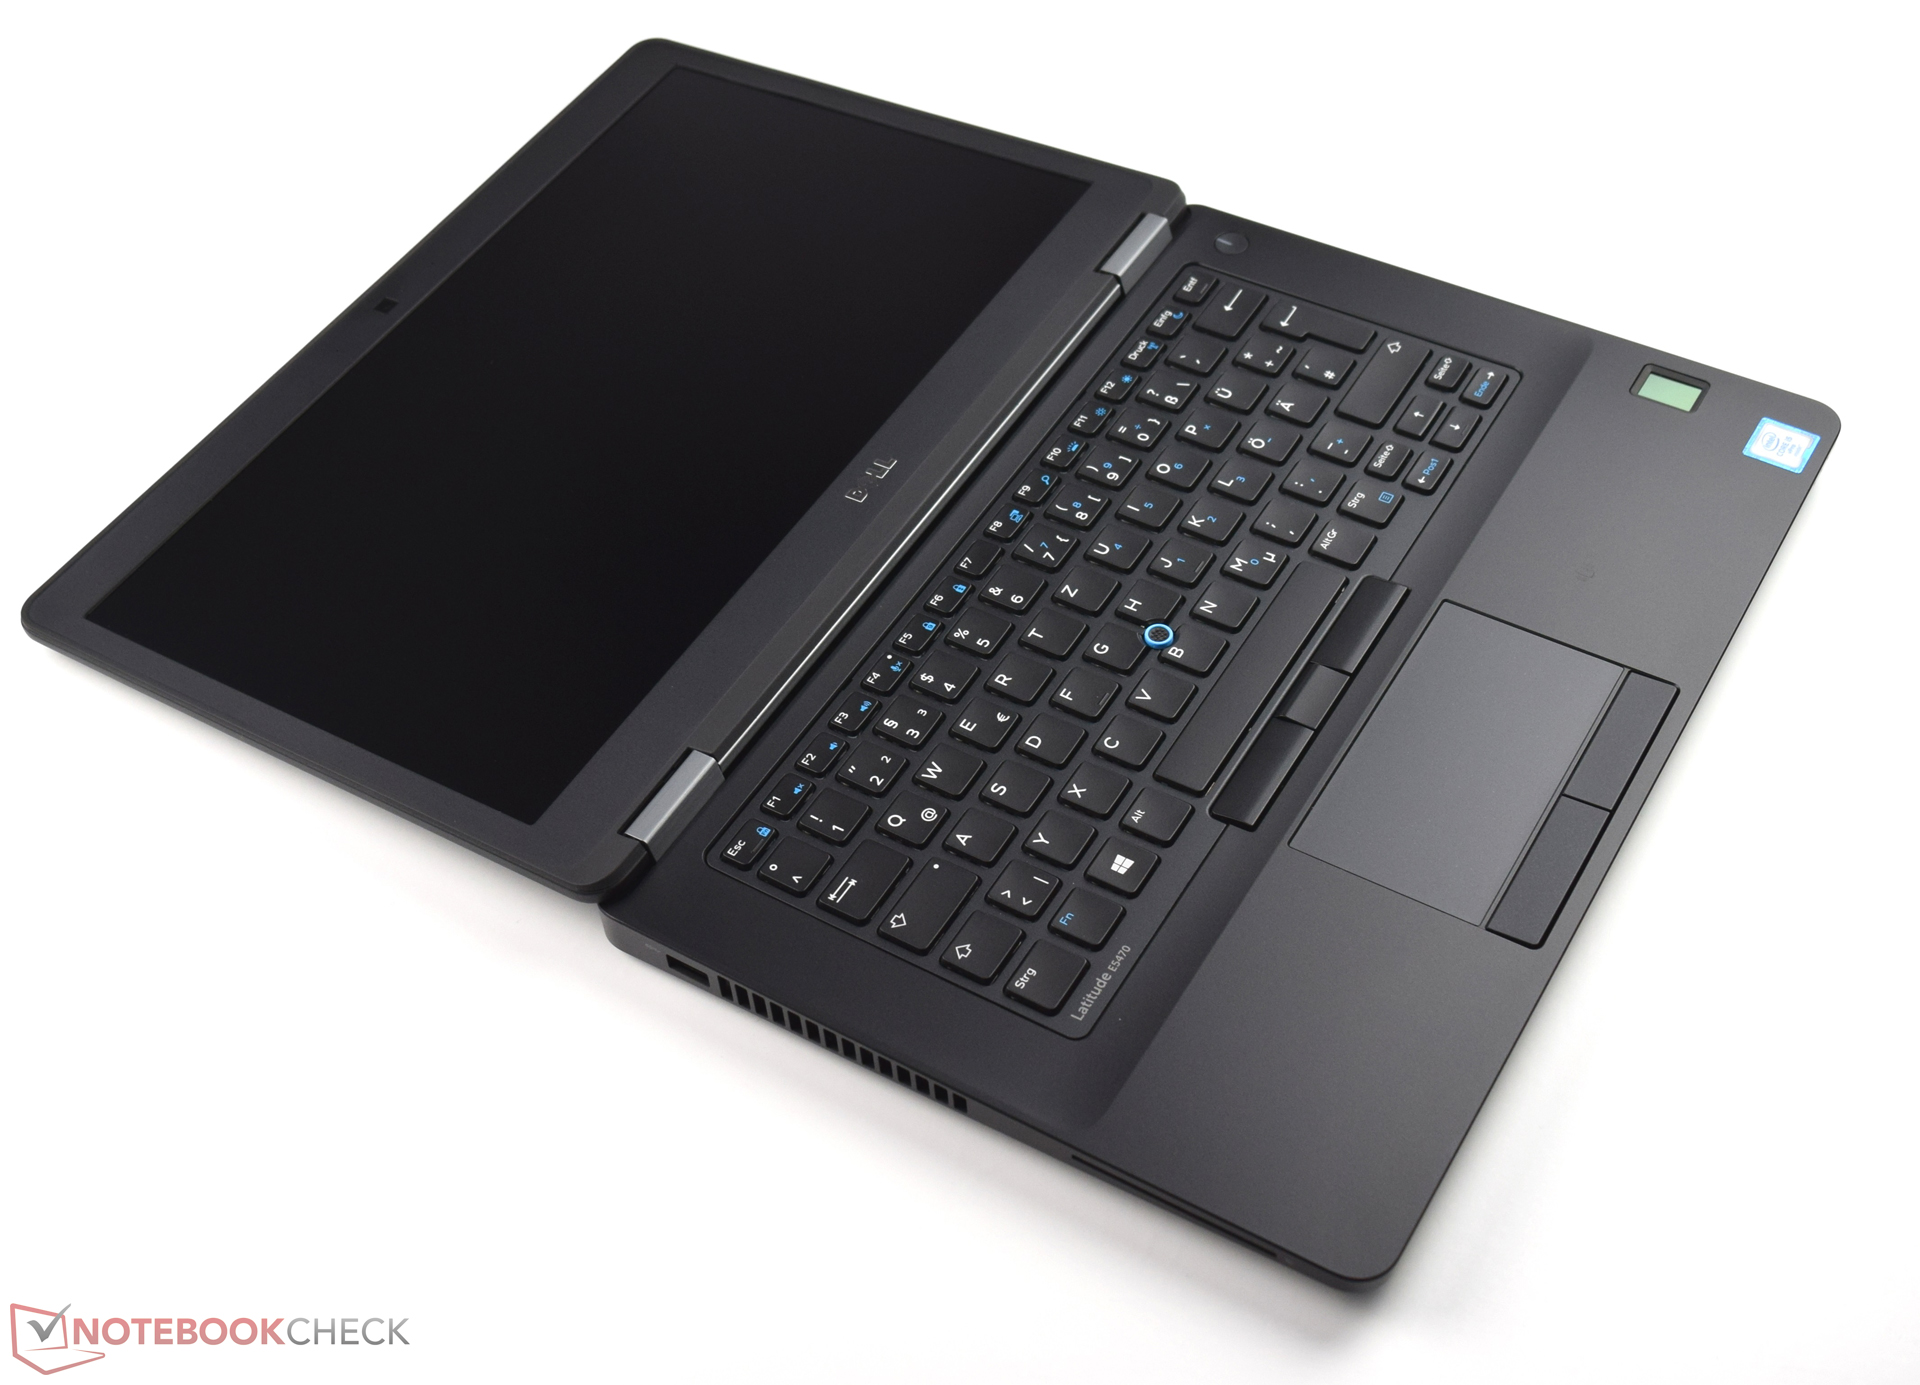
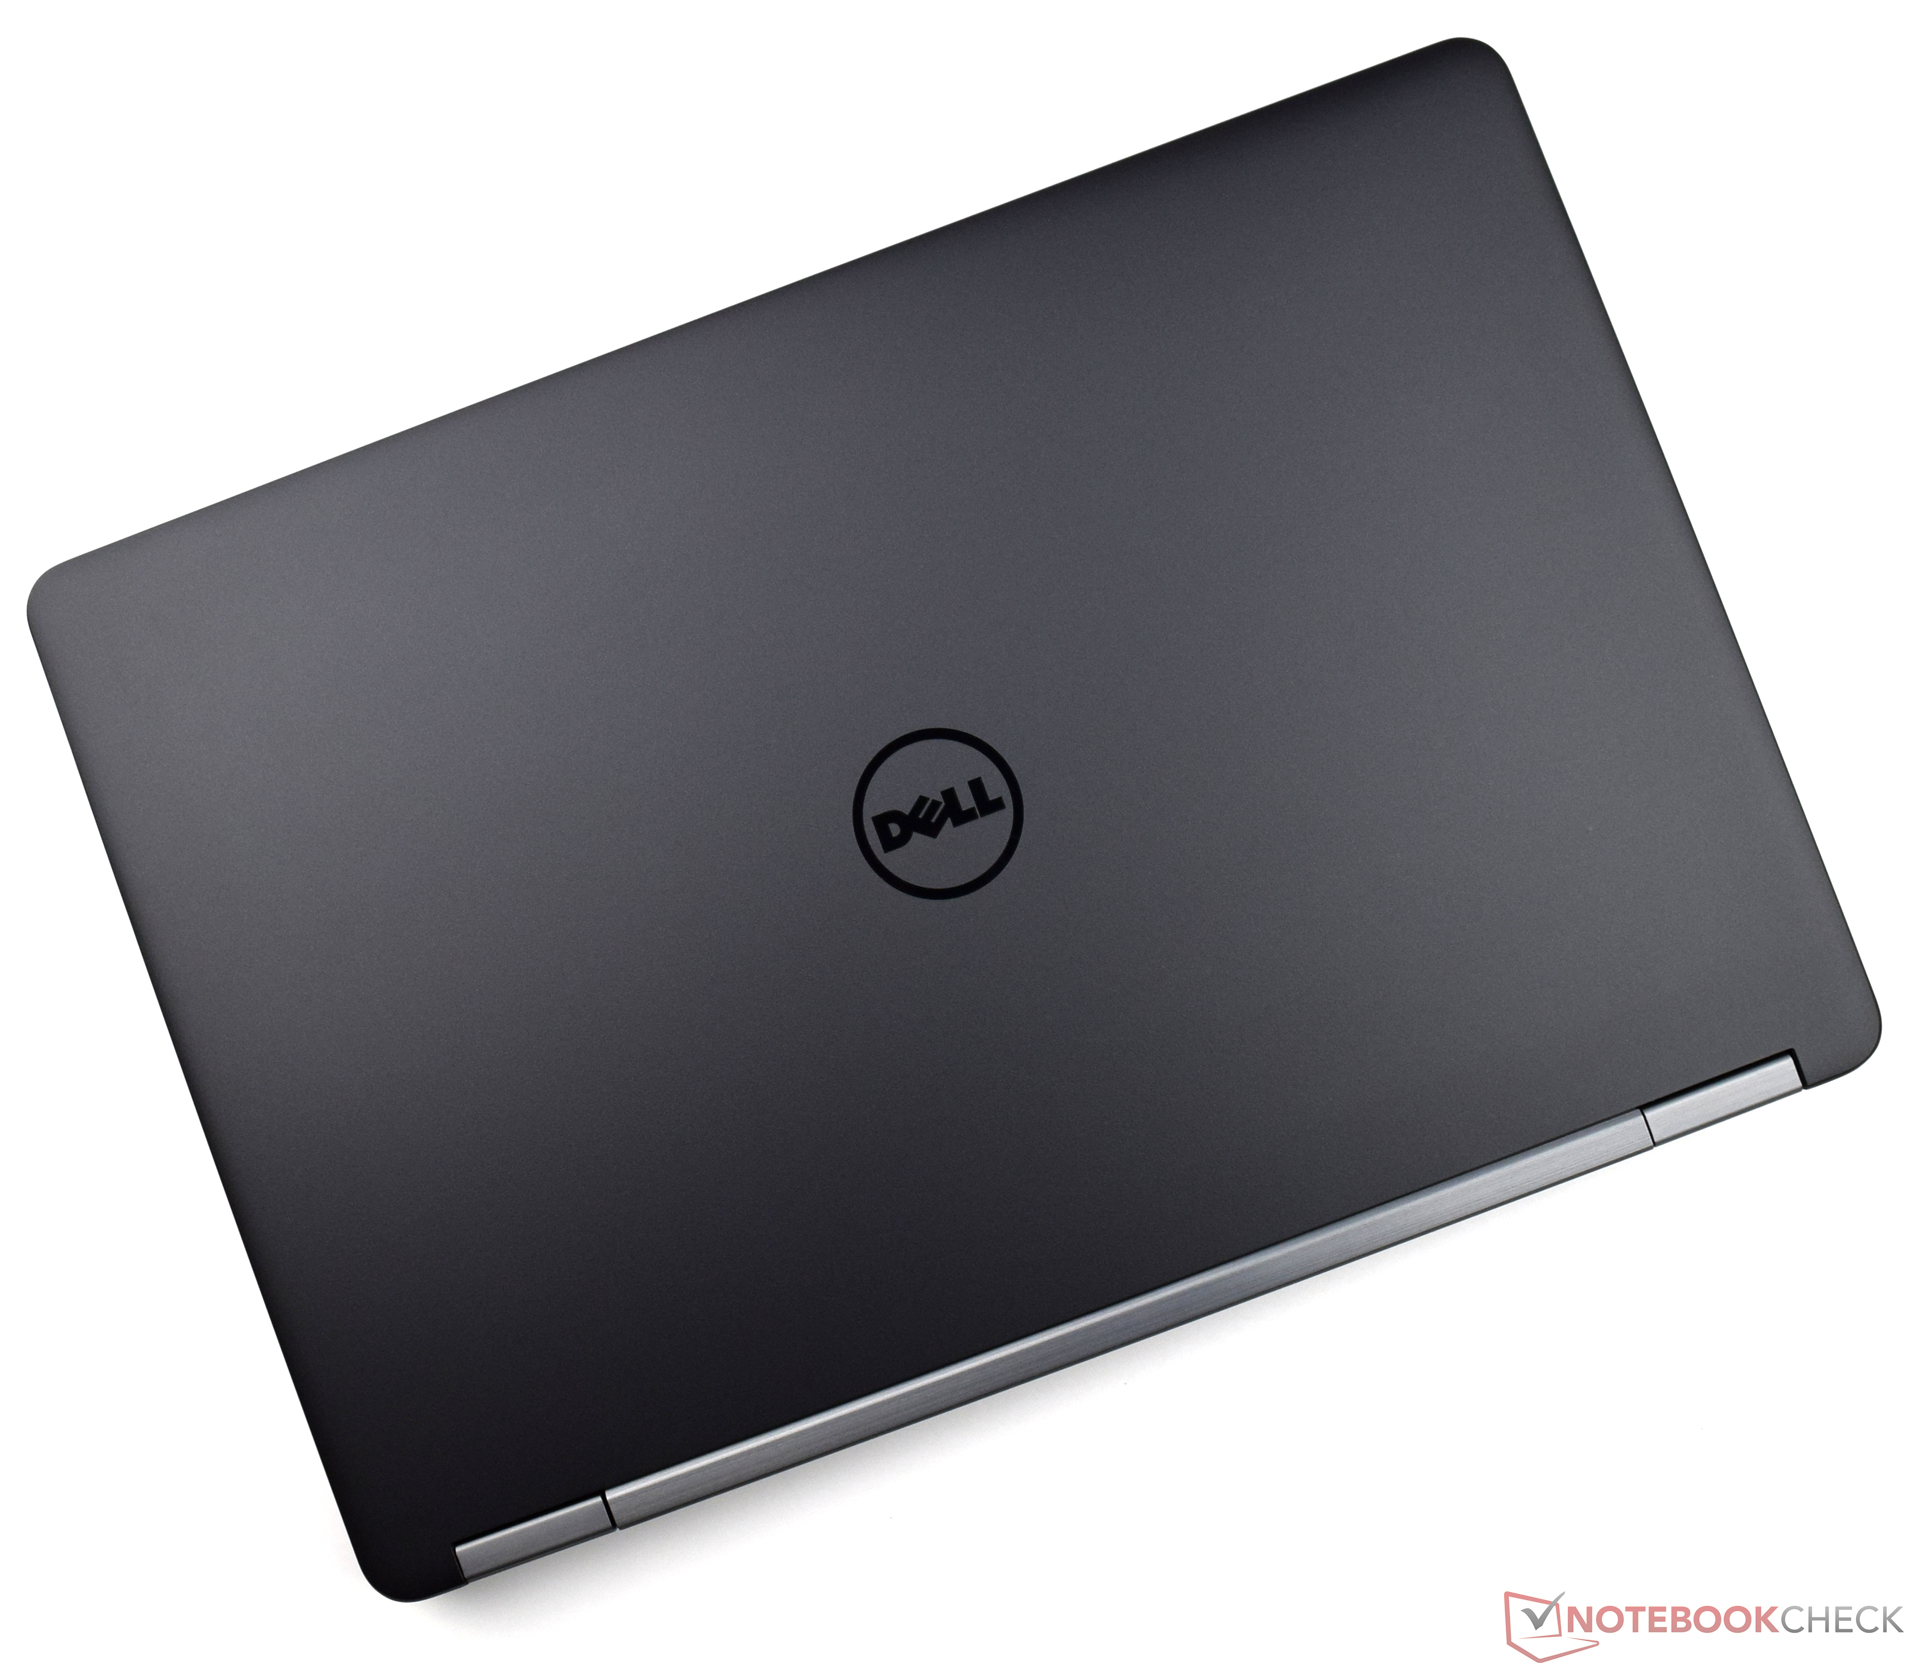
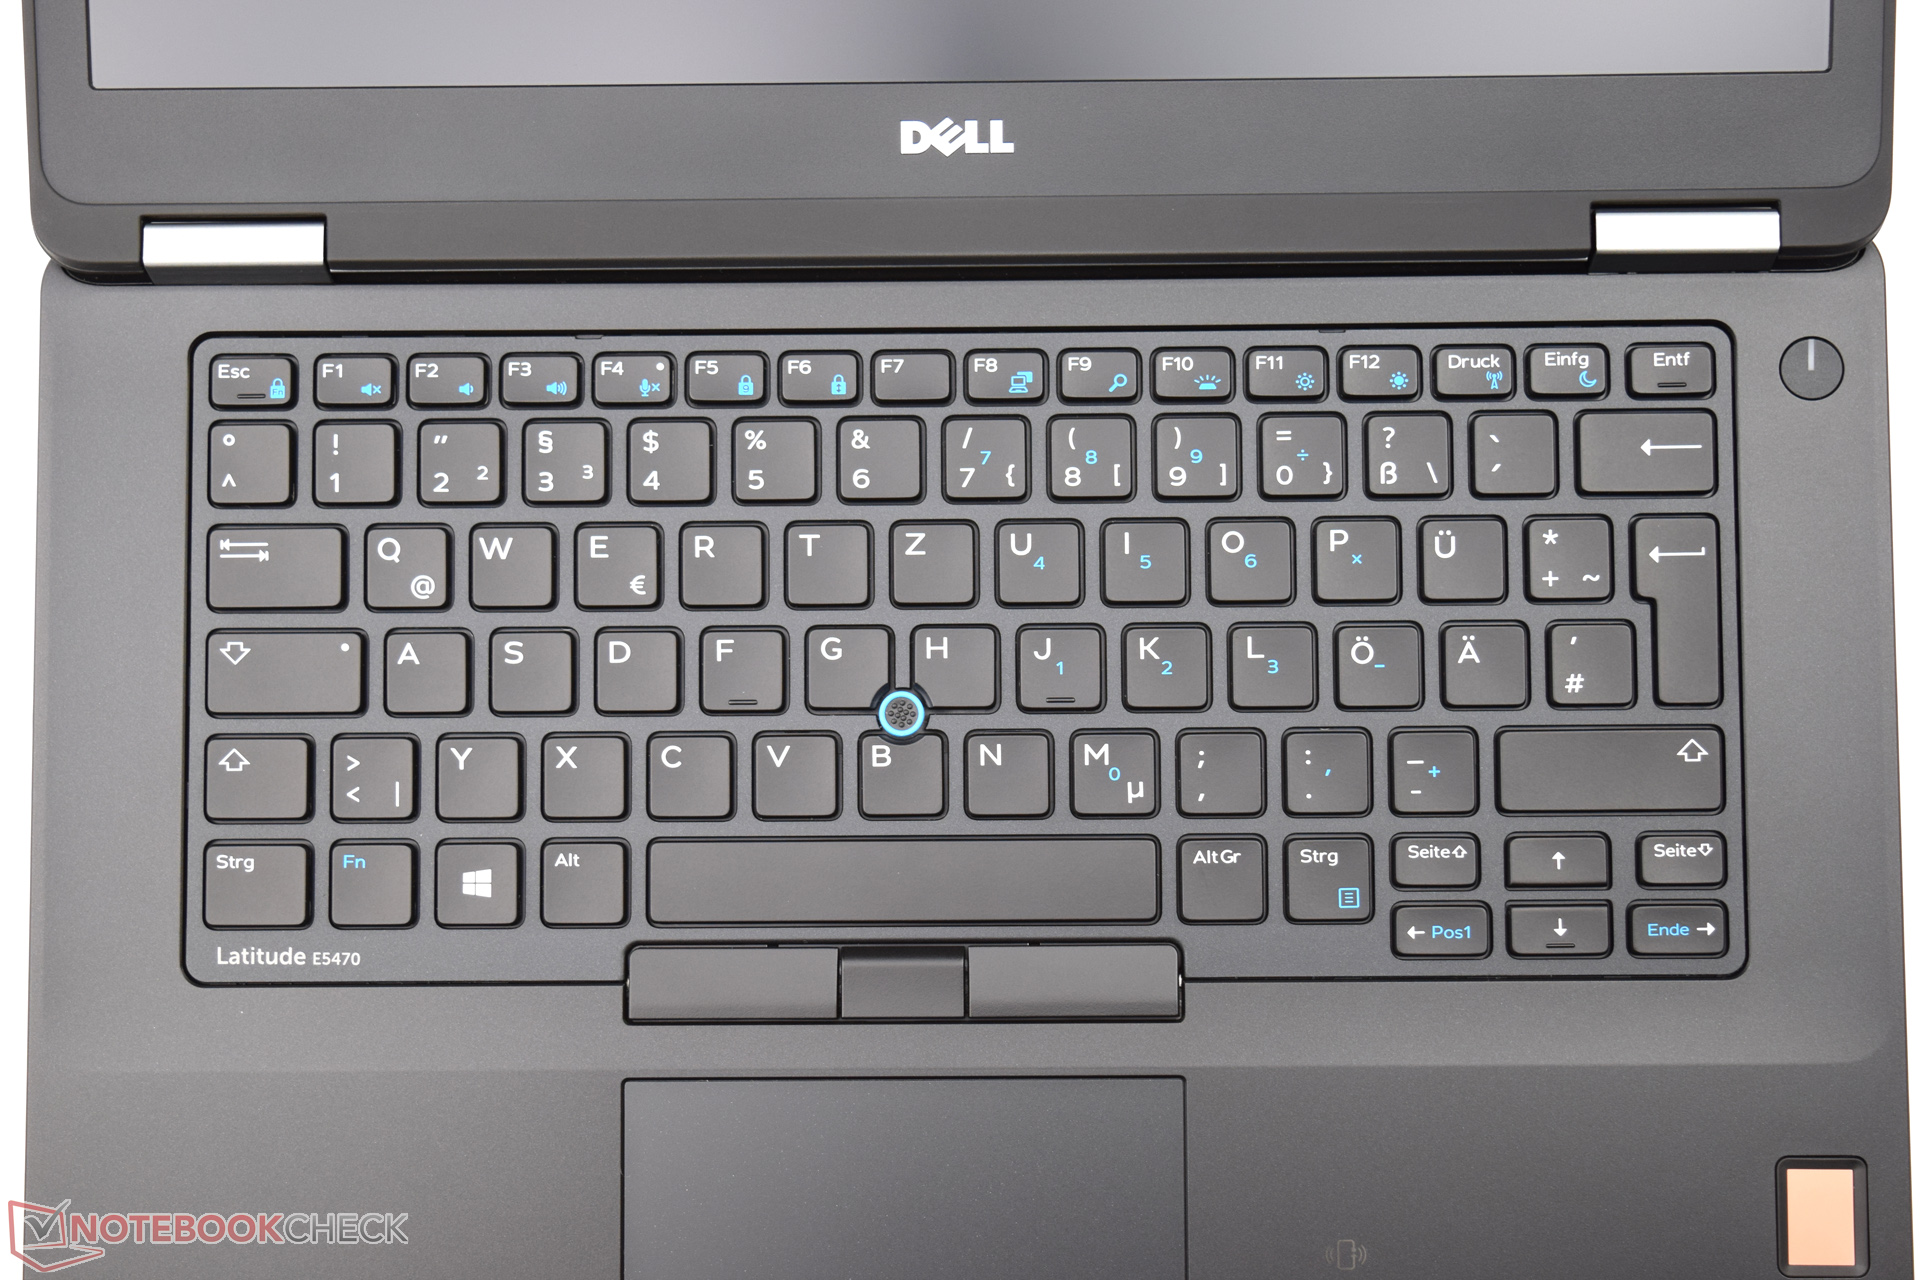
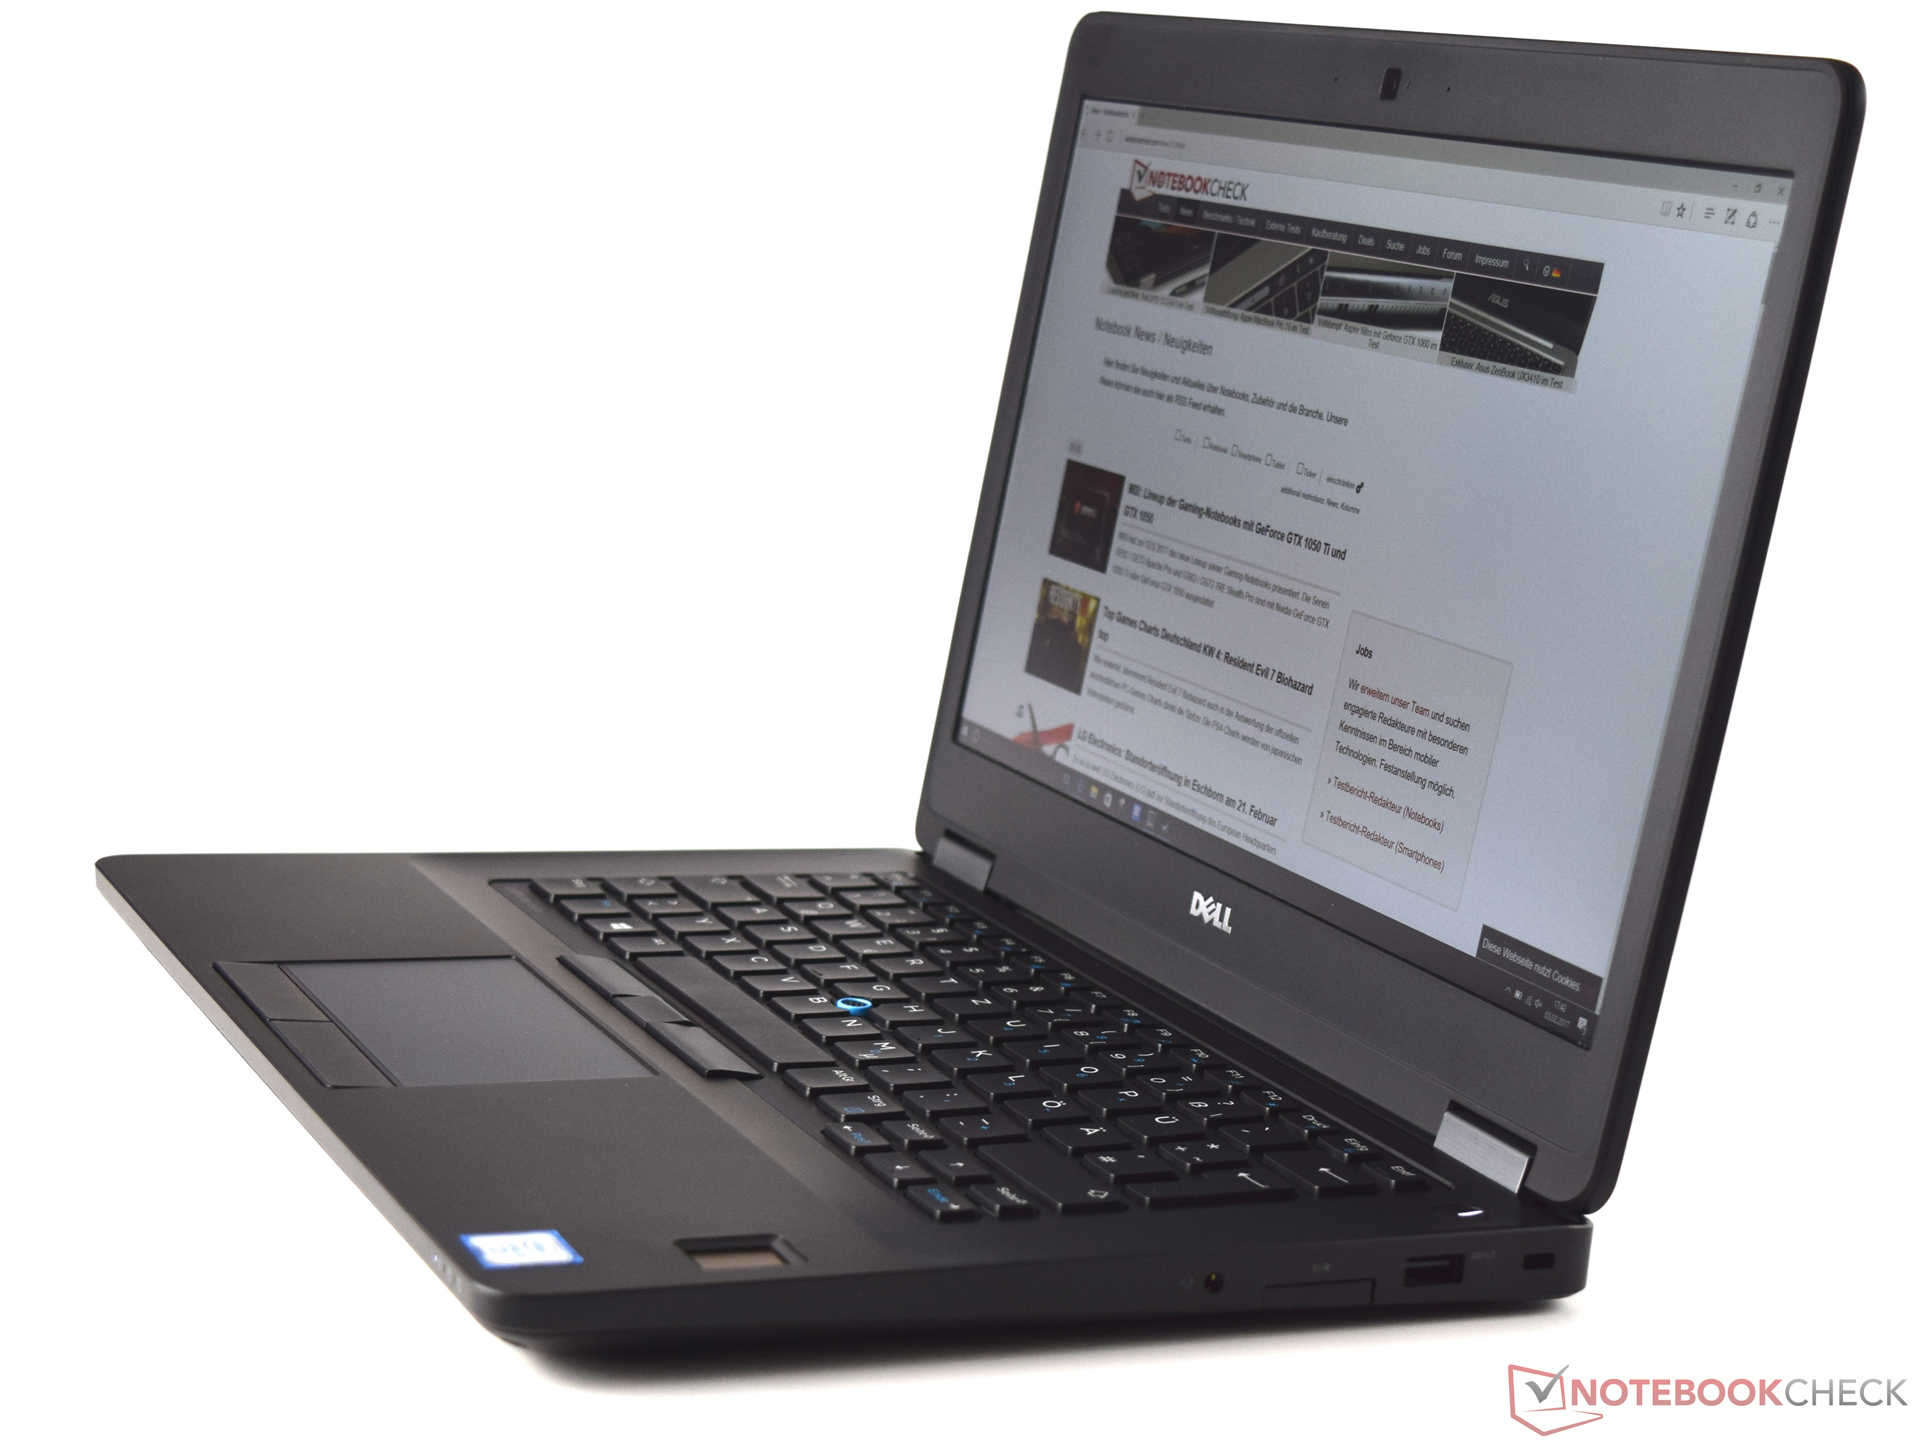
戴尔的Latitude 14 E5470凭借测试中的优秀系统性能让我们十分满意。它的输入设备,坚固美观的机身和高品质工艺都可以保证较长的使用寿命。完备的安全功能和实用的配件也可以让办公更佳便捷。
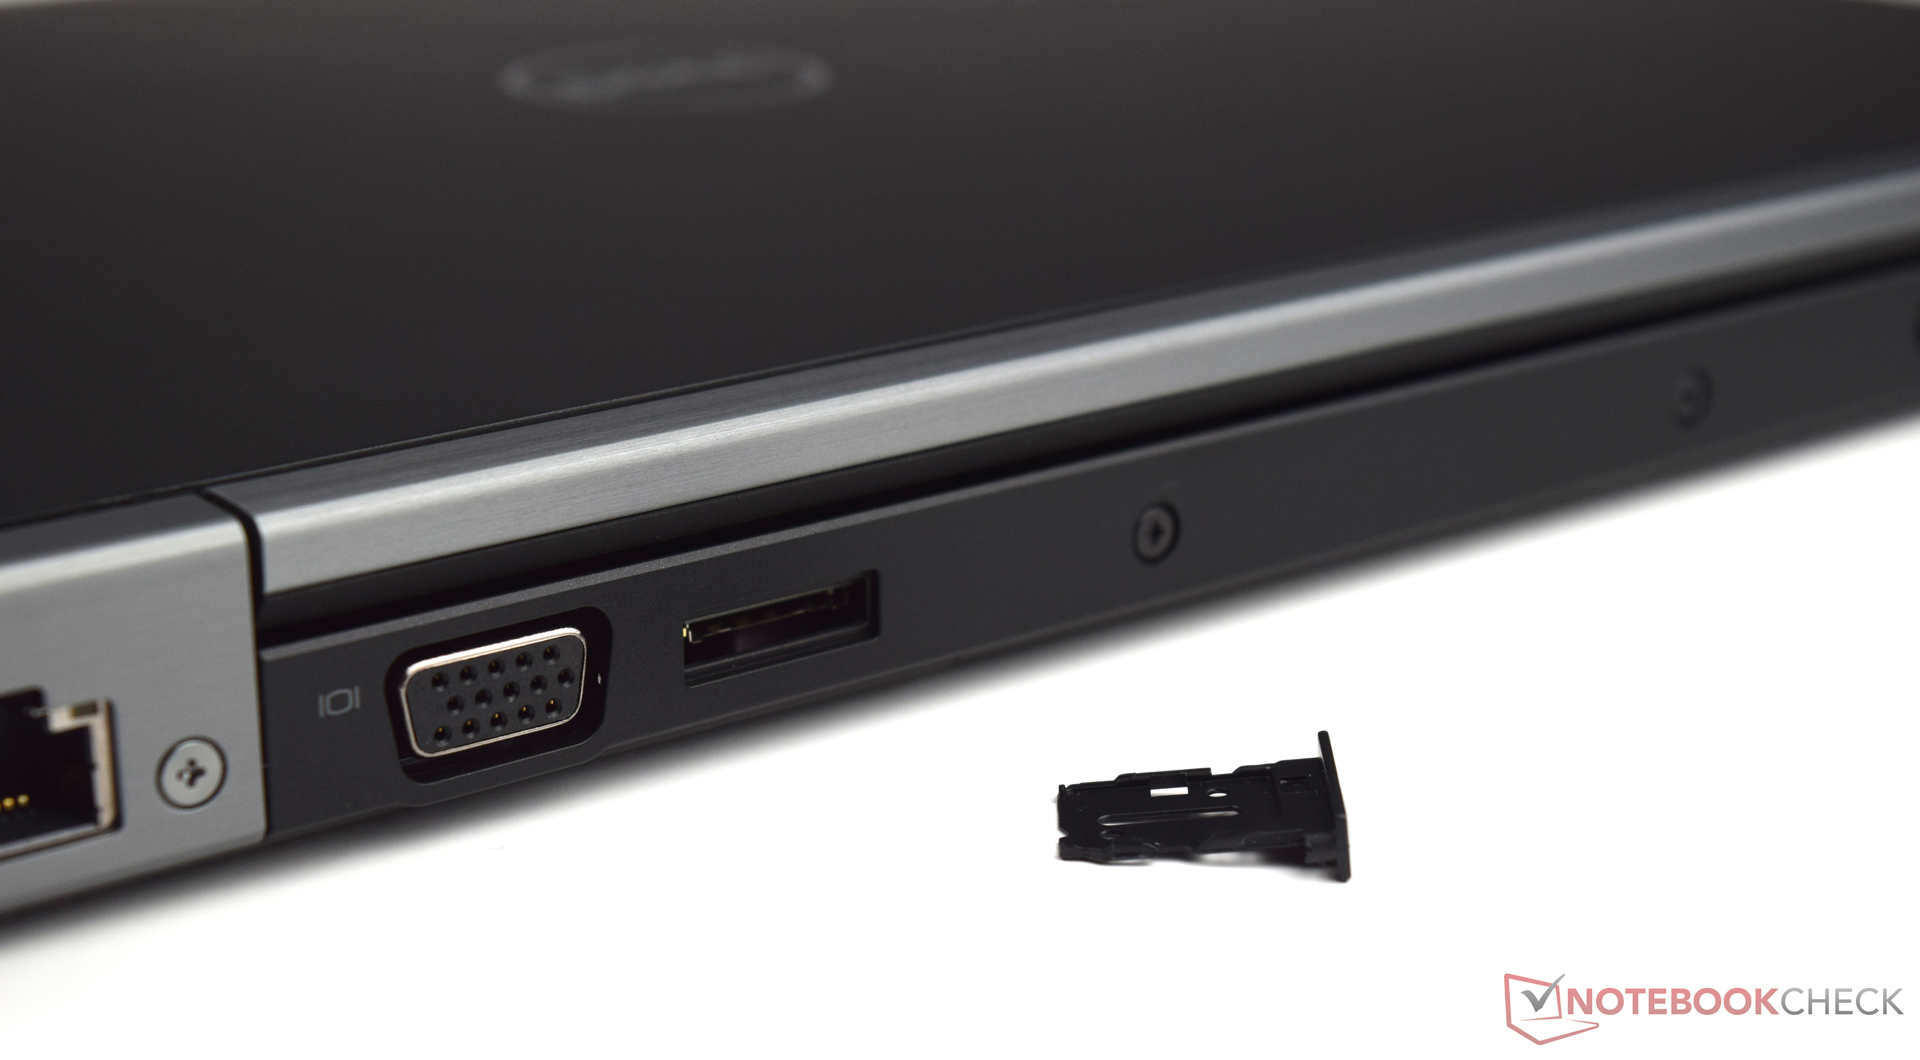
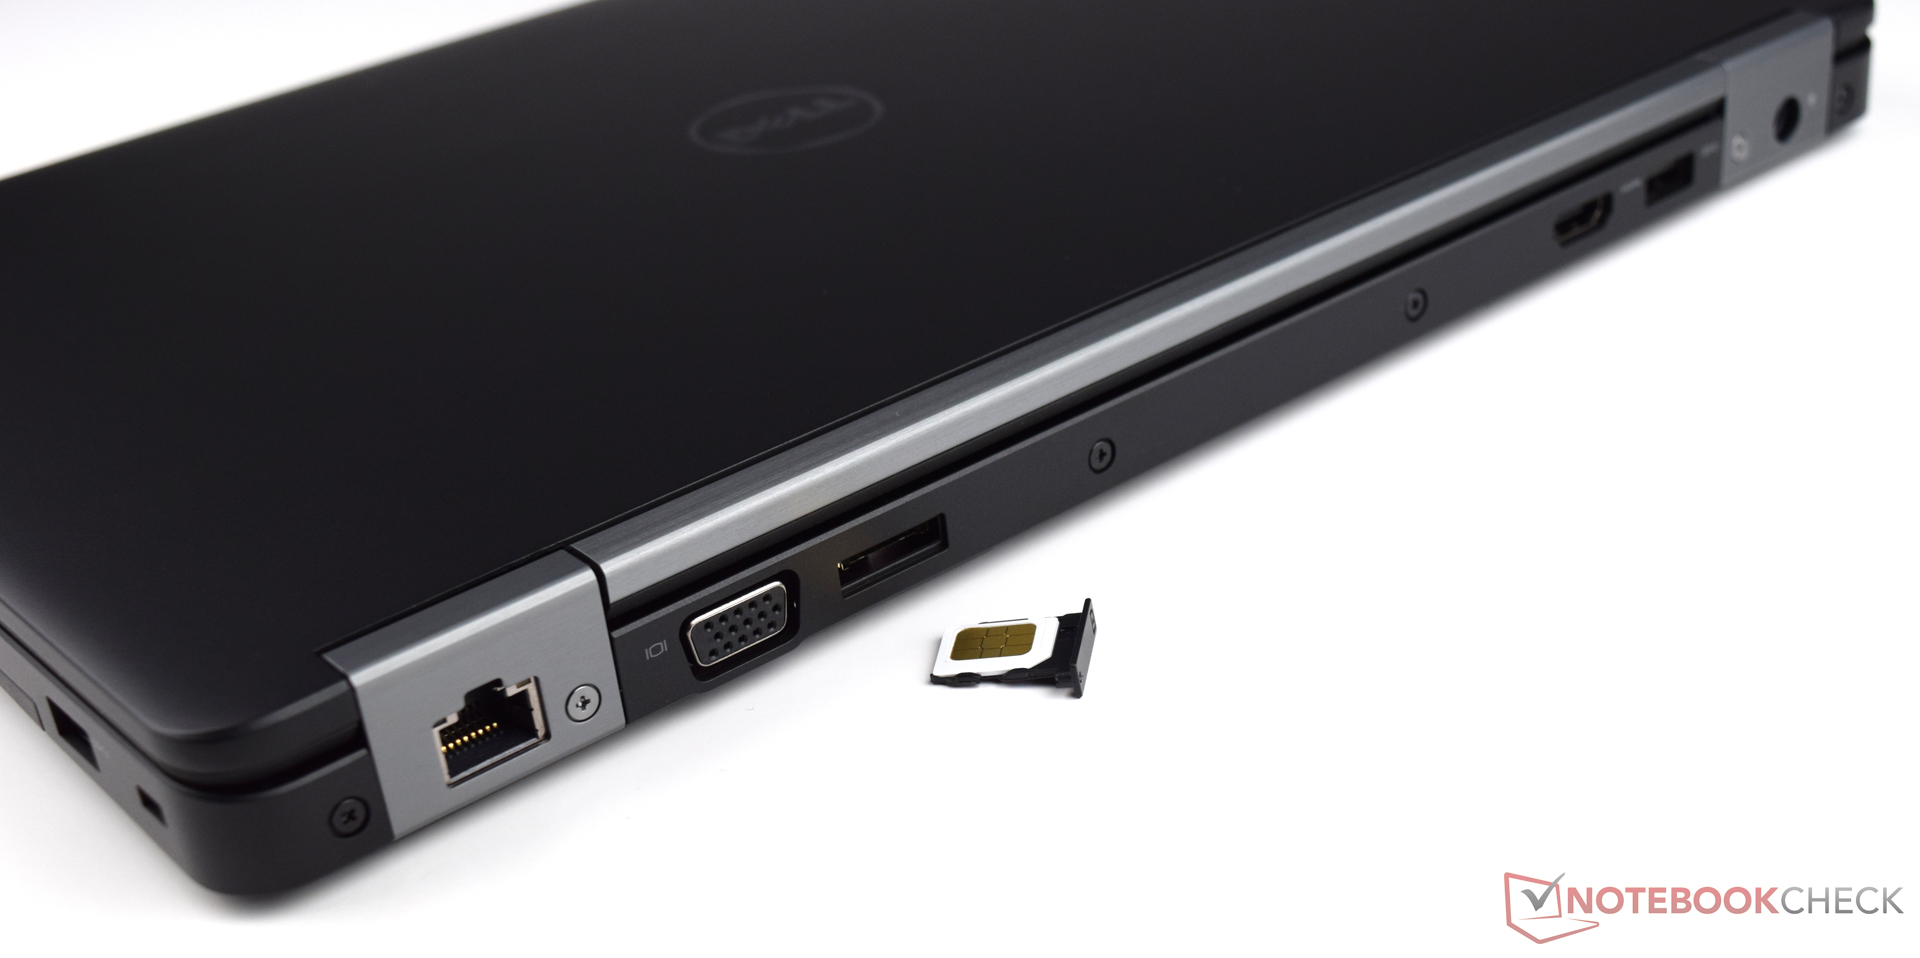
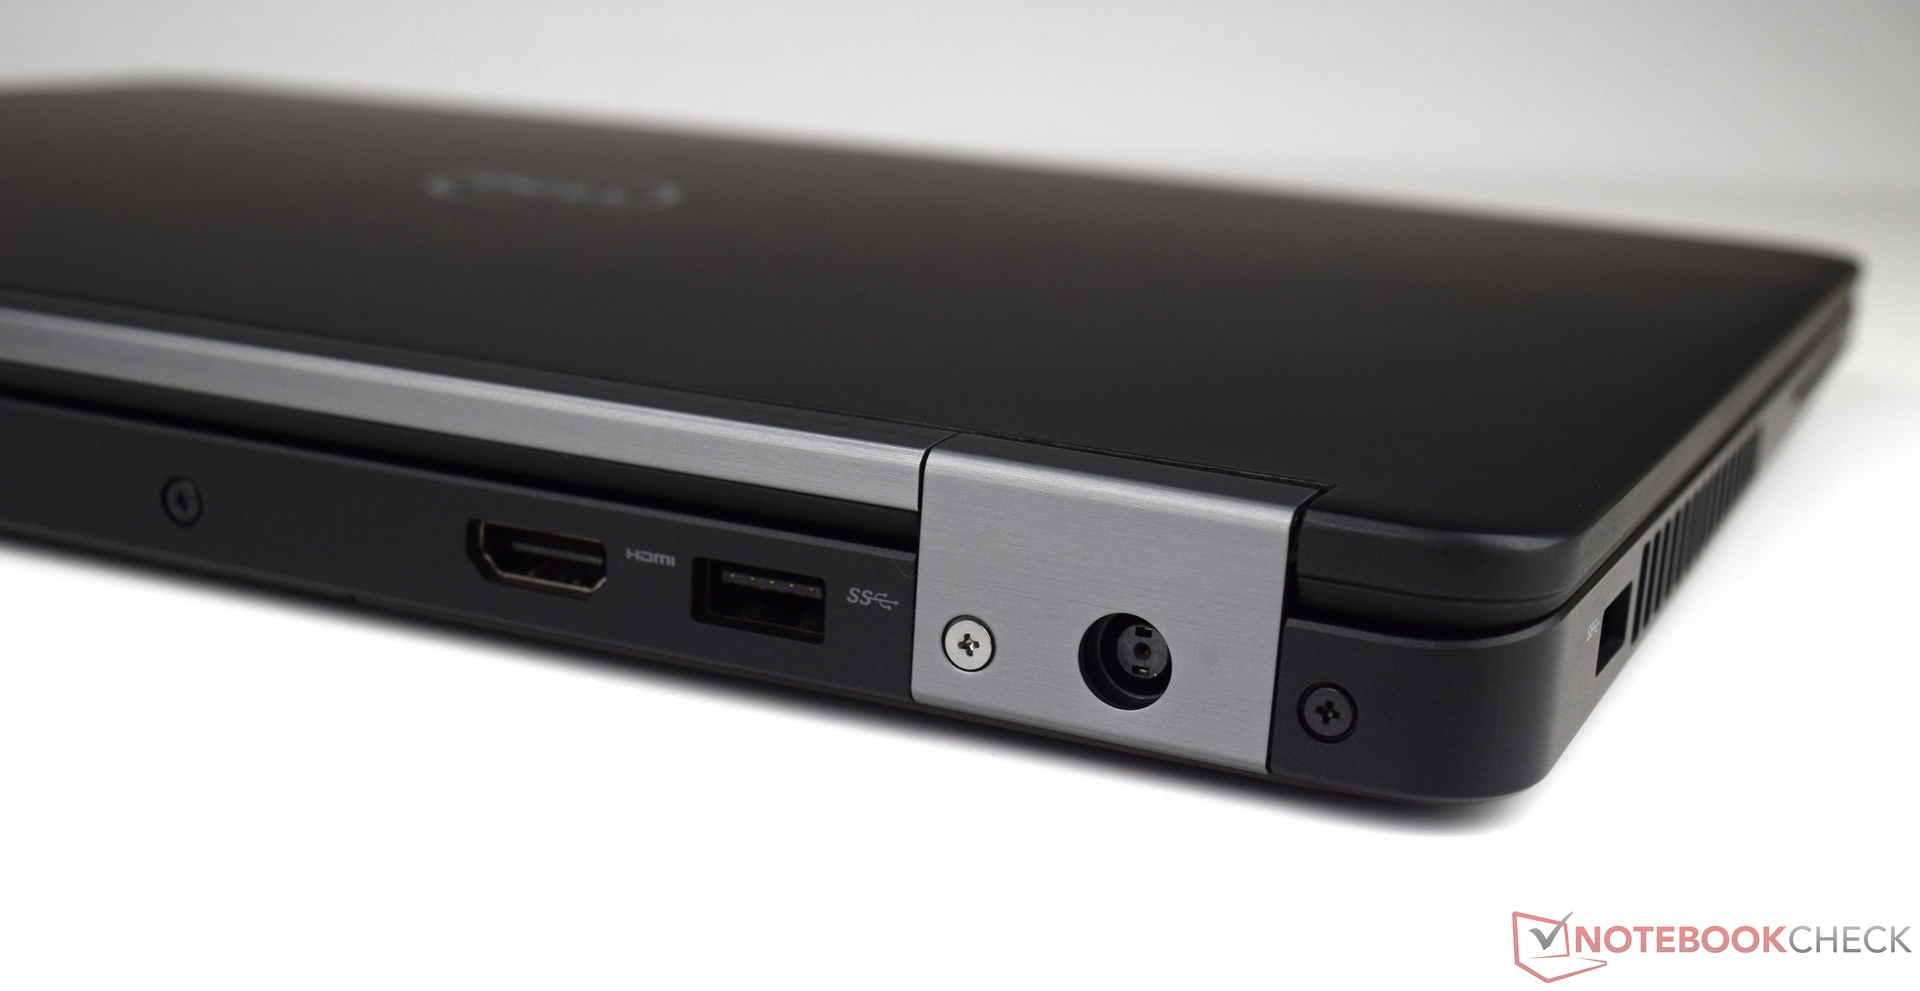
戴尔的Latitude 14 E5470并没有让我们有很多可以挑剔的地方,不过我们还是希望它至少可以提供一个USB-C第二代接口,保证与未来设备的兼容。它屏幕面板的选择十分成功,不过在这个价位上它的对比度还是相对较低。
不过我们仍然可以为需要一台每日商务办公设备的用户由衷推荐戴尔Latitude 14 E5470。它完备的安全功能带来了加分,可能会成为是否值得选择的关键因素。
注:本文是基于完整评测的缩减版本,阅读完整的英文评测,请点击这里。
Dell Latitude 14 E5470
- 02/10/2017 v6 (old)
Sebastian Bade