戴尔 Latitude 14 3470 笔记本电脑简短评测
| SD Card Reader | |
| average JPG Copy Test (av. of 3 runs) | |
| Dell Latitude 12 E7270 | |
| Lenovo ThinkPad E460-20EUS00000 | |
| HP ProBook 440 G3 | |
| Lenovo ThinkPad L460-20FVS01400 | |
| Dell Latitude 14 3470 | |
| maximum AS SSD Seq Read Test (1GB) | |
| Dell Latitude 12 E7270 | |
| HP ProBook 440 G3 | |
| Lenovo ThinkPad E460-20EUS00000 | |
| Lenovo ThinkPad L460-20FVS01400 | |
| Dell Latitude 14 3470 | |
| Networking | |
| iperf Server (receive) TCP 1 m | |
| Dell Latitude 14 3470 | |
| iperf Client (transmit) TCP 1 m | |
| Dell Latitude 14 3470 | |
| |||||||||||||||||||||||||
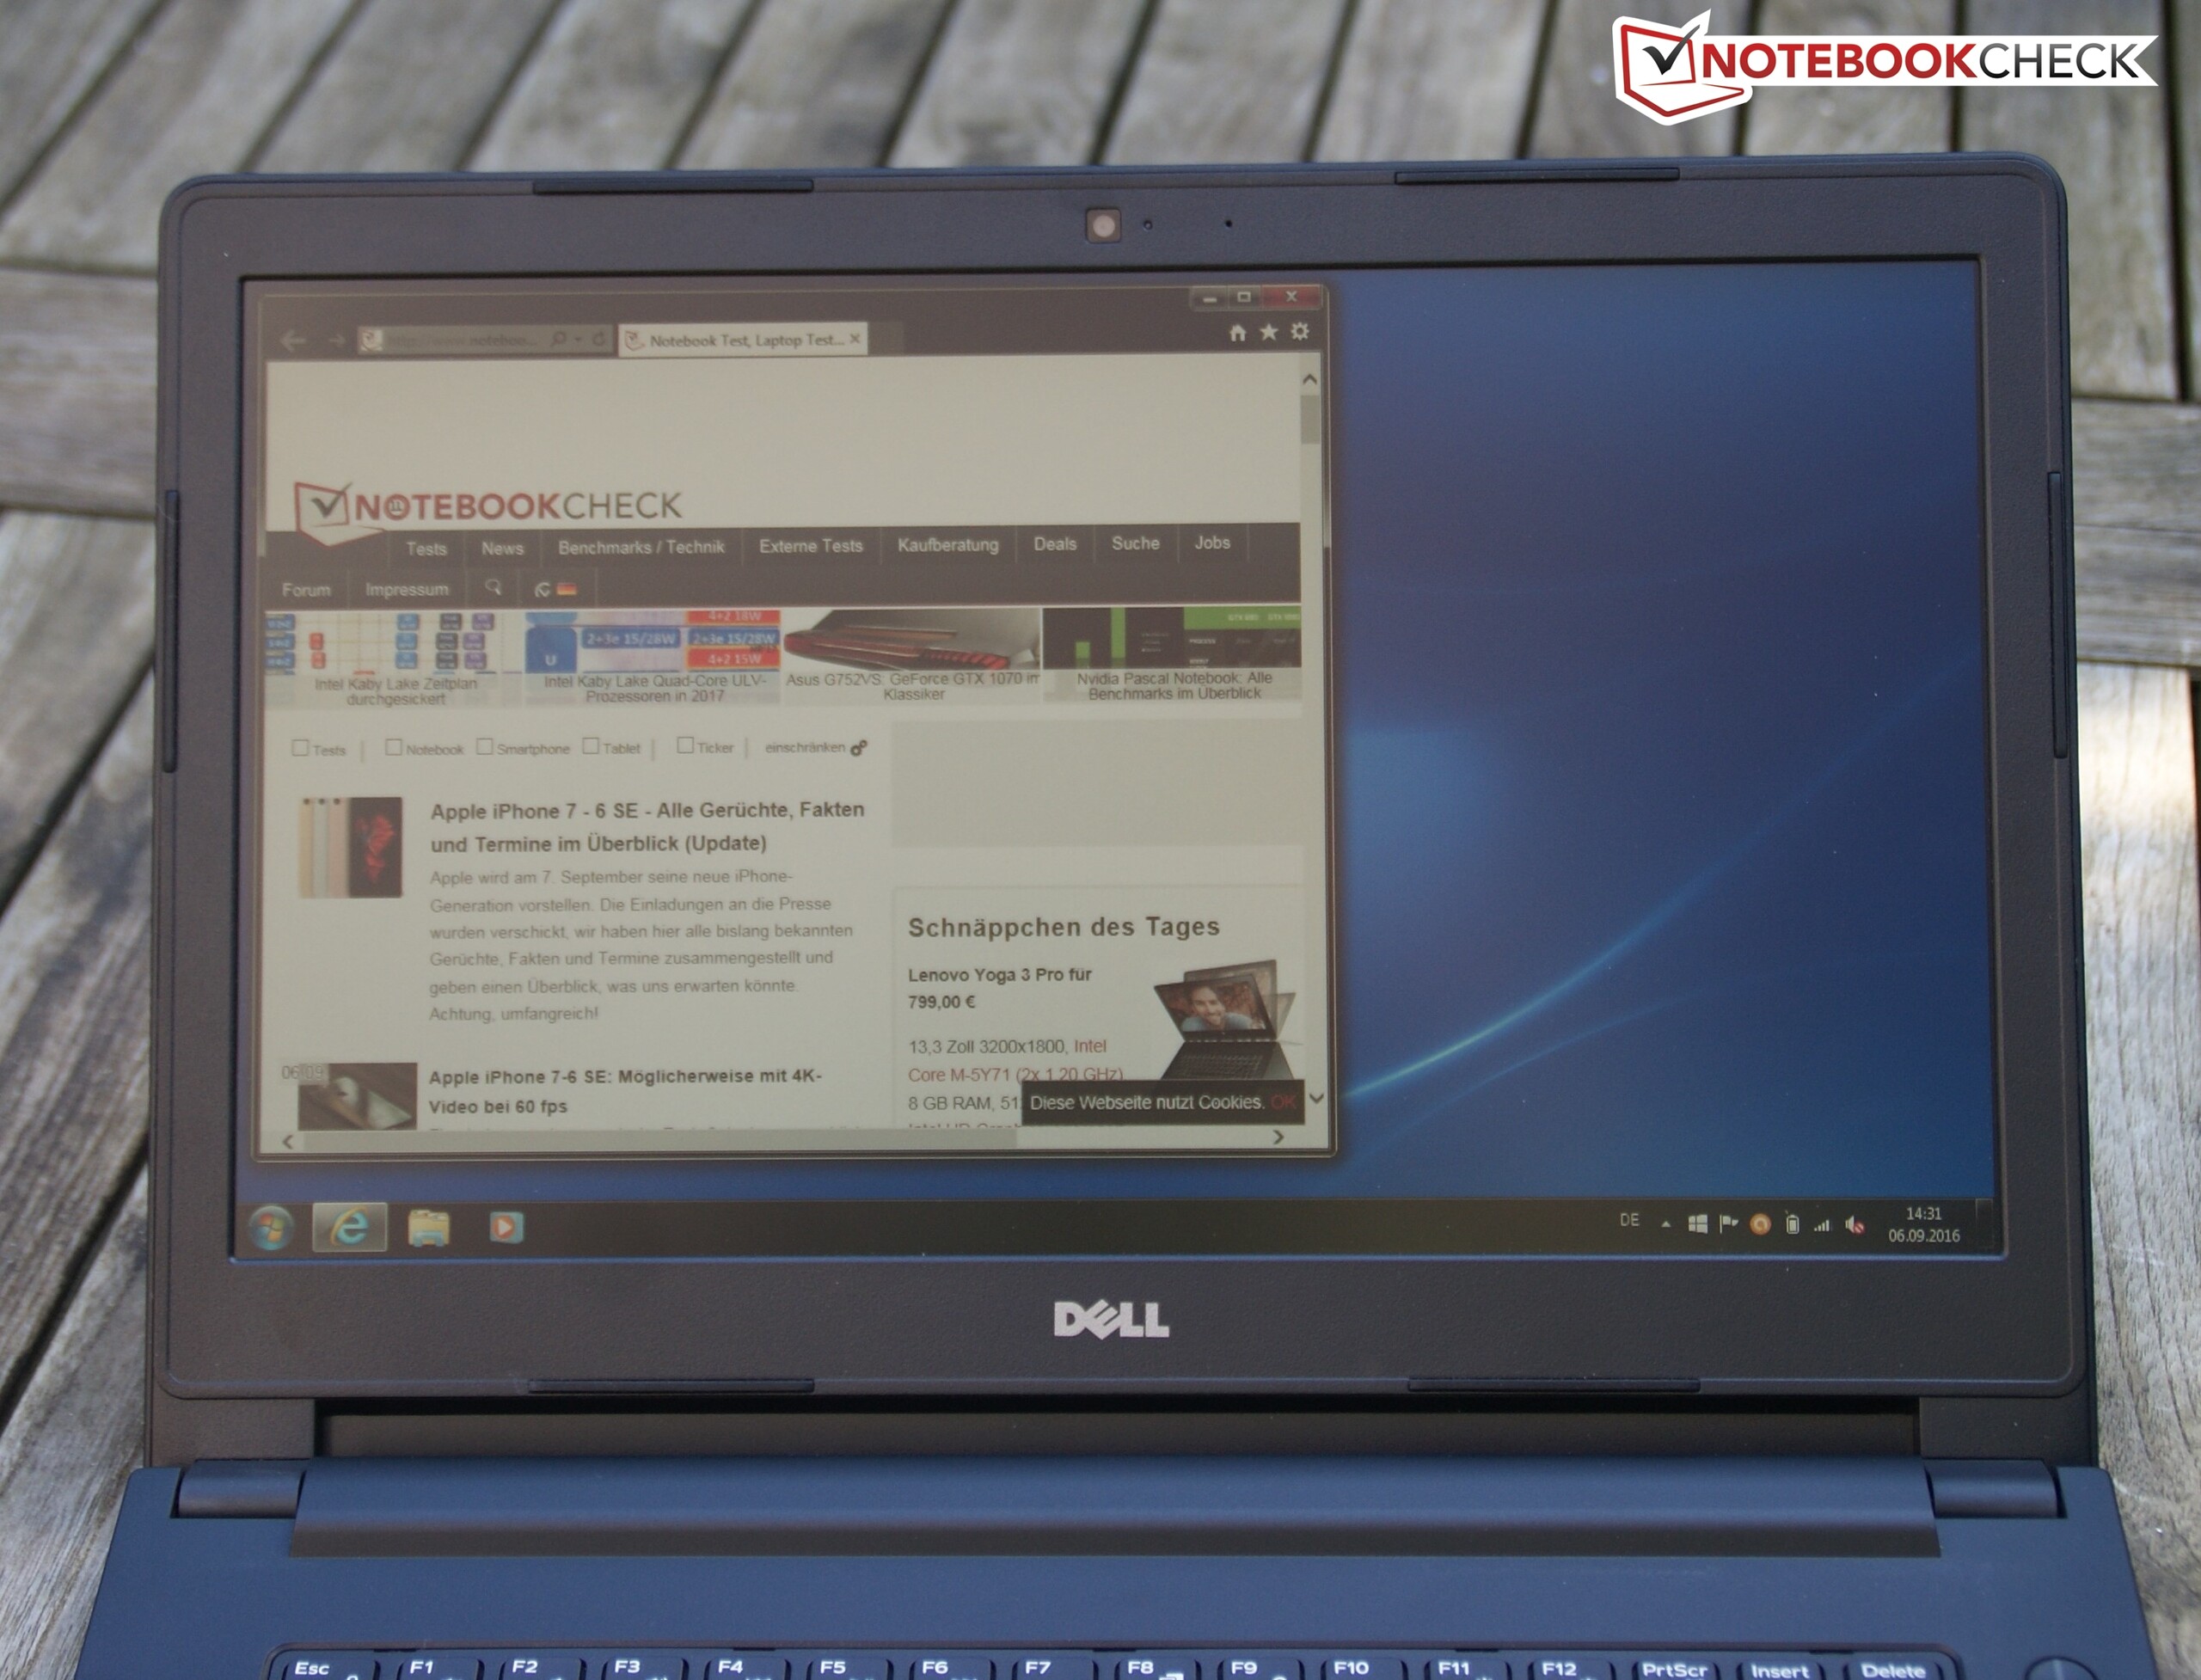
Brightness Distribution: 87 %
Center on Battery: 206 cd/m²
Contrast: 429:1 (Black: 0.48 cd/m²)
ΔE ColorChecker Calman: 11 | ∀{0.5-29.43 Ø4.73}
ΔE Greyscale Calman: 11.51 | ∀{0.09-98 Ø4.97}
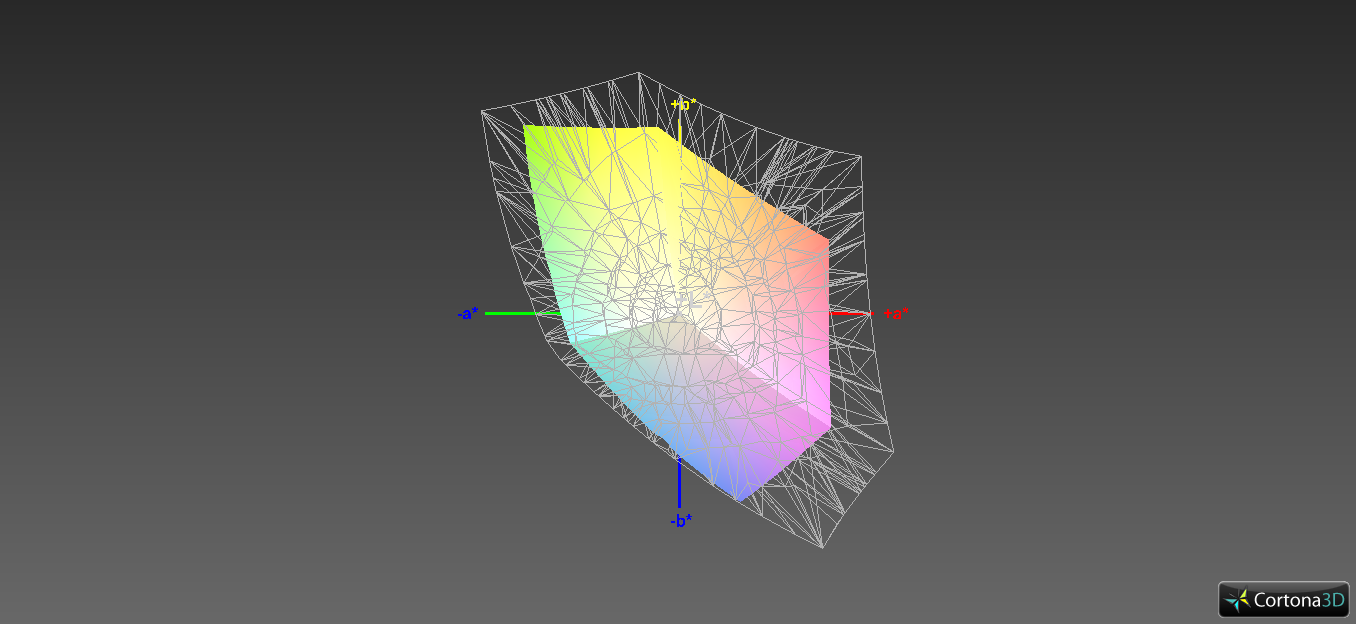
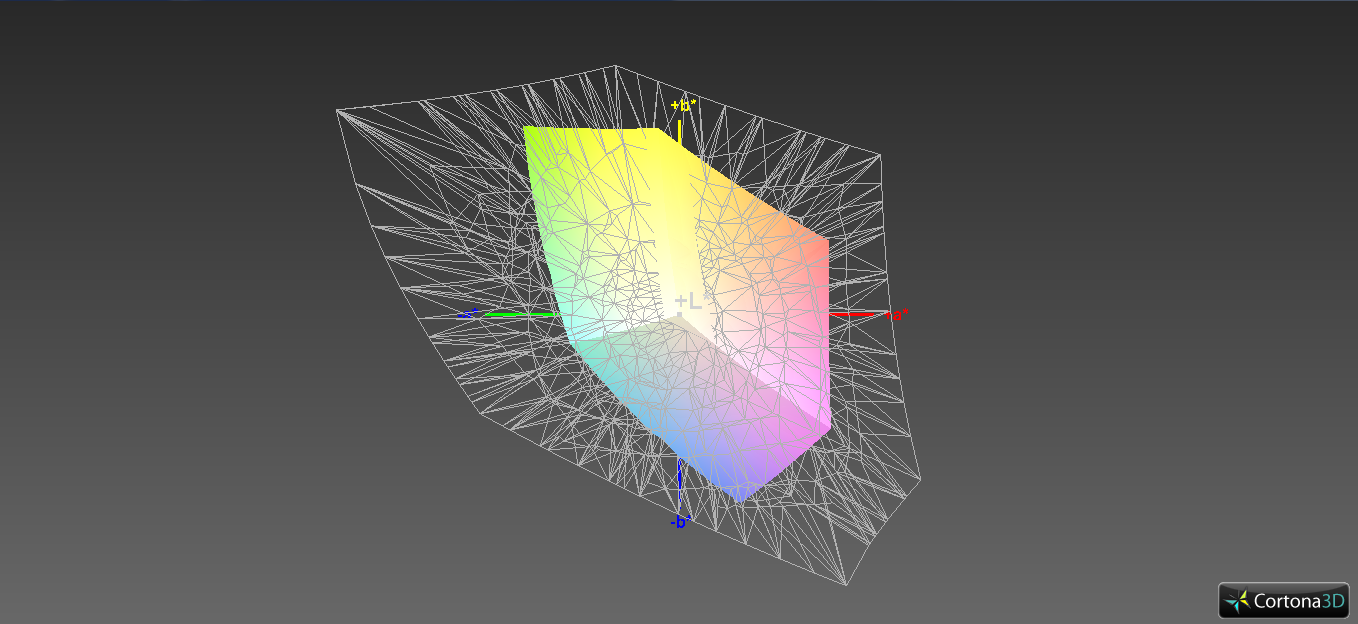
60.61% sRGB (Argyll 1.6.3 3D)
38.46% AdobeRGB 1998 (Argyll 1.6.3 3D)
41.55% AdobeRGB 1998 (Argyll 3D)
60.5% sRGB (Argyll 3D)
40.21% Display P3 (Argyll 3D)
Gamma: 2.23
CCT: 13671 K
| Dell Latitude 14 3470 Innolux N140BGE, TN LED, 1366x768, 14" | Lenovo ThinkPad L460-20FVS01400 Lenovo N140HCE-EAA, IPS, 1920x1080, 14" | Lenovo ThinkPad E460-20EUS00000 LG LP140WF6-SPB2, IPS-Panel, 1920x1080, 14" | HP ProBook 440 G3 Chi Mei CMN14A7, TN, 1920x1080, 14" | HP EliteBook Folio 1040 G3 AUO1136, IPS, 2560x1440, 14" | |
|---|---|---|---|---|---|
| Display | 4% | -3% | -2% | 66% | |
| Display P3 Coverage (%) | 40.21 | 42.2 5% | 39.1 -3% | 39.6 -2% | 67.9 69% |
| sRGB Coverage (%) | 60.5 | 62.3 3% | 58.8 -3% | 59.1 -2% | 96.8 60% |
| AdobeRGB 1998 Coverage (%) | 41.55 | 43.72 5% | 40.41 -3% | 40.94 -1% | 70 68% |
| Response Times | -4% | 13% | -2% | -1% | |
| Response Time Grey 50% / Grey 80% * (ms) | 47 ? | 44.4 ? 6% | 40 ? 15% | 46 ? 2% | 46.4 ? 1% |
| Response Time Black / White * (ms) | 26 ? | 29.6 ? -14% | 23.2 ? 11% | 27.6 ? -6% | 26.4 ? -2% |
| PWM Frequency (Hz) | |||||
| Screen | 32% | 30% | 8% | 57% | |
| Brightness middle (cd/m²) | 206 | 245 19% | 233 13% | 246 19% | 327 59% |
| Brightness (cd/m²) | 193 | 225 17% | 221 15% | 215 11% | 316 64% |
| Brightness Distribution (%) | 87 | 83 -5% | 88 1% | 84 -3% | 87 0% |
| Black Level * (cd/m²) | 0.48 | 0.24 50% | 0.3 37% | 0.5 -4% | 0.35 27% |
| Contrast (:1) | 429 | 1021 138% | 777 81% | 492 15% | 934 118% |
| Colorchecker dE 2000 * | 11 | 6.89 37% | 4.43 60% | 8.6 22% | 4.39 60% |
| Colorchecker dE 2000 max. * | 19.57 | 17.62 10% | 7.27 63% | ||
| Greyscale dE 2000 * | 11.51 | 6.45 44% | 3.78 67% | 9.36 19% | 4.69 59% |
| Gamma | 2.23 99% | 2.46 89% | 2.31 95% | 2.39 92% | 2.15 102% |
| CCT | 13671 48% | 6857 95% | 7171 91% | 11226 58% | 7101 92% |
| Color Space (Percent of AdobeRGB 1998) (%) | 38.46 | 40.1 4% | 37.3 -3% | 37.8 -2% | 62.52 63% |
| Color Space (Percent of sRGB) (%) | 60.61 | 61.8 2% | 58.7 -3% | 59.1 -2% | 96.71 60% |
| Total Average (Program / Settings) | 11% /
21% | 13% /
20% | 1% /
5% | 41% /
51% |
* ... smaller is better
Display Response Times
| ↔ Response Time Black to White | ||
|---|---|---|
| 26 ms ... rise ↗ and fall ↘ combined | ↗ 18 ms rise | 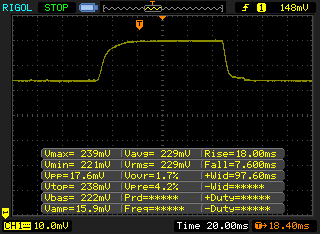 |
| ↘ 8 ms fall | ||
| The screen shows relatively slow response rates in our tests and may be too slow for gamers. In comparison, all tested devices range from 0.1 (minimum) to 240 (maximum) ms. » 62 % of all devices are better. This means that the measured response time is worse than the average of all tested devices (19.9 ms). | ||
| ↔ Response Time 50% Grey to 80% Grey | ||
| 47 ms ... rise ↗ and fall ↘ combined | ↗ 25 ms rise | 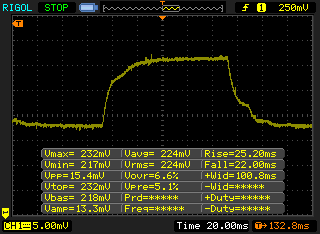 |
| ↘ 22 ms fall | ||
| The screen shows slow response rates in our tests and will be unsatisfactory for gamers. In comparison, all tested devices range from 0.165 (minimum) to 636 (maximum) ms. » 81 % of all devices are better. This means that the measured response time is worse than the average of all tested devices (31.1 ms). | ||
Screen Flickering / PWM (Pulse-Width Modulation)
| Screen flickering / PWM not detected | ||
In comparison: 52 % of all tested devices do not use PWM to dim the display. If PWM was detected, an average of 7791 (minimum: 5 - maximum: 343500) Hz was measured. | ||
| PCMark 8 | |
| Home Score Accelerated v2 | |
| Lenovo ThinkPad E460-20EUS00000 | |
| Lenovo ThinkPad L460-20FVS01400 | |
| Dell Latitude 14 3470 | |
| HP ProBook 440 G3 | |
| Work Score Accelerated v2 | |
| Lenovo ThinkPad L460-20FVS01400 | |
| Lenovo ThinkPad E460-20EUS00000 | |
| Dell Latitude 14 3470 | |
| HP ProBook 440 G3 | |
| PCMark 8 Home Score Accelerated v2 | 3074 points | |
| PCMark 8 Work Score Accelerated v2 | 3982 points | |
Help | ||
| Dell Latitude 14 3470 Toshiba MQ01ACF050 | Lenovo ThinkPad L460-20FVS01400 Toshiba HG6 THNSFJ256GCSU | Lenovo ThinkPad E460-20EUS00000 Samsung CM871 MZ7LF192HCGS | HP ProBook 440 G3 Hitachi Travelstar Z7K500 HTS725050A7E630 | |
|---|---|---|---|---|
| CrystalDiskMark 3.0 | 12972% | 4431% | 39% | |
| Read Seq (MB/s) | 108.9 | 480.9 342% | 497.6 357% | 124.8 15% |
| Write Seq (MB/s) | 103.2 | 426.4 313% | 180 74% | 123.6 20% |
| Read 4k (MB/s) | 0.362 | 21.51 5842% | 18.91 5124% | 0.559 54% |
| Write 4k (MB/s) | 0.946 | 71.5 7458% | 37.13 3825% | 1.277 35% |
| Read 4k QD32 (MB/s) | 0.721 | 277.6 38402% | 95.7 13173% | 1.179 64% |
| Write 4k QD32 (MB/s) | 0.901 | 230.4 25472% | 37.26 4035% | 1.304 45% |

| 3DMark 11 - 1280x720 Performance GPU | |
| Lenovo ThinkPad E460-20EUS00000 | |
| Lenovo ThinkPad L460-20FVS01400 | |
| HP ProBook 440 G3 | |
| Dell Latitude 14 3470 | |
| 3DMark | |
| 1280x720 Cloud Gate Standard Graphics | |
| HP ProBook 440 G3 | |
| Lenovo ThinkPad E460-20EUS00000 | |
| Dell Latitude 14 3470 | |
| Lenovo ThinkPad L460-20FVS01400 | |
| 1920x1080 Fire Strike Graphics | |
| Lenovo ThinkPad E460-20EUS00000 | |
| Lenovo ThinkPad L460-20FVS01400 | |
| HP ProBook 440 G3 | |
| Dell Latitude 14 3470 | |
| 3DMark 11 Performance | 1135 points | |
| 3DMark Cloud Gate Standard Score | 4181 points | |
| 3DMark Fire Strike Score | 536 points | |
Help | ||
| low | med. | high | ultra | |
|---|---|---|---|---|
| Total War: Rome II (2013) | 25.4 | 18.6 | ||
| Dirt Rally (2015) | 62.3 | 13.25 | ||
| Rise of the Tomb Raider (2016) | 7 |
Noise level
| Idle |
| 32.3 / 32.3 / 32.3 dB(A) |
| HDD |
| 32.9 dB(A) |
| Load |
| 33.3 / 33.4 dB(A) |
 | ||
30 dB silent 40 dB(A) audible 50 dB(A) loud |
||
min: | ||
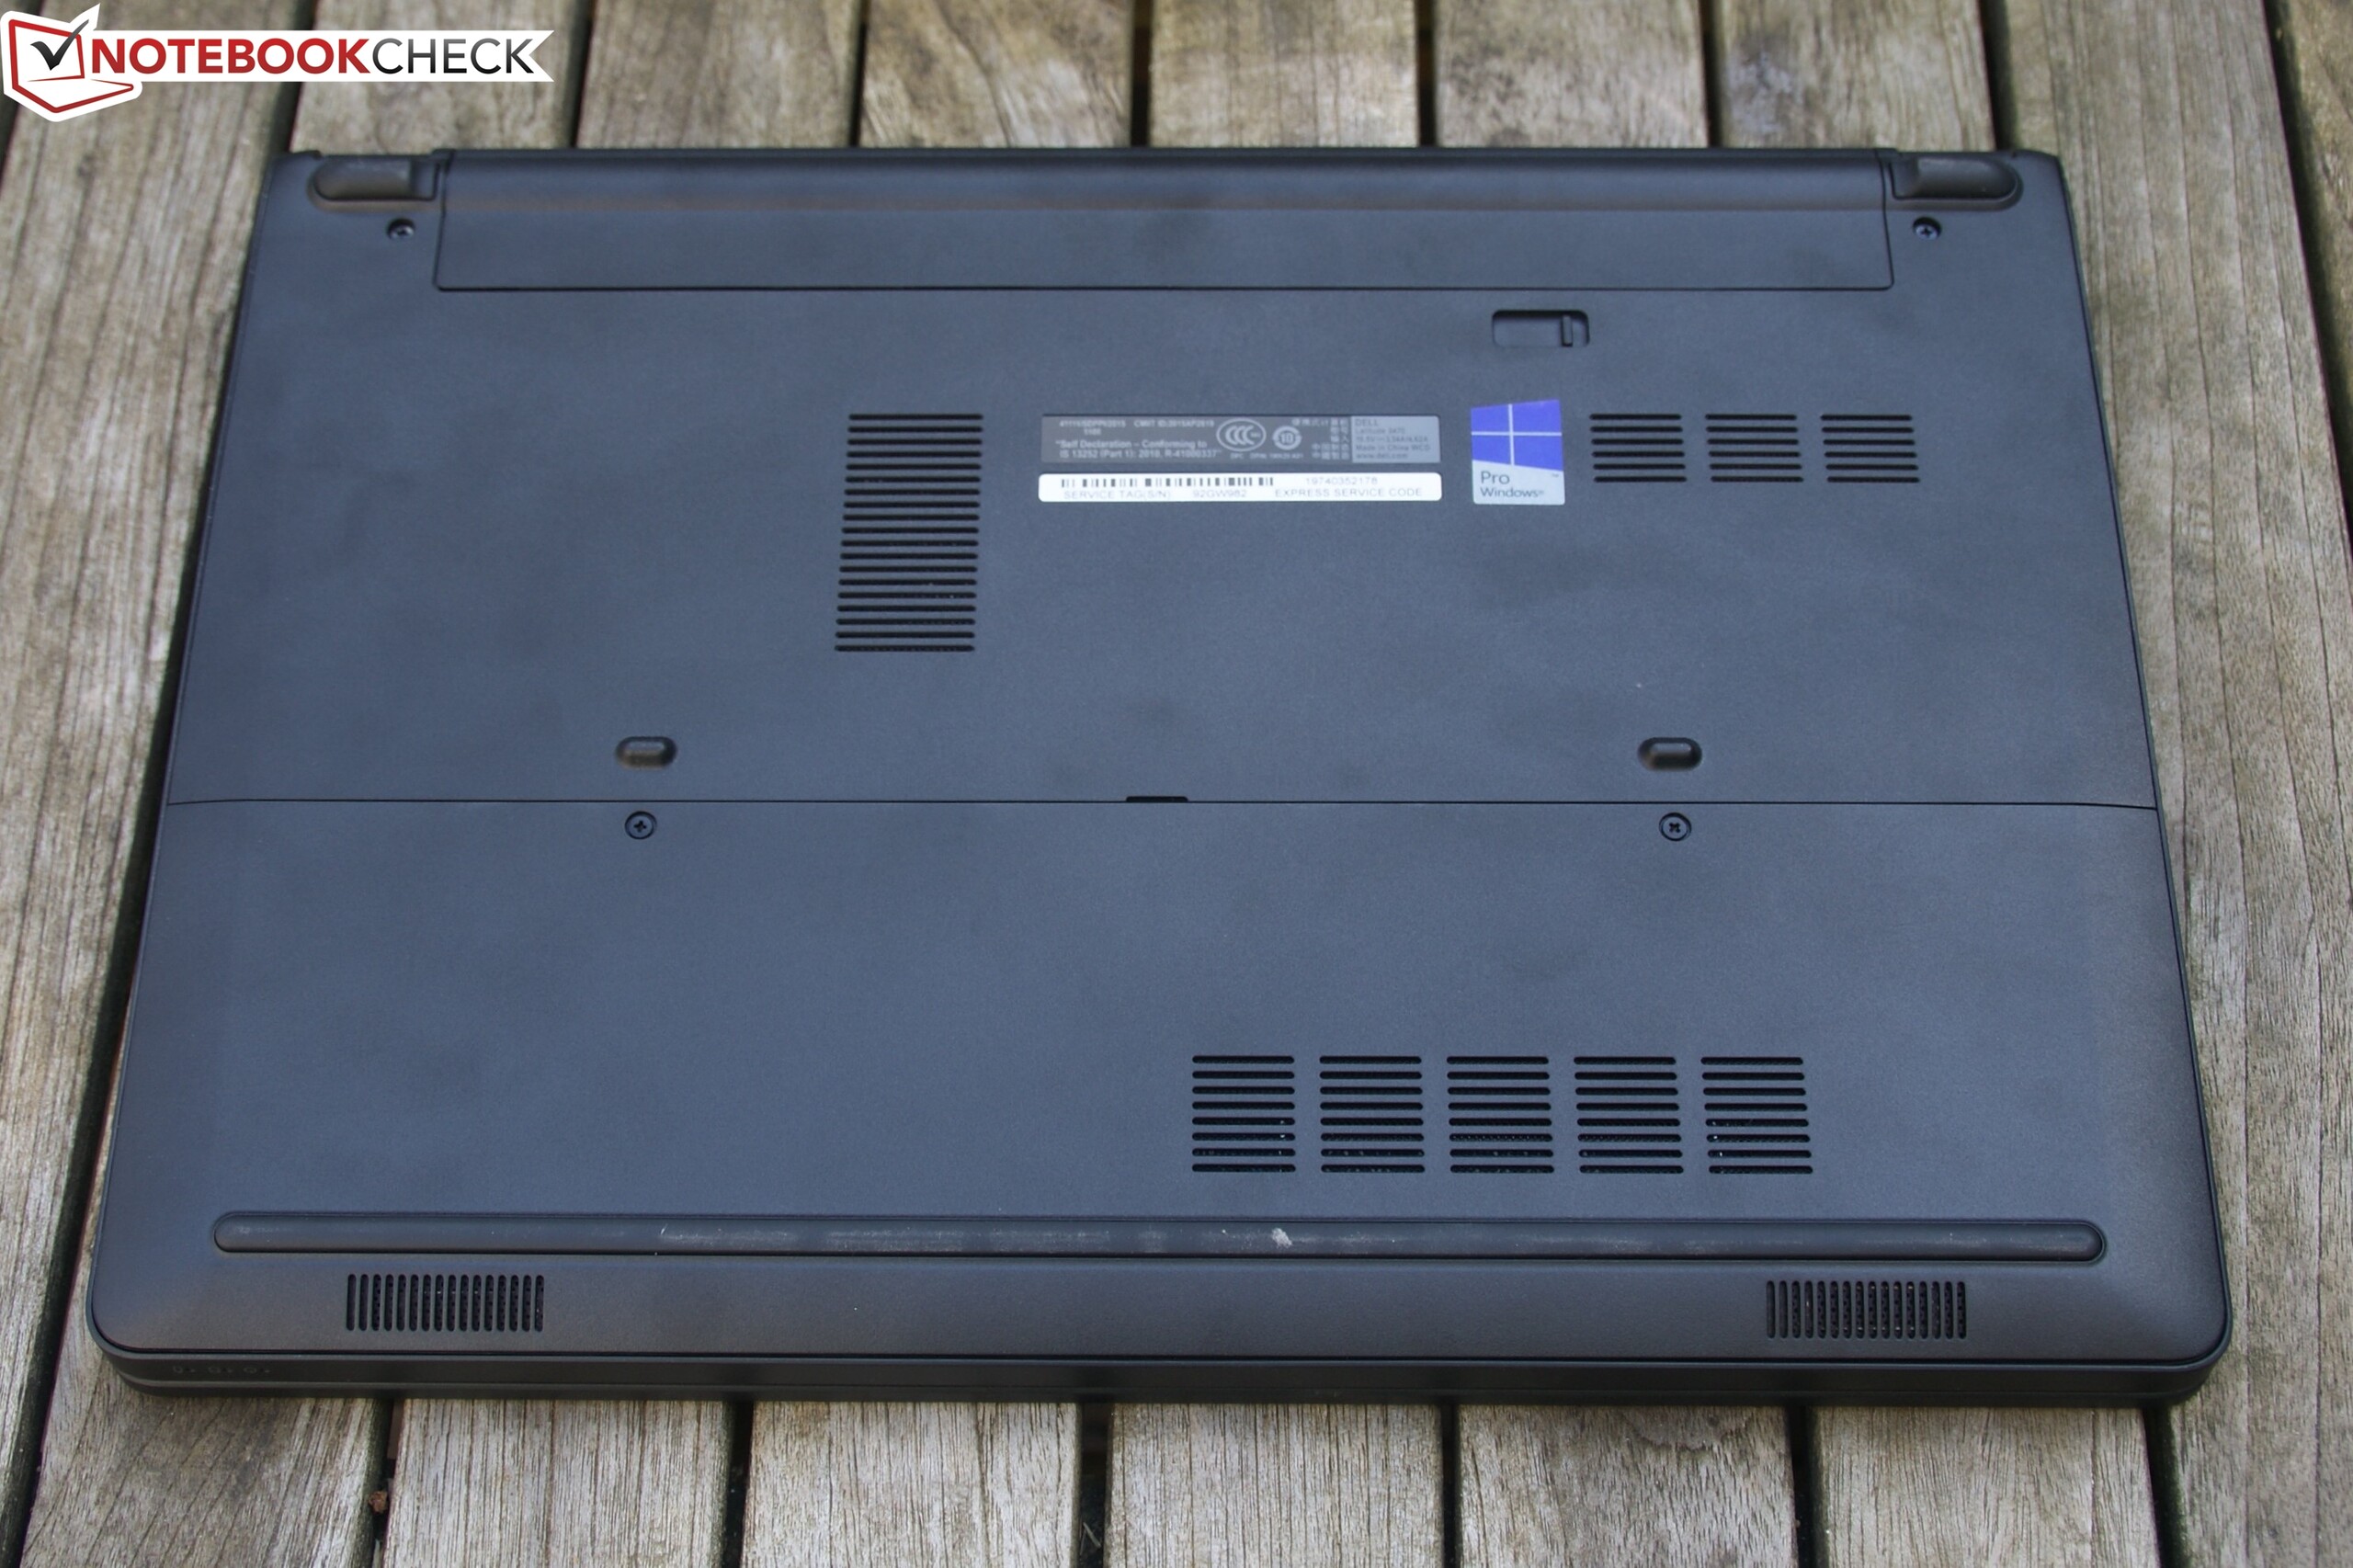
(+) The maximum temperature on the upper side is 38.9 °C / 102 F, compared to the average of 34.3 °C / 94 F, ranging from 21.2 to 62.5 °C for the class Office.
(+) The bottom heats up to a maximum of 37.7 °C / 100 F, compared to the average of 36.8 °C / 98 F
(±) In idle usage, the average temperature for the upper side is 32.1 °C / 90 F, compared to the device average of 29.5 °C / 85 F.
(+) The palmrests and touchpad are reaching skin temperature as a maximum (34.4 °C / 93.9 F) and are therefore not hot.
(-) The average temperature of the palmrest area of similar devices was 27.5 °C / 81.5 F (-6.9 °C / -12.4 F).
| Off / Standby | |
| Idle | |
| Load |
|
Key:
min: | |
| Dell Latitude 14 3470 6100U, HD Graphics 520, Toshiba MQ01ACF050, TN LED, 1366x768, 14" | Lenovo ThinkPad L460-20FVS01400 6500U, Radeon R5 M330, Toshiba HG6 THNSFJ256GCSU, IPS, 1920x1080, 14" | Lenovo ThinkPad E460-20EUS00000 6200U, Radeon R7 M360, Samsung CM871 MZ7LF192HCGS, IPS-Panel, 1920x1080, 14" | HP ProBook 440 G3 6200U, HD Graphics 520, Hitachi Travelstar Z7K500 HTS725050A7E630, TN, 1920x1080, 14" | |
|---|---|---|---|---|
| Power Consumption | -7% | -23% | -9% | |
| Idle Minimum * (Watt) | 5 | 3.1 38% | 4.1 18% | 5.2 -4% |
| Idle Average * (Watt) | 6.8 | 6.3 7% | 8 -18% | 8.2 -21% |
| Idle Maximum * (Watt) | 8.9 | 7.9 11% | 8.9 -0% | 9 -1% |
| Load Average * (Watt) | 26.2 | 29.5 -13% | 39.3 -50% | 28.8 -10% |
| Load Maximum * (Watt) | 31.8 | 57.3 -80% | 52.2 -64% | 34 -7% |
* ... smaller is better
| Dell Latitude 14 3470 6100U, HD Graphics 520, 41 Wh | Lenovo ThinkPad L460-20FVS01400 6500U, Radeon R5 M330, 48 Wh | HP ProBook 440 G3 6200U, HD Graphics 520, 44 Wh | Lenovo ThinkPad E460-20EUS00000 6200U, Radeon R7 M360, 47 Wh | |
|---|---|---|---|---|
| Battery runtime | 32% | -13% | 0% | |
| Reader / Idle (h) | 11.1 | 19.2 73% | 9 -19% | 12.3 11% |
| WiFi v1.3 (h) | 4.6 | 7.1 54% | 4.9 7% | 4.9 7% |
| Load (h) | 2.3 | 1.6 -30% | 1.7 -26% | 1.9 -17% |
| H.264 (h) | 7.2 | 5.4 | 7.1 |
Pros
Cons
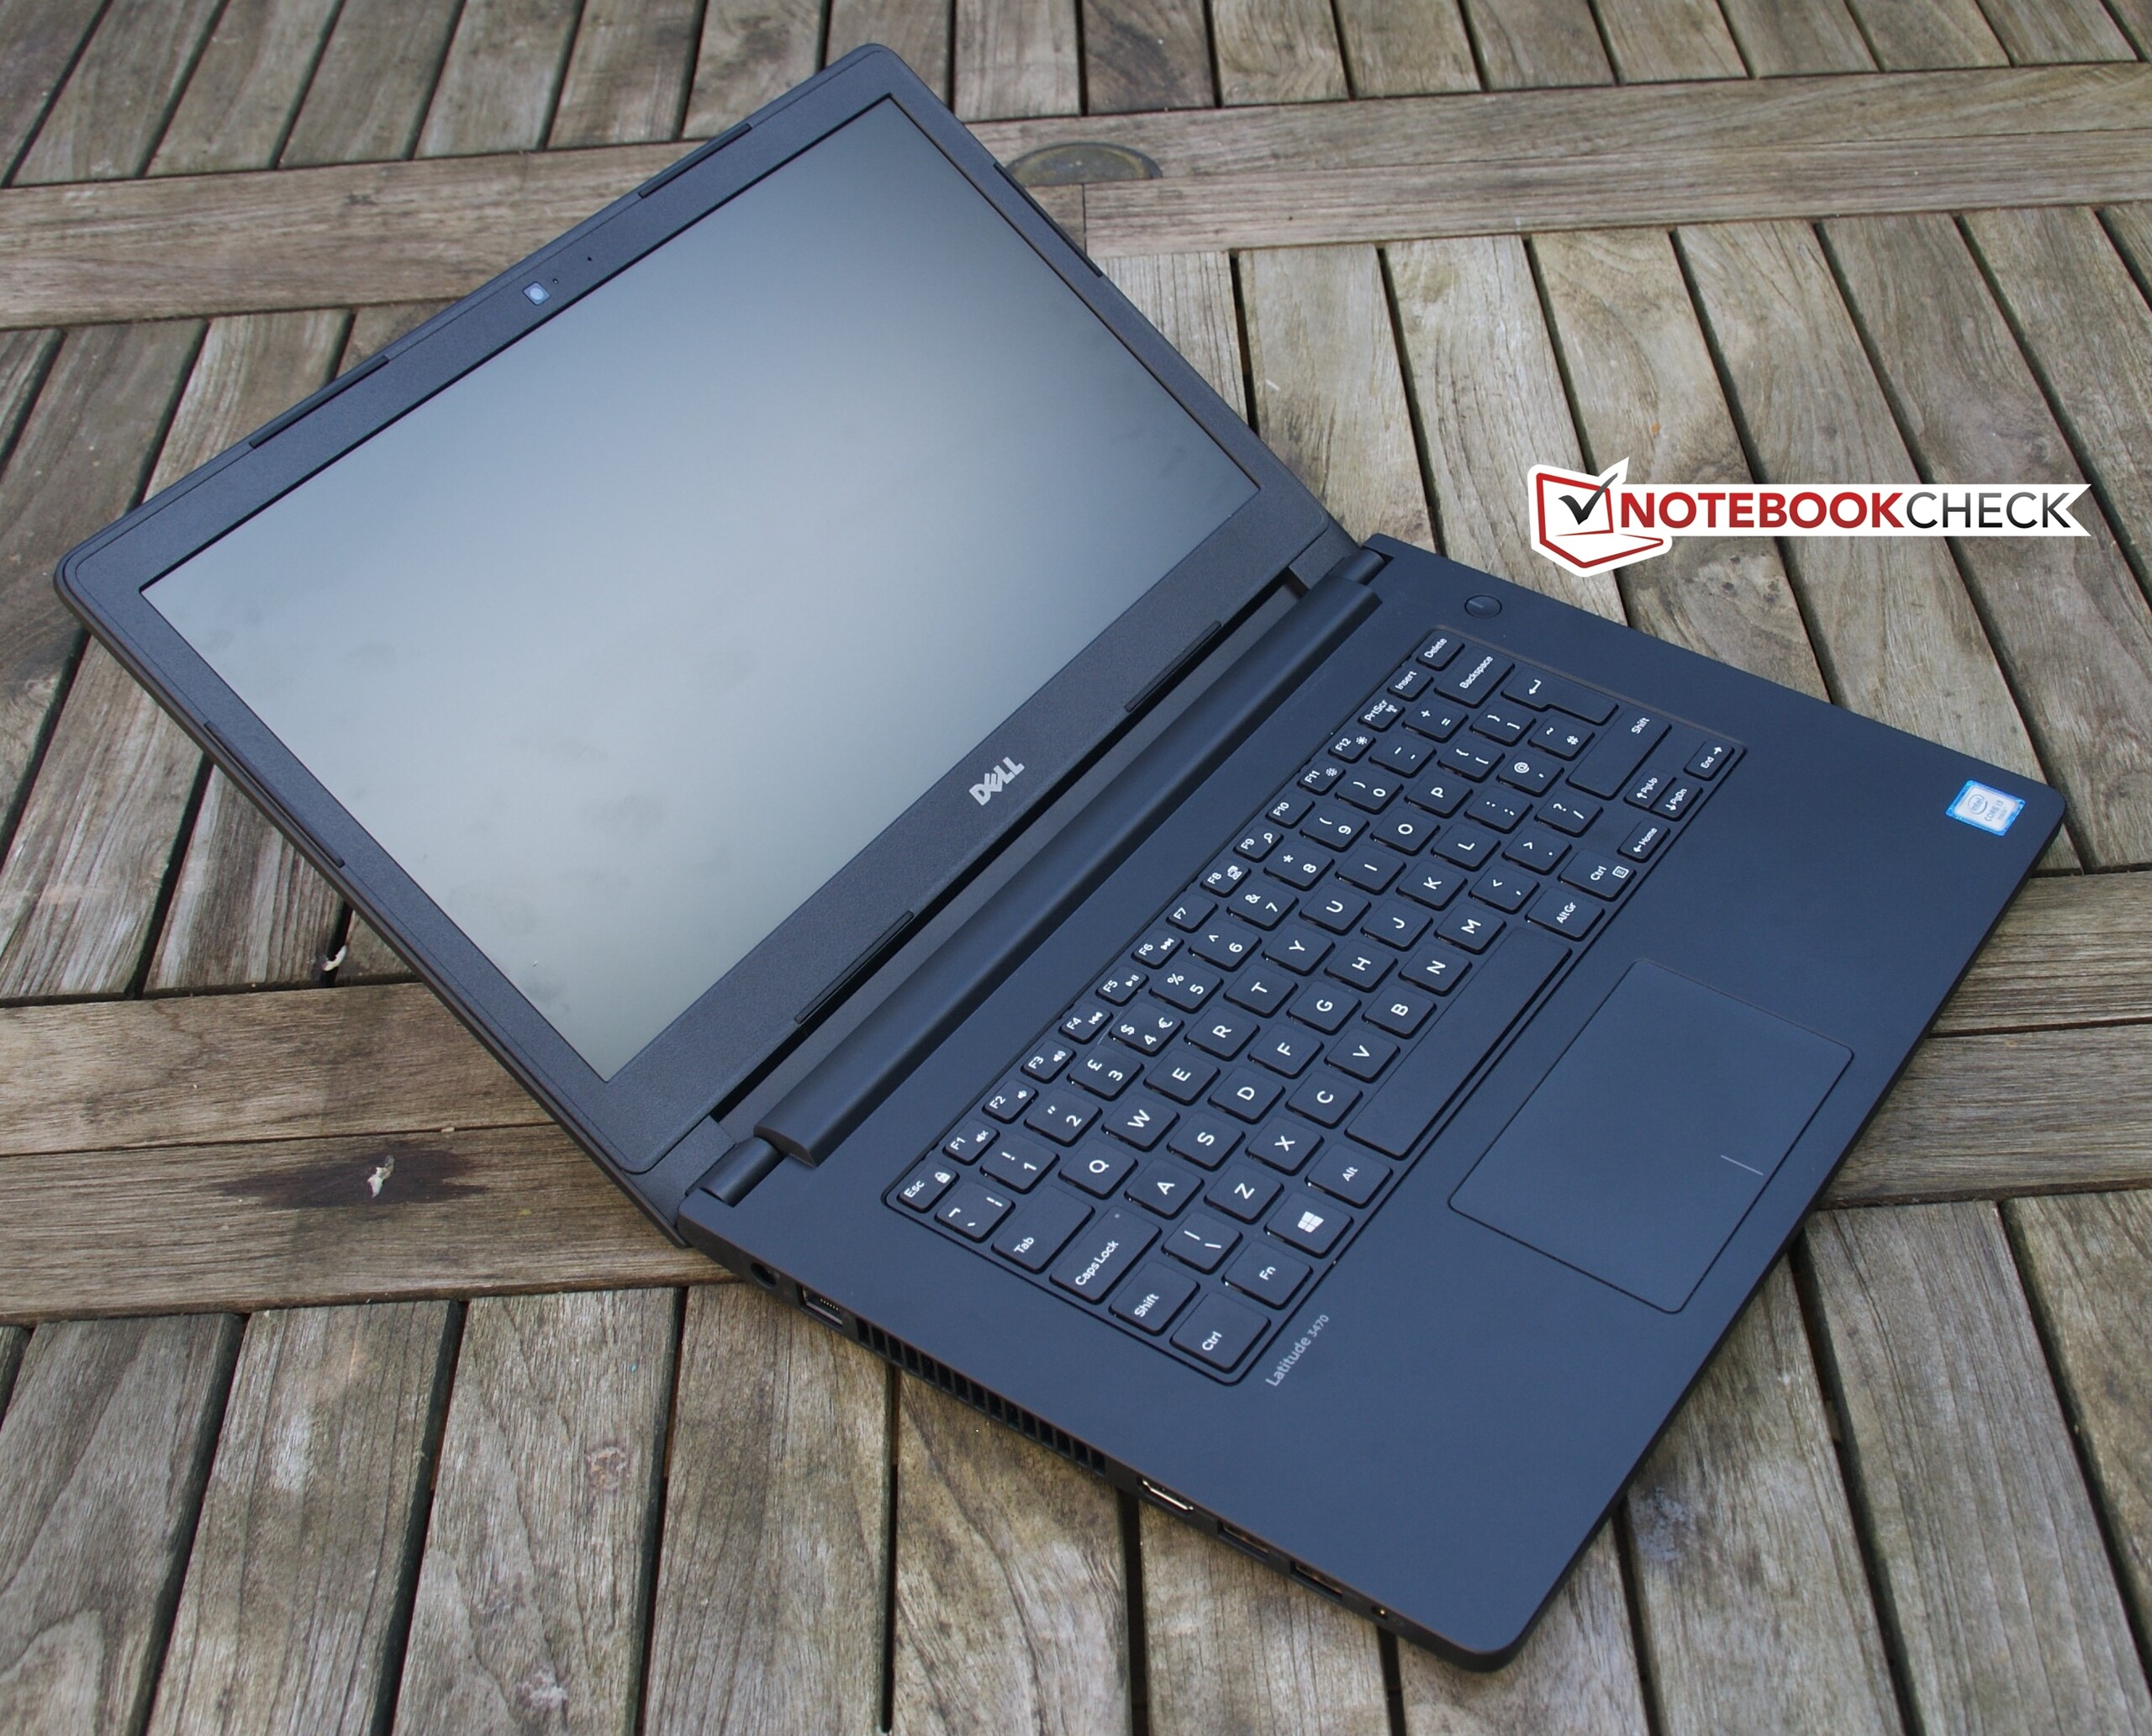
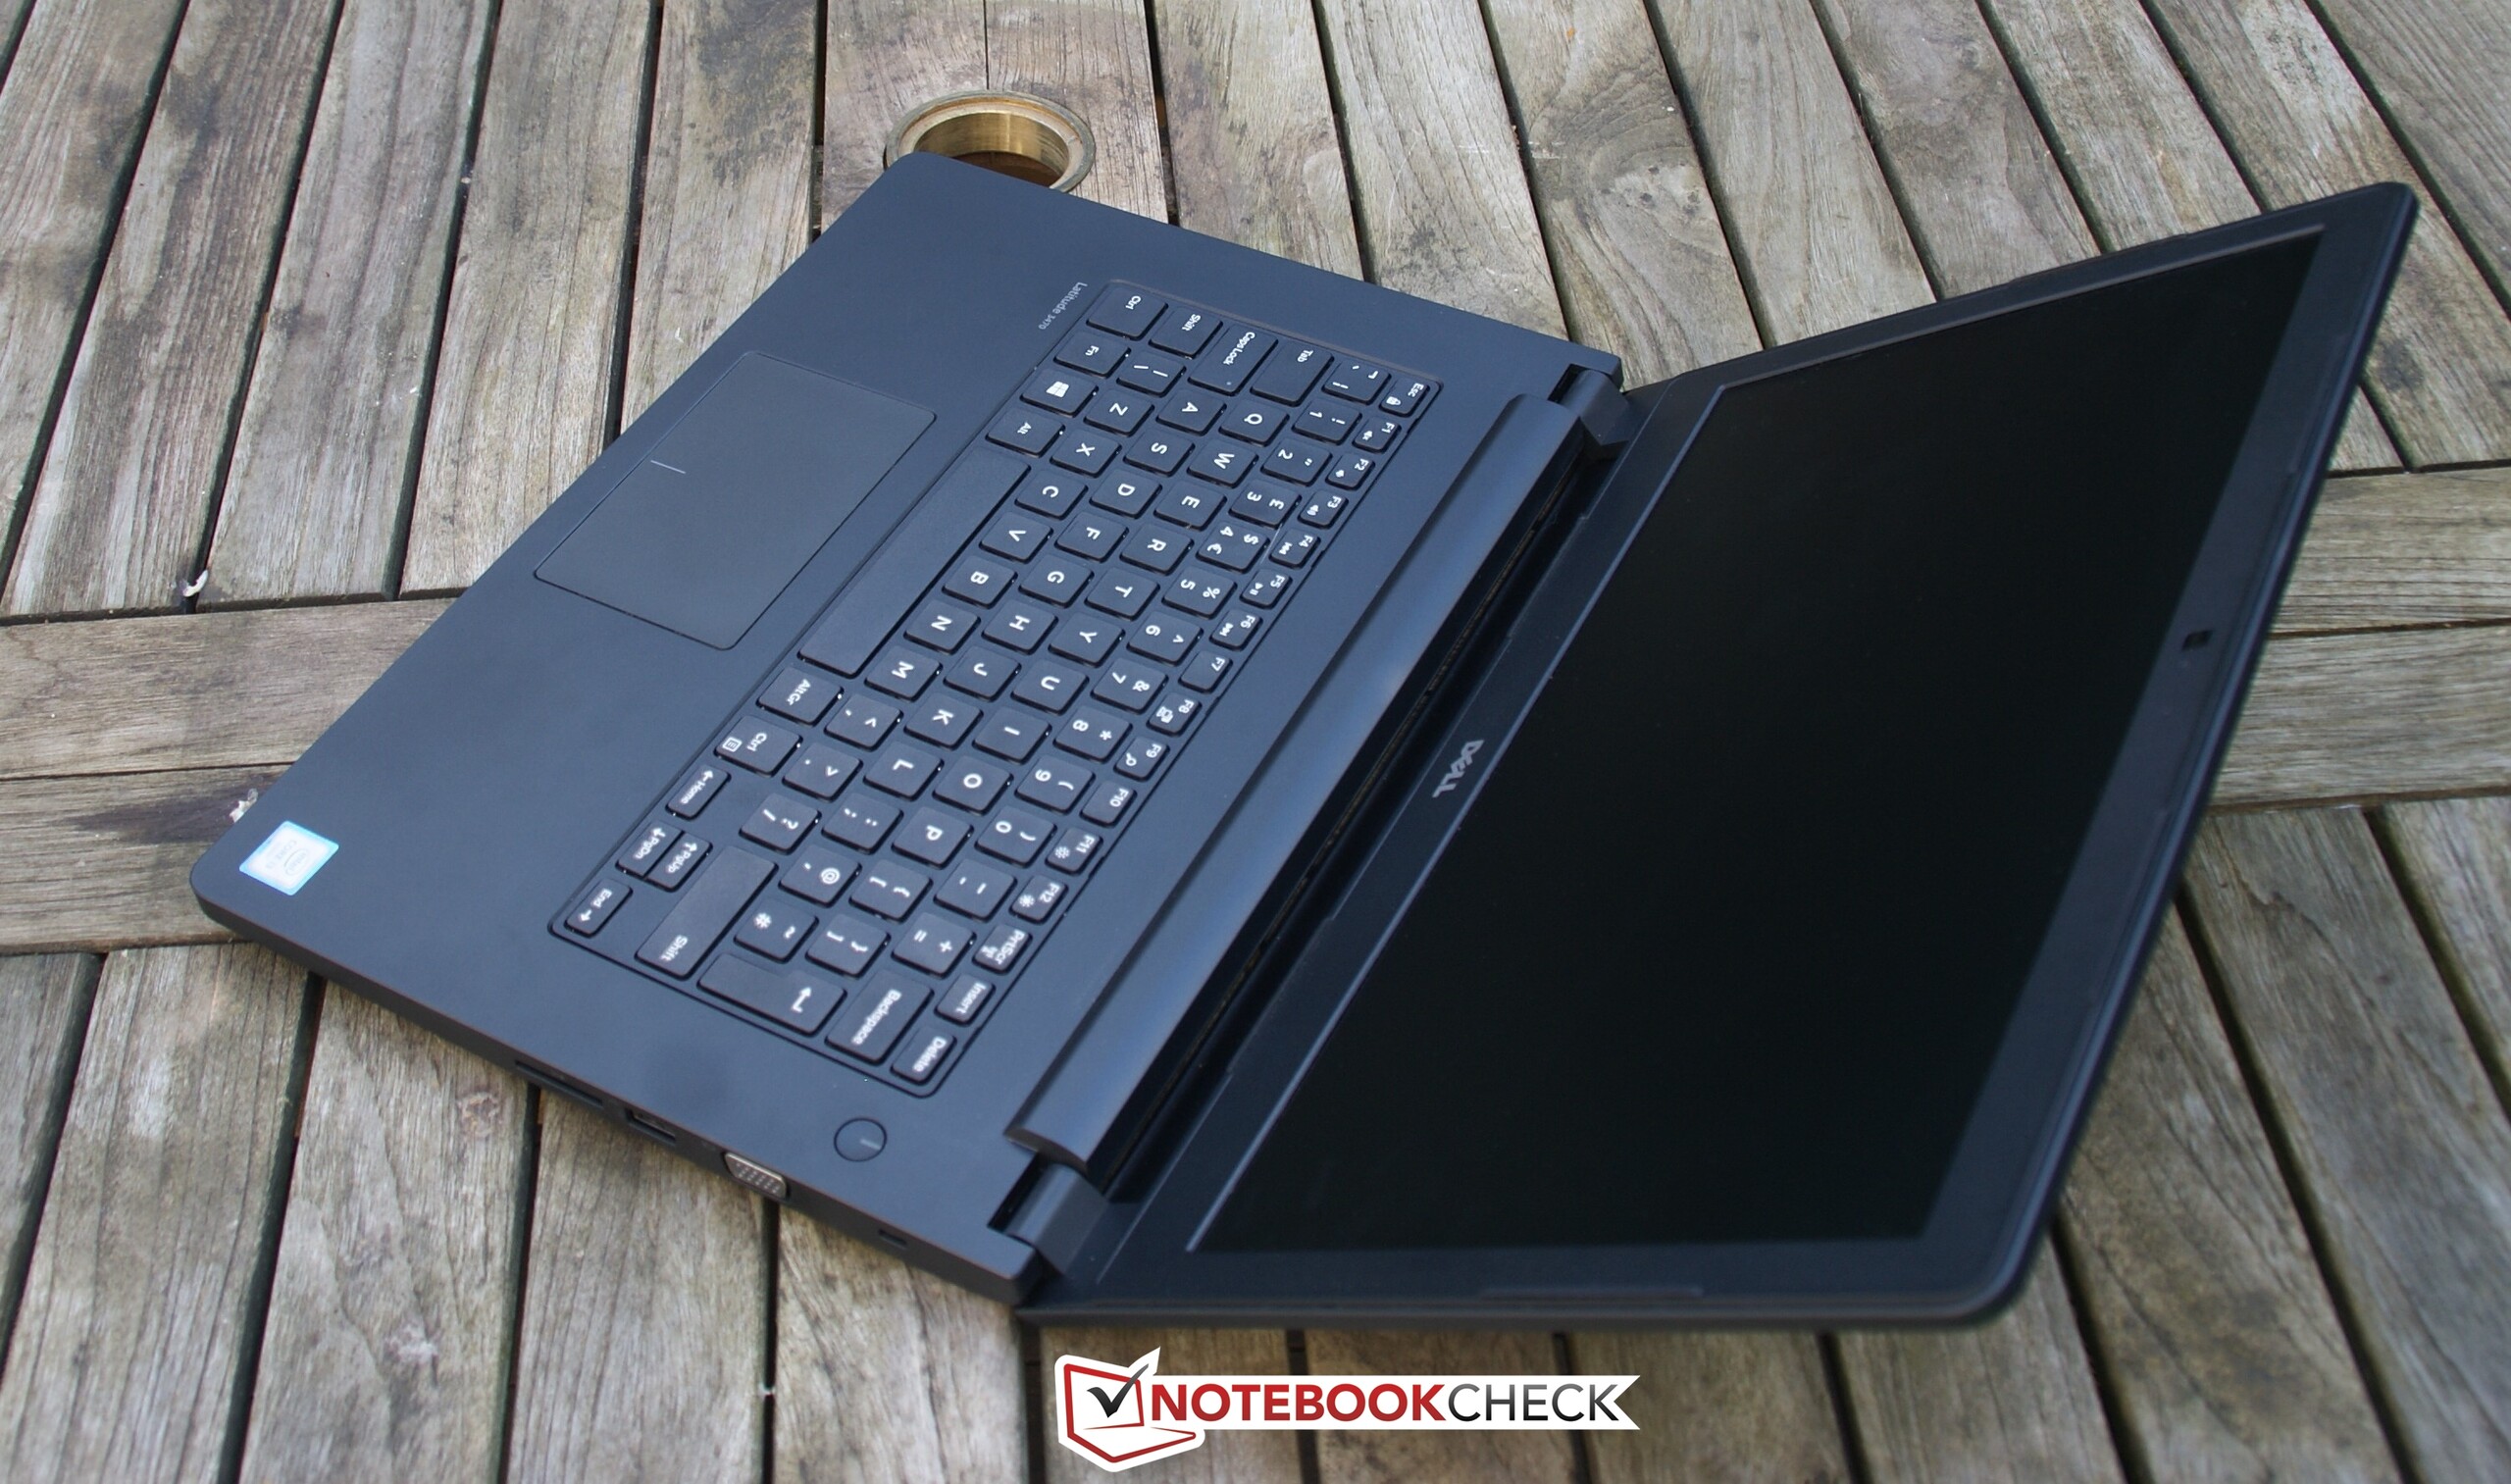
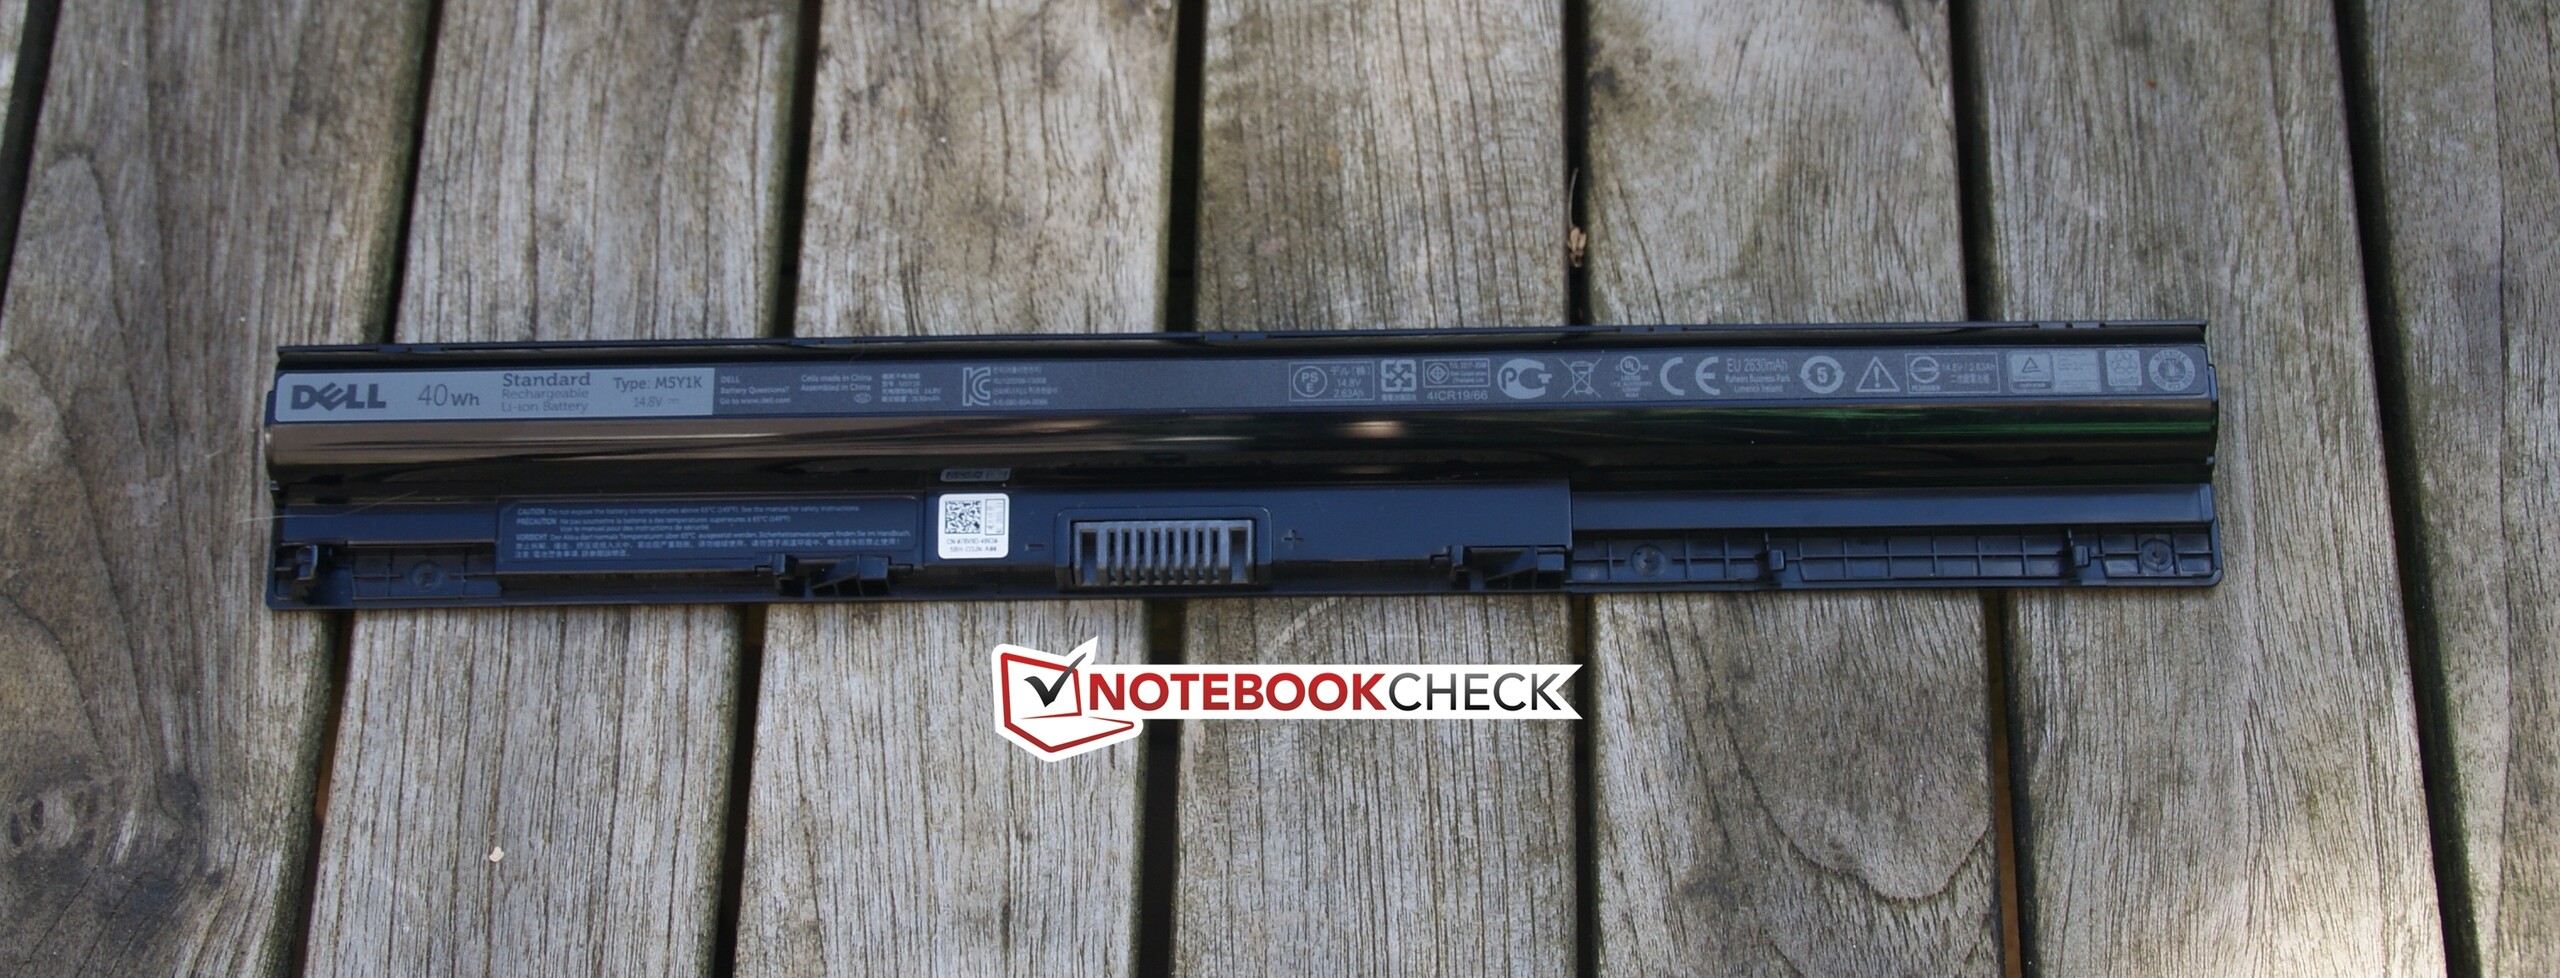
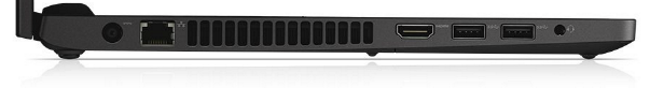
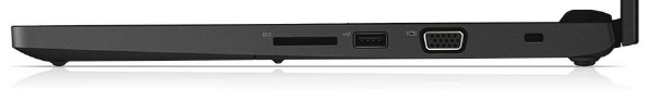
我们希望从它的一些优势开始总结:Latitude 3470的屏幕搭配了磨砂表面,它的电池可以更换,同时接口配备在这个尺寸上也十分合理。它的键盘,尽管和更贵的Latitude无法相比,但也相比同价位的消费级产品更好。最后它的屏幕上盖和掌托采用了柔软的胶质表面,手感十分舒适。
遗憾的是,尽管它在细节上有不少优势。但由于戴尔为它的定位是以低价吸引用户。在很多方面它都节省了成本:它的散热系统不够有效,风扇几乎一直在旋转而设备依然会变得很热。戴尔也为它搭配了一个较慢的读卡器,卡槽也太浅不适合长期把卡放置其中。它的屏幕搭配了磨砂表面,而其他方面的表现则让人感到遗憾。它的商务功能也不是很让人满意:用户无法得到商务设备常见的指点杆、拓展坞接口和智能卡槽。
戴尔Latitude 3470表现优秀,而究竟是在哪方面呢?可能主要还是售价。除此之外,这台Latiude无法提供竞争对手惠普和联想所带来的丰富功能,同时它的部件选择对于德国境内的个人用户也十分有限。
综合考虑下我们无法推荐3470,除非你真的需要一台如此低价的商务系统。这台测试机的功能性无法和同类设备相提并论,当然它们的售价也更高。
注:本文是基于完整评测的缩减版本,阅读完整的英文评测,请点击这里。
Dell Latitude 14 3470
- 09/13/2016 v5.1 (old)
Benjamin Herzig
Price comparison
